australian influenza surveillance …file/ozflu-no18-2009.pdfaustralian influenza surveillance...
TRANSCRIPT
AUSTRALIAN INFLUENZA SURVEILLANCE
REPORT
No.18, 2009, REPORTING PERIOD: 5 September 2009 – 11 September 2009
Key Indicators
The counting of every case of pandemic influenza is no longer feasible in the PROTECT phase. Influenza activity and severity in community is instead monitored by the surveillance systems listed below.
Is the situation changing?
Indicated by: laboratory confirmed cases reported to NetEpi/NNDSS; GP Sentinel ILI Surveillance; and ED presentations of ILI at sentinel hospitals (NSW and WA). Laboratory data are used to determine the proportion of pandemic (H1N1) 2009 circulating in the community.
How severe is the disease, and is severity changing?
Indicated by: number of hospitalisations, ICU admissions and deaths from sentinel hospital surveillance; emergence of more severe clinical picture in hospitalised cases and ICU admissions.
Is the virus changing? Indicated by: emergence of drug resistance or gene drift/shift from laboratory surveillance.
What is ahead? Forward projections of cases, morbidity and mortality.
Key Points Is the situation changing? • As of 11 September 2009 there were 36,028 confirmed cases of pandemic (H1N1) 2009 in Australia.
The number of cases reported represents a small proportion of pandemic (H1N1) 2009 cases which have occurred in the community.
• Overall, current national influenza continues to decrease. Most jurisdictions have reported that pandemic
(H1N1) 2009 activity has peaked and is decreasing. o ILI presentations to General Practitioners have remained steady or decreased in most states and
territories with NSW reporting a slight increase. At a national level, rates are below levels seen at the same time in 2007 and 2008.
o ILI presentations to emergency departments decreased across all reporting systems this reporting period.
o Absenteeism rates increased in the last week to levels similar to those seen at the same time in 2007.
• Type A influenza is the predominant seasonal influenza type reported by all jurisdictions. The
pandemic strain has almost replaced the current seasonal H1N1 virus. For this reporting period, the number of respiratory tests has decreased. The proportion of influenza positive tests that were pandemic (H1N1) 2009 decreased for this reporting period, with an average proportion of 91%. Of the seasonal influenza A notifications, A/H3N2 is the predominant subtype reported by most jurisdictions.
How severe is the disease? • The number of people with pandemic (H1N1) 2009 requiring hospitalisation continues to decrease. In the
week ending on 11 September 2009 there were 94 new hospitalisations. In total, 4,642 people have been hospitalised. The overall hospitalisation rate is 16.1 per 100,000 population with the highest rates in children aged less than 5 years of age (50.1 for males and 37.8 for females per 100,000 population).
Page 1
Page 2
• Due to the presence of underlying chronic disease, some of which is undiagnosed, and their higher level of
social disadvantage, Indigenous Australians are vulnerable to complications from the pandemic (H1N1) 2009 virus. Indigenous Australians are approximately 8 times more likely than non-Indigenous Australians to be hospitalised for pandemic (H1N1) 2009. In total, 687 (15%) hospitalisations have been Indigenous Australians.
• About 5% of hospitalised cases have been reported as pregnant, reinforcing the fact that pregnancy,
particularly in the second and third trimesters, is a risk factor for hospitalisation with pandemic (H1N1) 2009.
• Since reporting began, the Australian Paediatric Surveillance Unit (APSU) has reported a total of 115
notifications of children hospitalised with severe complications of influenza. 58% had no underlying medical conditions.
• The percentage of hospitalised cases who have been admitted to an ICU since the beginning of the
outbreak is available for two States: 19% in New South Wales and 15% in Queensland. • As of 11 September 2009, the number of deaths associated with pandemic (H1N1) 2009 was 169. Of these
deaths, four were pregnant women and 20 (12%) were Indigenous. • The median age of confirmed cases that died is 53 years (range 2-92 years of age), compared to the
median age for deaths from seasonal flu from 2001 to 2006 which is 83 years. • Reports from the Australian jurisdictions indicate that most of the deaths had underlying medical conditions
including cancer, diabetes mellitus and morbid obesity. Is the virus changing? • Australia has detected, for the first time, a virus sample of pandemic (H1N1) 2009 which is oseltamavir-
resistant. The resistant strain was found in a 28 year old male who is a renal transplant patient. He initially responded to oseltamivir but later developed a resistant strain of the virus. There is no evidence of spread to any close contacts. None of the 249 pandemic (H1N1) 2009 viral isolates tested at the WHO Collaborating Centre for Reference and Research on Influenza in NA enzyme inhibition assay were resistant to oseltamivir or zanamivir.
• To date, the WHO has received formal notification of 21 cases of oseltamivir resistance pandemic (H1N1) 2009 viruses worldwide.
What is ahead? • With a 20% clinical attack rate and no intervention; it has been estimated that by the end of winter 1 in 5
Australian (4.3 million) could become infected with the pandemic virus, leading to 80,000 hospitalisations and 6,000 deaths. Currently the number of hospitalisations and deaths are tracking below these estimations.
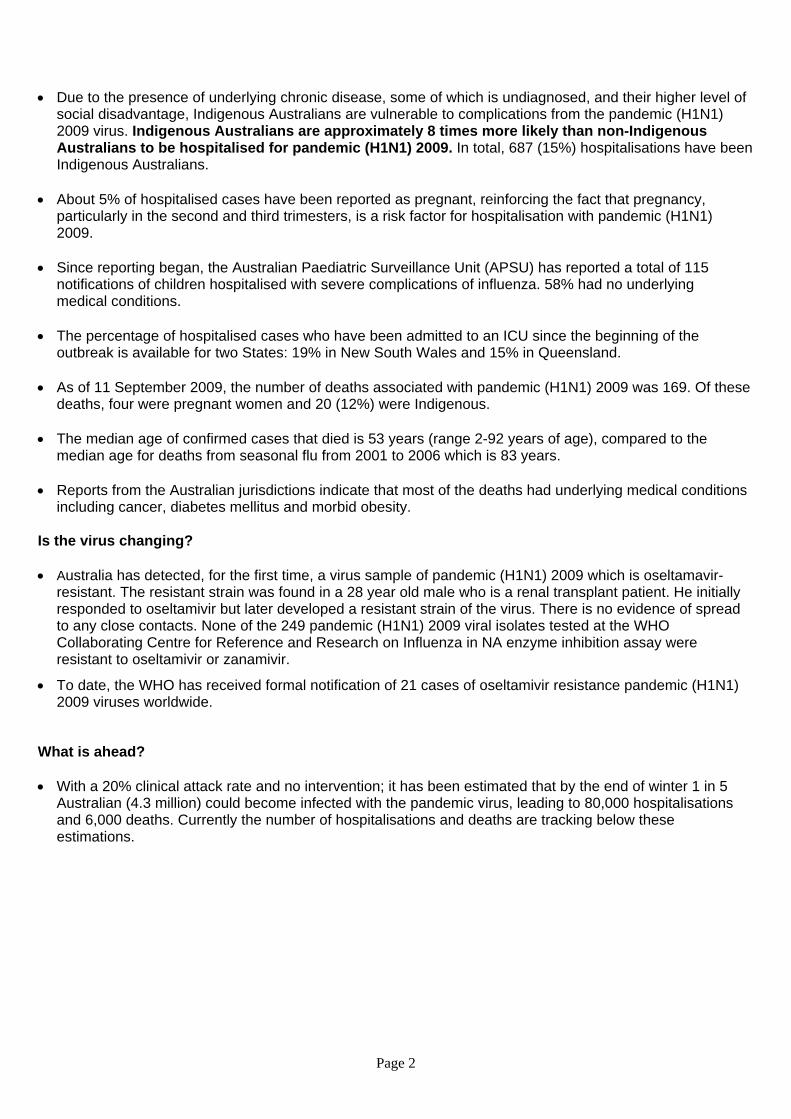
1. Current influenza activity in Australia – Is the situation changing? Notifications of confirmed pandemic (H1N1) 2009 and seasonal influenza The number of new notifications of laboratory confirmed pandemic (H1N1) 2009 this reporting period was 885. As of 11 September 2009 there were 36,028 confirmed cases of pandemic (H1N1) 2009 in Australia, including 169 deaths. The number of new notifications of laboratory confirmed pandemic (H1N1) 2009 have decreased nationally over the past few weeks. The number of cases reported represents only a small proportion of pandemic (H1N1) 2009 circulating in the community. The national epidemic curve shows the jurisdictional distribution of confirmed cases of pandemic (H1N1) 2009 over time in Australia (Figure 1). Figure 1. Laboratory confirmed cases of pandemic (H1N1) 2009 in Australia, to 11 September 2009 by jurisdiction
0
200
400
600
800
1000
1200
1400
4/05/0
9
9/05/0
9
14/05
/09
19/05
/09
24/05
/09
29/05
/09
3/06/0
9
8/06/0
9
13/06
/09
18/06
/09
23/06
/09
28/06
/09
3/07/0
9
8/07/0
9
13/07
/09
18/07
/09
23/07
/09
28/07
/09
2/08/0
9
7/08/0
9
12/08
/09
17/08
/09
22/08
/09
27/08
/09
1/09/0
9
6/09/0
9
11/09
/09
Date of onset, notification or detection
Conf
irmed
cas
es o
f pan
dem
ic (H
1N1)
200
9 WA
VIC
TAS
SA
QLD
NT
NSW
ACT
VIC moved to modified SUSTAIN phase
AUS phase PROTECT
Source: NetEPI database
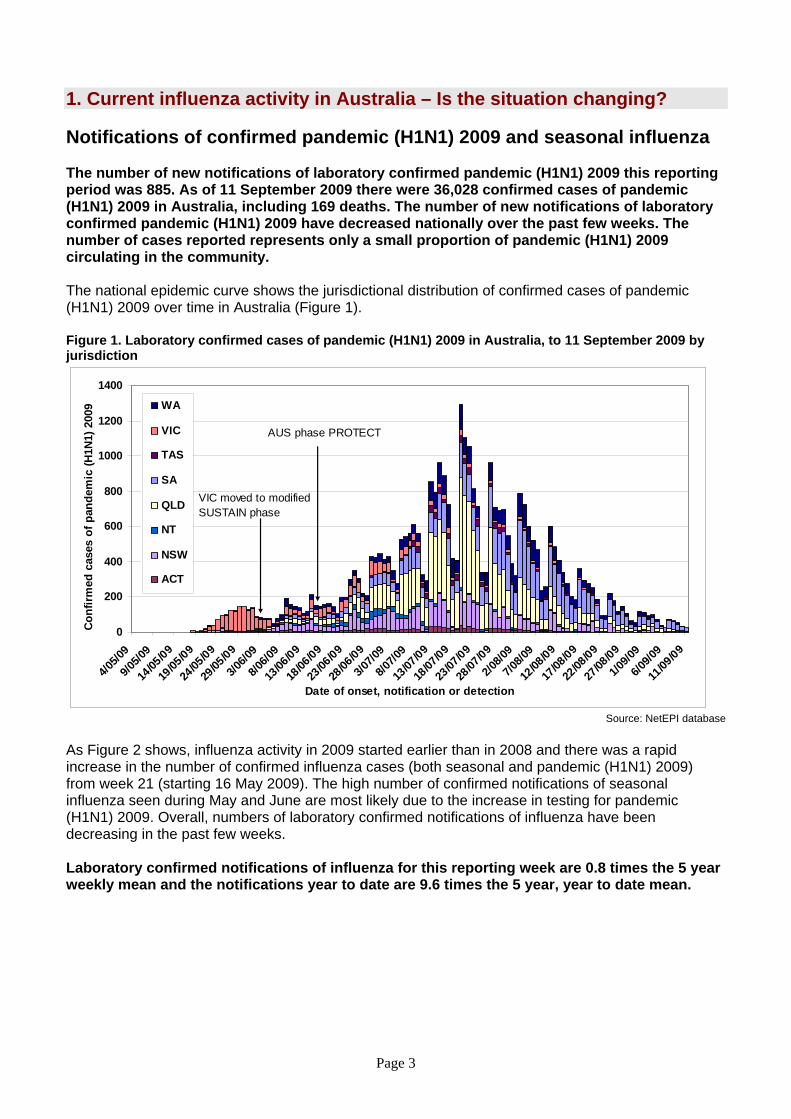
As Figure 2 shows, influenza activity in 2009 started earlier than in 2008 and there was a rapid increase in the number of confirmed influenza cases (both seasonal and pandemic (H1N1) 2009) from week 21 (starting 16 May 2009). The high number of confirmed notifications of seasonal influenza seen during May and June are most likely due to the increase in testing for pandemic (H1N1) 2009. Overall, numbers of laboratory confirmed notifications of influenza have been decreasing in the past few weeks. Laboratory confirmed notifications of influenza for this reporting week are 0.8 times the 5 year weekly mean and the notifications year to date are 9.6 times the 5 year, year to date mean.
Page 3
Figure 2. Influenza activity in Australia, by reporting week, years 2007, 2008 and 2009*
0
1000
2000
3000
4000
5000
6000
7000
8000
9000
2007 2008 2009Week of onset, notification or detection
Con
firm
ed in
fluen
za c
ases
Pandemic (H1N1) 2009 (NetEPI)Seasonal flu (NNDSS)Influenza Type A (NNDSS)Seasonal influenza (untyped) (NNDSS)Seasonal influenza (B, H1N1, H3N2) (NNDSS)
* Data on pandemic (H1N1) 2001 cases is extracted from NetEPI; data on seasonal influenza is extracted from the NNDSS.
Sources: NNDSS and NetEPI databases On 17 June 2009 Australia commenced the transition to a new response phase called PROTECT, in which laboratory testing is directed towards people with moderate or severe illness; those more vulnerable to severe illness; and those in institutional settings. This means that the number of confirmed cases does not reflect how many people in the community have acquired pandemic (H1N1) 2009 infection. As the counting of every case is no longer feasible in the PROTECT phase, influenza activity, including Influenza Like Illness (ILI) activity in the community, is instead monitored by surveillance systems including:
• GP Sentinel ILI surveillance; • Emergency Department presentations of ILI at sentinel hospitals (NSW and WA); and • Absenteeism rates.
Laboratory data are used to determine the proportion of pandemic (H1N1) 2009 circulating in the community.
Page 4
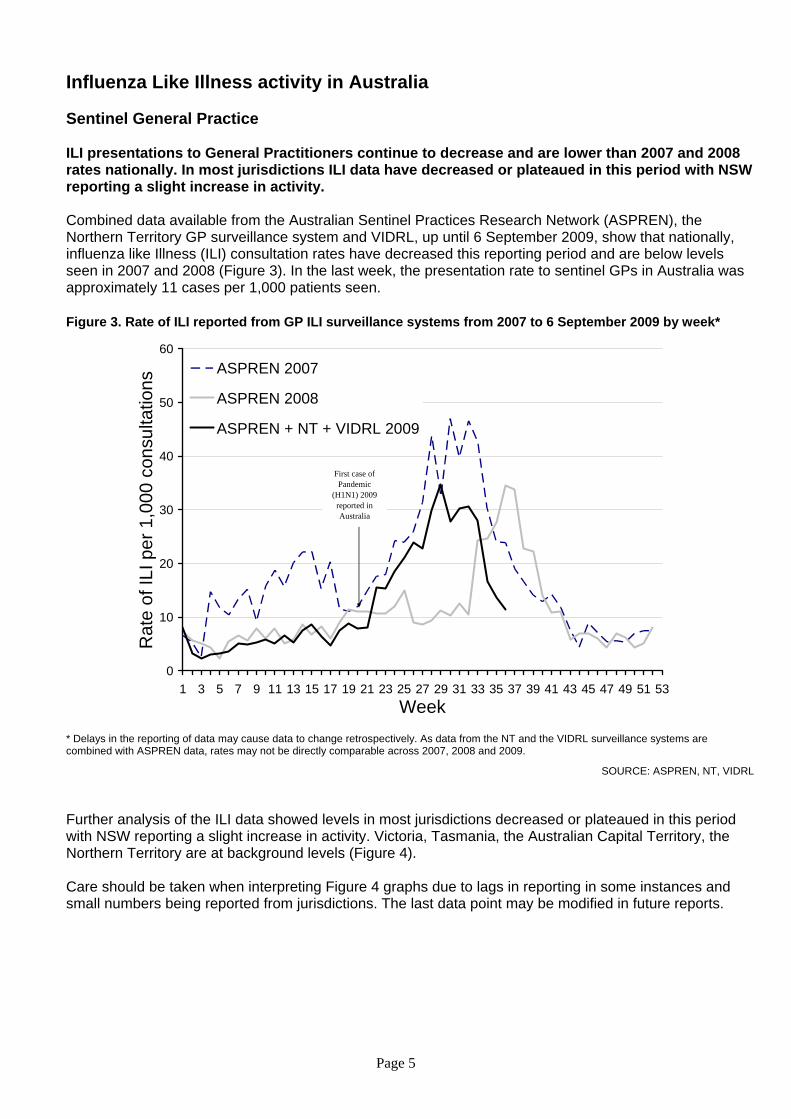
Influenza Like Illness activity in Australia Sentinel General Practice ILI presentations to General Practitioners continue to decrease and are lower than 2007 and 2008 rates nationally. In most jurisdictions ILI data have decreased or plateaued in this period with NSW reporting a slight increase in activity. Combined data available from the Australian Sentinel Practices Research Network (ASPREN), the Northern Territory GP surveillance system and VIDRL, up until 6 September 2009, show that nationally, influenza like Illness (ILI) consultation rates have decreased this reporting period and are below levels seen in 2007 and 2008 (Figure 3). In the last week, the presentation rate to sentinel GPs in Australia was approximately 11 cases per 1,000 patients seen.
Figure 3. Rate of ILI reported from GP ILI surveillance systems from 2007 to 6 September 2009 by week*
0
10
20
30
40
50
60
1 3 5 7 9 11 13 15 17 19 21 23 25 27 29 31 33 35 37 39 41 43 45 47 49 51 53Week
Rat
e of
ILI p
er 1
,000
con
sulta
tions
ASPREN 2007
ASPREN 2008
ASPREN + NT + VIDRL 2009
First case of Pandemic
(H1N1) 2009 reported in Australia
* Delays in the reporting of data may cause data to change retrospectively. As data from the NT and the VIDRL surveillance systems are combined with ASPREN data, rates may not be directly comparable across 2007, 2008 and 2009.
SOURCE: ASPREN, NT, VIDRL Further analysis of the ILI data showed levels in most jurisdictions decreased or plateaued in this period with NSW reporting a slight increase in activity. Victoria, Tasmania, the Australian Capital Territory, the Northern Territory are at background levels (Figure 4). Care should be taken when interpreting Figure 4 graphs due to lags in reporting in some instances and small numbers being reported from jurisdictions. The last data point may be modified in future reports.
Page 5
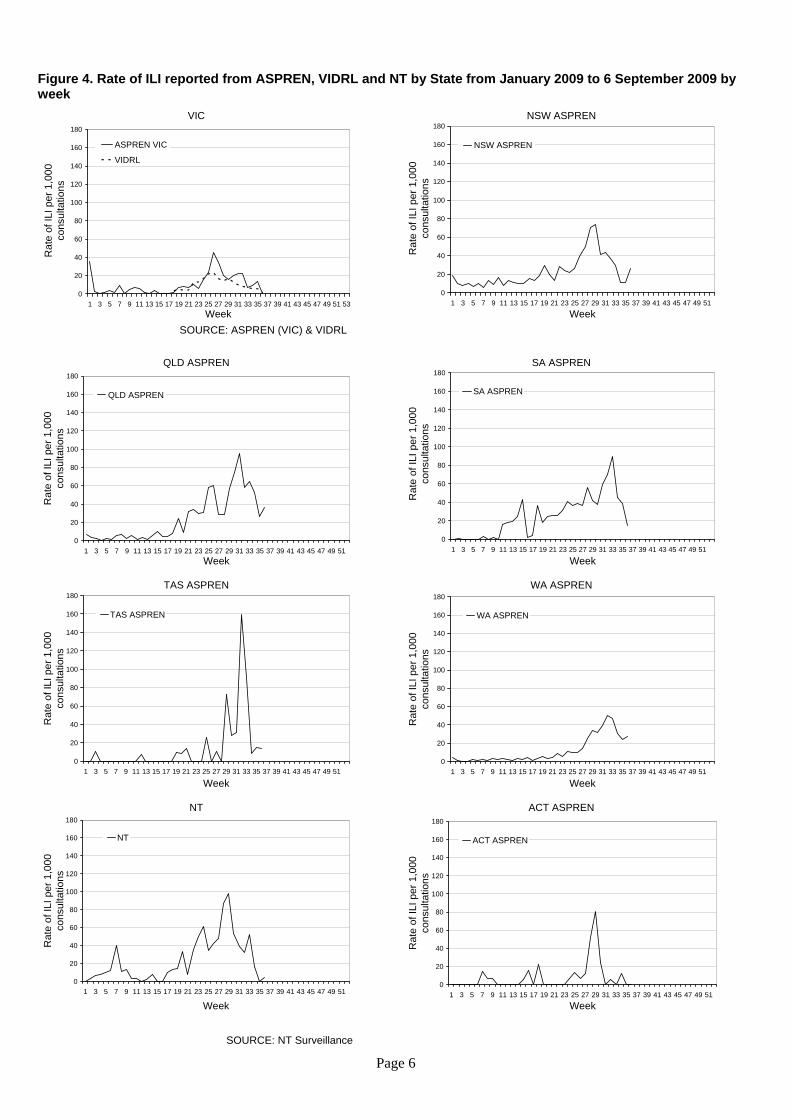
Figure 4. Rate of ILI reported from ASPREN, VIDRL and NT by State from January 2009 to 6 September 2009 by week
VIC
0
20
40
60
80
100
120
140
160
180
1 3 5 7 9 11 13 15 17 19 21 23 25 27 29 31 33 35 37 39 41 43 45 47 49 51 53Week
Rat
e of
ILI p
er 1
,000
co
nsul
tatio
ns
ASPREN VIC
VIDRL
NSW ASPREN
0
20
40
60
80
100
120
140
160
180
1 3 5 7 9 11 13 15 17 19 21 23 25 27 29 31 33 35 37 39 41 43 45 47 49 51
Week
Rat
e of
ILI p
er 1
,000
co
nsul
tatio
ns
NSW ASPREN
SOURCE: ASPREN (VIC) & VIDRL
QLD ASPREN
0
20
40
60
80
100
120
140
160
180
1 3 5 7 9 11 13 15 17 19 21 23 25 27 29 31 33 35 37 39 41 43 45 47 49 51Week
Rat
e of
ILI p
er 1
,000
co
nsul
tatio
ns
QLD ASPREN
SA ASPREN
0
20
40
60
80
100
120
140
160
180
1 3 5 7 9 11 13 15 17 19 21 23 25 27 29 31 33 35 37 39 41 43 45 47 49 51
Week
Rat
e of
ILI p
er 1
,000
co
nsul
tatio
ns
SA ASPREN
TAS ASPREN
0
20
40
60
80
100
120
140
160
180
1 3 5 7 9 11 13 15 17 19 21 23 25 27 29 31 33 35 37 39 41 43 45 47 49 51
Week
Rat
e of
ILI p
er 1
,000
co
nsul
tatio
ns
TAS ASPREN
WA ASPREN
0
20
40
60
80
100
120
140
160
180
1 3 5 7 9 11 13 15 17 19 21 23 25 27 29 31 33 35 37 39 41 43 45 47 49 51
Week
Rat
e of
ILI p
er 1
,000
co
nsul
tatio
ns
WA ASPREN
NT
0
20
40
60
80
100
120
140
160
180
1 3 5 7 9 11 13 15 17 19 21 23 25 27 29 31 33 35 37 39 41 43 45 47 49 51
Week
Rat
e of
ILI p
er 1
,000
co
nsul
tatio
ns
NT
ACT ASPREN
0
20
40
60
80
100
120
140
160
180
1 3 5 7 9 11 13 15 17 19 21 23 25 27 29 31 33 35 37 39 41 43 45 47 49 51
Week
Rat
e of
ILI p
er 1
,000
co
nsul
tatio
ns
ACT ASPREN
SOURCE: NT Surveillance
Page 6
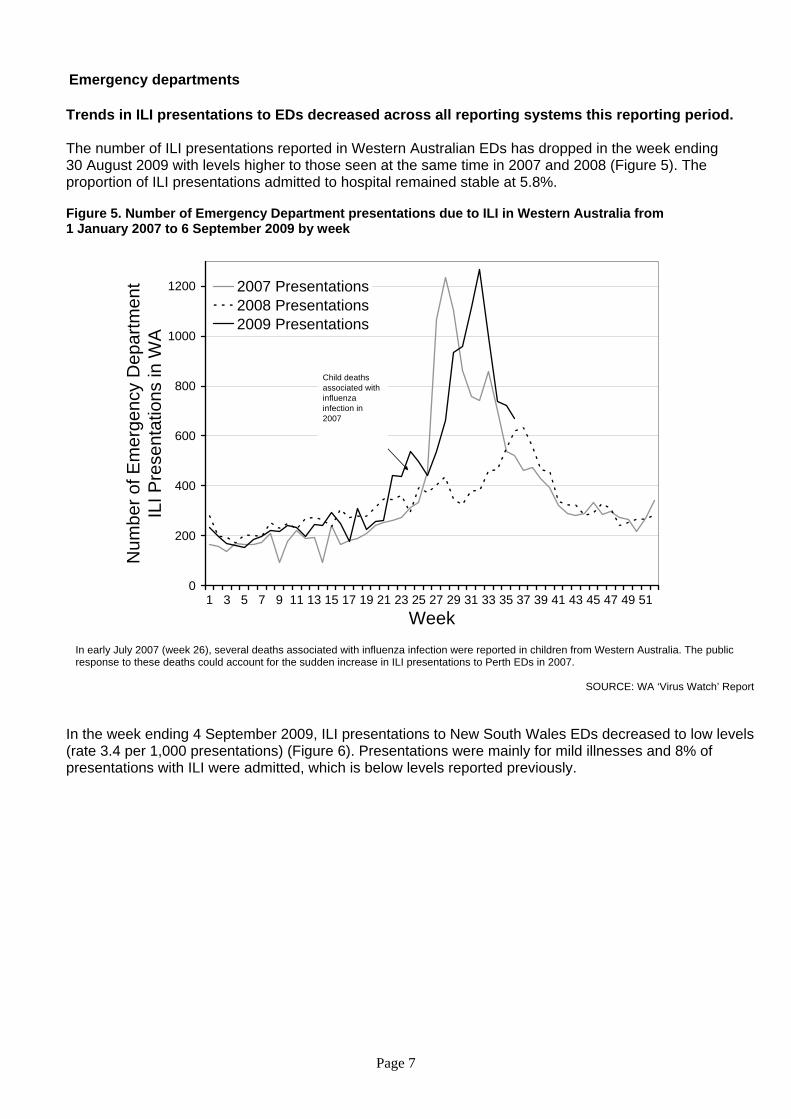
Emergency departments Trends in ILI presentations to EDs decreased across all reporting systems this reporting period. The number of ILI presentations reported in Western Australian EDs has dropped in the week ending 30 August 2009 with levels higher to those seen at the same time in 2007 and 2008 (Figure 5). The proportion of ILI presentations admitted to hospital remained stable at 5.8%. Figure 5. Number of Emergency Department presentations due to ILI in Western Australia from 1 January 2007 to 6 September 2009 by week
0
200
400
600
800
1000
1200
1 3 5 7 9 11 13 15 17 19 21 23 25 27 29 31 33 35 37 39 41 43 45 47 49 51Week
Num
ber o
f Em
erge
ncy
Dep
artm
ent
ILI P
rese
ntat
ions
in W
A
2007 Presentations2008 Presentations2009 Presentations
Child deaths associated with influenza infection in 2007
In early July 2007 (week 26), several deaths associated with influenza infection were reported in children from Western Australia. The public response to these deaths could account for the sudden increase in ILI presentations to Perth EDs in 2007.
SOURCE: WA ‘Virus Watch’ Report
In the week ending 4 September 2009, ILI presentations to New South Wales EDs decreased to low levels (rate 3.4 per 1,000 presentations) (Figure 6). Presentations were mainly for mild illnesses and 8% of presentations with ILI were admitted, which is below levels reported previously.
Page 7
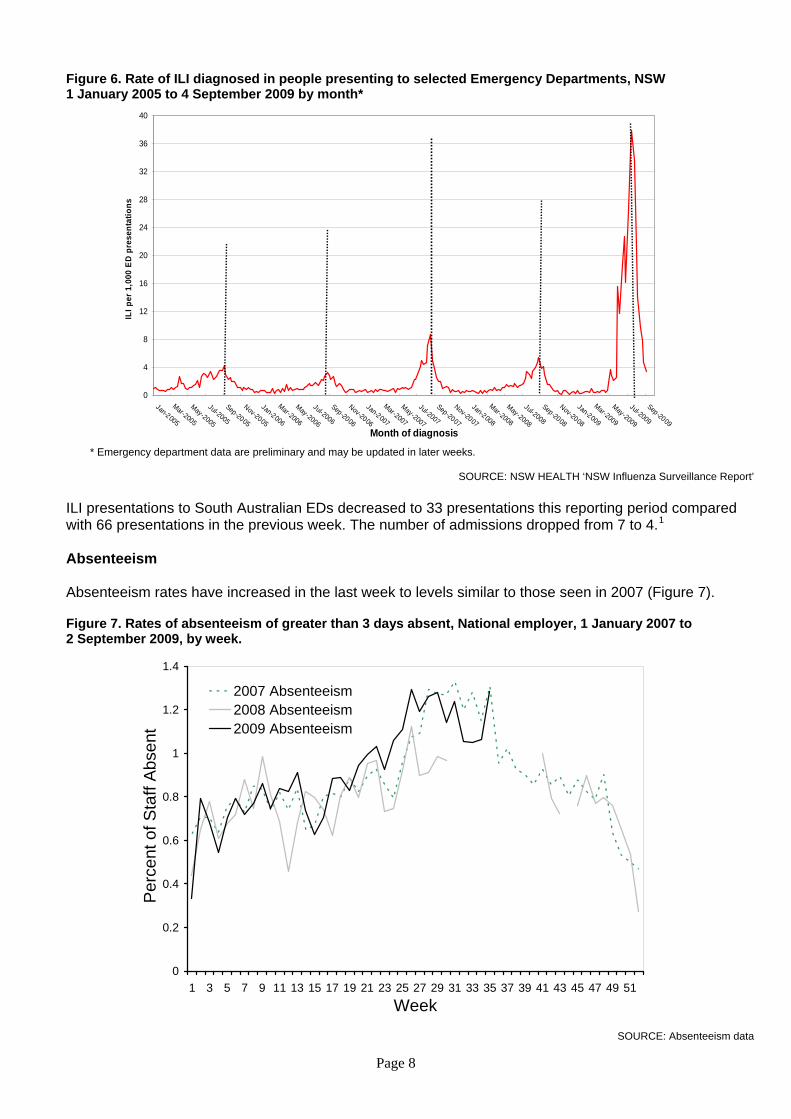
Figure 6. Rate of ILI diagnosed in people presenting to selected Emergency Departments, NSW 1 January 2005 to 4 September 2009 by month*
0
4
8
12
16
20
24
28
32
36
40
Jan-2005
Mar-2005
May-2005
Jul-2005
Sep-2005
Nov-2005
Jan-2006
Mar-2006
May-2006
Jul-2006
Sep-2006
Nov-2006
Jan-2007
Mar-2007
May-2007
Jul-2007
Sep-2007
Nov-2007
Jan-2008
Mar-2008
May-2008
Jul-2008
Sep-2008
Nov-2008
Jan-2009
Mar-2009
May-2009
Jul-2009
Sep-2009Month of diagnosis
ILI p
er 1
,000
ED
pres
enta
tions
* Emergency department data are preliminary and may be updated in later weeks.
SOURCE: NSW HEALTH ‘NSW Influenza Surveillance Report’ ILI presentations to South Australian EDs decreased to 33 presentations this reporting period compared with 66 presentations in the previous week. The number of admissions dropped from 7 to 4.1
Absenteeism Absenteeism rates have increased in the last week to levels similar to those seen in 2007 (Figure 7). Figure 7. Rates of absenteeism of greater than 3 days absent, National employer, 1 January 2007 to 2 September 2009, by week.
0
0.2
0.4
0.6
0.8
1
1.2
1.4
1 3 5 7 9 11 13 15 17 19 21 23 25 27 29 31 33 35 37 39 41 43 45 47 49 51Week
Per
cent
of S
taff
Abs
ent
2007 Absenteeism2008 Absenteeism2009 Absenteeism
SOURCE: Absenteeism data
Page 8
Laboratory surveillance: How much ILI and influenza is due to pandemic (H1N1) 2009?
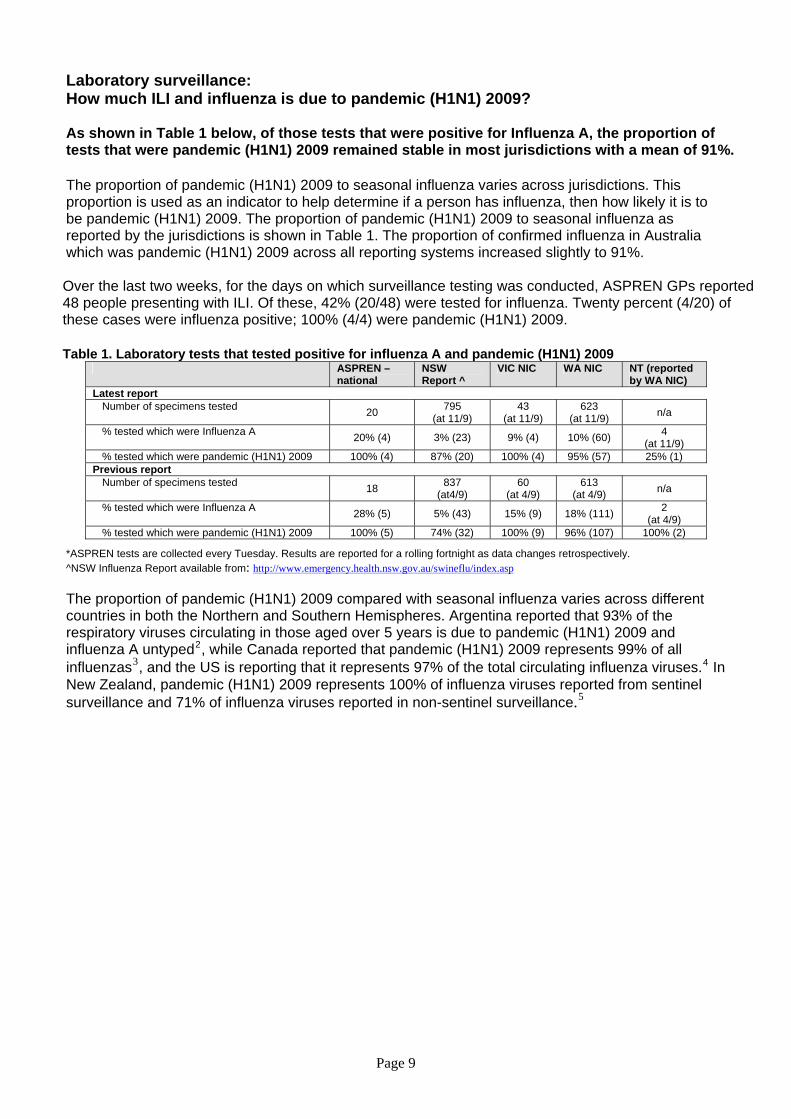
As shown in Table 1 below, of those tests that were positive for Influenza A, the proportion of tests that were pandemic (H1N1) 2009 remained stable in most jurisdictions with a mean of 91%. The proportion of pandemic (H1N1) 2009 to seasonal influenza varies across jurisdictions. This proportion is used as an indicator to help determine if a person has influenza, then how likely it is to be pandemic (H1N1) 2009. The proportion of pandemic (H1N1) 2009 to seasonal influenza as reported by the jurisdictions is shown in Table 1. The proportion of confirmed influenza in Australia which was pandemic (H1N1) 2009 across all reporting systems increased slightly to 91%. Over the last two weeks, for the days on which surveillance testing was conducted, ASPREN GPs reported 48 people presenting with ILI. Of these, 42% (20/48) were tested for influenza. Twenty percent (4/20) of these cases were influenza positive; 100% (4/4) were pandemic (H1N1) 2009. Table 1. Laboratory tests that tested positive for influenza A and pandemic (H1N1) 2009
ASPREN – national
NSW Report ^
VIC NIC WA NIC NT (reported by WA NIC)
Latest report Number of specimens tested 20 795
(at 11/9) 43
(at 11/9) 623
(at 11/9) n/a
% tested which were Influenza A 20% (4) 3% (23) 9% (4) 10% (60) 4 (at 11/9)
% tested which were pandemic (H1N1) 2009 100% (4) 87% (20) 100% (4) 95% (57) 25% (1) Previous report
Number of specimens tested 18 837 (at4/9)
60 (at 4/9)
613 (at 4/9) n/a
% tested which were Influenza A 28% (5) 5% (43) 15% (9) 18% (111) 2 (at 4/9)
% tested which were pandemic (H1N1) 2009 100% (5) 74% (32) 100% (9) 96% (107) 100% (2)
*ASPREN tests are collected every Tuesday. Results are reported for a rolling fortnight as data changes retrospectively. ^NSW Influenza Report available from: http://www.emergency.health.nsw.gov.au/swineflu/index.asp The proportion of pandemic (H1N1) 2009 compared with seasonal influenza varies across different countries in both the Northern and Southern Hemispheres. Argentina reported that 93% of the respiratory viruses circulating in those aged over 5 years is due to pandemic (H1N1) 2009 and influenza A untyped2, while Canada reported that pandemic (H1N1) 2009 represents 99% of all influenzas3, and the US is reporting that it represents 97% of the total circulating influenza viruses.4 In New Zealand, pandemic (H1N1) 2009 represents 100% of influenza viruses reported from sentinel surveillance and 71% of influenza viruses reported in non-sentinel surveillance.5
Page 9
Page 10
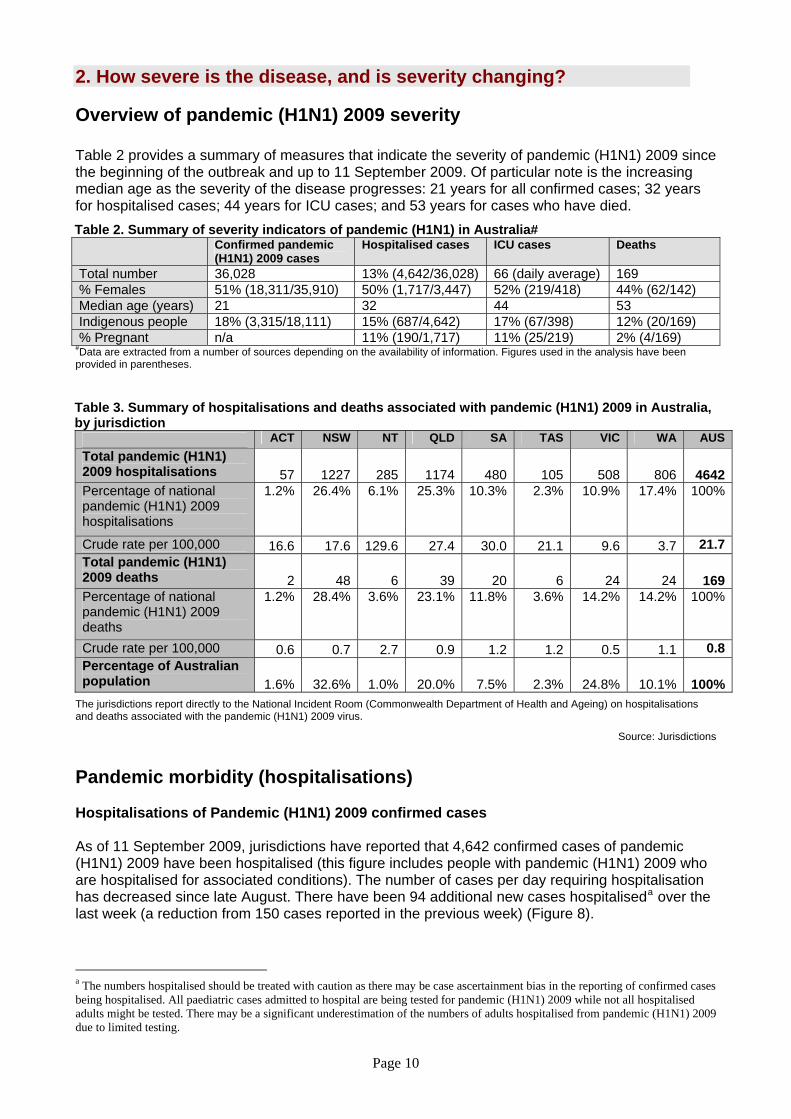
2. How severe is the disease, and is severity changing? Overview of pandemic (H1N1) 2009 severity Table 2 provides a summary of measures that indicate the severity of pandemic (H1N1) 2009 since the beginning of the outbreak and up to 11 September 2009. Of particular note is the increasing median age as the severity of the disease progresses: 21 years for all confirmed cases; 32 years for hospitalised cases; 44 years for ICU cases; and 53 years for cases who have died. Table 2. Summary of severity indicators of pandemic (H1N1) in Australia# Confirmed pandemic
(H1N1) 2009 cases Hospitalised cases ICU cases Deaths
Total number 36,028 13% (4,642/36,028) 66 (daily average) 169 % Females 51% (18,311/35,910) 50% (1,717/3,447) 52% (219/418) 44% (62/142) Median age (years) 21 32 44 53 Indigenous people 18% (3,315/18,111) 15% (687/4,642) 17% (67/398) 12% (20/169) % Pregnant n/a 11% (190/1,717) 11% (25/219) 2% (4/169)
#Data are extracted from a number of sources depending on the availability of information. Figures used in the analysis have been provided in parentheses.
Table 3. Summary of hospitalisations and deaths associated with pandemic (H1N1) 2009 in Australia, by jurisdiction
ACT NSW NT QLD SA TAS VIC WA AUS Total pandemic (H1N1) 2009 hospitalisations 57 1227 285 1174 480 105 508 806 4642Percentage of national pandemic (H1N1) 2009 hospitalisations
1.2% 26.4% 6.1% 25.3% 10.3% 2.3% 10.9% 17.4% 100%
Crude rate per 100,000 16.6 17.6 129.6 27.4 30.0 21.1 9.6 3.7 21.7Total pandemic (H1N1) 2009 deaths 2 48 6 39 20 6 24 24 169Percentage of national pandemic (H1N1) 2009 deaths
1.2% 28.4% 3.6% 23.1% 11.8% 3.6% 14.2% 14.2% 100%
Crude rate per 100,000 0.6 0.7 2.7 0.9 1.2 1.2 0.5 1.1 0.8Percentage of Australian population 1.6% 32.6% 1.0% 20.0% 7.5% 2.3% 24.8% 10.1% 100%
The jurisdictions report directly to the National Incident Room (Commonwealth Department of Health and Ageing) on hospitalisations and deaths associated with the pandemic (H1N1) 2009 virus.
Source: Jurisdictions Pandemic morbidity (hospitalisations) Hospitalisations of Pandemic (H1N1) 2009 confirmed cases As of 11 September 2009, jurisdictions have reported that 4,642 confirmed cases of pandemic (H1N1) 2009 have been hospitalised (this figure includes people with pandemic (H1N1) 2009 who are hospitalised for associated conditions). The number of cases per day requiring hospitalisation has decreased since late August. There have been 94 additional new cases hospitaliseda over the last week (a reduction from 150 cases reported in the previous week) (Figure 8).
a The numbers hospitalised should be treated with caution as there may be case ascertainment bias in the reporting of confirmed cases being hospitalised. All paediatric cases admitted to hospital are being tested for pandemic (H1N1) 2009 while not all hospitalised adults might be tested. There may be a significant underestimation of the numbers of adults hospitalised from pandemic (H1N1) 2009 due to limited testing.

Page 11
Indigenous Australians are approximately 8 times more likely than non-Indigenous Australians to be hospitalised for pandemic (H1N1) 2009. Australian jurisdictions have reported that 687 (15%) of all 4,642 cases hospitalised since the beginning of the outbreak were Aboriginal and/or Torres Strait Islander. For comparative purposes, for the period 2000-01 to 2006-07, an average of 1,925 people with influenza are admitted to hospital each year. For all influenzasb and pneumoniasc, for the same period, an average of 73,271 people were admitted to hospital.6
Figure 8. Hospitalisations of pandemic (H1N1) 2009, 15 June 2009 to 11 September 2009, Australia
0
50
100
150
200
250
300
350
400
450
500
15/06
/09
22/06
/09
29/06
/09
6/07/0
9
13/07
/09
20/07
/09
27/07
/09
3/08/0
9
10/08
/09
17/08
/09
24/08
/09
31/08
/09
7/09/0
9
Date reported
Dai
ly n
umbe
rs o
f con
firm
ed c
ases
ho
spita
lised
Numbers of confirmed caseshospitalised
The jurisdictions report directly to the National Incident Room, Commonwealth Department of Health and Ageing, on hospitalisations and numbers admitted to ICUs associated with the pandemic (H1N1) 2009 virus.
Source: Jurisdictions Age and sex distribution of hospitalised confirmed cases Limited further information is available for 3,459 (75%) of the 4,642 confirmed cases hospitalised since the beginning of the outbreak. Of these cases, the overall hospitalisation rate is 16.1 per 100,000 population (a slight increase from the previous reporting period which was 14.2), with the highest rates in children aged less than 5 years of age (50.1 for males and 37.8 for females per 100,000 population). The median age of hospitalised cases is 32 years (range 0-98 years). Figure 9 illustrates that the age distribution of hospitalised cases of pandemic (H1N1) 2009 is different to previous influenza seasons. In comparison with the 2004-2007 influenza seasons, young children aged less than 5 years of age continue to be hospitalised at a higher rate than other age groups (males in particular) but for pandemic (H1N1) 2009 there is a peak in the 50 to 60 years age group and a marked decrease in those aged more than 75 years.
b ICD10-AM codes J10-J11 c ICD10-AM codes J12-J18

Page 12
Figure 9. Age specific rates of hospitalised confirmed cases of pandemic (H1N1) 2009 to 11 September 2009, compared with average annual age specific rates of hospitalisations from seasonal influenza 2004-05 to 2006-07*, Australia
0.0
10.0
20.0
30.0
40.0
50.0
60.0
0-4 5-910
-1415
-1920
-2425
-2930
-3435
-3940
-4445
-4950
-5455
-5960
-6465
-6970
-7475
-7980
-84 85+
Age group (5 Years)
Age
spe
cific
rate
(per
100
,000
)
Males pandemic (H1N1) 2009
Females pandemic (H1N1) 2009
2004-07 seasonal influenza
*The rates for pandemic (H1N1) 2009 are from 15 June to 21 August 2009 whereas the rates for seasonal influenza are averaged annual rates (i.e. for a full influenza season).
Source: NETEPI database Information on length of stay is available for 64% (2,210) of the 3,459 hospitalised cases for which there is further information. The median length of stay in hospital is 3 days (range 1-98 days). Approximately 10% of all hospitalised patients stayed in hospital for more that 7 days (Figure 10). A breakdown by age group shows that children aged less than 5 years, although more likely to be hospitalised, tend to be hospitalised for shorter periods than older children and adults. Only 6% of children aged less than 5 years remain in hospital for longer than 7 days compared to 12% for those in the age group 30 years and over.

Page 13
Figure 10. Hospitalised confirmed cases of pandemic (H1N1) 2009, by length of hospital stay and age group, to 11 September 2009, Australia
0
50
100
150
200
250
300
350
400
450
500
0-4
10-1
415
-19
20-2
425
-29
30-3
435
-39
40-4
445
-49
50-5
455
-59
5-9
60-6
465
-69
70-7
475
-79
80-8
4
85+
Age group (5 Years)
Num
bers
hos
pita
lised
14+ days
8-13 days
3-7 days
<3 days
Source: NETEPI database
Pregnancy as a risk factor for hospitalisation with pandemic (H1N1) 2009 A total of 190 (5%) of the 3,459 hospitalised confirmed cases for whom further information was known were pregnant women. Information on gestation is available for 76 of the 190 cases. Approximately 8% (6) were in their 1st trimester (weeks 1-12); 23% (18) were in their 2nd trimester (weeks 13-26); and 68% (52) were in their 3rd trimester (weeks 27-41) (Figure 11). A total of 39 pregnant women were admitted to ICU: 1 was in her first trimester, 4 were in their 2nd trimester and 10 were in the 3rd trimester. No information on gestation was available for 24 women. Pregnant women stayed an average of 6 days in hospital (range 1-43 days). Four pregnant women are known to have died. Figure 11. Hospitalised confirmed cases of pandemic (H1N1) 2009 in pregnant women by weeks of gestation, to 11 September 2009, Australia
0
1
2
3
4
5
6
7
8
8 11 19 22 25 29 32 35 39
Weeks of gestation
Num
bers
of h
ospi
talis
atin
s of
pre
gnan
t wom
en
with
pan
dem
ic (H
1N1)
200
9
Trimester 1Trimester 2Trimester 3
Source: NETEPI database
Page 14
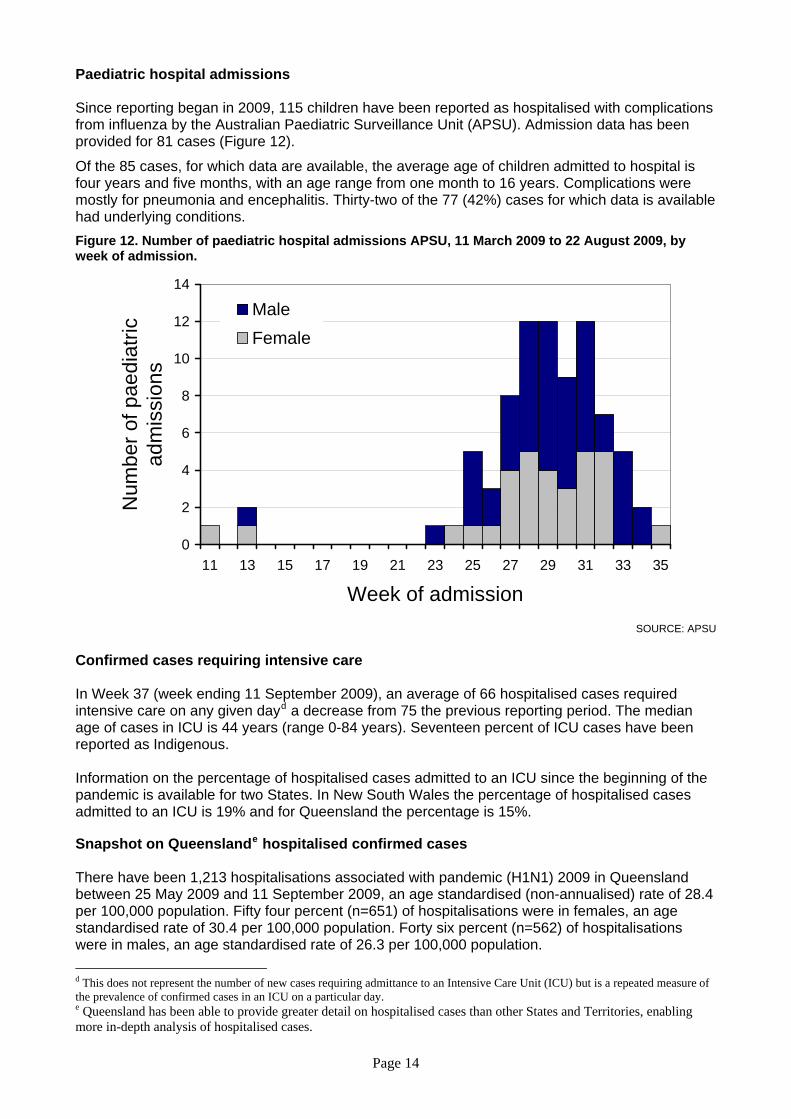
Paediatric hospital admissions Since reporting began in 2009, 115 children have been reported as hospitalised with complications from influenza by the Australian Paediatric Surveillance Unit (APSU). Admission data has been provided for 81 cases (Figure 12).
Of the 85 cases, for which data are available, the average age of children admitted to hospital is four years and five months, with an age range from one month to 16 years. Complications were mostly for pneumonia and encephalitis. Thirty-two of the 77 (42%) cases for which data is available had underlying conditions. Figure 12. Number of paediatric hospital admissions APSU, 11 March 2009 to 22 August 2009, by week of admission.
0
2
4
6
8
10
12
14
11 13 15 17 19 21 23 25 27 29 31 33 35
Week of admission
Num
ber o
f pae
diat
ric
adm
issi
ons
MaleFemale
SOURCE: APSU
Confirmed cases requiring intensive care In Week 37 (week ending 11 September 2009), an average of 66 hospitalised cases required intensive care on any given dayd a decrease from 75 the previous reporting period. The median age of cases in ICU is 44 years (range 0-84 years). Seventeen percent of ICU cases have been reported as Indigenous. Information on the percentage of hospitalised cases admitted to an ICU since the beginning of the pandemic is available for two States. In New South Wales the percentage of hospitalised cases admitted to an ICU is 19% and for Queensland the percentage is 15%. Snapshot on Queenslande hospitalised confirmed cases There have been 1,213 hospitalisations associated with pandemic (H1N1) 2009 in Queensland between 25 May 2009 and 11 September 2009, an age standardised (non-annualised) rate of 28.4 per 100,000 population. Fifty four percent (n=651) of hospitalisations were in females, an age standardised rate of 30.4 per 100,000 population. Forty six percent (n=562) of hospitalisations were in males, an age standardised rate of 26.3 per 100,000 population. d This does not represent the number of new cases requiring admittance to an Intensive Care Unit (ICU) but is a repeated measure of the prevalence of confirmed cases in an ICU on a particular day. e Queensland has been able to provide greater detail on hospitalised cases than other States and Territories, enabling more in-depth analysis of hospitalised cases.
Page 15
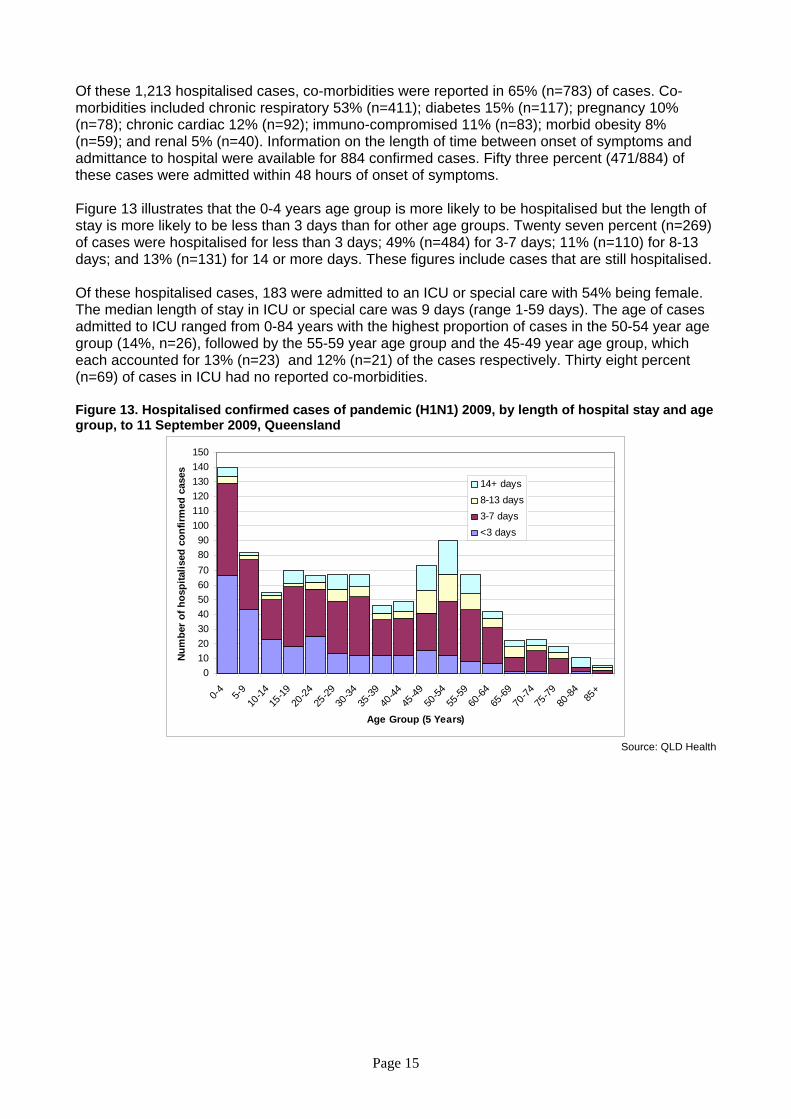
Of these 1,213 hospitalised cases, co-morbidities were reported in 65% (n=783) of cases. Co-morbidities included chronic respiratory 53% (n=411); diabetes 15% (n=117); pregnancy 10% (n=78); chronic cardiac 12% (n=92); immuno-compromised 11% (n=83); morbid obesity 8% (n=59); and renal 5% (n=40). Information on the length of time between onset of symptoms and admittance to hospital were available for 884 confirmed cases. Fifty three percent (471/884) of these cases were admitted within 48 hours of onset of symptoms. Figure 13 illustrates that the 0-4 years age group is more likely to be hospitalised but the length of stay is more likely to be less than 3 days than for other age groups. Twenty seven percent (n=269) of cases were hospitalised for less than 3 days; 49% (n=484) for 3-7 days; 11% (n=110) for 8-13 days; and 13% (n=131) for 14 or more days. These figures include cases that are still hospitalised. Of these hospitalised cases, 183 were admitted to an ICU or special care with 54% being female. The median length of stay in ICU or special care was 9 days (range 1-59 days). The age of cases admitted to ICU ranged from 0-84 years with the highest proportion of cases in the 50-54 year age group (14%, n=26), followed by the 55-59 year age group and the 45-49 year age group, which each accounted for 13% (n=23) and 12% (n=21) of the cases respectively. Thirty eight percent (n=69) of cases in ICU had no reported co-morbidities. Figure 13. Hospitalised confirmed cases of pandemic (H1N1) 2009, by length of hospital stay and age group, to 11 September 2009, Queensland
0102030405060708090
100110120130140150
0-4 5-910
-1415
-1920
-2425
-2930
-3435
-3940
-4445
-4950
-5455
-5960
-6465
-6970
-7475
-7980
-84 85+
Age Group (5 Years)
Num
ber o
f hos
pita
lised
con
firm
ed c
ases
14+ days8-13 days3-7 days<3 days
Source: QLD Health

Page 16
Pandemic Mortality Deaths associated with pandemic (H1N1) 2009 There were 169 deaths associated with the pandemic (H1N1) 2009 virus in Australia between 19 June 2009 and 11 September 2009.f Of these 169 deaths, 48 occurred in New South Wales, 39 in Queensland, 24 in Victoria and Western Australia, 20 in South Australia, 6 in Tasmania and the Northern Territory and 2 in the Australian Capital Territory. Of the 169 deaths, 20 (12%) were Indigenous.g Reports from the jurisdictions in Australia indicate that most of the cases had underlying medical conditions including cancer, diabetes mellitus and morbid obesity. Further information was available on 142 of the 169 deaths in Australia. Males were overrepresented among the deaths (56%, n=80). The median age of confirmed cases that died was 53 years (range 2-92 years). This is lower than the median age of deaths from seasonal influenza for the period 2001-2006 (83 years). The highest proportion of deaths (16%, n=22) have occurred in the 55-59 year age group. Most deaths (76%) have occurred in those aged between 35 to 79 years (Figure 14). Noting the apparent biases in these data, the pattern of deaths across age groups is very different to the age distribution of hospitalisations and confirmed cases. Figure 14. Numbers of deaths among confirmed cases of pandemic (H1N1) 2009, by age group and sex, compared with total laboratory confirmed pandemic (H1N1) 2009 notifications by age group, to 11 September 2009, Australia
0
5
10
15
20
25
0-4 5-910
-1415
-1920
-2425
-2930
-3435
-3940
-4445
-4950
-5455
-5960
-6465
-6970
-7475
-7980
-84 85+
Age group (5 Years)
Num
bers
of d
eath
s am
ong
conf
irmed
ca
ses
of p
ande
mic
(H1N
1) 2
009
0
1000
2000
3000
4000
5000
6000
Tota
l pan
dem
ic (H
1N1)
200
9 no
tific
atio
ns
Female
Male
Total pandemic(H1N1) 2009
Source: NETEPI database
f For the most recent figures on hospitalisations and deaths please access the latest Situation Report at <http://www.healthemergency.gov.au/internet/healthemergency/publishing.nsf/Content/updates> g It is estimated that 2.4% of the total Australian population are Aboriginal and/or Torres Strait Islander.
Page 17
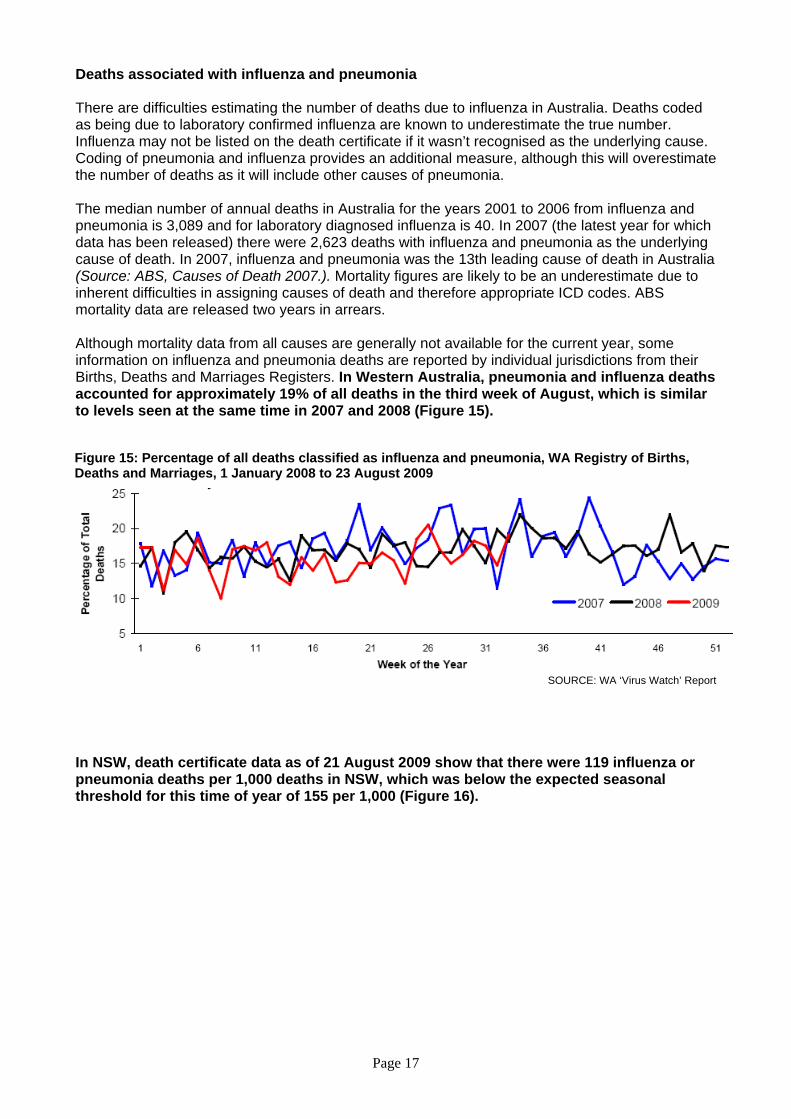
Deaths associated with influenza and pneumonia There are difficulties estimating the number of deaths due to influenza in Australia. Deaths coded as being due to laboratory confirmed influenza are known to underestimate the true number. Influenza may not be listed on the death certificate if it wasn’t recognised as the underlying cause. Coding of pneumonia and influenza provides an additional measure, although this will overestimate the number of deaths as it will include other causes of pneumonia. The median number of annual deaths in Australia for the years 2001 to 2006 from influenza and pneumonia is 3,089 and for laboratory diagnosed influenza is 40. In 2007 (the latest year for which data has been released) there were 2,623 deaths with influenza and pneumonia as the underlying cause of death. In 2007, influenza and pneumonia was the 13th leading cause of death in Australia (Source: ABS, Causes of Death 2007.). Mortality figures are likely to be an underestimate due to inherent difficulties in assigning causes of death and therefore appropriate ICD codes. ABS mortality data are released two years in arrears. Although mortality data from all causes are generally not available for the current year, some information on influenza and pneumonia deaths are reported by individual jurisdictions from their Births, Deaths and Marriages Registers. In Western Australia, pneumonia and influenza deaths accounted for approximately 19% of all deaths in the third week of August, which is similar to levels seen at the same time in 2007 and 2008 (Figure 15).
Figure 15: Percentage of all deaths classified as influenza and pneumonia, WA Registry of Births, Deaths and Marriages, 1 January 2008 to 23 August 2009
SOURCE: WA ‘Virus Watch’ Report
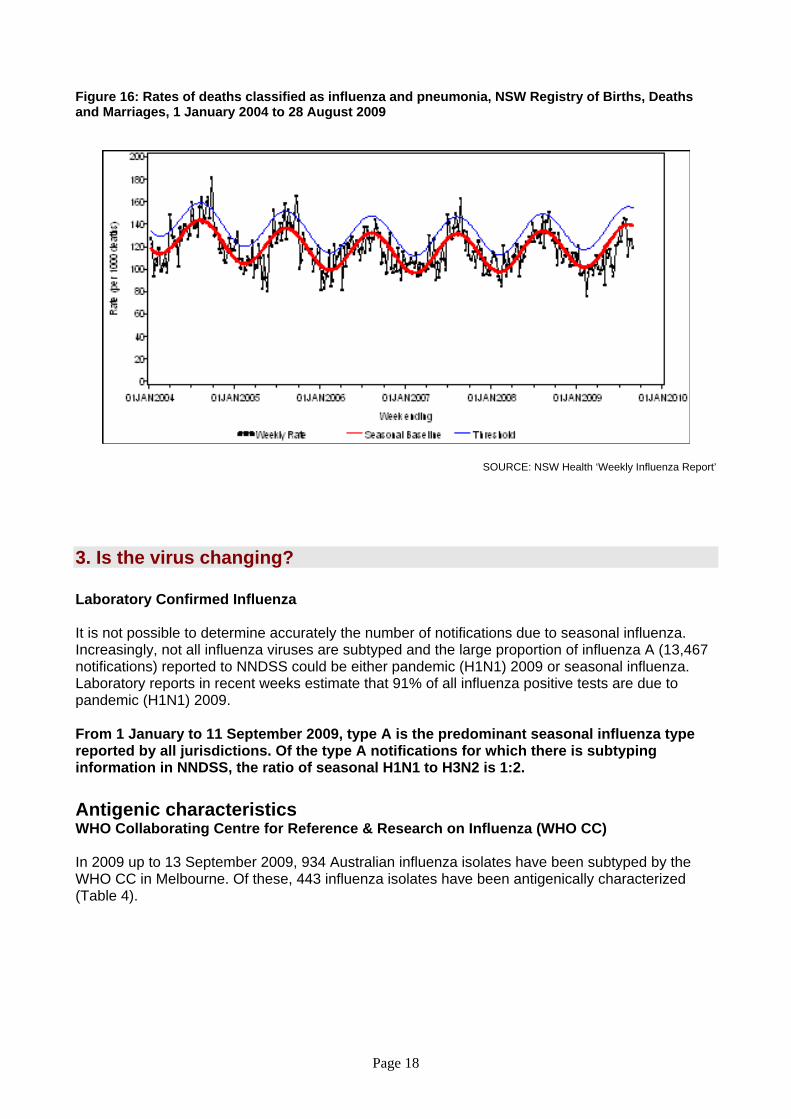
In NSW, death certificate data as of 21 August 2009 show that there were 119 influenza or pneumonia deaths per 1,000 deaths in NSW, which was below the expected seasonal threshold for this time of year of 155 per 1,000 (Figure 16).
Page 18
Figure 16: Rates of deaths classified as influenza and pneumonia, NSW Registry of Births, Deaths and Marriages, 1 January 2004 to 28 August 2009
SOURCE: NSW Health ‘Weekly Influenza Report’
3. Is the virus changing? Laboratory Confirmed Influenza It is not possible to determine accurately the number of notifications due to seasonal influenza. Increasingly, not all influenza viruses are subtyped and the large proportion of influenza A (13,467 notifications) reported to NNDSS could be either pandemic (H1N1) 2009 or seasonal influenza. Laboratory reports in recent weeks estimate that 91% of all influenza positive tests are due to pandemic (H1N1) 2009. From 1 January to 11 September 2009, type A is the predominant seasonal influenza type reported by all jurisdictions. Of the type A notifications for which there is subtyping information in NNDSS, the ratio of seasonal H1N1 to H3N2 is 1:2. Antigenic characteristics WHO Collaborating Centre for Reference & Research on Influenza (WHO CC) In 2009 up to 13 September 2009, 934 Australian influenza isolates have been subtyped by the WHO CC in Melbourne. Of these, 443 influenza isolates have been antigenically characterized (Table 4).

Page 19
Table 4. Antigenic characterisation of Influenza isolate strain information from the WHO Collaborating Centre, 1 January 2009 to 13 September 2009
Antigenic characterization ACT NSW NT QLD SA TAS VIC WA TOTAL TOTAL
% A(H1N1)
A/Brisbane/59/2007-likei 0 8 11 5 6 17 47 A/Brisbane/59/2007-like (low reactor) 1 1 1 0 0 0 3
Subtotal 1 9 0 12 5 0 6 17 50 11% Pandemic (H1N1) 2009
A/California/7/2009-likeii 8 11 12 28 20 3 76 69 227 A/California/7/2009-like (low reactor) 0 0 0 0 3 0 1 0 4
Subtotal 8 11 12 28 23 3 77 69 231 52% A(H3)
A/Brisbane/10/2007-likei 0 8 0 11 8 3 30 A/Brisbane/10/2007-like (low reactor) 6 44 2 8 18 43 121
Subtotal 6 52 2 19 0 0 26 46 151 34% B
B/Florida/4/2006-likei 0 0 0 B/Florida/4/2006-like (low reactor) 0 5 5
B/Brisbane/60/2008-likeiii 2 1 1 4 B/Brisbane/60/2008 (low reactor) 1 0 1 2
Subtotal 0 3 0 1 0 0 0 7 11 3% Total 15 75 14 60 28 3 109 139 443 100%
i Composition of the 2009 Southern Hemisphere influenza vaccine ii Recommended virus for Pandemic A(H1N1) 2009 vaccines iii Composition of the 2009-2010 Northern Hemisphere influenza vaccine Please note: There may be up to a months delay on reporting of samples
SOURCE: WHO CC Isolates tested by the WHO CC are not a random sample of all those in the community hence proportions of pandemic (H1N1) 2009 to seasonal are not representative of the proportions circulating. Early in the pandemic all influenza A untypeable samples were sent to the WHO CC for testing and later many pandemic (H1N1) 2009 positive samples were sent for confirmation, resulting in biases in the data. In general, seasonal influenza A strains circulating this influenza season are the same as strains in the vaccine, with the A(H3N2) virus drifting. Influenza B strains match more closely with those in the 2009-10 Northern Hemisphere vaccine and may be drifting (Table 4). Low-reactor viruses, as referred to in Table 4, show less affinity than the reference virus when tested against antisera, meaning they are less antigenically matched.
Antiviral Resistance Pandemic (H1N1) 2009 To date, the WHO has received formal notification of 21 cases of oseltamivir resistant pandemic (H1N1) 2009 viruses worldwide (Table 5). The isolates have a mutation in the neuraminidase (referred to as H275Y) that confers resistance to oseltamivir. The isolates remain sensitive to zanamivir.7
Page 20
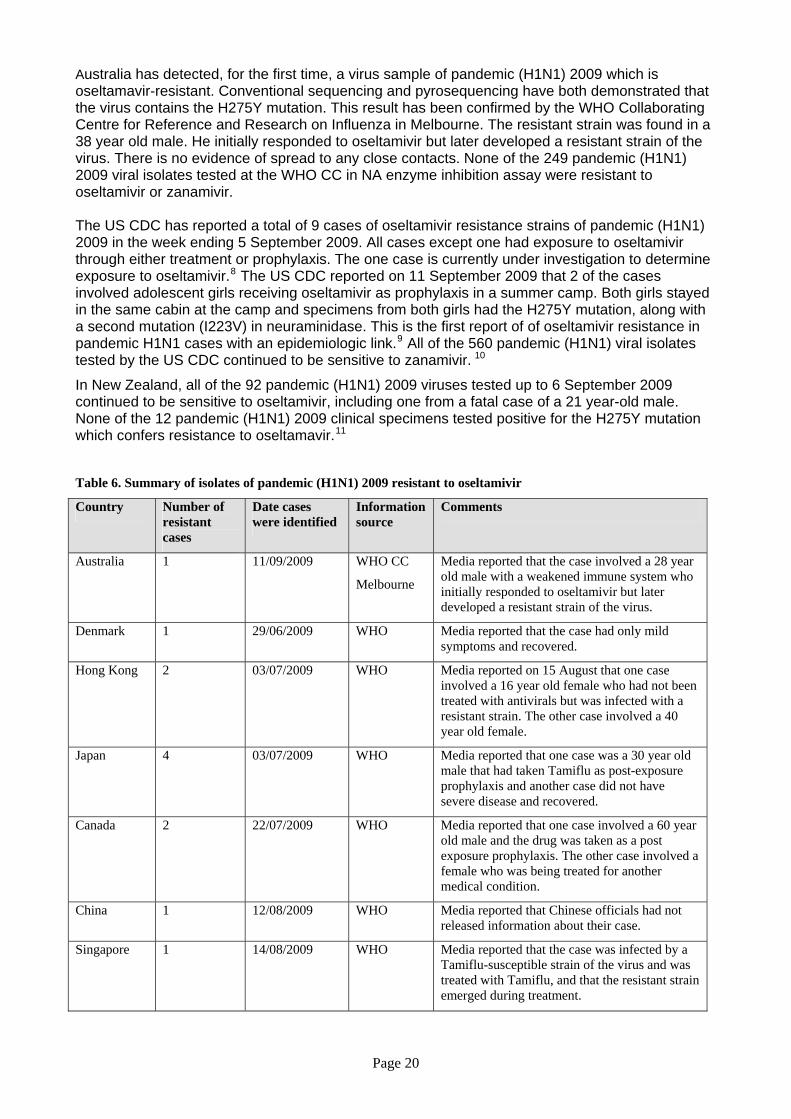
Australia has detected, for the first time, a virus sample of pandemic (H1N1) 2009 which is oseltamavir-resistant. Conventional sequencing and pyrosequencing have both demonstrated that the virus contains the H275Y mutation. This result has been confirmed by the WHO Collaborating Centre for Reference and Research on Influenza in Melbourne. The resistant strain was found in a 38 year old male. He initially responded to oseltamivir but later developed a resistant strain of the virus. There is no evidence of spread to any close contacts. None of the 249 pandemic (H1N1) 2009 viral isolates tested at the WHO CC in NA enzyme inhibition assay were resistant to oseltamivir or zanamivir. The US CDC has reported a total of 9 cases of oseltamivir resistance strains of pandemic (H1N1) 2009 in the week ending 5 September 2009. All cases except one had exposure to oseltamivir through either treatment or prophylaxis. The one case is currently under investigation to determine exposure to oseltamivir.8 The US CDC reported on 11 September 2009 that 2 of the cases involved adolescent girls receiving oseltamivir as prophylaxis in a summer camp. Both girls stayed in the same cabin at the camp and specimens from both girls had the H275Y mutation, along with a second mutation (I223V) in neuraminidase. This is the first report of of oseltamivir resistance in pandemic H1N1 cases with an epidemiologic link.9 All of the 560 pandemic (H1N1) viral isolates tested by the US CDC continued to be sensitive to zanamivir. 10
In New Zealand, all of the 92 pandemic (H1N1) 2009 viruses tested up to 6 September 2009 continued to be sensitive to oseltamivir, including one from a fatal case of a 21 year-old male. None of the 12 pandemic (H1N1) 2009 clinical specimens tested positive for the H275Y mutation which confers resistance to oseltamavir.11
Table 6. Summary of isolates of pandemic (H1N1) 2009 resistant to oseltamivir
Country Number of resistant cases
Date cases were identified
Information source
Comments
Australia 1 11/09/2009 WHO CC
Melbourne
Media reported that the case involved a 28 year old male with a weakened immune system who initially responded to oseltamivir but later developed a resistant strain of the virus.
Denmark 1 29/06/2009 WHO Media reported that the case had only mild symptoms and recovered.
Hong Kong 2 03/07/2009 WHO Media reported on 15 August that one case involved a 16 year old female who had not been treated with antivirals but was infected with a resistant strain. The other case involved a 40 year old female.
Japan 4 03/07/2009 WHO Media reported that one case was a 30 year old male that had taken Tamiflu as post-exposure prophylaxis and another case did not have severe disease and recovered.
Canada 2 22/07/2009 WHO Media reported that one case involved a 60 year old male and the drug was taken as a post exposure prophylaxis. The other case involved a female who was being treated for another medical condition.
China 1 12/08/2009 WHO Media reported that Chinese officials had not released information about their case.
Singapore 1 14/08/2009 WHO Media reported that the case was infected by a Tamiflu-susceptible strain of the virus and was treated with Tamiflu, and that the resistant strain emerged during treatment.
Page 21
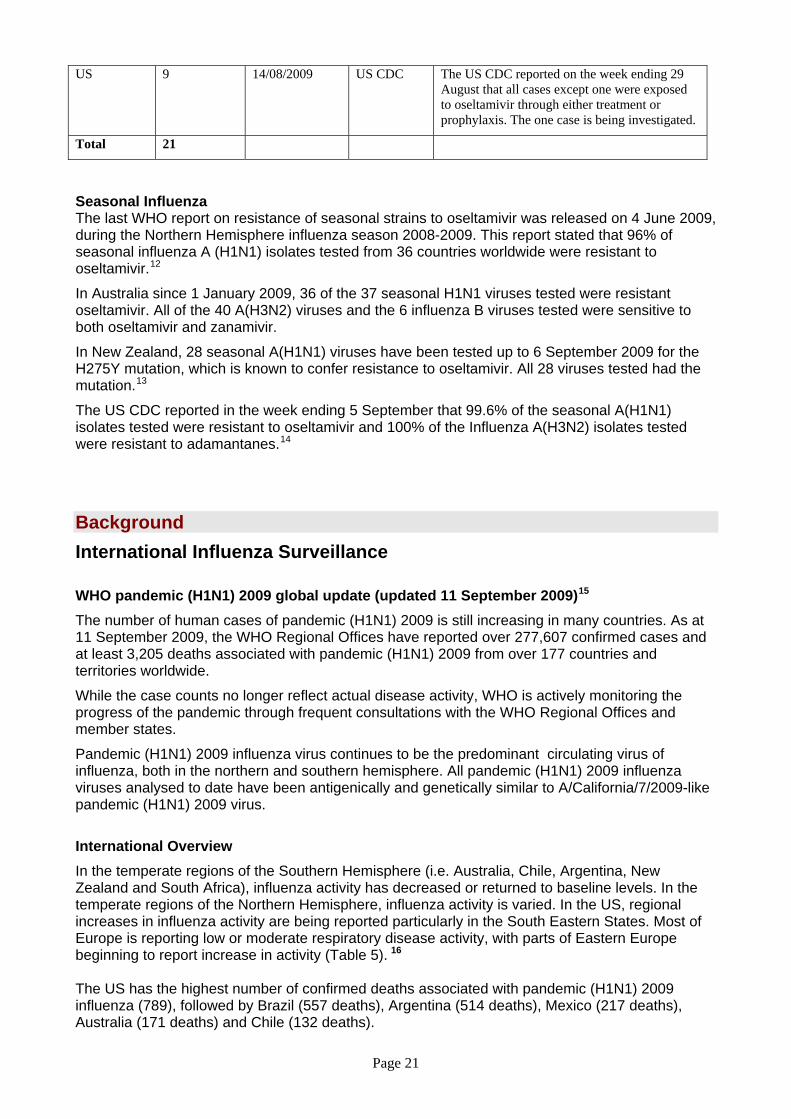
US 9 14/08/2009 US CDC The US CDC reported on the week ending 29 August that all cases except one were exposed to oseltamivir through either treatment or prophylaxis. The one case is being investigated.
Total 21
Seasonal Influenza The last WHO report on resistance of seasonal strains to oseltamivir was released on 4 June 2009, during the Northern Hemisphere influenza season 2008-2009. This report stated that 96% of seasonal influenza A (H1N1) isolates tested from 36 countries worldwide were resistant to oseltamivir.12
In Australia since 1 January 2009, 36 of the 37 seasonal H1N1 viruses tested were resistant oseltamivir. All of the 40 A(H3N2) viruses and the 6 influenza B viruses tested were sensitive to both oseltamivir and zanamivir.
In New Zealand, 28 seasonal A(H1N1) viruses have been tested up to 6 September 2009 for the H275Y mutation, which is known to confer resistance to oseltamivir. All 28 viruses tested had the mutation.13
The US CDC reported in the week ending 5 September that 99.6% of the seasonal A(H1N1) isolates tested were resistant to oseltamivir and 100% of the Influenza A(H3N2) isolates tested were resistant to adamantanes.14
Background International Influenza Surveillance WHO pandemic (H1N1) 2009 global update (updated 11 September 2009)15
The number of human cases of pandemic (H1N1) 2009 is still increasing in many countries. As at 11 September 2009, the WHO Regional Offices have reported over 277,607 confirmed cases and at least 3,205 deaths associated with pandemic (H1N1) 2009 from over 177 countries and territories worldwide.
While the case counts no longer reflect actual disease activity, WHO is actively monitoring the progress of the pandemic through frequent consultations with the WHO Regional Offices and member states.
Pandemic (H1N1) 2009 influenza virus continues to be the predominant circulating virus of influenza, both in the northern and southern hemisphere. All pandemic (H1N1) 2009 influenza viruses analysed to date have been antigenically and genetically similar to A/California/7/2009-like pandemic (H1N1) 2009 virus.
International Overview In the temperate regions of the Southern Hemisphere (i.e. Australia, Chile, Argentina, New Zealand and South Africa), influenza activity has decreased or returned to baseline levels. In the temperate regions of the Northern Hemisphere, influenza activity is varied. In the US, regional increases in influenza activity are being reported particularly in the South Eastern States. Most of Europe is reporting low or moderate respiratory disease activity, with parts of Eastern Europe beginning to report increase in activity (Table 5). 16
The US has the highest number of confirmed deaths associated with pandemic (H1N1) 2009 influenza (789), followed by Brazil (557 deaths), Argentina (514 deaths), Mexico (217 deaths), Australia (171 deaths) and Chile (132 deaths).
Page 22
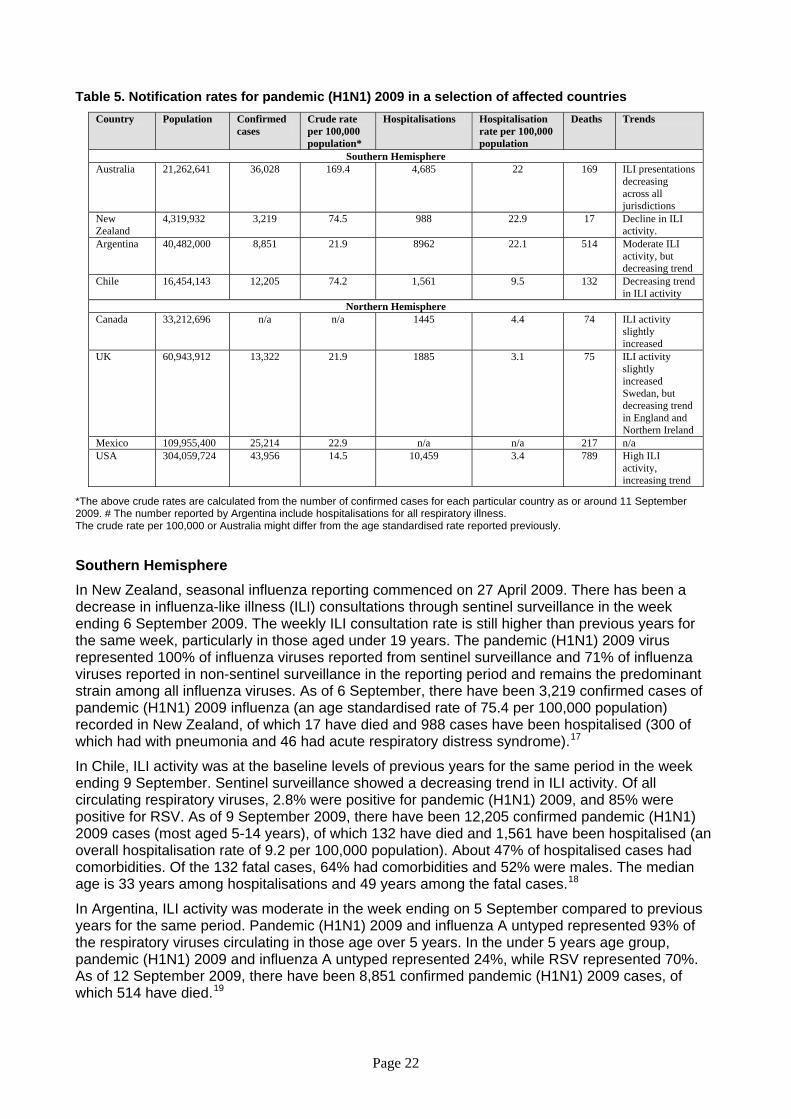
Table 5. Notification rates for pandemic (H1N1) 2009 in a selection of affected countries Country Population Confirmed
cases Crude rate per 100,000 population*
Hospitalisations Hospitalisation rate per 100,000 population
Deaths Trends
Southern Hemisphere Australia 21,262,641 36,028 169.4 4,685 22 169 ILI presentations
decreasing across all jurisdictions
New Zealand
4,319,932 3,219 74.5 988 22.9 17 Decline in ILI activity.
Argentina 40,482,000 8,851 21.9 8962 22.1 514 Moderate ILI activity, but decreasing trend
Chile 16,454,143 12,205 74.2 1,561 9.5 132 Decreasing trend in ILI activity
Northern Hemisphere Canada 33,212,696 n/a n/a 1445 4.4 74 ILI activity
slightly increased
UK 60,943,912 13,322 21.9 1885 3.1 75 ILI activity slightly increased Swedan, but decreasing trend in England and Northern Ireland
Mexico 109,955,400 25,214 22.9 n/a n/a 217 n/a USA 304,059,724 43,956 14.5 10,459 3.4 789 High ILI
activity, increasing trend
*The above crude rates are calculated from the number of confirmed cases for each particular country as or around 11 September 2009. # The number reported by Argentina include hospitalisations for all respiratory illness. The crude rate per 100,000 or Australia might differ from the age standardised rate reported previously. Southern Hemisphere In New Zealand, seasonal influenza reporting commenced on 27 April 2009. There has been a decrease in influenza-like illness (ILI) consultations through sentinel surveillance in the week ending 6 September 2009. The weekly ILI consultation rate is still higher than previous years for the same week, particularly in those aged under 19 years. The pandemic (H1N1) 2009 virus represented 100% of influenza viruses reported from sentinel surveillance and 71% of influenza viruses reported in non-sentinel surveillance in the reporting period and remains the predominant strain among all influenza viruses. As of 6 September, there have been 3,219 confirmed cases of pandemic (H1N1) 2009 influenza (an age standardised rate of 75.4 per 100,000 population) recorded in New Zealand, of which 17 have died and 988 cases have been hospitalised (300 of which had with pneumonia and 46 had acute respiratory distress syndrome).17
In Chile, ILI activity was at the baseline levels of previous years for the same period in the week ending 9 September. Sentinel surveillance showed a decreasing trend in ILI activity. Of all circulating respiratory viruses, 2.8% were positive for pandemic (H1N1) 2009, and 85% were positive for RSV. As of 9 September 2009, there have been 12,205 confirmed pandemic (H1N1) 2009 cases (most aged 5-14 years), of which 132 have died and 1,561 have been hospitalised (an overall hospitalisation rate of 9.2 per 100,000 population). About 47% of hospitalised cases had comorbidities. Of the 132 fatal cases, 64% had comorbidities and 52% were males. The median age is 33 years among hospitalisations and 49 years among the fatal cases.18
In Argentina, ILI activity was moderate in the week ending on 5 September compared to previous years for the same period. Pandemic (H1N1) 2009 and influenza A untyped represented 93% of the respiratory viruses circulating in those age over 5 years. In the under 5 years age group, pandemic (H1N1) 2009 and influenza A untyped represented 24%, while RSV represented 70%. As of 12 September 2009, there have been 8,851 confirmed pandemic (H1N1) 2009 cases, of which 514 have died.19
Page 23
Northern Hemisphere
In Canada, the overall influenza activity in the week ending 5 September remained similar to the previous reporting period, although ILI consultation rates were slightly higher than expected for this time of year. About 99% of all subtyped influenza viruses tested were pandemic (H1N1) 2009. As of 5 September 2009, Canada reported a total of 1,445 hospitalisations confirmed with pandemic (H1N1) 2009, of which 285 are in ICU and 74 have died. Children under 2 years of age, pregnant women, persons under 65 years with underlying medical conditions and aboriginal populations have had the highest hospitalisation rates, while the highest mortality rate was among cases aged 45 years and over. The proportion of females affected, the median age and the proportion of cases with underlying medical conditions increased with increasing severity of illness.20
In the US, influenza activity increased in the week ending 5 September 2009. The proportion of ILI outpatient visits was above the national baseline. About 97% of all subtyped influenza A viruses being reported to CDC were pandemic (H1N1) 2009 viruses. AS of 5 September there were 10,459 hospitalisations and 789 deaths associated with influenza virus infection.21
For the week ending 10 September 2009, all reporting European countries continued to report low levels of influenza activity with the exception of Sweden. Sweden reported moderate, widespread influenza activity with ILI consultation rates increasing from last reporting period to 19.3 per 100,000.22 As at 14 September, the ECDC reported 50,778 confirmed cases of pandemic (H1N1) 2009, including 136 deaths.23
In the UK, pandemic influenza activity continues to decrease across all regions in the week ending 10 September, although it remains at higher levels than expected for this time of year. The GP consultation rates decreased in England and Wales and are below the normal winter seasonal baseline thresholds. The main influenza virus circulating continues to be the pandemic (H1N1) 2009 strain, with few non-pandemic H1, H3 and B viruses detected through sentinel and non-sentinel surveillance. As at 10 September there have been 13,322 confirmed cases of pandemic (H1N1) 2009, 1885 hospitalisations and 75 deaths. The highest hospitalisation rate remains in the under 5-year age group. However, hospitalisation rates have remained low over the past week in all age groups.24
Page 24
Data considerations The information in this report is reliant on the surveillance sources available to the Department of Health and Ageing. As access to sources increase and improve, this report will be refined and additional information will be included. This report aims to increase awareness of pandemic (H1N1) 2009 and seasonal influenza in Australia by providing an analysis of the various surveillance data sources throughout Australia. While every care has been taken in preparing this report, the Commonwealth does not accept liability for any injury or loss or damage arising from the use of, or reliance upon, the content of the report. Please note, the pandemic (H1N1) 2009 and seasonal influenza elements of this report are based on data available as at 11 September 2009. Delays in the reporting of data may cause data to change retrospectively. For further details about information contained in this report please contact the Influenza Team through [email protected]. NetEpi All jurisdictions except QLD are reporting pandemic (H1N1) 2009 cases using NetEpi, a web-based outbreak case reporting system. Data from jurisdictional systems are being imported into NetEpi by VIC, NSW, WA, TAS and SA, and the remainder are entering directly into NetEpi. QLD ceased reporting into NetEpi on 6 July 2009. Analyses of Australian cases are based on clinical onset date, if this information is available. Where an onset date is not available, notification date has been used. Victorian cases use a calculated onset date which is the earliest available date calculated from specimen date, onset date, notification date or detection date. This assumption was made for all calculations and data on which the figures are based. State and Territory reporting The jurisdictions report directly to the National Incident Room, Commonwealth Department of Health and Ageing, on hospitalisations, numbers admitted to ICUs and deaths. National Notifiable Diseases Surveillance System (NNDSS) NNDSS comprises of notifications from jurisdictions of laboratory-confirmed influenza cases. Laboratory confirmed influenza is notifiable in all jurisdictions in Australia. Confirmed pandemic (H1N1) 2009 cases are being received from all jurisdictions through NNDSS except for Victoria and New South Wales. NSW is also unable to send seasonal influenza notifications data.
Laboratory Surveillance data Laboratory testing data are extracted from the ‘NSW Influenza Report,’ ‘The 2009 Victorian Influenza Vaccine Effectiveness Audit Report’ (VIDRL) and the ‘South Australian Seasonal Influenza Report’. These reports are provided weekly.
WHO Collaborating Centre for Reference & Research on Influenza (WHO CC) Data are provided weekly to the Surveillance Branch from the WHO CC.
Page 25
Sentinel General Practice Surveillance The Australian Sentinel Practices Research Network (ASPREN) has Sentinel GPs who report influenza-like-illness (ILI) presentation rates in NSW, SA, ACT, VIC, QLD, TAS and WA. As jurisdictions joined ASPREN at different times and the number of GPs reporting has changed over time, the representativeness of ASPREN data in 2009 may be different from that of previous years. ASPREN data are sent to the Surveillance Branch on a weekly basis. Northern Territory GP surveillance data are sent to the Surveillance Branch on a weekly basis. VIDRL influenza surveillance data are sent to the Surveillance Branch on a weekly basis.
A new testing protocol introduced through ASPREN requires GPs to test all patients presenting with an ILI on one day of the week. These data should provide a cross section of age, sex and severity of patients who seek GP assistance for ILI. This system is in the early stages of implementation and will be further developed over coming weeks. Sentinel Emergency Department (ED) data WA - ED surveillance data are extracted from the ‘Virus Watch’ Report. This report is provided weekly. The Western Australia Influenza Surveillance Program collects data from 8 Perth Emergency Departments (EDs). NSW - ED surveillance data are extracted from the ‘NSW Influenza Surveillance Report’. This report is provided weekly. The New South Wales Influenza Surveillance Program collects data from 49 EDs across New South Wales. SA – ED surveillance data are extracted from the ‘South Australian Seasonal Influenza Report’. This report is provided weekly. The South Australian Influenza Surveillance Program collects data from 4 EDs in South Australia. Absenteeism A national organisation provides data on the number of employees who have been on sick leave for a continuous period of more than three days. These data are not influenza or ILI specific and absenteeism may be a result of other illnesses. Mortality data Mortality data are extracted from the NSW Health ‘Weekly Influenza Epidemiology Report’ and the WA ‘Virus Watch’ Report. Paediatric hospital admissions data Reports of ICU admissions are provided to the Surveillance Branch on a weekly basis by the Australian Paediatric Surveillance Unit. APSU conducts surveillance of severe complications of influenza in children aged 15 years and under. Surveillance began on 1 June 2009.

Page 26
References 1 South Australian Seasonal Influenza Report No.16. Available from: http://www.dh.sa.gov.au/pehs/notifiable-diseases-summary/flu-resp-intro.htm. 2 Argentina Ministry of Health, Pandemic Situational Report. Available from: http://www.msal.gov.ar/htm/site/default.asp. Accessed 2 September 2009. 3 Canada Public Health Agency, Flu Watch: http://www.phac-aspc.gc.ca/fluwatch/08-09/. Accessed 2 September 2009. 4 CDC Influenza reports http://www.cdc.gov/h1n1flu/pubs/. Accessed 2 September 2009. 5 New Zealand Public Health Surveillance, Influenza Weekly Updates. Available at: http://www.surv.esr.cri.nz/virology/influenza_weekly_update.php. Accessed 2 September 2009. 6 Australian Institute of Health and Welfare (AIHW) National Hospital Morbidity Database. Available at: http://www.aihw.gov.au/hospitals/datacubes/index.cfm 7 WHO Pandemic (H1N1) 2009 update 65. Available from: http://www.who.int/csr/disease/swineflu/updates/en/index.html. Accessed 14 September 2009. 8 CDC Influenza reports http://www.cdc.gov/h1n1flu/pubs/. Accessed 14 September 2009. 9 CDC Morbidity and Mortality Weekly Report http://www.cdc.gov/mmwr/PDF/wk/mm5835.pdf. Accessed 16 September 2009. 10 CDC Influenza reports http://www.cdc.gov/h1n1flu/pubs/. Accessed 14 September 2009. 11 New Zealand Public Health Surveillance, Influenza Weekly Updates. Available at: http://www.surv.esr.cri.nz/virology/influenza_weekly_update.php. Accessed 14 September 2009 12 WHO Influenza A virus resistance to oseltamivir and other antiviral medicines, 4 June 2009. Available from: http://www.who.int/csr/disease/influenza/en/. Accessed 12 August 2009. 13 New Zealand Public Health Surveillance, Influenza Weekly Updates. Available at: http://www.surv.esr.cri.nz/virology/influenza_weekly_update.php. Accessed 14 September 2009 14 CDC Influenza reports http://www.cdc.gov/h1n1flu/pubs/. Accessed 14 September 2009. 15 WHO Pandemic (H1N1) 2009 update 65. Available from: http://www.who.int/csr/disease/swineflu/updates/en/index.html. Accessed 14 September 2009. 16 WHO Pandemic (H1N1) 2009 update 65. Available from: http://www.who.int/csr/disease/swineflu/updates/en/index.html. Accessed 14 September 2009. 17 New Zealand Public Health Surveillance, Influenza Weekly Updates. Available at: http://www.surv.esr.cri.nz/virology/influenza_weekly_update.php. Accessed 14 September 2009. 18Chile Ministry of Health, Influenza A(H1N1) Weekly Report. Available at : http://www.redsalud.gov.cl/portal/url/page/minsalcl/g_varios/influenza.html. Accessed 2 September 2009. 19 Argentina Ministry of Health, Pandemic Situational Report. Available from: http://www.msal.gov.ar/htm/site/default.asp. Accessed 2 September 2009. 20 Canada Public Health Agency, Flu Watch: http://www.phac-aspc.gc.ca/fluwatch/08-09/. Accessed 15 September 2009. 21 CDC Influenza reports http://www.cdc.gov/h1n1flu/pubs/. Accessed 14 September 2009. 22 EISS Weekly Electronic Bulletin Influenza Season 2008-2009 reports. Available from: http://ecdc.europa.eu/en/Activities/Surveillance/EISN/. Accessed 14 September 2009. 23 ECDC Daily Update - Pandemic H1N1 2009 14 Sep 2009. Available from: http://ecdc.europa.eu/en/Activities/Surveillance/EISN/. Accessed 14 September 2009. 24 HPA Pandemic Situational Update. Available from: http://www.hpa.org.uk/webw/HPAweb&Page&HPAwebAutoListName/Page/1240732817665?p=1240732817665. Accessed 14 September 2009.