australian influenza surveillance … notifications of laboratory confirmed influenza b viruses...
TRANSCRIPT

1
AUSTRALIAN INFLUENZA
SURVEILLANCE REPORT
No. 5, 2017
Reporting period 8 – 21 July 2017
The Department of Health acknowledges the providers of the many sources of data used in this report and greatly appreciates their contribution.
KEY MESSAGES Influenza activity at the national level continued to increase this reporting fortnight indicating that the
season is underway in a majority of regions across Australia. This increase in activity occurred approximately one month earlier than in 2016.
Influenza was detected at increasing levels by the majority of sentinel laboratories this reporting fortnight. For the first time since reporting for 2017 began, influenza A was the most common respiratory virus detected by a majority of sentinel laboratories, followed by respiratory syncytial virus (RSV).
Influenza A(H3N2) is currently the predominant circulating A subtype in the majority of jurisdictions. Nationally, notifications of laboratory confirmed influenza B viruses reached a plateau this reporting fortnight.
Notification rates this year to date have been highest in adults aged 85 years or older, with a secondary peak in young children, aged less than 10 years.
Influenza‐like illness (ILI) in the community and ILI presentations to sentinel GPs this fortnight continued the overall increasing trend, however remain within the range of recent seasons.
Hospitalisations with confirmed influenza have increased in recent weeks in line with the seasonal increase in community level activity.
To date, the seasonal influenza vaccines appear to be a good match for circulating virus strains.
ANALYSIS
1. Geographic Spread of Influenza Activity in Australia
In the fortnight ending 21 July 2017 (week 29), influenza activity was reported by state and territory health departments as increased when compared to the previous fortnight in all regions of Australia with the exception of the Central Australia region of the Northern Territory (NT) where activity was unchanged (Figure 1). The geographic spread of influenza activity varied across jurisdictions, but was widespread in the south eastern regions, including the Australian Capital Territory (ACT), New South Wales (NSW), the Central and Southern regions of Queensland (Qld); South Australia (SA); Tasmania (TAS) and Victoria (VIC), as well as in the Perth Metro Region of Western Australia (WA). Influenza activity was reported as regional in the Rural South region of WA; localised in the Top End region of the NT, the Tropical region of Qld and the Northwest region of WA; and sporadic in the Central Australia region of the NT.
Influenza‐like illness (ILI) activity reported from syndromic surveillance systems when compared with the previous fortnight was reported as increased in all jurisdictions, excepting QLD and WA, which remained unchanged.

2
Figure 1. Map of influenza activity by state and territory, Australia, 27 May – 21 July 2017.
2. Laboratory Confirmed Influenza Activity
Sentinel Laboratory Surveillance Influenza was detected at increasing levels by the majority of sentinel laboratories this reporting fortnight (Figure 2). The greatest increase was detected in NSW, with the percentage of tests positive for influenza increased from 18.9% in week 28 to 30.7% in week 29. The pooled unweighted percentage of tests positive for influenza across all sentinel laboratories increased from 17.8% in week 28 to 20.4% in week 29. From the sentinel laboratories where influenza subtyping was undertaken (Tasmania, Victoria Infectious Disease Reference Laboratory (VIDRL) and PathWest), influenza A(H3N2) was detected more frequently than influenza A(H1N1)pdm09.
Testing for influenza increased slightly over the reporting fortnight (Figure 3). Influenza A was reported as the most commonly detected respiratory virus this fortnight by Pathology West ICPMR, Tasmania and VIDRL, while RSV was reported as the most commonly detected respiratory virus this fortnight by SA Pathology and PathWest.

3
Figure 2. Proportion of sentinel laboratory tests positive for influenza, 1 January to 21 July 2017, by contributing laboratory or jurisdiction and month and week.
* Pooled percentage positive indicators should be interpreted with caution, noting that collectively pooled contributing laboratories are not representative of testing across Australia and individually contributing laboratories may not be representative of the jurisdiction in which they are
located.
^ Weighted according to jurisdictional population in which laboratories are located.
* The percentage of tests positive for influenza in the interseasonal period should be interpreted with caution due to small numbers of tests being undertaken in this time, resulting in high variability in the indicators.
Figure 3. Proportion of sentinel laboratory tests positive for influenza and total number of specimens tested, 1 January to 21 July 2017, by subtype and month and week.

4
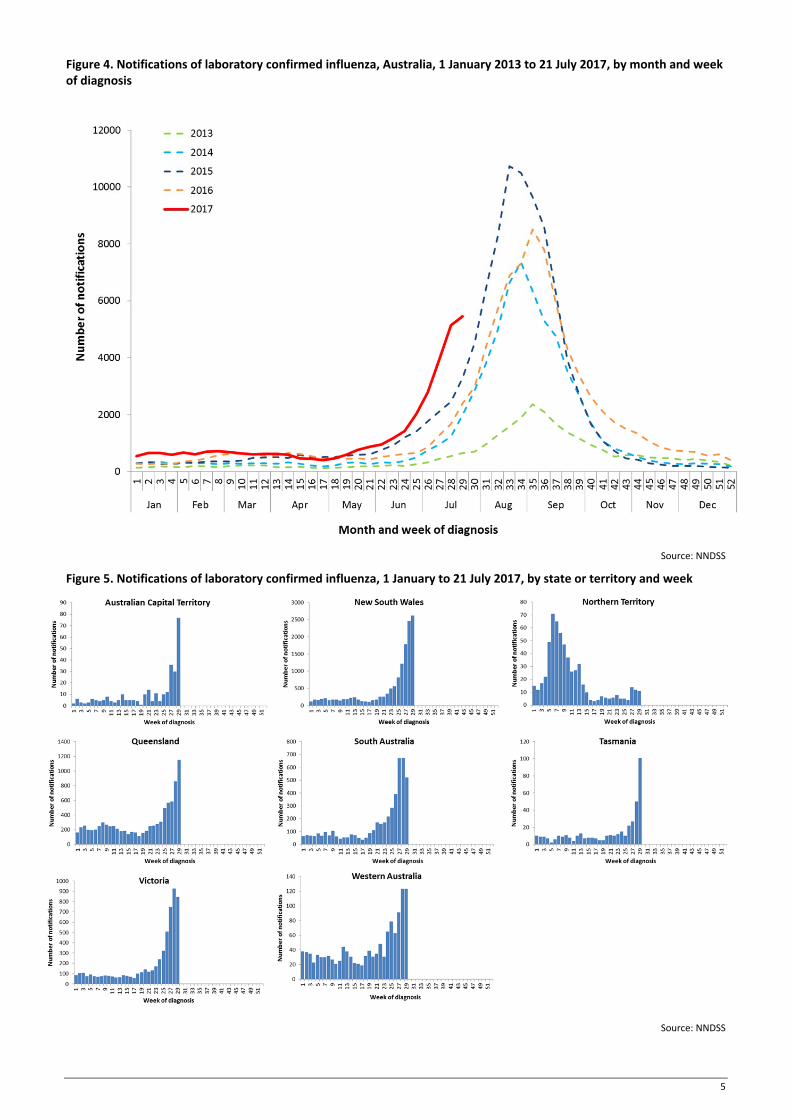
Notifications of Influenza to Health Departments Notifications of laboratory confirmed influenza to the National Notifiable Diseases Surveillance System (NNDSS) have continued to increase this reporting fortnight (Figure 4). For the year to 21 July, a total of 35,774 notifications of laboratory confirmed influenza were reported to the NNDSS: 13,986 in NSW; 8,814 in QLD; 5,698 in VIC; 4,674 in SA; 1,266 in WA; 596 in the NT; 416 in TAS and 294 in the ACT. Notifications of laboratory confirmed influenza increased in ACT, NSW, QLD, SA, TAS and WA over the reporting fortnight and remained relatively stable in NT, SA and VIC (Figure 5).
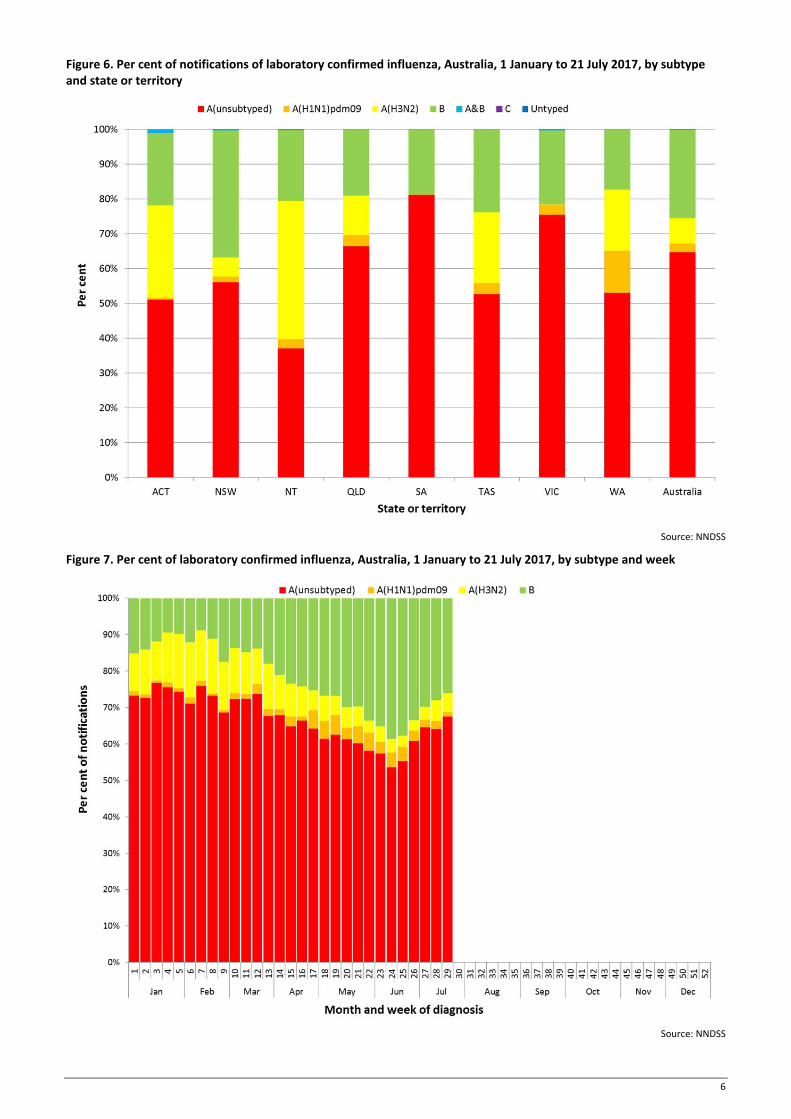
For the year to 21 July, 74% of notifications of laboratory confirmed influenza to the NNDSS were influenza A (65% A(unsubtyped), 3% influenza A(H1N1)pdm09 and 7% influenza A(H3N2)), 26% were influenza B and less than 1% were influenza A&B co‐infections or untyped (Figure 6). The proportion of all notifications year to date reported as influenza A has ranged across jurisdictions from 64% in NSW to 82% in WA. For the year to date, detections of influenza A subtypes have varied across jurisdictions also. Nationally, for every one notification of influenza A(H1N1)pdm09 reported to the NNDSS, 2.8 notifications of influenza A(H3N2) were received. This ratio has ranged from 1:0.1 in VIC to 1:14.6 in the NT. VIC is the only jurisdiction where notifications received year to date for influenza A(H1N1)pdm09 are greater than for influenza A(H3N2).
In the most recent fortnight, 73% of notifications of laboratory confirmed influenza to the NNDSS were influenza A (66% influenza A(unsubtyped), 2% influenza A(H1N1)pdm09 and 5% influenza A (H3N2)), 27% were influenza B and less than 1% were influenza A&B co‐infections or untyped (Figure 7). The proportion of all notifications this reporting fortnight reported as influenza B ranged across jurisdictions from 15% in ACT to 34% in NSW and TAS. The number of influenza B notifications reached a plateau this fortnight, while influenza B as a proportion of all notifications continued to decline over the fortnight from 28% in week 28 to 26% in week 29 (Figure 7 and Figure 8).
So far in 2017, notification rates have tended to increase with increasing age. Age‐specific notification rates of influenza overall have been highest in adults aged 85 years or older (391.7 notifications per 100,000), with a secondary smaller peak in children aged 5‐9 years (225.3 per 100,000), closely followed by rates in children aged 0‐4 years (223.9 per 100,000) (Figure 9). Influenza A(H1N1)pdm09 was highest in children aged less than 5 years (10.6 per 100,000), influenza A(H3N2) was highest in the elderly aged 85 years and older (51 per 100,000) and influenza B was highest in children aged 5 to 9 years (96.6 notifications per 100,000 population).
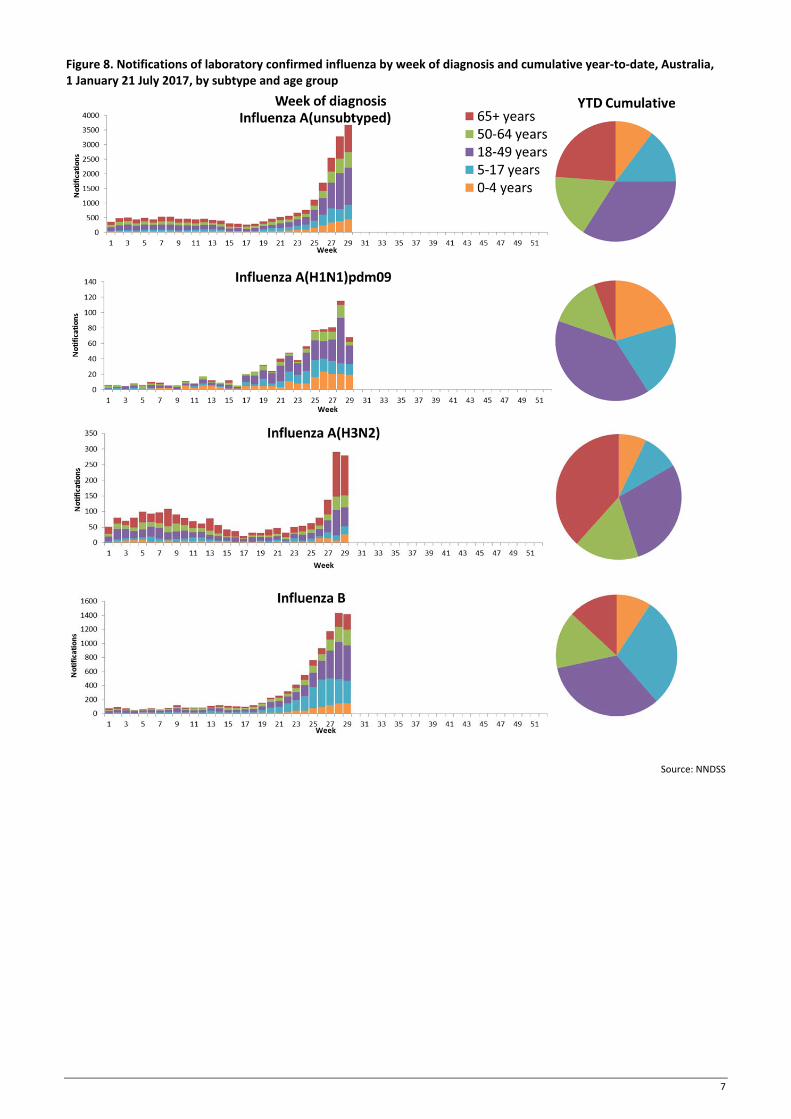
Increases in notifications have been seen across the majority of broad age groups this reporting fortnight, while notifications in the 5‐17 years group have remained steady (Figure 10). The distribution of influenza types and subtypes differed across age groups, with 42% of 5‐17 year olds notified with influenza being detected with influenza B, while only 15% of adults aged 65 years and older detected with influenza B. While influenza A(H3N2) is detected across all age groups, it accounted for a greater proportion of influenza A, where subtyping is available in adults aged 65 years or older, than in any other age group.
5
Figure 4. Notifications of laboratory confirmed influenza, Australia, 1 January 2013 to 21 July 2017, by month and week of diagnosis
Source: NNDSS
Figure 5. Notifications of laboratory confirmed influenza, 1 January to 21 July 2017, by state or territory and week
Source: NNDSS
6
Figure 6. Per cent of notifications of laboratory confirmed influenza, Australia, 1 January to 21 July 2017, by subtype and state or territory
Source: NNDSS
Figure 7. Per cent of laboratory confirmed influenza, Australia, 1 January to 21 July 2017, by subtype and week
Source: NNDSS
7
Figure 8. Notifications of laboratory confirmed influenza by week of diagnosis and cumulative year‐to‐date, Australia, 1 January 21 July 2017, by subtype and age group
Source: NNDSS

8
Figure 9. Rate of notifications of laboratory confirmed influenza, Australia, 1 January to 21 July 2017, by age group and subtype
Source: NNDSS

9
Figure 10. Notifications of laboratory confirmed influenza by week of diagnosis and cumulative year‐to‐date, Australia, 1 January to 21 July 2017, by age group and subtype
Source: NNDSS

10
2. Influenza‐like Illness Activity
Community Level Surveillance FluTracking, a national online system for collecting data on ILI in the community, indicated that rates of ILI among participants remained at low levels this reporting fortnight (Figure 11). ILI activity among participants, reported as fever and cough, decreased slightly from week 28 (2.3%) to 29 (2.1%). So far this year 62.5% of all participants and 80.2% of participants who identify as working face‐to‐face with patients reported receiving the seasonal influenza vaccine.1
Figure 11. Proportion of fever and cough among FluTracking participants, Australia, between May and October, 2013 to 2017, by month and week
Source: FluTracking
Sentinel General Practice Surveillance Sentinel general practitioner ILI consultations have remained steady this fortnight but continued the overall increasing trend, with 8.1 per 1,000 consultations in week 28 and 9.2 per 1,000 consultations in week 29 (Figure 12). ILI consultations in the last fortnight are within the range of recent seasons for this time of year.
Of the 133 specimens taken from ILI patients seen by Australian Sentinel Practices Research Network (ASPREN) sentinel practitioners during the current reporting fortnight, influenza was the most common respiratory virus detected (n=44, 33.1%), consisting of 24 samples positive for A(unsubtyped), 3 samples positive for A(H3N2), 2 samples positive for A(H1N1) and 15 positive for influenza B (Figure 13). While influenza was the most common respiratory virus detected this fortnight, rhinovirus was the most common non‐influenza virus detected, representing 11.3% of tests processed.

11
Figure 12. Unweighted rate of ILI reported from sentinel GP surveillance systems, Australia, 1 January 2013 to 23 July 2017, by month and week
Source: ASPREN and VicSPIN
Figure 13. Proportion of respiratory viral tests positive for influenza in ASPREN ILI patients and ASPREN ILI consultation rate, Australia, 1 January to 23 July 2017, by month and week
Source: ASPREN
12
3. Hospitalisations
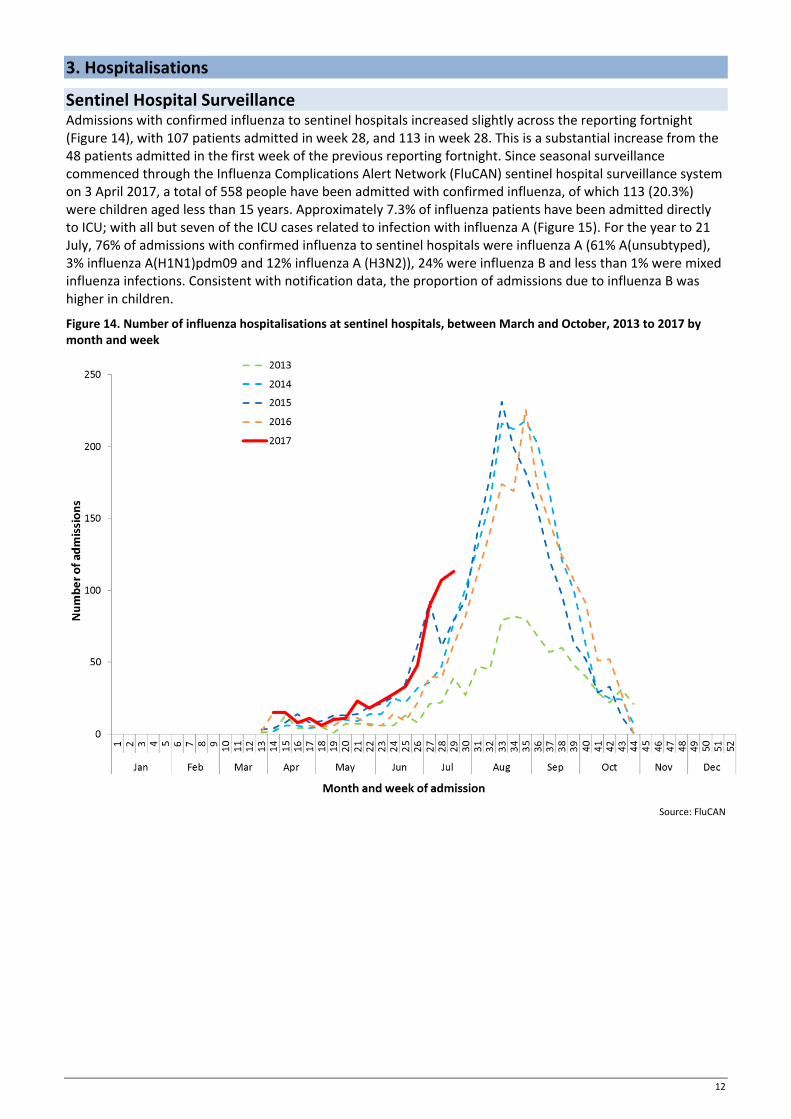
Sentinel Hospital Surveillance Admissions with confirmed influenza to sentinel hospitals increased slightly across the reporting fortnight (Figure 14), with 107 patients admitted in week 28, and 113 in week 28. This is a substantial increase from the 48 patients admitted in the first week of the previous reporting fortnight. Since seasonal surveillance commenced through the Influenza Complications Alert Network (FluCAN) sentinel hospital surveillance system on 3 April 2017, a total of 558 people have been admitted with confirmed influenza, of which 113 (20.3%) were children aged less than 15 years. Approximately 7.3% of influenza patients have been admitted directly to ICU; with all but seven of the ICU cases related to infection with influenza A (Figure 15). For the year to 21 July, 76% of admissions with confirmed influenza to sentinel hospitals were influenza A (61% A(unsubtyped), 3% influenza A(H1N1)pdm09 and 12% influenza A (H3N2)), 24% were influenza B and less than 1% were mixed influenza infections. Consistent with notification data, the proportion of admissions due to influenza B was higher in children.
Figure 14. Number of influenza hospitalisations at sentinel hospitals, between March and October, 2013 to 2017 by month and week
Source: FluCAN

13
Figure 15. Number of influenza hospitalisations at sentinel hospitals by subtype and ICU admission, 3 April to 21 July 2017, by month and week
Source: FluCAN
Paediatric Severe Complications of Influenza The Australian Paediatric Surveillance Unit (APSU) conducts seasonal surveillance between June and September annually of children aged 15 years and under who are hospitalised with severe complications of influenza. Since seasonal surveillance commenced through APSU on 1 July to 23 July 2017, there have been a total of four hospitalisations associated with severe complications of influenza reported. All cases were female, with an age range of 2 to 7 years. Half were reported as influenza A and half due to influenza B. Vaccination status was known for two of the patients, with both being not vaccinated against influenza. All four patients were discharged with no ongoing problems.
4. Deaths Associated with Influenza and Pneumonia
Nationally Notified Influenza Associated Deaths So far in 2017, 27 influenza associated deaths have been notified to the NNDSS. The majority of deaths were due to influenza A (78%, n = 21). The median age of deaths notified was 75 years (range 13 to 97 years). The number of influenza associated deaths reported to the NNDSS is reliant on the follow up of cases to determine the outcome of their infection and most likely does not represent the true mortality associated with this disease.
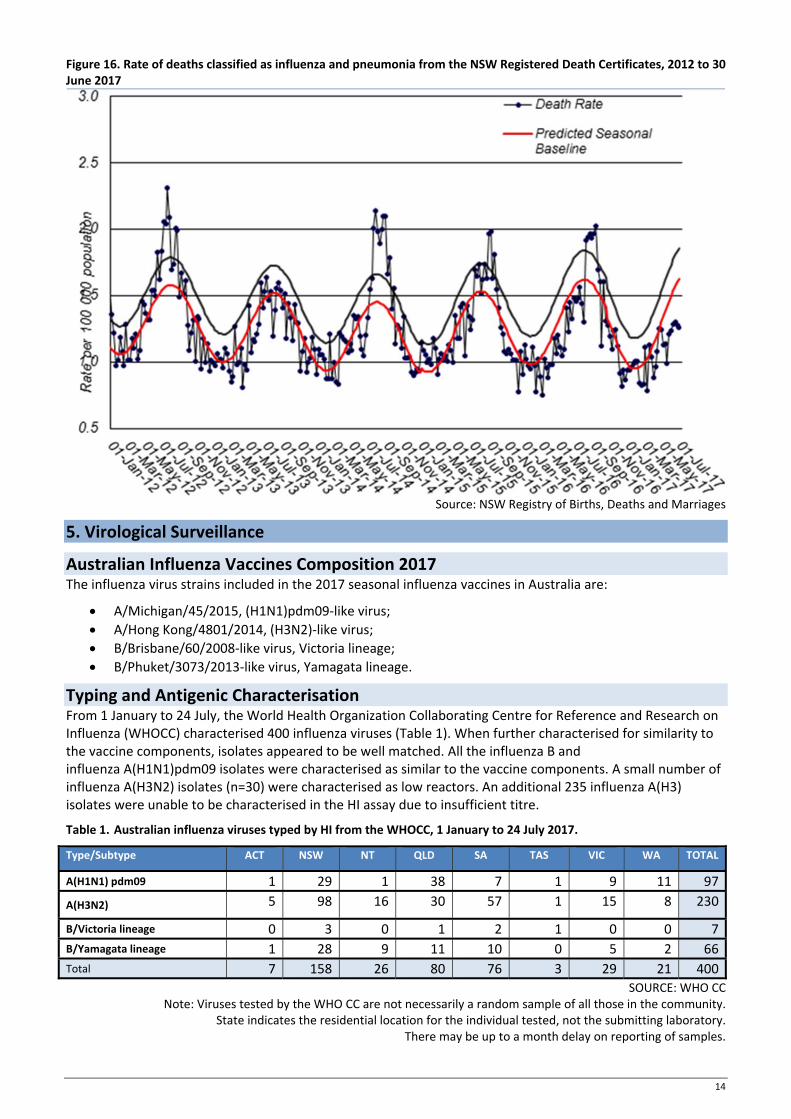
New South Wales Influenza and Pneumonia Death Registrations Death registration data from NSW for the week ending 30 June 2017 show that there were 1.26 “pneumonia and influenza” deaths per 100,000 NSW population, which was below the epidemic threshold of 1.86 per 100,000 NSW population (Figure 16).2
14
Figure 16. Rate of deaths classified as influenza and pneumonia from the NSW Registered Death Certificates, 2012 to 30 June 2017
Source: NSW Registry of Births, Deaths and Marriages
5. Virological Surveillance
Australian Influenza Vaccines Composition 2017 The influenza virus strains included in the 2017 seasonal influenza vaccines in Australia are:
A/Michigan/45/2015, (H1N1)pdm09‐like virus;
A/Hong Kong/4801/2014, (H3N2)‐like virus;
B/Brisbane/60/2008‐like virus, Victoria lineage;
B/Phuket/3073/2013‐like virus, Yamagata lineage.
Typing and Antigenic Characterisation From 1 January to 24 July, the World Health Organization Collaborating Centre for Reference and Research on Influenza (WHOCC) characterised 400 influenza viruses (Table 1). When further characterised for similarity to the vaccine components, isolates appeared to be well matched. All the influenza B and influenza A(H1N1)pdm09 isolates were characterised as similar to the vaccine components. A small number of influenza A(H3N2) isolates (n=30) were characterised as low reactors. An additional 235 influenza A(H3) isolates were unable to be characterised in the HI assay due to insufficient titre.
Table 1. Australian influenza viruses typed by HI from the WHOCC, 1 January to 24 July 2017.
Type/Subtype ACT NSW NT QLD SA TAS VIC WA TOTAL
A(H1N1) pdm09 1 29 1 38 7 1 9 11 97
A(H3N2) 5 98 16 30 57 1 15 8 230
B/Victoria lineage 0 3 0 1 2 1 0 0 7
B/Yamagata lineage 1 28 9 11 10 0 5 2 66
Total 7 158 26 80 76 3 29 21 400
SOURCE: WHO CC Note: Viruses tested by the WHO CC are not necessarily a random sample of all those in the community.
State indicates the residential location for the individual tested, not the submitting laboratory. There may be up to a month delay on reporting of samples.

15
Antiviral Resistance The WHOCC reported that from 1 January to 24 July 2017, of the 599 influenza viruses tested for neuraminidase inhibitor resistance, one sample of influenza A(H1N1) demonstrated reduced inhibition to the antiviral drug Zanamivir.
6. International Surveillance The World Health Organization reported that based on data up to 9 July, in the temperate zone of the southern hemisphere, high levels of influenza activity continue to be reported, with some countries in Central America, the Caribbean and South East Asia also reporting increased influenza activity.3 Influenza activity in the temperate zone of the northern hemisphere was reported at low levels. Worldwide, influenza A(H3N2) and B viruses co‐circulated.
DATA CONSIDERATIONS The NNDSS data provided were extracted on 26 July 2017. Due to the dynamic nature of the NNDSS, data in this report is subject to retrospective revision and may vary from data reported in published NNDSS reports and reports of notification data by states and territories. Detailed notes on interpreting the data presented in this report are available at the Department of Health’s Australian Influenza Surveillance Report website (www.health.gov.au/flureport).
The Australian Influenza Surveillance Report and Activity Updates are compiled from a number of data sources, which are used to monitor influenza activity and severity in the community. These data sources include laboratory‐confirmed notifications to the NNDSS; influenza associated hospitalisations; sentinel influenza‐like illness (ILI) reporting from general practitioners and emergency departments; and community level surveys; and sentinel laboratory testing results. The information in this report is reliant on the surveillance sources available to the Department of Health at the time of production.
While every care has been taken in preparing this report, the Commonwealth does not accept liability for any injury or loss or damage arising from the use of, or reliance upon, the content of the report. Delays in the reporting of data may cause data to change retrospectively. For further details about information contained in this report please contact the Influenza Surveillance Team ([email protected]).
REFERENCES
1 FluTracking, FluTracking Weekly Interim Report, Week ending 23 July 2017. Available from FluTracking Reports (http://www.flutracking.net/Info/Reports) [Accessed 26 July 2017].
2 Personal communication, Robin Gilmour, Health Protection NSW, NSW Minister of Health, 28 July 2017.
3 WHO, Influenza Update No. 294, 24 July 2017. Available from the WHO website (http://www.who.int/influenza/surveillance_monitoring/updates/latest_update_GIP_surveillance/en/) [Accessed 12 July 2017].