australian labour force participation: historical trends
TRANSCRIPT

Australian labour force participation: historical trends and
future prospects
Linus Gustafsson1
Treasury Working Paper2
2021-02
Date created: April 2021
Date modified: April 2021
1 Macroeconomic Analysis and Policy Division, The Treasury, Langton Crescent, Parkes ACT 2600, Australia. Correspondence:
Linus Gustafsson, [email protected]. I thank Michael Kouparitsas for his ongoing support and guidance throughout the work on this paper. I also thank Jeff Borland for his comments on drafts of this paper and for sharing his knowledge of the existing literature and developments in the Australian labour market over recent decades. Finally, I thank John Breusch, Louise Lilley and participants at various seminars and conferences, including Treasury’s Macroeconomic Group Seminar, Treasury’s Expert Panel on Macroeconomic Modelling, and the 2018 Australian Conference of Economists for comments and suggestions.
2 The views expressed in this paper are those of the author and do not necessarily reflect those of The Australian Treasury or the Australian Government.
© Commonwealth of Australia 2021
ISBN 978-1-925832-28-0
This publication is available for your use under a Creative Commons BY Attribution 3.0 Australia licence, with the exception of the Commonwealth Coat of Arms, the Treasury logo, photographs, images, signatures and where otherwise stated. The full licence terms are available from http://creativecommons.org/licenses/by/3.0/au/legalcode.
Use of Treasury material under a Creative Commons BY Attribution 3.0 Australia licence requires you to attribute the work (but not in any way that suggests that the Treasury endorses you or your use of the work).
Treasury material used 'as supplied'
Provided you have not modified or transformed Treasury material in any way including, for example, by changing the Treasury text; calculating percentage changes; graphing or charting data; or deriving new statistics from published Treasury statistics — then Treasury prefers the following attribution:
Source: The Australian Government the Treasury
Derivative material
If you have modified or transformed Treasury material, or derived new material from those of the Treasury in any way, then Treasury prefers the following attribution:
Based on The Australian Government the Treasury data
Use of the Coat of Arms
The terms under which the Coat of Arms can be used are set out on the It’s an Honour website (see www.itsanhonour.gov.au)
Other uses
Enquiries regarding this licence and any other use of this document are welcome at:
Manager Media Unit The Treasury Langton Crescent Parkes ACT 2600 Email: [email protected]
iii
Australian labour force participation: Historical trends and future prospects Linus Gustafsson 2021-02 29 April 2021
Abstract
Over the past 40 years, Australia has experienced significant changes to the proportion of the population that is attached to its labour market. From the early 1980s, the aggregate labour force participation rate rose steadily, climbing from around 60 per cent in 1983 to almost 66 per cent in 2011. Underlying this long-term increase in the aggregate participation rate are opposing developments for males and females. The male participation rate fell from close to 80 per cent in the late 1970s to just above 70 per cent in recent years. Yet this decline in male participation rates over this period has been more than offset by an increase in female participation rates. Since the 1970s, the female participation rate has increased by more than 15 percentage points. This paper studies these developments through the lens of an age- and cohort-based framework and uses the estimated model to analyse historical trends and the implications of these past developments for future participation rate trends in Australia.
JEL Classification Numbers: E17, E24, E27, J21, J22 Keywords: Labour force, Labour Force Composition, Labour Force Demographics, Size of Labour Force, Labour Force Participation, Labour Supply
Linus Gustafsson Macroeconomic Analysis and Policy Division Macroeconomic Group The Treasury Langton Crescent Parkes ACT 2600
iv
Contents
ABSTRACT ................................................................................................................................... iii
1. INTRODUCTION ...................................................................................................................... 1
2. LABOUR FORCE PARTICIPATION MODEL ......................................................................... 4
3. DATA ........................................................................................................................................ 6
3.1 Labour force participation rates ............................................................................................. 6
3.2 Other covariates ................................................................................................................... 11
4. ECONOMETRIC METHOD .................................................................................................... 17
4.1 Separating the life cycle into stages of life ........................................................................... 17
4.2 Treatment of recent cohorts ................................................................................................. 18
4.3 Multiplicative versus additive specification........................................................................... 19
5. RESULTS ............................................................................................................................... 21
5.1 Male age and cohort effects ................................................................................................. 21
5.2 Female age and cohort effects ............................................................................................ 23
5.3 Educational attendance........................................................................................................ 24
5.4 Number of children born....................................................................................................... 25
6. PROJECTIONS ...................................................................................................................... 27
6.1 Assumptions ......................................................................................................................... 27
6.2 Projections ........................................................................................................................... 28
7. CONCLUSION........................................................................................................................ 31
References .................................................................................................................................... 32
APPENDIX A: AGE-SPECIFIC PARTICIPATION RATE PROJECTIONS ................................ 34
APPENDIX B: DATA ................................................................................................................... 37
Participation rates .......................................................................................................................... 37
Educational attendance rates ........................................................................................................ 37
Fertility rates .................................................................................................................................. 37
1
1. Introduction
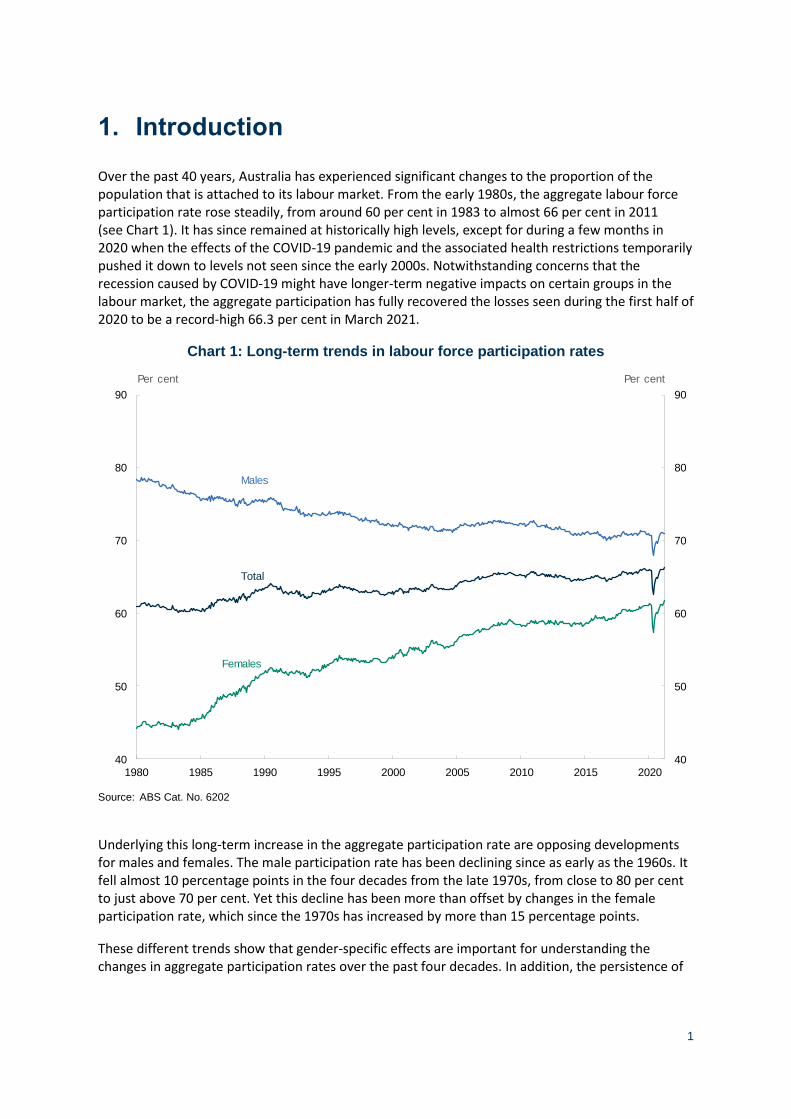
Over the past 40 years, Australia has experienced significant changes to the proportion of the population that is attached to its labour market. From the early 1980s, the aggregate labour force participation rate rose steadily, from around 60 per cent in 1983 to almost 66 per cent in 2011 (see Chart 1). It has since remained at historically high levels, except for during a few months in 2020 when the effects of the COVID-19 pandemic and the associated health restrictions temporarily pushed it down to levels not seen since the early 2000s. Notwithstanding concerns that the recession caused by COVID-19 might have longer-term negative impacts on certain groups in the labour market, the aggregate participation has fully recovered the losses seen during the first half of 2020 to be a record-high 66.3 per cent in March 2021.
Chart 1: Long-term trends in labour force participation rates
Source: ABS Cat. No. 6202
Underlying this long-term increase in the aggregate participation rate are opposing developments for males and females. The male participation rate has been declining since as early as the 1960s. It fell almost 10 percentage points in the four decades from the late 1970s, from close to 80 per cent to just above 70 per cent. Yet this decline has been more than offset by changes in the female participation rate, which since the 1970s has increased by more than 15 percentage points.
These different trends show that gender-specific effects are important for understanding the changes in aggregate participation rates over the past four decades. In addition, the persistence of
40
50
60
70
80
90
40
50
60
70
80
90
1980 1985 1990 1995 2000 2005 2010 2015 2020
Per centPer cent
Males
Total
Females
Australian labour force participation: Historical trends and future prospects
2
these trends suggests that younger male generations are less likely to participate in the labour force than older ones, with the opposite being true for females.
In this paper we use an age- and cohort-based econometric model to identify “age effects” and “cohort effects”. The age effects capture how the participation rate typically follows a familiar profile through life – starting low during school age, peaking around middle age, and tapering towards retirement. The cohort effect captures how these profiles shift up or down from one birth cohort to another – for instance, how women born in 1955 have lower lifetime workforce participation than women born in 1975. These two effects provide different insights into the drivers of aggregate participation trends: age effects capture the contribution of a changing demographic structure; cohort effects capture the contribution of differences in the propensity to participate between generations.
This approach provides a fresh way to think about future prospects for aggregate participation rates. The usual way to do so, at least in the Australian context, is to produce projections for separate age groups – say those aged 45 or 55 – and then aggregate those using demographic projections. However, the age- and cohort-based model adopted in this paper lends itself to thinking about participation in a different way – that is, from the perspective of individuals who make decisions about the amount of labour they supply at different stages of their lives. This so-called lifecycle approach makes better use of the information available in the data because it explicitly incorporates the fact that cohorts move through the age structure over time.
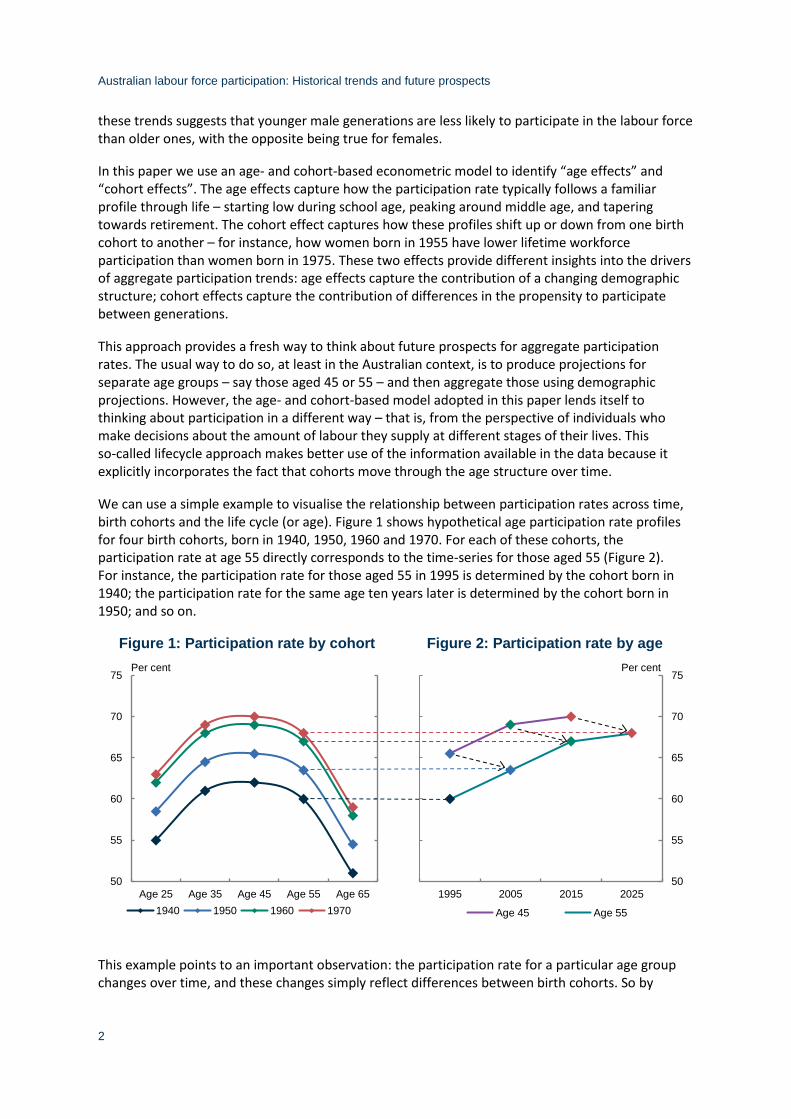
We can use a simple example to visualise the relationship between participation rates across time, birth cohorts and the life cycle (or age). Figure 1 shows hypothetical age participation rate profiles for four birth cohorts, born in 1940, 1950, 1960 and 1970. For each of these cohorts, the participation rate at age 55 directly corresponds to the time-series for those aged 55 (Figure 2). For instance, the participation rate for those aged 55 in 1995 is determined by the cohort born in 1940; the participation rate for the same age ten years later is determined by the cohort born in 1950; and so on.
Figure 1: Participation rate by cohort
Figure 2: Participation rate by age
This example points to an important observation: the participation rate for a particular age group changes over time, and these changes simply reflect differences between birth cohorts. So by
50
55
60
65
70
75
Age 25 Age 35 Age 45 Age 55 Age 65
Per cent
1940 1950 1960 1970
50
55
60
65
70
75
1995 2005 2015 2025
Per cent
Age 45 Age 55
Australian labour force participation: Historical trends and future prospects
3
analysing time-series data on participation rates by age, it should be possible to identify differences in participation rates between cohorts – that is, the cohort effects.
Following its introduction in this context by Aaronson et al. (2006), who study the decline in the labour force participation rate in the US in the first half of the 2000s, the age-cohort approach has become commonplace. Their findings attributed much of the decline to cohort effects. They interpreted this as suggesting that it was a structural (or a trend) rather than cyclical decline. A number of later studies have suggested improvements to the model and also extended the analysis to additional countries. For example, Grigoli et al. (2018) applied this approach to 17 advanced economies and then used the results together with demographic projections to project labour force participation rates for these countries out to 2050. The US Congressional Budget Office (CBO) has also adopted a similar (but more disaggregated) approach for their labour force participation rate projections (Montes 2018).
The main contribution of this paper is to apply a modified version of the CBO approach to Australian data. Adopting this approach allows us to develop a framework that not only fits historical data well but that can produce plausible projections of future participation rates informed by these historical developments. A second contribution is that we estimate the model separately for full-time and part-time participation rates. This allows us to provide additional detail about the outlook for aggregate labour supply than would be the case if we only looked at total participation rates.
It is important to note that the aim of this paper is not to estimate a structural behavioural model of labour supply decisions that can be used to make statements about the causal drivers of changes to participation rates. Instead, the aim is to estimate a reduced form model that can capture historical developments in participation rates for different groups and to identify meaningful and stable relationships that can be used to make informed and plausible predictions about the future. Given this aim, we have adopted a pragmatic and flexible model specification that works for the stated purpose. In doing so, we have had to deviate from the theoretically elegant pure lifecycle model to come up with a specification that can produce plausible projections. These choices are all presented in a transparent way in this paper. And given that the work presented in this paper represents a first attempt (at least to the best of our knowledge) at using this type of age-cohort framework for detailed participation rate projections in the Australian context we anticipate that future developments, including the availability of new and improved data sources, will allow us to move towards the theoretically elegant lifecycle framework.
The remainder of the paper is as follows: Section 2 describes the labour force participation model used in the paper; Section 3 introduces the data used in the estimation; Section 4 describes the econometric method; Section 5 presents the estimation results; Section 6 presents a set of projections produced using the framework and the paper concludes with Section 7 which summarises the main findings and suggestions for future work.
Australian labour force participation: Historical trends and future prospects
4
2. Labour force participation model
The econometric methodology in this paper is based on Montes (2018). In this approach, the labour force participation rate for a specific age group denoted by a is a function of unobserved fixed age and cohort effects and set of observed variables that are assumed to affect participation rates:
𝑓(𝑃𝑡𝑎) = 𝑓(𝛾𝑎) + ∑ 𝑓(𝛽𝑠
𝑏)
𝑏
𝐼(𝑡, 𝑎, 𝑏) + 𝜆𝑎𝑓(𝑋𝑡) + 𝜀𝑡𝑎
where 𝑃𝑡𝑎 is the participation rate for age group 𝑎 at time 𝑡, 𝛾𝑎 is the age effect, 𝐼(𝑡, 𝑎, 𝑏) indicates
the proportion of the cohort that was born in year 𝑏 and is in age group 𝑎 at time 𝑡, 𝛽𝑠𝑏 is the cohort
effect in stage of life 𝑠 and 𝑋𝑡 is a vector of other covariates with coefficient vector a. We adopt two different functional forms (levels and logarithms) denoted by f( ).
Consistent with the CBO, we have also separated the life-cycle into a number of stages of life. The below discussion of the intuition behind and interpretation of the different effects has been written in the context of a complete life cycle, but applies equally to a stage of life.
The cohort effects 𝛽𝑠𝑏 are identified by the restriction that they are equal across the birth cohort’s
stage of life (that is, it is the same in each equation that a given cohort is observed in for a specific age range). There are no other cross-equation restrictions. Without loss of generality the cohort effect is normalised (with the normalisation dependent on the specific functional form) for a given cohort (the ‘reference cohort’). This normalisation means that we can interpret the age effects as representing the average life-time participation rate profile for that cohort (assuming that all other covariates for that cohort would have been equal to their sample means). It then follows that the cohort effects determine the propensity to participate throughout a stage of life for each cohort relative to the reference cohort.
We construct five-year wide birth cohorts because the participation rate data are only available by five-year age groups. This means that the proportion of a cohort that is in an age group varies from 0.05 in the first (and last) quarter that the cohort overlaps with that age group to 1 when they fully overlap.
We also de-mean each of the covariates over the estimation period. This is necessary in order to maintain the interpretation of the age effects.
Below we discuss the intuition behind each set of variables. We also visualise the effects associated with each of them by illustrating how they can be mapped into the life-cycle (or stage of life) participation rate profile for a given cohort.
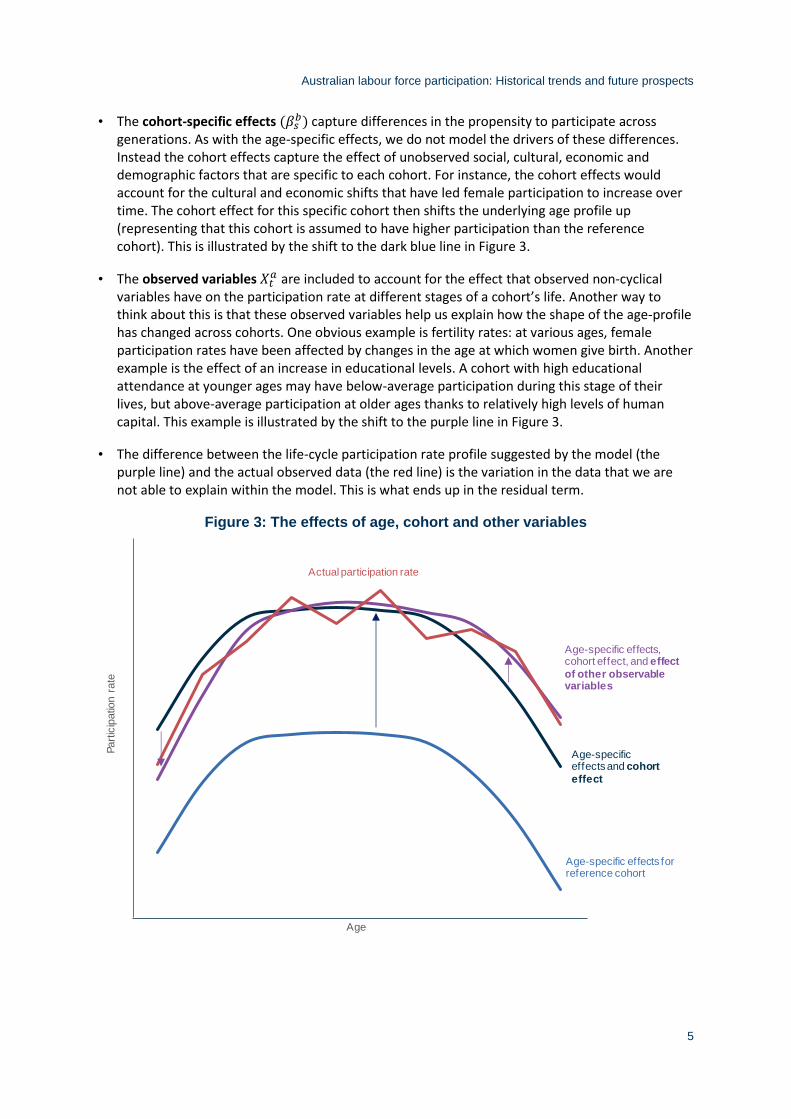
• The age-specific effects (𝛾𝑎) capture the systematic way in which participation varies with age. This is different to explicitly modelling participation decisions at different ages. Instead, the age-specific effects capture the underlying structural factors that cause systematic variations in labour supply decisions throughout an individual’s life. The age-specific effects are assumed to be common across all birth cohorts. This means they describe an underlying age profile that would be shared by all generations if there were no differences in other determinants of participation. The underlying age profile is given by the set of age-specific effects. This is shown by the bottom light blue line in Figure 3.
Australian labour force participation: Historical trends and future prospects
5
• The cohort-specific effects (𝛽𝑠𝑏) capture differences in the propensity to participate across
generations. As with the age-specific effects, we do not model the drivers of these differences. Instead the cohort effects capture the effect of unobserved social, cultural, economic and demographic factors that are specific to each cohort. For instance, the cohort effects would account for the cultural and economic shifts that have led female participation to increase over time. The cohort effect for this specific cohort then shifts the underlying age profile up (representing that this cohort is assumed to have higher participation than the reference cohort). This is illustrated by the shift to the dark blue line in Figure 3.
• The observed variables 𝑋𝑡𝑎 are included to account for the effect that observed non-cyclical
variables have on the participation rate at different stages of a cohort’s life. Another way to think about this is that these observed variables help us explain how the shape of the age-profile has changed across cohorts. One obvious example is fertility rates: at various ages, female participation rates have been affected by changes in the age at which women give birth. Another example is the effect of an increase in educational levels. A cohort with high educational attendance at younger ages may have below-average participation during this stage of their lives, but above-average participation at older ages thanks to relatively high levels of human capital. This example is illustrated by the shift to the purple line in Figure 3.
• The difference between the life-cycle participation rate profile suggested by the model (the purple line) and the actual observed data (the red line) is the variation in the data that we are not able to explain within the model. This is what ends up in the residual term.
Figure 3: The effects of age, cohort and other variables
Part
icip
atio
n r
ate
Age
Age-specific effects for reference cohort
Age-specific effects and cohort
effect
Age-specific effects, cohort effect, and effect
of other observable variables
Actual participation rate
Australian labour force participation: Historical trends and future prospects
6
3. Data
The discussion above summarises the conceptual framework and methodology we will use to understand the relationship between participation rates for different ages, birth cohorts, and over time. Before moving on to our empirical investigation, we present some historical developments in participation rates for males and females, and in terms of full-time and part-time work. We will also examine two variables – the fertility rate and educational attendance – that we believe have influenced the participation rate. For the data discussed in this section, further detail about definitions and data sources is provided in Appendix B.
3.1 Labour force participation rates
Our data set spans 43 years from 1978 to 2020. The data covers 11 five-age groups from 15 to 69 and a group that is 70 and over. Participation rates for males and females are modelled separately to account for the significant historical differences between these two groups. These gender splits are further divided into full-time and part-time because we want to incorporate information on not only the binary choice between participating or not participating but also the number of hours that people are willing to supply. We also divide the life cycle into three stages of life.
Total male and female participation rates
In this sub-section, we present the participation rate age profiles by cohort separately for females and males. These profiles are derived from the time-series data on participation rates by age, by tracking different birth cohorts as they move between different age groups. Note that because the time series data only covers 43 years it is not possible to derive any complete life-cycle profiles. In line with our conceptual framework, we will first discuss these profiles in terms of the general pattern over the life cycle (the age effects). We then consider how the level and shape of the profiles has changed over time, representing cohort effects as well as the effect of other variables. In all age profile charts used in this paper, the colours of the different cohort profiles are used to represent the birth year of the cohort, with the darkest red lines representing the earliest cohorts and blue lines representing the most recent cohorts. The colours are also consistent across different variables. This means that if you look at, for example, a specific cohort profile for female participation, you can easily identify the fertility rate for the same cohort by the colour of the line. The charts also show the most recently observed values at each age (labeled ‘Latest at age’).
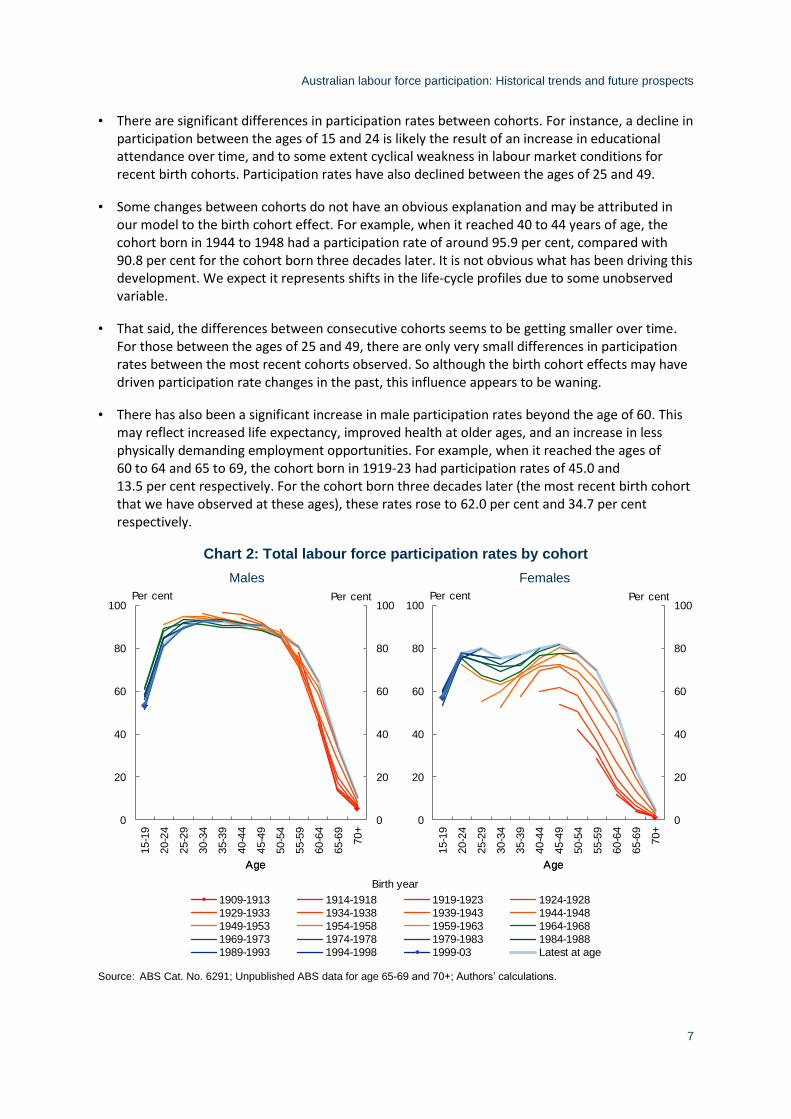
• We start by discussing the data for males, because the relative stability of male participation rates over time makes it easier to introduce the relationship between the data and our conceptual framework. From the cohort life-cycle profiles for males (Chart 2), we make a number of observations. Participation rates vary in a systematic manner over the life cycle, following an inverted U-shape. The age-specific effects in the conceptual framework are intended to capture this general profile. The general life-cycle pattern can be roughly divided into four stages: 1) participation rates start low at age of 15 and increase sharply over the next 10 years or so, as many individuals finish school and university and enter the labour market; 2) high and stable participation rates throughout most of the prime working age (age 25 to 49); 3) a gradual decline in participation rates for males in their 50s; and 4) sharply falling participation rates as males enter their 60s and increasingly retire.
Australian labour force participation: Historical trends and future prospects
7
• There are significant differences in participation rates between cohorts. For instance, a decline in participation between the ages of 15 and 24 is likely the result of an increase in educational attendance over time, and to some extent cyclical weakness in labour market conditions for recent birth cohorts. Participation rates have also declined between the ages of 25 and 49.
• Some changes between cohorts do not have an obvious explanation and may be attributed in our model to the birth cohort effect. For example, when it reached 40 to 44 years of age, the cohort born in 1944 to 1948 had a participation rate of around 95.9 per cent, compared with 90.8 per cent for the cohort born three decades later. It is not obvious what has been driving this development. We expect it represents shifts in the life-cycle profiles due to some unobserved variable.
• That said, the differences between consecutive cohorts seems to be getting smaller over time. For those between the ages of 25 and 49, there are only very small differences in participation rates between the most recent cohorts observed. So although the birth cohort effects may have driven participation rate changes in the past, this influence appears to be waning.
• There has also been a significant increase in male participation rates beyond the age of 60. This may reflect increased life expectancy, improved health at older ages, and an increase in less physically demanding employment opportunities. For example, when it reached the ages of 60 to 64 and 65 to 69, the cohort born in 1919-23 had participation rates of 45.0 and 13.5 per cent respectively. For the cohort born three decades later (the most recent birth cohort that we have observed at these ages), these rates rose to 62.0 per cent and 34.7 per cent respectively.
Chart 2: Total labour force participation rates by cohort
Males
Females
Source: ABS Cat. No. 6291; Unpublished ABS data for age 65-69 and 70+; Authors’ calculations.
0
20
40
60
80
100
0
20
40
60
80
100
15-1
9
20-2
4
25-2
9
30-3
4
35-3
9
40-4
4
45-4
9
50-5
4
55-5
9
60-6
4
65-6
9
70+
Per cent
AgeAge
Per cent
0
20
40
60
80
100
0
20
40
60
80
100
15-1
9
20-2
4
25-2
9
30-3
4
35-3
9
40-4
4
45-4
9
50-5
4
55-5
9
60-6
4
65-6
9
70+
Per cent
AgeAge
Per cent
Birth year
1909-1913 1914-1918 1919-1923 1924-1928
1929-1933 1934-1938 1939-1943 1944-1948
1949-1953 1954-1958 1959-1963 1964-1968
1969-1973 1974-1978 1979-1983 1984-1988
1989-1993 1994-1998 1999-03 Latest at age
Australian labour force participation: Historical trends and future prospects
8
The participation profiles for females show some similarities to those for men, though also some notable differences.
• As with men, female participation varies in a systematic manner over the life cycle – though this time following an M-shape rather than male’s inverted U-shape. Similar to males, females increase their participation sharply between the ages of 15 and 24. But females then reduce their participation over the 15- to 20-year period during which it is most common to raise children. Most females then appear to return to the labour market, and by the age of 40 to 44 the participation rate has generally recovered to the level observed when aged 20 to 24. Participation rates are then stable over the next 10 years, before decreasing as the retirement age is approaching.
• Differences between birth cohorts over time are much larger for females than for males, and generally in the opposite direction. Whereas male participation rates have generally fallen over time, life-cycle participation profiles for females have shifted upwards at all ages except 15 to 19. This is consistent with the changing social norms around females working. The largest increases have been observed at older ages. For example, the cohort born in 1924 to 1928 had a participation rate of just 28.7 per cent at age 55 to 59, compared with 69.6 per cent for the cohort born in 1959 to 1963.
• But as with men, differences between cohorts appear to be waning. The upward shifts between consecutive female life-cycle profiles seem to have become smaller for recent birth cohorts. The M-shape of the female life-cycle profiles also appear to have become less pronounced over time, due to smaller reductions in participation rates during the main child-rearing years for later birth cohorts. Combined, these developments suggest female life-cycle profiles might be converging at a new level.
Full-time and part-time participation rates
The total participation rate discussed above only reflects individuals’ binary decisions about whether to participate in the labour market or not. This means that no consideration is given to the number of hours that each individual is willing to work.
In this paper we incorporate this dimension by constructing full-time and part-time participation rates, which sum to make the total participation rate (see Appendix B for definitions).
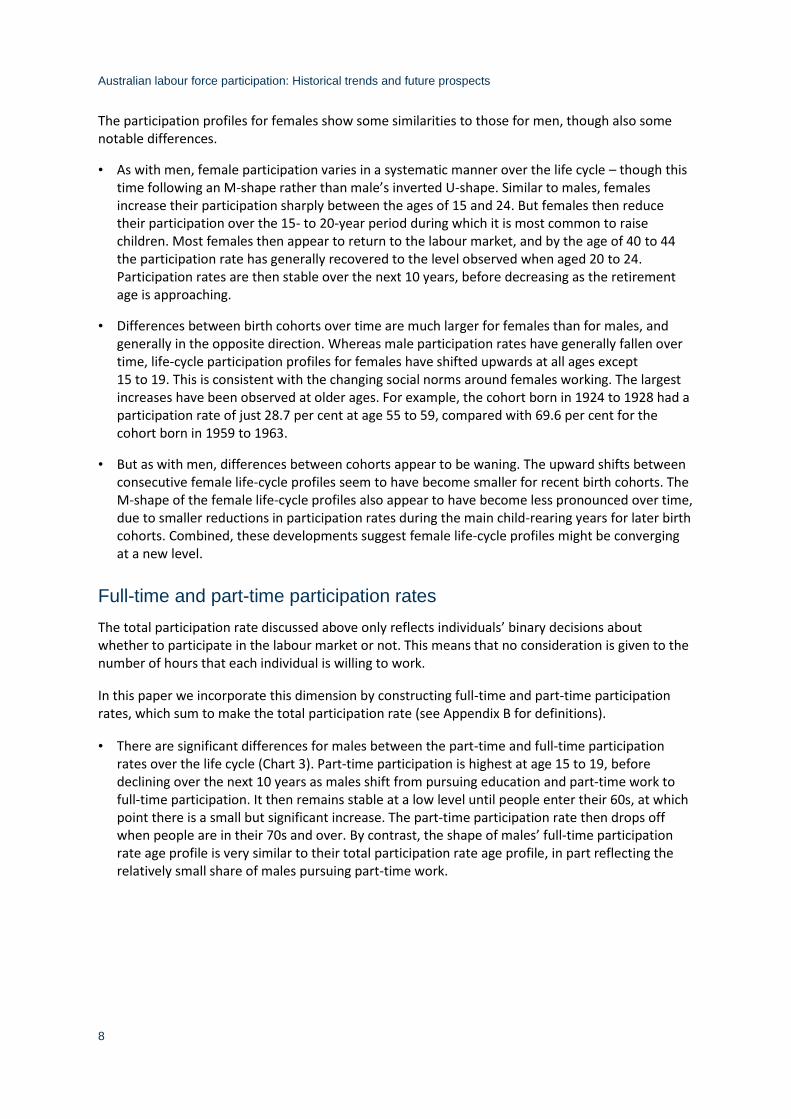
• There are significant differences for males between the part-time and full-time participation rates over the life cycle (Chart 3). Part-time participation is highest at age 15 to 19, before declining over the next 10 years as males shift from pursuing education and part-time work to full-time participation. It then remains stable at a low level until people enter their 60s, at which point there is a small but significant increase. The part-time participation rate then drops off when people are in their 70s and over. By contrast, the shape of males’ full-time participation rate age profile is very similar to their total participation rate age profile, in part reflecting the relatively small share of males pursuing part-time work.
Australian labour force participation: Historical trends and future prospects
9
• The downward shift in males’ total participation rate profiles over time masks partly offsetting movements in full-time and part-time participation rates at most ages. For instance, for males aged 15 to 24 part-time participation rates have been increasing, though not as much as full-time participation rates have been falling. These movements are consistent with a trend towards more educational attendance at younger ages. Significantly, these shifts have continued for recent birth cohorts, although at a slower rate. This suggests that the move towards part-time participation might have further to go.
• Participation rates for males at ages 25 to 54 have shifted in a similar manner, though in a way that suggests convergence. For ages 35 to 39, the part-time participation rate increased by around 4 percentage points from the cohort born in 1944 to 1948 to the cohort born in 1974 to 1978. By contrast, the full-time participation rates for the same age and birth cohorts was 93.6 per cent and 83.7 per cent respectively, a decrease of 10 percentage points. However, compared with the younger ages, there are signs that both the part-time and full-time cohort profiles are converging at new levels.
• Males in their 60s have generally increased both their part-time and full-time participation rates. That said, the upward shift in part-time participation has been slightly larger and more consistent. Though differences between the most recent birth cohorts observed at this age are generally small, it is difficult to say whether this is due to the profiles converging at a new level or an effect of the relatively weak labour market towards the end of our sample period.
Chart 3: Male participation rates by birth cohort
Full-time
Part-time
Source: ABS Cat. No. 6291; Unpublished ABS data for age 65-69 and 70+; Authors’ calculations.
0
20
40
60
80
100
0
20
40
60
80
100
15-1
9
20-2
4
25-2
9
30-3
4
35-3
9
40-4
4
45-4
9
50-5
4
55-5
9
60-6
4
65-6
9
70+
Per cent
AgeAge
Per cent
0
20
40
60
80
100
0
20
40
60
80
100
15-1
9
20-2
4
25-2
9
30-3
4
35-3
9
40-4
4
45-4
9
50-5
4
55-5
9
60-6
4
65-6
9
70+
Per cent
AgeAge
Per cent
Birth year
1909-1913 1914-1918 1919-1923 1924-1928
1929-1933 1934-1938 1939-1943 1944-1948
1949-1953 1954-1958 1959-1963 1964-1968
1969-1973 1974-1978 1979-1983 1984-1988
1989-1993 1994-1998 1999-03 Latest at age
Australian labour force participation: Historical trends and future prospects
10
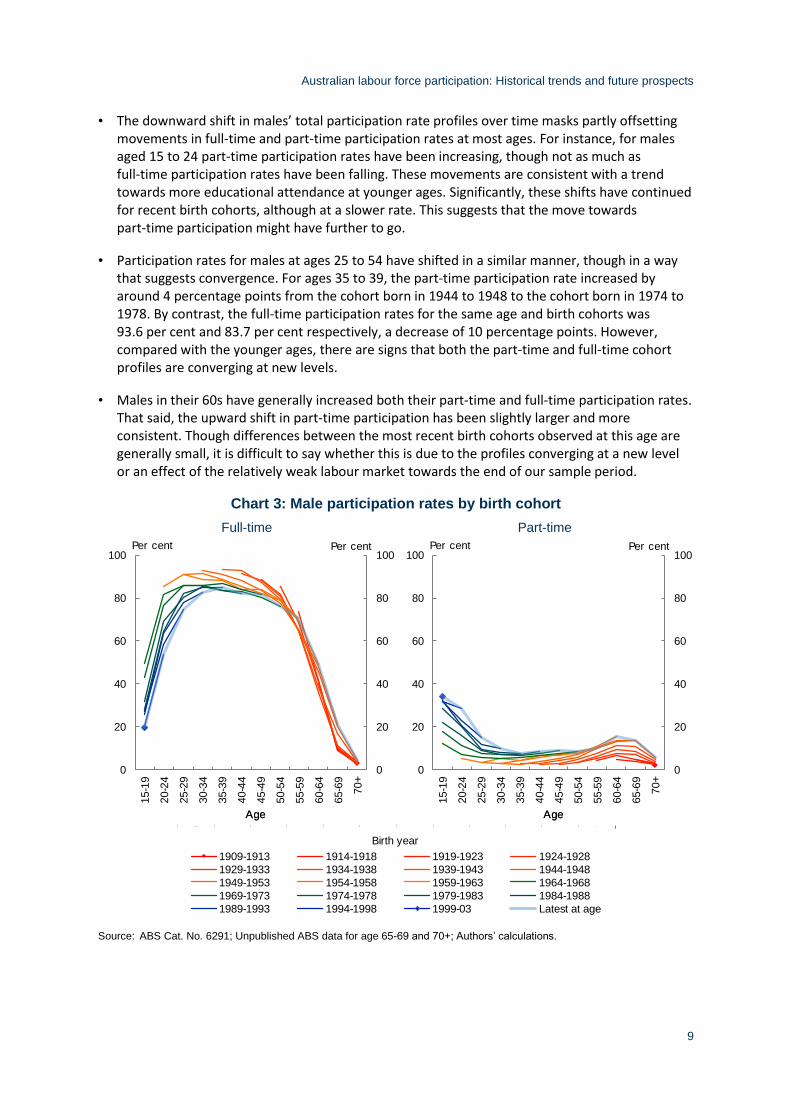
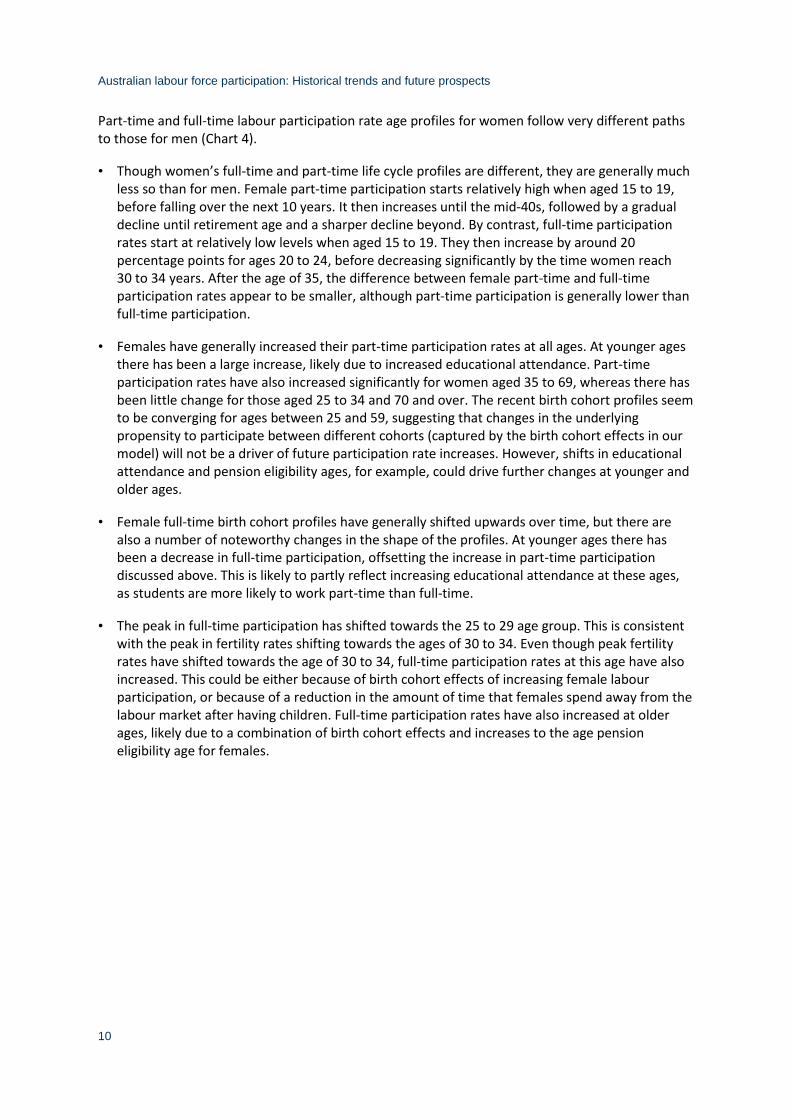
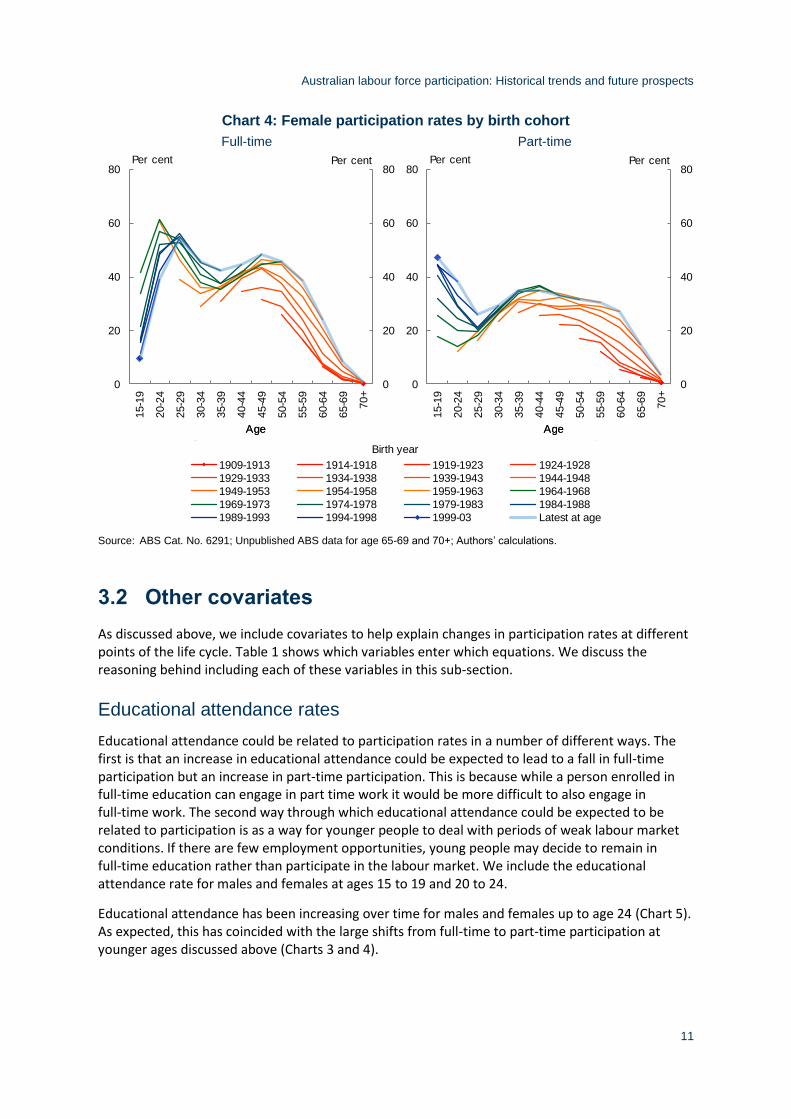
Part-time and full-time labour participation rate age profiles for women follow very different paths to those for men (Chart 4).
• Though women’s full-time and part-time life cycle profiles are different, they are generally much less so than for men. Female part-time participation starts relatively high when aged 15 to 19, before falling over the next 10 years. It then increases until the mid-40s, followed by a gradual decline until retirement age and a sharper decline beyond. By contrast, full-time participation rates start at relatively low levels when aged 15 to 19. They then increase by around 20 percentage points for ages 20 to 24, before decreasing significantly by the time women reach 30 to 34 years. After the age of 35, the difference between female part-time and full-time participation rates appear to be smaller, although part-time participation is generally lower than full-time participation.
• Females have generally increased their part-time participation rates at all ages. At younger ages there has been a large increase, likely due to increased educational attendance. Part-time participation rates have also increased significantly for women aged 35 to 69, whereas there has been little change for those aged 25 to 34 and 70 and over. The recent birth cohort profiles seem to be converging for ages between 25 and 59, suggesting that changes in the underlying propensity to participate between different cohorts (captured by the birth cohort effects in our model) will not be a driver of future participation rate increases. However, shifts in educational attendance and pension eligibility ages, for example, could drive further changes at younger and older ages.
• Female full-time birth cohort profiles have generally shifted upwards over time, but there are also a number of noteworthy changes in the shape of the profiles. At younger ages there has been a decrease in full-time participation, offsetting the increase in part-time participation discussed above. This is likely to partly reflect increasing educational attendance at these ages, as students are more likely to work part-time than full-time.
• The peak in full-time participation has shifted towards the 25 to 29 age group. This is consistent with the peak in fertility rates shifting towards the ages of 30 to 34. Even though peak fertility rates have shifted towards the age of 30 to 34, full-time participation rates at this age have also increased. This could be either because of birth cohort effects of increasing female labour participation, or because of a reduction in the amount of time that females spend away from the labour market after having children. Full-time participation rates have also increased at older ages, likely due to a combination of birth cohort effects and increases to the age pension eligibility age for females.
Australian labour force participation: Historical trends and future prospects
11
Chart 4: Female participation rates by birth cohort
Full-time
Part-time
Source: ABS Cat. No. 6291; Unpublished ABS data for age 65-69 and 70+; Authors’ calculations.
3.2 Other covariates
As discussed above, we include covariates to help explain changes in participation rates at different points of the life cycle. Table 1 shows which variables enter which equations. We discuss the reasoning behind including each of these variables in this sub-section.
Educational attendance rates
Educational attendance could be related to participation rates in a number of different ways. The first is that an increase in educational attendance could be expected to lead to a fall in full-time participation but an increase in part-time participation. This is because while a person enrolled in full-time education can engage in part time work it would be more difficult to also engage in full-time work. The second way through which educational attendance could be expected to be related to participation is as a way for younger people to deal with periods of weak labour market conditions. If there are few employment opportunities, young people may decide to remain in full-time education rather than participate in the labour market. We include the educational attendance rate for males and females at ages 15 to 19 and 20 to 24.
Educational attendance has been increasing over time for males and females up to age 24 (Chart 5). As expected, this has coincided with the large shifts from full-time to part-time participation at younger ages discussed above (Charts 3 and 4).
0
20
40
60
80
0
20
40
60
80
15-1
9
20-2
4
25-2
9
30-3
4
35-3
9
40-4
4
45-4
9
50-5
4
55-5
9
60-6
4
65-6
9
70+
Per cent
AgeAge
Per cent
0
20
40
60
80
0
20
40
60
80
15-1
9
20-2
4
25-2
9
30-3
4
35-3
9
40-4
4
45-4
9
50-5
4
55-5
9
60-6
4
65-6
9
70+
Per cent
AgeAge
Per cent
Birth year
1909-1913 1914-1918 1919-1923 1924-1928
1929-1933 1934-1938 1939-1943 1944-1948
1949-1953 1954-1958 1959-1963 1964-1968
1969-1973 1974-1978 1979-1983 1984-1988
1989-1993 1994-1998 1999-03 Latest at age
Australian labour force participation: Historical trends and future prospects
12
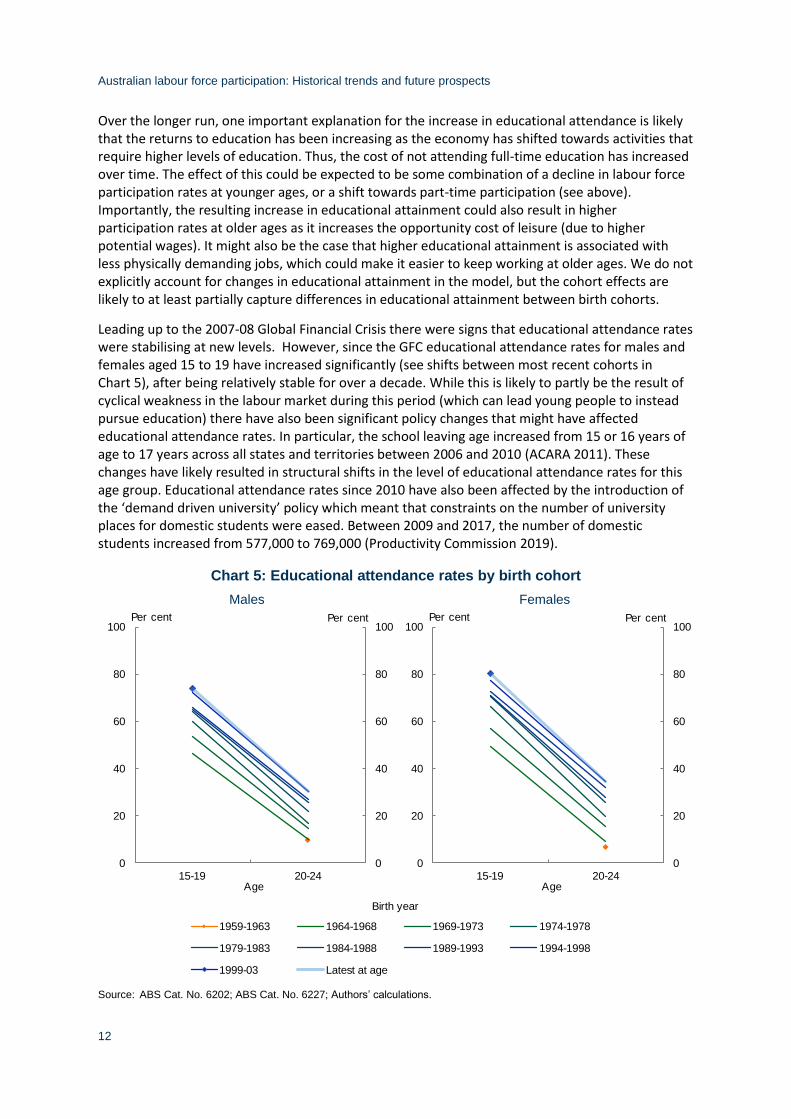
Over the longer run, one important explanation for the increase in educational attendance is likely that the returns to education has been increasing as the economy has shifted towards activities that require higher levels of education. Thus, the cost of not attending full-time education has increased over time. The effect of this could be expected to be some combination of a decline in labour force participation rates at younger ages, or a shift towards part-time participation (see above). Importantly, the resulting increase in educational attainment could also result in higher participation rates at older ages as it increases the opportunity cost of leisure (due to higher potential wages). It might also be the case that higher educational attainment is associated with less physically demanding jobs, which could make it easier to keep working at older ages. We do not explicitly account for changes in educational attainment in the model, but the cohort effects are likely to at least partially capture differences in educational attainment between birth cohorts.
Leading up to the 2007-08 Global Financial Crisis there were signs that educational attendance rates were stabilising at new levels. However, since the GFC educational attendance rates for males and females aged 15 to 19 have increased significantly (see shifts between most recent cohorts in Chart 5), after being relatively stable for over a decade. While this is likely to partly be the result of cyclical weakness in the labour market during this period (which can lead young people to instead pursue education) there have also been significant policy changes that might have affected educational attendance rates. In particular, the school leaving age increased from 15 or 16 years of age to 17 years across all states and territories between 2006 and 2010 (ACARA 2011). These changes have likely resulted in structural shifts in the level of educational attendance rates for this age group. Educational attendance rates since 2010 have also been affected by the introduction of the ‘demand driven university’ policy which meant that constraints on the number of university places for domestic students were eased. Between 2009 and 2017, the number of domestic students increased from 577,000 to 769,000 (Productivity Commission 2019).
Chart 5: Educational attendance rates by birth cohort
Males
Females
Source: ABS Cat. No. 6202; ABS Cat. No. 6227; Authors’ calculations.
0
20
40
60
80
100
0
20
40
60
80
100
15-19 20-24
Per cent
Age
Per cent
0
20
40
60
80
100
0
20
40
60
80
100
15-19 20-24
Per cent
Age
Per cent
Birth year
1959-1963 1964-1968 1969-1973 1974-1978
1979-1983 1984-1988 1989-1993 1994-1998
1999-03 Latest at age
Australian labour force participation: Historical trends and future prospects
13
Fertility rates
The birth of a child is associated with at least some time away from the labour market. As such, we expect a negative relationship between fertility rates and female participation rates around the ages that women generally have children. As with participation rates, there are two main aspects of fertility rates that are of interest here. The first is how fertility rates change with age, corresponding to the age profile for the participation rates. The second is systematic variations in the level and timing of fertility between different birth cohorts.
In order to capture not only how child birth affects female participation rate decisions in the same year as the birth, we use fertility rate data to calculate the number of children born per women in an age group over the past six years (including the current year). This is done to account for the fact that participation rates are not only going to be affected in the year that a child is born but also in subsequent years. Including children born in the past six years is consistent with the children being legally required to attend school from the age of six in most states and territories. We include this variable for age groups 20 to 24, 25 to 29, 35 to 39 and 40 to 44. We exclude the variable for age groups 15 to 19 and 45 to 49 as fertility rates for these groups are too low to have any meaningful impact on the level of participation. We also exclude the variable for the 30 to 34 age group as, if included, the model suggests an implausible positive participation rate effect of more children. This is likely because of the omission of other relevant variables, and what the model picks up is that both participation and fertility rates have increased at these ages.
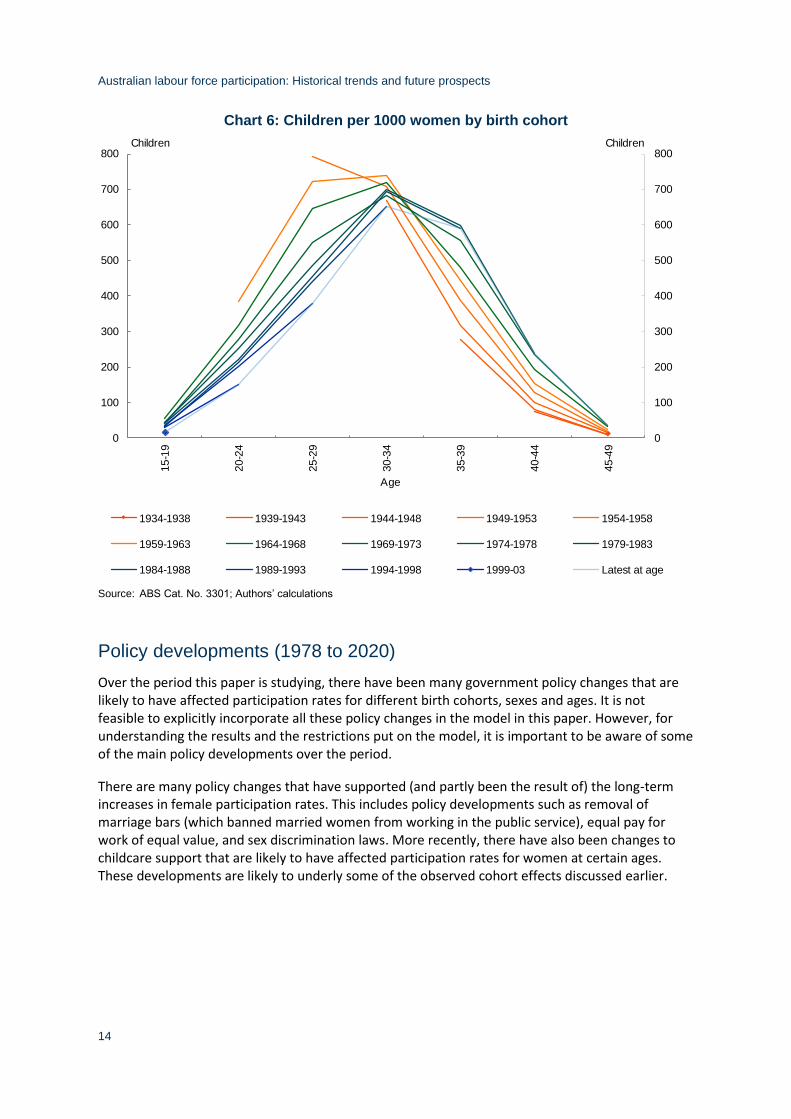
The key development is that women are having children later in life. These profiles show that in the last 50 years or so women have moved to have children much later on average (Chart 6). For instance, the cohort born in 1954-58 had given birth to just under 800 children (over the past 6 years) per 1000 women when aged 25 to 29, compared with just over 450 for the cohort born in 1979 to 1983. But when aged 30 to 34, the same cohorts had both given birth to around 700 children per 1000 women. So, whereas the number of children for the 1953 to 1957 cohort peaked at age 25 to 29, for the 1978 to 1982 cohort it peaked at age 30 to 34. Meanwhile, women aged 15 to 24 have fewer children aged under 6, whereas women aged 35 to 49 have more. In other words, the whole distribution has shifted towards older ages.
These changes align well with the large upward shifts in full-time participation for women aged 25 to 29. But they are harder to reconcile with increasing full-time participation rates for women aged 30 to 34. Part of the explanation could be that women spend less time away from the labour market following the birth of a child over time, potentially due to childcare having become more accessible and increased sharing of parenting responsibilities between men and women. Another is that positive birth cohort effects are pushing up participation rates for women who are not having children at this age.
Australian labour force participation: Historical trends and future prospects
14
Chart 6: Children per 1000 women by birth cohort
Source: ABS Cat. No. 3301; Authors’ calculations
Policy developments (1978 to 2020)
Over the period this paper is studying, there have been many government policy changes that are likely to have affected participation rates for different birth cohorts, sexes and ages. It is not feasible to explicitly incorporate all these policy changes in the model in this paper. However, for understanding the results and the restrictions put on the model, it is important to be aware of some of the main policy developments over the period.
There are many policy changes that have supported (and partly been the result of) the long-term increases in female participation rates. This includes policy developments such as removal of marriage bars (which banned married women from working in the public service), equal pay for work of equal value, and sex discrimination laws. More recently, there have also been changes to childcare support that are likely to have affected participation rates for women at certain ages. These developments are likely to underly some of the observed cohort effects discussed earlier.
0
100
200
300
400
500
600
700
800
0
100
200
300
400
500
600
700
80015-1
9
20-2
4
25-2
9
30-3
4
35-3
9
40-4
4
45-4
9
ChildrenChildren
1934-1938 1939-1943 1944-1948 1949-1953 1954-1958
1959-1963 1964-1968 1969-1973 1974-1978 1979-1983
1984-1988 1989-1993 1994-1998 1999-03 Latest at age
Age
Australian labour force participation: Historical trends and future prospects
15
Age pension eligibility
The pension eligibility age is likely to have a significant effect on when individuals choose to retire, in particular for groups that do not have the financial resources to fund their own retirement. Historically, the age pension eligibility age has been different for males and females (DSS 2018). Until 1995, it was 65 years for males and 60 years for females. However, from 1 July 1995 the eligibility age for females increased by six months every two years until it reached 65 years from 1 July 2013. As can be expected, the period during which these increases occurred overlaps with an increase in the participation rates for females in age groups 55 to 59 and 60 to 64. While we expect the largest effect for age group 60 to 64, we also expect there could be effects for age group 55 to 59 as some individuals could decide to delay their retirement so that they would not have too much of a gap between the age of retiring and being able to receive the age pension. The increase in female pension eligibility age can also be expected to have increased male participation rates at these ages as couples are likely to make joint decisions about the how much they work, and they are likely to share the burden of making up the income lost from the delayed age pension payments.
There are several studies of the effects of changes to the pension eligibility rules on labour force participation rates in Australia. Atalay and Barret (2015) analyse the increase in the pension eligibility age for women between 1995 and 2013 as a natural experiment and found that a one-year increase in the eligibility age increased participation rates by 18 percentage points. Morris (2019) analysed the same reform as Atalay and Barret with a different methodology and found much smaller effects. Rodgers (2019) analysed how participation rates of WWII veterans were affected by being eligible to access the Service Pension at age 60 (compared with the eligibility age of 65 for the Age Pension). The results suggest that the Service Pension lowered participation rates of males aged 60 to 64 by around 5 percentage points between 1971 and 1981. In the model estimated in this paper, the effects of the changes to pension eligibility ages are likely to be reflected in the cohort effects. This has implications for both the estimated effects and for how we treat future cohort effects when there are legislated changes to policy.
More recently, further increases in the age pension eligibility age for both males and females have been legislated. As of 1 July 2017, the eligibility age increased to 65 years and 6 months and then to 66 years as of 1 July 2019, with additional increases of 6 months every two years until the eligibility age reaches 67 years on 1 July 2023. These most recent changes are unlikely to have had much of an effect on participation rates yet but can be expected to in the future.
Superannuation
Australia’s system of compulsory superannuation was introduced in 1992, with a compulsory contribution rate of 3 or 4 per cent depending on the size of the employer. The rate then gradually increased until it reached 9 per cent in 2002. Since then there has been further increases to 9.5 per cent, with additional legislated increases to 12 per cent over the 2021 to 2025 period. There have also been many other changes since the introduction, including to the preservation age and the rules around concessional voluntary contributions.

Australian labour force participation: Historical trends and future prospects
16
The introduction of, and changes to, superannuation would have affected individuals’ labour supply decisions, in particular around the retirement phase. However, neither the direction nor magnitude of these responses is well understood. Kudrna and Woodland (2013) analysed the effect of the legislated increase in superannuation guarantee rate from 9.5 to 12 per cent using a life-cycle framework. In that framework, an increase in the superannuation guarantee rate resulted in small labour supply increases at younger ages and slightly larger decreases around the retirement age.
Australian labour force participation: Historical trends and future prospects
17
4. Econometric method
Section 2 described the general age-cohort framework applied in this paper. In this section, we present the details of the model specification and econometric methods, including the definition of the stages of life, the functional forms used and the treatment of recent cohorts.
4.1 Separating the life cycle into stages of life
The life-cycle model considers labour force participation from the beginning to the end of an individual’s working life. This means that the cohort effects can be interpreted as a measure of a given cohort’s propensity to participate over its life. This approach works well if shifts in the participation rate profiles between cohorts are proportional (if model is estimated in log levels) or constant (if model is estimated in levels) over the lifecycle. However, this is not the case if the overall pattern of participation over the life cycle is changing in non-conforming ways over time. One example is the sharp rise in the participation of older workers in recent data. Even if the pattern of life-cycle participation is changing, modelling the complete life cycle in a single model would still work well if it was possible to incorporate enough data on other factors that can explain these changes. For example, we have incorporated fertility rates in the model to account for part of the shifts in female participation over the main child-rearing years.
For the data we are looking at in this paper, neither of the above two conditions are fully satisfied. Faced with a similar problem the CBO divided the lifecycle into four stages of life: i) 16 to 24; ii) 25 to 64; iii) 64 to 79; and iv) 80 and over. This approach allowed the CBO to better capture trends at certain stages of the lifecycle via cohort effects, without those cohort effects affecting participation at other stages of life.
We have broadly followed the approach taken by the CBO and have divided the lifecycle into three stages of life: i) 15 to 24, ii) 25 to 64, and iii) 65 and over. However, as will be discussed below, the specification for male full-time participation is slightly different.
There are two possible drawbacks of modelling stages of life separately. The first is that the simple connection between different stages of life is lost. The second is that it is more difficult to incorporate additional covariates in the model.
We have split ages 15 to 24 out into a separate model for both males and females and full-time and part-time participation. The reason for this is that changes in participation rates at these age groups have been very different to the rest of the life cycle, in terms of direction and/or magnitude. Including educational attendance in the model can address this to some degree, but not well enough that we would expect these shifts to flow through to the remainder of the cohorts’ lifecycles. This is consistent with the findings in a number of other studies. For example, Borland and Coelli (2020) and the Productivity Commission (2020) found that the changes to labour market outcomes for young people cannot be fully explained by changes to the share of young people in full-time education. These studies suggest that an imbalance between labour supply and labour demand since the GFC, largely driven by strong increases in participation rates by groups that are competing with the young for jobs (in particular women aged over 55), is a likely explanation of the weak labour market outcomes over this period. This explanation supports separating out the young into a separate model, at least if the imbalance between labour supply and demand is not permanent and there are no significant scarring effects that will affect participation rates for the relevant cohorts at older ages.
Australian labour force participation: Historical trends and future prospects
18
We have also split out ages 65 and over for both males and females and full-time and part-time participation. There are multiple reasons for this decision. The first is that the cohort effects from the prime working ages do not necessarily flow through to ages around and after the retirement age. The principal drivers of participation at older ages are more likely to be factors such as retirement income policy settings, health and the availability of age appropriate jobs. This is most obvious for male full-time participation which has been increasing for ages 65 and over, while decreasing at all ages 64 and under.
For male full-time participation we have also split out the 55 to 64 group because shifts at these ages have been very different to the rest of the lifecycle. It is not possible to capture these shifts if combined with younger ages. In the 1980s and 1990s full-time participation rates at these ages fell by between 15 and 20 percentage points, followed by a partial recovery in the 2000s. A further complication is that the age-cohort model fits the data poorly even if applied separately to the 55 to 64 age group, and therefore we use a univariate filtering technique to estimate trends for these ages.3
As discussed above, the cohort effects are normalised to that of a reference cohort. In practice, a reference cohort needs to be chosen for each separate stage of life. As the choice of reference cohort doesn’t affect the results, we have chosen the most recent cohort within each stage of life to be the reference cohort. This simplifies the presentation, as the estimated age effects represent the level at which participation rates at different ages would stabilise in the long run (assuming no further changes to cohort effects and except for when additional covariates are included).
4.2 Treatment of recent cohorts
In the age-cohort framework, the behaviour of the youngest cohorts within each stage of life will largely determine the long-term projections. However, the younger cohorts have only been observed for a small fraction of their life (for example, the youngest cohort for the 25 to 64 stage of life has only been observed at ages 25 to 29, and the second youngest cohort has only been observed at ages 25 to 34).
Consistent with the approach taken by the CBO, we have chosen to exclude the two most recent cohorts from the models covering the ages 25 to 64 (this is equivalent to excluding 10 single year of age birth cohorts in the CBO’s framework). Excluding recent cohorts from the estimation generally results in worse fit of the model to recent data. However, in the past 10 years or so there has been relatively large movements and/or reversals of longer-running trends observed for those at ages 25 to 34 (in particular at the part-time and full-time level). Given the uncertainty around what has caused these large movements we have adopted a prudent approach that does not allow these shifts between full-time and part-time participation to fully flow through to the remaining life of recent and future cohorts.
In contrast, participation rates for ages 15 to 24 and 65 and over, have either been relatively stable over a longer period of time, or have been moving in line with longer-running trends over recent years, so we include all cohorts in the estimation.
3 The univariate filter is a HP filter with smoothing parameter of 1600 which is appropriate for quarterly data. In order
to reduce the endpoint problems associated with this filter, we ignore the last 12 observations from the estimated trend and assume that the trend is unchanged over that period.
Australian labour force participation: Historical trends and future prospects
19
4.3 Multiplicative versus additive specification
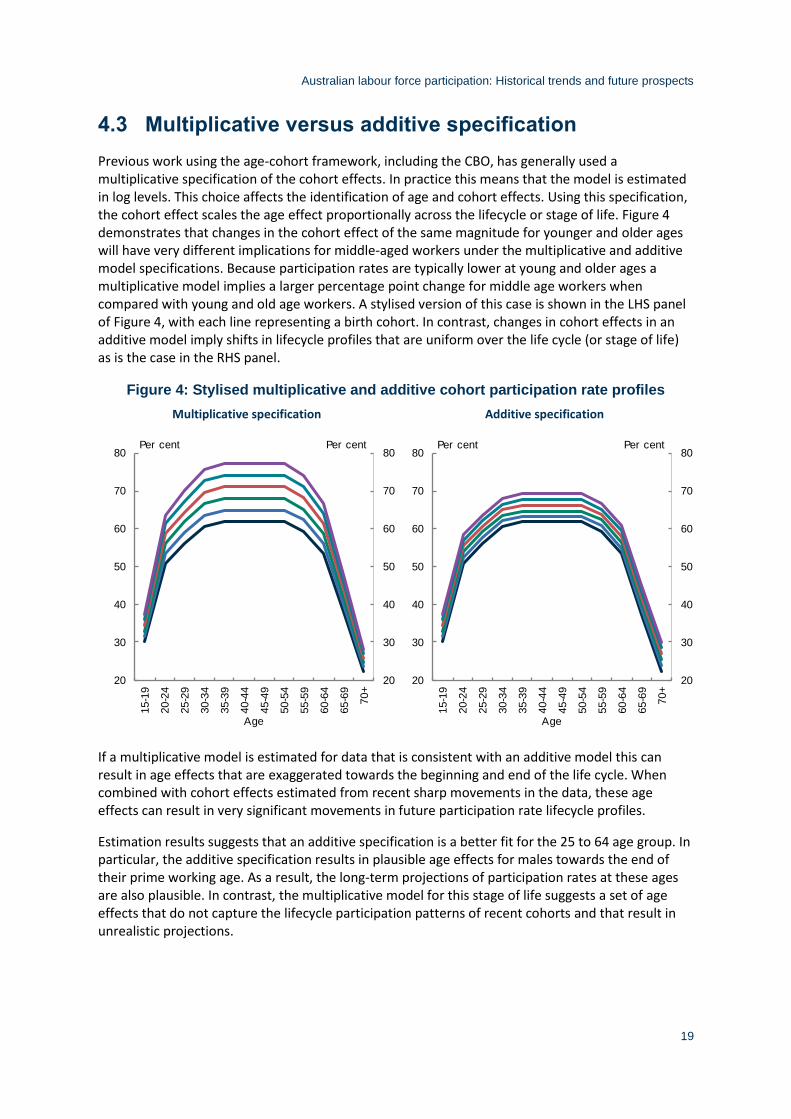
Previous work using the age-cohort framework, including the CBO, has generally used a multiplicative specification of the cohort effects. In practice this means that the model is estimated in log levels. This choice affects the identification of age and cohort effects. Using this specification, the cohort effect scales the age effect proportionally across the lifecycle or stage of life. Figure 4 demonstrates that changes in the cohort effect of the same magnitude for younger and older ages will have very different implications for middle-aged workers under the multiplicative and additive model specifications. Because participation rates are typically lower at young and older ages a multiplicative model implies a larger percentage point change for middle age workers when compared with young and old age workers. A stylised version of this case is shown in the LHS panel of Figure 4, with each line representing a birth cohort. In contrast, changes in cohort effects in an additive model imply shifts in lifecycle profiles that are uniform over the life cycle (or stage of life) as is the case in the RHS panel.
Figure 4: Stylised multiplicative and additive cohort participation rate profiles
Multiplicative specification
Additive specification
If a multiplicative model is estimated for data that is consistent with an additive model this can result in age effects that are exaggerated towards the beginning and end of the life cycle. When combined with cohort effects estimated from recent sharp movements in the data, these age effects can result in very significant movements in future participation rate lifecycle profiles.
Estimation results suggests that an additive specification is a better fit for the 25 to 64 age group. In particular, the additive specification results in plausible age effects for males towards the end of their prime working age. As a result, the long-term projections of participation rates at these ages are also plausible. In contrast, the multiplicative model for this stage of life suggests a set of age effects that do not capture the lifecycle participation patterns of recent cohorts and that result in unrealistic projections.
20
30
40
50
60
70
80
20
30
40
50
60
70
80
15-1
9
20-2
4
25-2
9
30-3
4
35-3
9
40-4
4
45-4
9
50-5
4
55-5
9
60-6
4
65-6
9
70+
Per centPer cent
Age
20
30
40
50
60
70
80
20
30
40
50
60
70
8015-1
9
20-2
4
25-2
9
30-3
4
35-3
9
40-4
4
45-4
9
50-5
4
55-5
9
60-6
4
65-6
9
70+
Per centPer cent
Age
Australian labour force participation: Historical trends and future prospects
20
The multiplicative specification is also problematic in some cases due to the separation of participation rates into full-time and part-time rates. Because of the significant differences in levels of full-time and part-time participation rates, especially for males, relatively modest shifts between full-time and part-time participation can have a significant effect on the total participation rate (potentially exceeding 100 per cent).
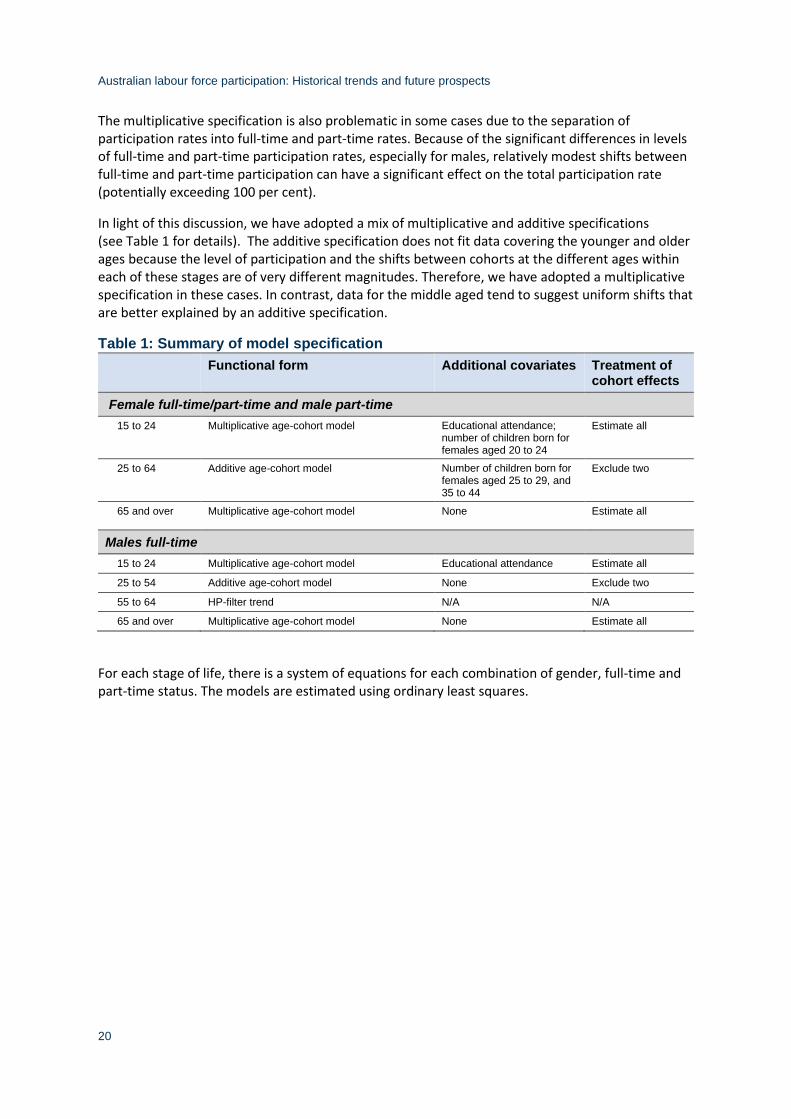
In light of this discussion, we have adopted a mix of multiplicative and additive specifications (see Table 1 for details). The additive specification does not fit data covering the younger and older ages because the level of participation and the shifts between cohorts at the different ages within each of these stages are of very different magnitudes. Therefore, we have adopted a multiplicative specification in these cases. In contrast, data for the middle aged tend to suggest uniform shifts that are better explained by an additive specification.
Table 1: Summary of model specification
Functional form Additional covariates Treatment of cohort effects
Female full-time/part-time and male part-time
15 to 24 Multiplicative age-cohort model Educational attendance; number of children born for females aged 20 to 24
Estimate all
25 to 64 Additive age-cohort model Number of children born for females aged 25 to 29, and 35 to 44
Exclude two
65 and over Multiplicative age-cohort model None Estimate all
Males full-time
15 to 24 Multiplicative age-cohort model Educational attendance Estimate all
25 to 54 Additive age-cohort model None Exclude two
55 to 64 HP-filter trend N/A N/A
65 and over Multiplicative age-cohort model None Estimate all
For each stage of life, there is a system of equations for each combination of gender, full-time and part-time status. The models are estimated using ordinary least squares.
Australian labour force participation: Historical trends and future prospects
21
5. Results
In this section we present the results of the econometric estimation of the model. We first go through the results for each of the variables in the model, separately for males and females, and discuss their interpretation. We then consider how well the model fits the historical data.
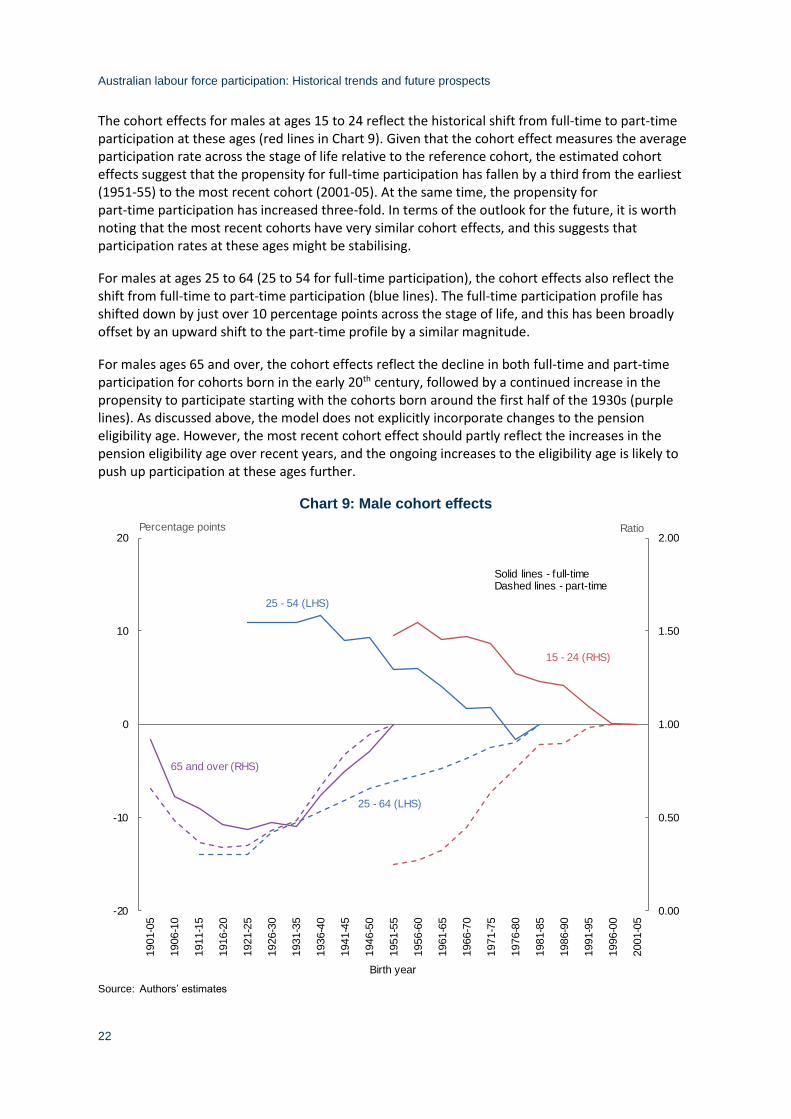
Before moving on to the results, it is worth spending time on the interpretation of the cohort effects in the multiplicative and additive specifications. In both specifications, the cohort effect measures a particular cohort’s participation across the stage of life relative to the reference cohort. In the multiplicative specification, the value of the cohort effect can be interpreted as the ratio of the average of the specific cohort’s participation rate profile to that of the reference cohort. For example, a value of 1.5 means that the participation of the specific cohort is 50 per cent higher than the reference cohort, at all ages. In the additive specification, the cohort effect measures the constant percentage point shift in the cohort’s participation profile relative to the reference cohort. For example, a cohort effect of 10 means that the cohort’s participation is 10 percentage points higher at all ages in that stage of life. In the charts below presenting the estimated cohort effects (Charts 9 and 12), the LHS axis plots the additive model percentage point deviation from the reference cohort, while the RHS plots the multiplicative model ratio to the reference cohort.
5.1 Male age and cohort effects
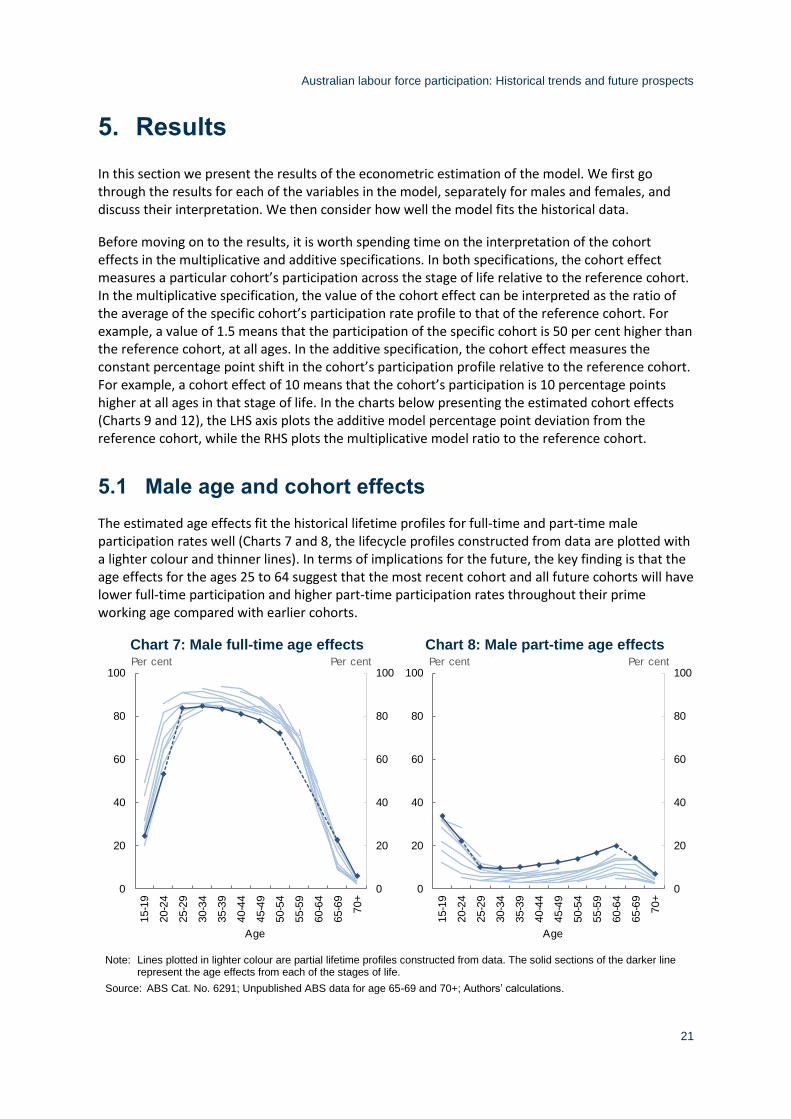
The estimated age effects fit the historical lifetime profiles for full-time and part-time male participation rates well (Charts 7 and 8, the lifecycle profiles constructed from data are plotted with a lighter colour and thinner lines). In terms of implications for the future, the key finding is that the age effects for the ages 25 to 64 suggest that the most recent cohort and all future cohorts will have lower full-time participation and higher part-time participation rates throughout their prime working age compared with earlier cohorts.
Chart 7: Male full-time age effects
Chart 8: Male part-time age effects
Note: Lines plotted in lighter colour are partial lifetime profiles constructed from data. The solid sections of the darker line represent the age effects from each of the stages of life.
Source: ABS Cat. No. 6291; Unpublished ABS data for age 65-69 and 70+; Authors’ calculations.
0
20
40
60
80
100
0
20
40
60
80
100
15-1
9
20-2
4
25-2
9
30-3
4
35-3
9
40-4
4
45-4
9
50-5
4
55-5
9
60-6
4
65-6
9
70+
Per centPer cent
Age
0
20
40
60
80
100
0
20
40
60
80
100
15-1
9
20-2
4
25-2
9
30-3
4
35-3
9
40-4
4
45-4
9
50-5
4
55-5
9
60-6
4
65-6
9
70+
Per centPer cent
Age
Australian labour force participation: Historical trends and future prospects
22
The cohort effects for males at ages 15 to 24 reflect the historical shift from full-time to part-time participation at these ages (red lines in Chart 9). Given that the cohort effect measures the average participation rate across the stage of life relative to the reference cohort, the estimated cohort effects suggest that the propensity for full-time participation has fallen by a third from the earliest (1951-55) to the most recent cohort (2001-05). At the same time, the propensity for part-time participation has increased three-fold. In terms of the outlook for the future, it is worth noting that the most recent cohorts have very similar cohort effects, and this suggests that participation rates at these ages might be stabilising.
For males at ages 25 to 64 (25 to 54 for full-time participation), the cohort effects also reflect the shift from full-time to part-time participation (blue lines). The full-time participation profile has shifted down by just over 10 percentage points across the stage of life, and this has been broadly offset by an upward shift to the part-time profile by a similar magnitude.
For males ages 65 and over, the cohort effects reflect the decline in both full-time and part-time participation for cohorts born in the early 20th century, followed by a continued increase in the propensity to participate starting with the cohorts born around the first half of the 1930s (purple lines). As discussed above, the model does not explicitly incorporate changes to the pension eligibility age. However, the most recent cohort effect should partly reflect the increases in the pension eligibility age over recent years, and the ongoing increases to the eligibility age is likely to push up participation at these ages further.
Chart 9: Male cohort effects
Source: Authors’ estimates
0.00
0.50
1.00
1.50
2.00
-20
-10
0
10
20
1901-0
5
1906-1
0
1911-1
5
1916-2
0
1921-2
5
1926-3
0
1931-3
5
1936-4
0
1941-4
5
1946-5
0
1951-5
5
1956-6
0
1961-6
5
1966-7
0
1971-7
5
1976-8
0
1981-8
5
1986-9
0
1991-9
5
1996-0
0
2001-0
5
RatioPercentage points
Birth year
15 - 24 (RHS)
25 - 54 (LHS)
65 and over (RHS)
Solid lines - full-timeDashed lines - part-time
25 - 64 (LHS)
Australian labour force participation: Historical trends and future prospects
23
5.2 Female age and cohort effects
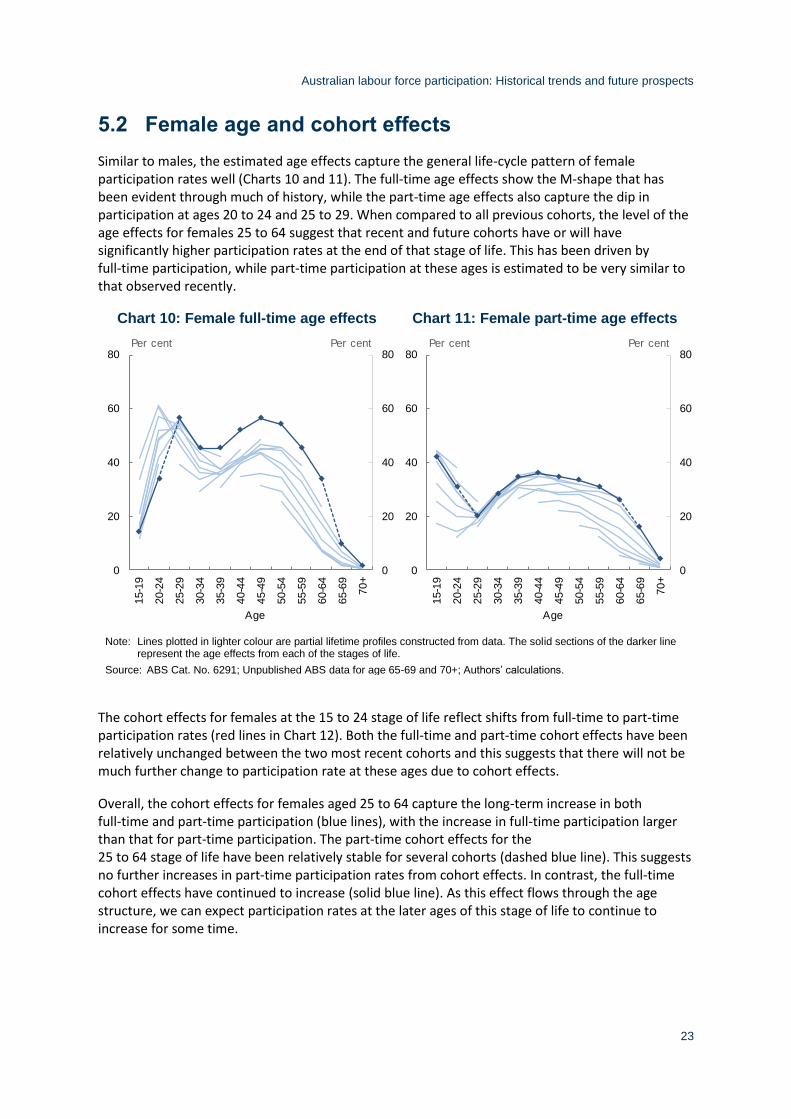
Similar to males, the estimated age effects capture the general life-cycle pattern of female participation rates well (Charts 10 and 11). The full-time age effects show the M-shape that has been evident through much of history, while the part-time age effects also capture the dip in participation at ages 20 to 24 and 25 to 29. When compared to all previous cohorts, the level of the age effects for females 25 to 64 suggest that recent and future cohorts have or will have significantly higher participation rates at the end of that stage of life. This has been driven by full-time participation, while part-time participation at these ages is estimated to be very similar to that observed recently.
Chart 10: Female full-time age effects
Chart 11: Female part-time age effects
Note: Lines plotted in lighter colour are partial lifetime profiles constructed from data. The solid sections of the darker line represent the age effects from each of the stages of life.
Source: ABS Cat. No. 6291; Unpublished ABS data for age 65-69 and 70+; Authors’ calculations.
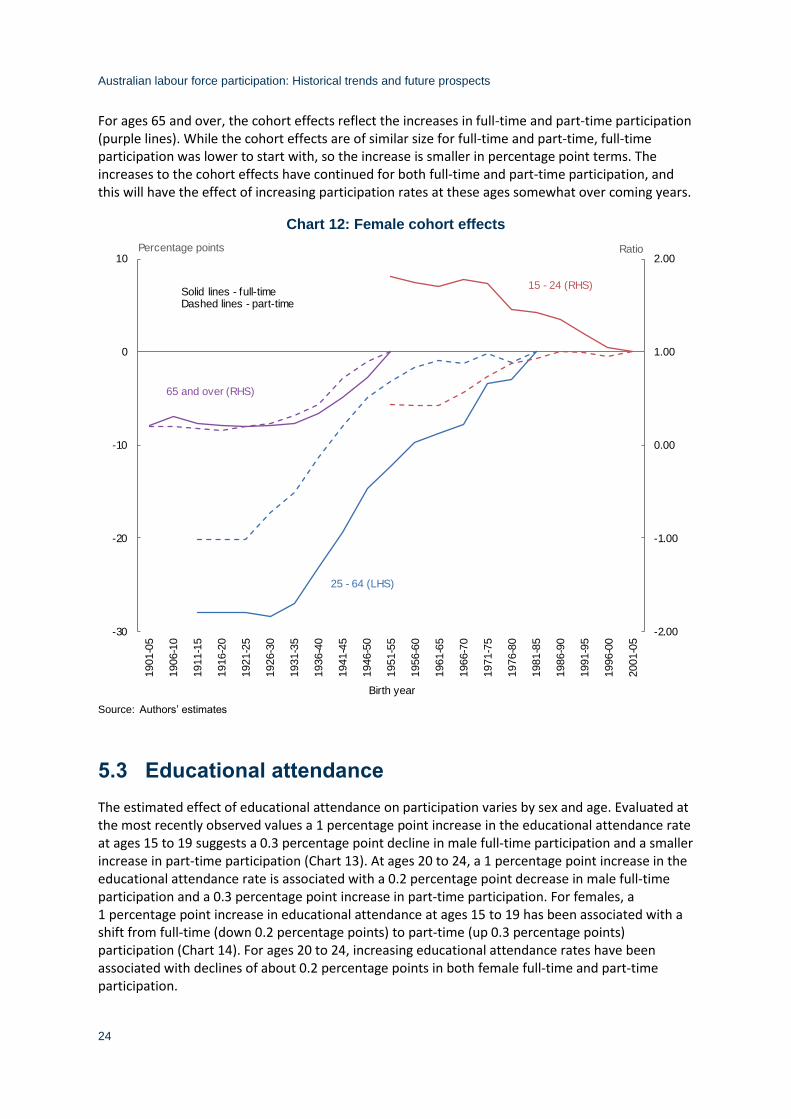
The cohort effects for females at the 15 to 24 stage of life reflect shifts from full-time to part-time participation rates (red lines in Chart 12). Both the full-time and part-time cohort effects have been relatively unchanged between the two most recent cohorts and this suggests that there will not be much further change to participation rate at these ages due to cohort effects.
Overall, the cohort effects for females aged 25 to 64 capture the long-term increase in both full-time and part-time participation (blue lines), with the increase in full-time participation larger than that for part-time participation. The part-time cohort effects for the 25 to 64 stage of life have been relatively stable for several cohorts (dashed blue line). This suggests no further increases in part-time participation rates from cohort effects. In contrast, the full-time cohort effects have continued to increase (solid blue line). As this effect flows through the age structure, we can expect participation rates at the later ages of this stage of life to continue to increase for some time.
0
20
40
60
80
0
20
40
60
80
15-1
9
20-2
4
25-2
9
30-3
4
35-3
9
40-4
4
45-4
9
50-5
4
55-5
9
60-6
4
65-6
9
70+
Per centPer cent
Age
0
20
40
60
80
0
20
40
60
80
15-1
9
20-2
4
25-2
9
30-3
4
35-3
9
40-4
4
45-4
9
50-5
4
55-5
9
60-6
4
65-6
9
70+
Per centPer cent
Age
Australian labour force participation: Historical trends and future prospects
24
For ages 65 and over, the cohort effects reflect the increases in full-time and part-time participation (purple lines). While the cohort effects are of similar size for full-time and part-time, full-time participation was lower to start with, so the increase is smaller in percentage point terms. The increases to the cohort effects have continued for both full-time and part-time participation, and this will have the effect of increasing participation rates at these ages somewhat over coming years.
Chart 12: Female cohort effects
Source: Authors’ estimates
5.3 Educational attendance
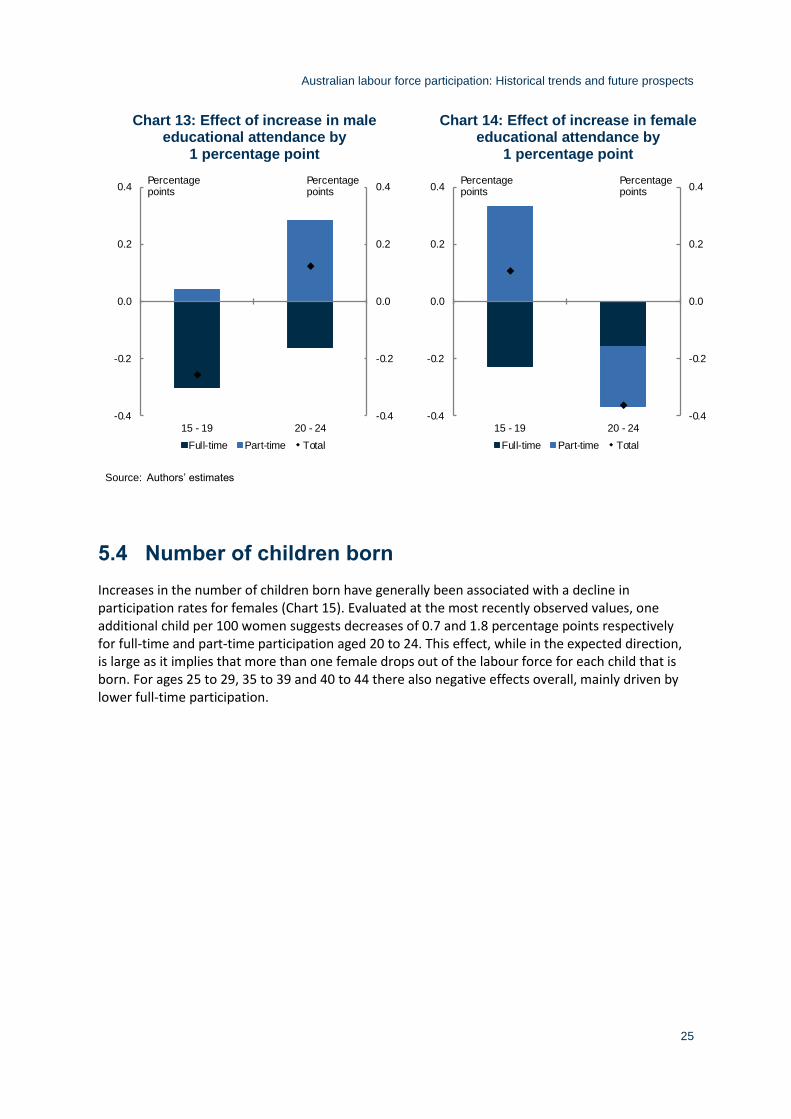
The estimated effect of educational attendance on participation varies by sex and age. Evaluated at the most recently observed values a 1 percentage point increase in the educational attendance rate at ages 15 to 19 suggests a 0.3 percentage point decline in male full-time participation and a smaller increase in part-time participation (Chart 13). At ages 20 to 24, a 1 percentage point increase in the educational attendance rate is associated with a 0.2 percentage point decrease in male full-time participation and a 0.3 percentage point increase in part-time participation. For females, a 1 percentage point increase in educational attendance at ages 15 to 19 has been associated with a shift from full-time (down 0.2 percentage points) to part-time (up 0.3 percentage points) participation (Chart 14). For ages 20 to 24, increasing educational attendance rates have been associated with declines of about 0.2 percentage points in both female full-time and part-time participation.
-2.00
-1.00
0.00
1.00
2.00
-30
-20
-10
0
10
1901-0
5
1906-1
0
1911-1
5
1916-2
0
1921-2
5
1926-3
0
1931-3
5
1936-4
0
1941-4
5
1946-5
0
1951-5
5
1956-6
0
1961-6
5
1966-7
0
1971-7
5
1976-8
0
1981-8
5
1986-9
0
1991-9
5
1996-0
0
2001-0
5
RatioPercentage points
Birth year
15 - 24 (RHS)
25 - 64 (LHS)
65 and over (RHS)
Solid lines - full-timeDashed lines - part-time
Australian labour force participation: Historical trends and future prospects
25
Chart 13: Effect of increase in male educational attendance by
1 percentage point
Chart 14: Effect of increase in female educational attendance by
1 percentage point
Source: Authors’ estimates
5.4 Number of children born
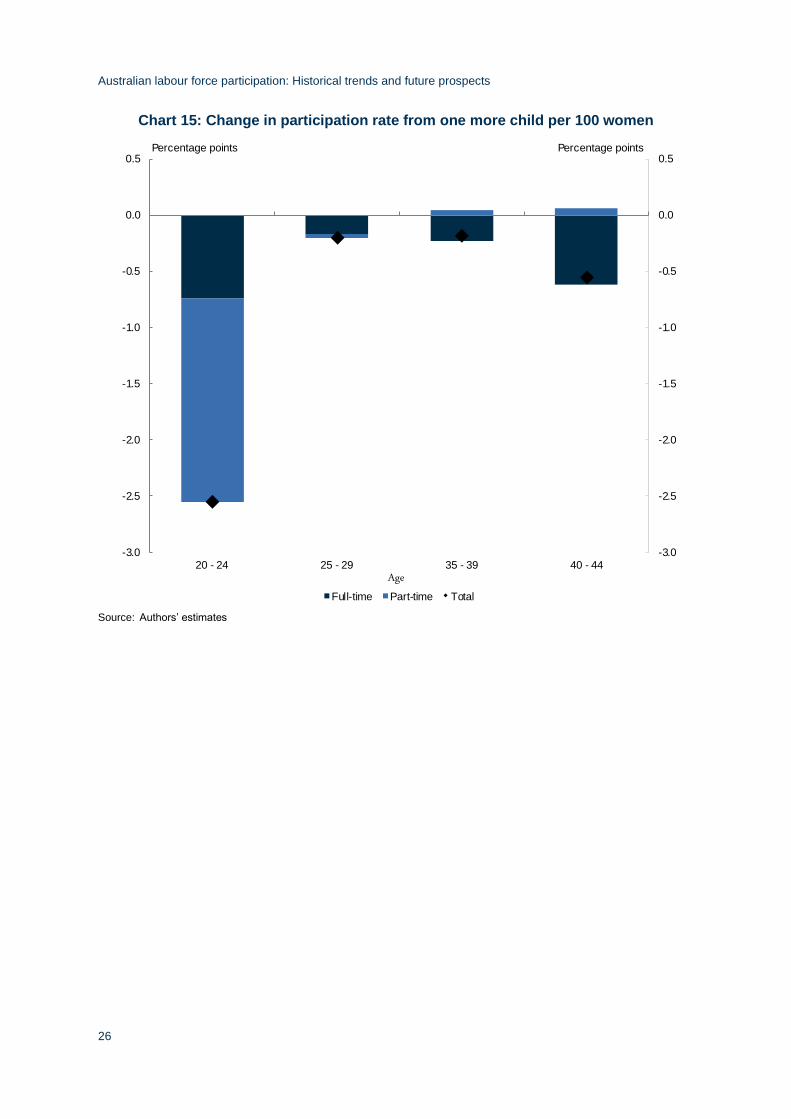
Increases in the number of children born have generally been associated with a decline in participation rates for females (Chart 15). Evaluated at the most recently observed values, one additional child per 100 women suggests decreases of 0.7 and 1.8 percentage points respectively for full-time and part-time participation aged 20 to 24. This effect, while in the expected direction, is large as it implies that more than one female drops out of the labour force for each child that is born. For ages 25 to 29, 35 to 39 and 40 to 44 there also negative effects overall, mainly driven by lower full-time participation.
-0.4
-0.2
0.0
0.2
0.4
-0.4
-0.2
0.0
0.2
0.4
15 - 19 20 - 24
Full-time Part-time Total
Percentagepoints
Percentagepoints
-0.4
-0.2
0.0
0.2
0.4
-0.4
-0.2
0.0
0.2
0.4
15 - 19 20 - 24
Full-time Part-time Total
Percentagepoints
Percentagepoints
Australian labour force participation: Historical trends and future prospects
26
Chart 15: Change in participation rate from one more child per 100 women
Source: Authors’ estimates
-3.0
-2.5
-2.0
-1.5
-1.0
-0.5
0.0
0.5
-3.0
-2.5
-2.0
-1.5
-1.0
-0.5
0.0
0.5
20 - 24 25 - 29 35 - 39 40 - 44
Percentage pointsPercentage points
Full-time Part-time Total
Age
Australian labour force participation: Historical trends and future prospects
27
6. Projections
In this section we report model-based projections of labour force participation rate trends for the next 40 years. It is important to note that the projections presented here do not account for future changes to government policies that affect labour force participation rates, such as the legislated increases to the age pension eligibility age over coming years. Producing fully policy-consistent projections would require adjustments to be made to the projections presented here (for example, by making different assumptions about future cohort effects).
6.1 Assumptions
Projections of future labour force participation rates require assumptions about the future path of all covariates and the cohort effects. While the assumptions presented below are plausible, they are not meant to represent our best guess at what the future will look like. Instead, they show what the observed trends in participation rates between different birth cohorts imply for the future under those plausible assumptions. These are then combined with projections of the demographic structure to show what future aggregate participation rates would look like under these assumptions.
Cohort effects
For each stage of life, it is assumed that the cohort effects of a cohort that enters the working-age population during the projections period are unchanged from the one for the youngest cohort in the estimation period. This means that in the absence of changes to other covariates the participation rates for future cohorts will be identical to the most recently observed cohorts.
Educational attendance rates
Educational attendance rates for those aged 15 to 24 are assumed to be unchanged from the most recently observed levels.
Number of children born
The number of children born to a given cohort of females have been calculated using projections of fertility rates (McDonald 2020) and the female population at different ages (Centre for Population, 2020).
Full-time male participation at ages 55 to 64
As discussed above, full-time participation rates for males aged 55 to 64 have not been modelled using the econometric based age-cohort framework. Instead, historical trends have been estimated using an HP filter. For the projections, the trend participation rates for these ages are held constant over the projections period.
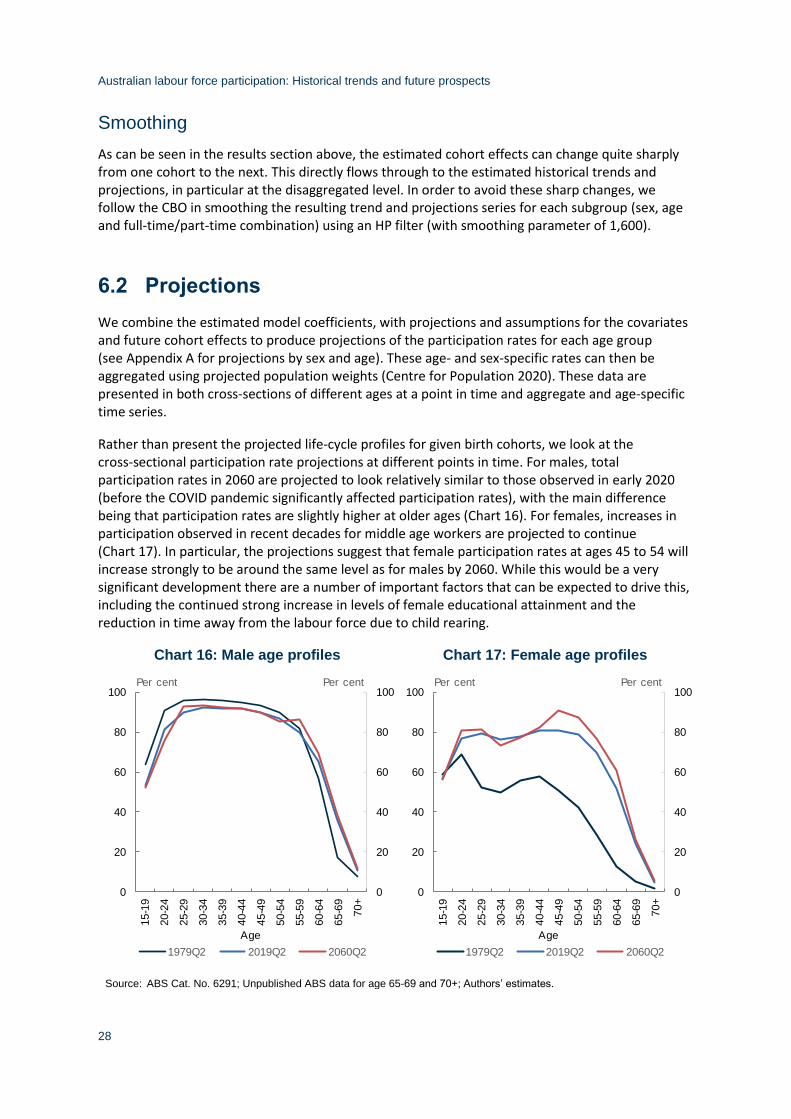
Australian labour force participation: Historical trends and future prospects
28
Smoothing
As can be seen in the results section above, the estimated cohort effects can change quite sharply from one cohort to the next. This directly flows through to the estimated historical trends and projections, in particular at the disaggregated level. In order to avoid these sharp changes, we follow the CBO in smoothing the resulting trend and projections series for each subgroup (sex, age and full-time/part-time combination) using an HP filter (with smoothing parameter of 1,600).
6.2 Projections
We combine the estimated model coefficients, with projections and assumptions for the covariates and future cohort effects to produce projections of the participation rates for each age group (see Appendix A for projections by sex and age). These age- and sex-specific rates can then be aggregated using projected population weights (Centre for Population 2020). These data are presented in both cross-sections of different ages at a point in time and aggregate and age-specific time series.
Rather than present the projected life-cycle profiles for given birth cohorts, we look at the cross-sectional participation rate projections at different points in time. For males, total participation rates in 2060 are projected to look relatively similar to those observed in early 2020 (before the COVID pandemic significantly affected participation rates), with the main difference being that participation rates are slightly higher at older ages (Chart 16). For females, increases in participation observed in recent decades for middle age workers are projected to continue (Chart 17). In particular, the projections suggest that female participation rates at ages 45 to 54 will increase strongly to be around the same level as for males by 2060. While this would be a very significant development there are a number of important factors that can be expected to drive this, including the continued strong increase in levels of female educational attainment and the reduction in time away from the labour force due to child rearing.
Chart 16: Male age profiles
Chart 17: Female age profiles
Source: ABS Cat. No. 6291; Unpublished ABS data for age 65-69 and 70+; Authors’ estimates.
0
20
40
60
80
100
0
20
40
60
80
100
15-1
9
20-2
4
25-2
9
30-3
4
35-3
9
40-4
4
45-4
9
50-5
4
55-5
9
60-6
4
65-6
9
70+
Per centPer cent
1979Q2 2019Q2 2060Q2
Age
0
20
40
60
80
100
0
20
40
60
80
100
15-1
9
20-2
4
25-2
9
30-3
4
35-3
9
40-4
4
45-4
9
50-5
4
55-5
9
60-6
4
65-6
9
70+
Per centPer cent
1979Q2 2019Q2 2060Q2
Age
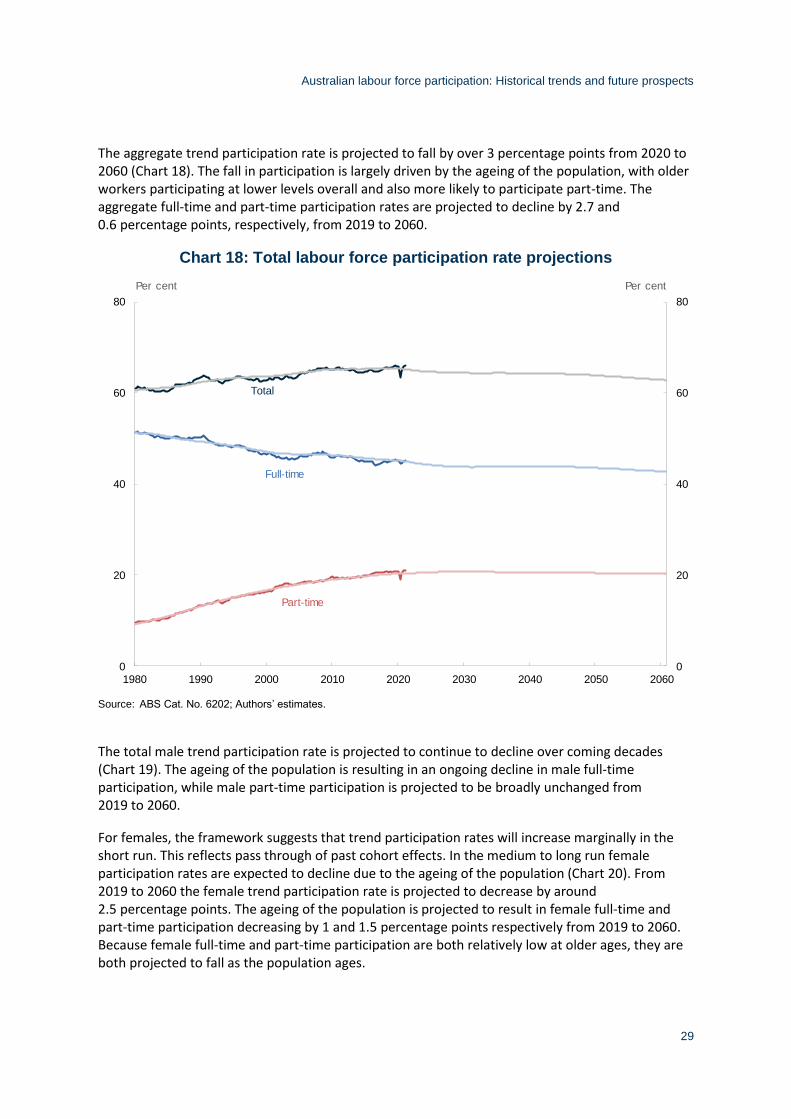
Australian labour force participation: Historical trends and future prospects
29
The aggregate trend participation rate is projected to fall by over 3 percentage points from 2020 to 2060 (Chart 18). The fall in participation is largely driven by the ageing of the population, with older workers participating at lower levels overall and also more likely to participate part-time. The aggregate full-time and part-time participation rates are projected to decline by 2.7 and 0.6 percentage points, respectively, from 2019 to 2060.
Chart 18: Total labour force participation rate projections
Source: ABS Cat. No. 6202; Authors’ estimates.
The total male trend participation rate is projected to continue to decline over coming decades (Chart 19). The ageing of the population is resulting in an ongoing decline in male full-time participation, while male part-time participation is projected to be broadly unchanged from 2019 to 2060.
For females, the framework suggests that trend participation rates will increase marginally in the short run. This reflects pass through of past cohort effects. In the medium to long run female participation rates are expected to decline due to the ageing of the population (Chart 20). From 2019 to 2060 the female trend participation rate is projected to decrease by around 2.5 percentage points. The ageing of the population is projected to result in female full-time and part-time participation decreasing by 1 and 1.5 percentage points respectively from 2019 to 2060. Because female full-time and part-time participation are both relatively low at older ages, they are both projected to fall as the population ages.
0
20
40
60
80
0
20
40
60
80
1980 1990 2000 2010 2020 2030 2040 2050 2060
Per centPer cent
Total
Full-time
Part-time
Australian labour force participation: Historical trends and future prospects
30
Chart 19: Male labour force participation rate projections
Chart 20: Female labour force participation rate projections
Source: ABS Cat. No. 6202; Authors’ estimates.
0
20
40
60
80
0
20
40
60
80
1980 2000 2020 2040 2060
Per centPer cent
Total
Full-time
Part-time
0
20
40
60
80
0
20
40
60
80
1980 2000 2020 2040 2060
Per centPer cent
Total
Full-time
Part-time
Australian labour force participation: Historical trends and future prospects
31
7. Conclusion
In this paper we have shown that trends in participation rates over recent decades can be explained by a model with identified age and cohort effects, and a limited number of other covariates. The estimated cohort effects suggest that differences in the propensity to participate between generations are useful for understanding long-term trends in labour force participation rates.
The estimated age and cohort effects point to several important observations. For both young females and males there has been a significant shift from full-time to part-time participation over several decades. However, the most recent cohort effects suggest that full-time and part-time participation rates at younger ages might be stabilising. For males of prime working-age there has been a shift from full-time to part-time participation and this has continued for the most recent cohorts. This can be expected to flow through to younger cohorts’ participation at later stages of their prime working-age. For prime-working females, there has been an increase in both part-time and full-time participation, but the estimated cohort effects suggest that part-time participation has stabilised while full-time participation has continued to increase for recent cohorts. The cohort effects also capture the increase in full-time and part-time participation rates at ages 65 and over for males and females. While this has continued for the most recent cohorts, there is an open question to what extent this is due to changes to age pension and superannuation policy or whether it is reflecting a broader set of developments such as increased life expectancy and structural changes in the economy.
These estimated differences between birth cohorts are expected to flow through the age structure for many decades to come and result in a continuation of many of the trends observed over the past 40 years. However, the positive effect of these trends on aggregate participation rates are more than offset by the ageing of the population.
This paper represents a first attempt at using this type of empirical life-cycle framework for producing longer-term projections of participation rates in Australia. As such, we expect the framework to continue to be developed and improved. Adding additional covariates in the model (subject to available data) could be a particularly useful extension, with possible additions including a richer set of variables related to educational attainment, retirement incomes, and the cost and availability of childcare services.
Australian labour force participation: Historical trends and future prospects
32
References
Aaronson, S. Bruce, F. Figura, A. Pingle, J. F. and Wascher, W. L. 2006. The recent decline in the labor force participation rate and its implications for potential labor supply, Brookings Papers on Economic Activity 2006 (1): 69-154, Brookings Institution.
Atalay, K. and Barret, G. 2015, The impact of age pension eligibility age on retirement and program dependence: evidence from an Australian experiment, The Review of Economics and Statistics, 97, pp. 71-87.
Australian Bureau of Statistics 2020a, Births, Australia, 2019, Cat. No. 3301.0, AusInfo, Canberra.
Australian Bureau of Statistics 2020b, Labour Force, Australia, Detailed, Cat. No. 6291.0.55.001, AusInfo, Canberra.
Australian Bureau of Statistics 2020c, Labour Force, Australia, Cat. No. 6202.0, AusInfo, Canberra.
Australian Bureau of Statistics 1986, Transition from Education to Work, Australia, May 1985, Cat. No. 6227.0, AusInfo, Canberra.
Australian Curriculum, Assessment and Reporting Authority. 2011. National Report on Schooling in Australia 2011, ACARA, Sydney 2013
Borland, J. and Coelli, M. 2020. Is it ‘dog days’ for the young in the Australian labour market?
Centre for Population 2020. Population Statement, The Australian Government, Canberra.
Commonwealth of Australia 2015, 2015 Intergenerational Report, 5 March 2015 Canberra, https://treasury.gov.au/publication/2015-igr
Department of Social Services 2018. Social Security Guide, Accessed on 11 March 2021, http://guides.dss.gov.au/guide-social-security-law/3/4/1/10
Grigoli, F. Koczan, Z. and Topalova, P. 2018. A Cohort-Based Analysis of Labor Force Participation for Advanced Economies, Working Paper No. 18/120, International Monetary Fund
Kudrna, J. and Woodland, A. 2013. Macroeconomic and Welfare Effects of the 2010 Changes to Mandatory Superannuation, Economic Record, 89, pp. 445-468.
McDonald, P. 2020, A Projection of Australia’s Future Fertility Rates, Centre for Population Research Paper, The Australian Government, Canberra.
Montes, J. 2018. CBO’s Projection of Labor Force Participation Rates, Working Paper 2018-04, Congressional Budget Office.
Morris, T. 2019. Large Response to Delayed Eligibility or a Pre-Existing Trend in Female Participation? Re-Examining an Australian Pension Reform, SSRN Working Paper No. 3382046.
Productivity Commission 2019. The Demand Driven University System: A Mixed Report Card, Commission Research Paper, Canberra.

Australian labour force participation: Historical trends and future prospects
33
Productivity Commission 2020. Why did young people’s incomes decline?, Commission Research Paper, Canberra.
Rodgers, D. 2019, Pension and Participation: Evidence from WWII Veterans in Australia, Unpublished manuscript, School of Economics, University of New South Wales.
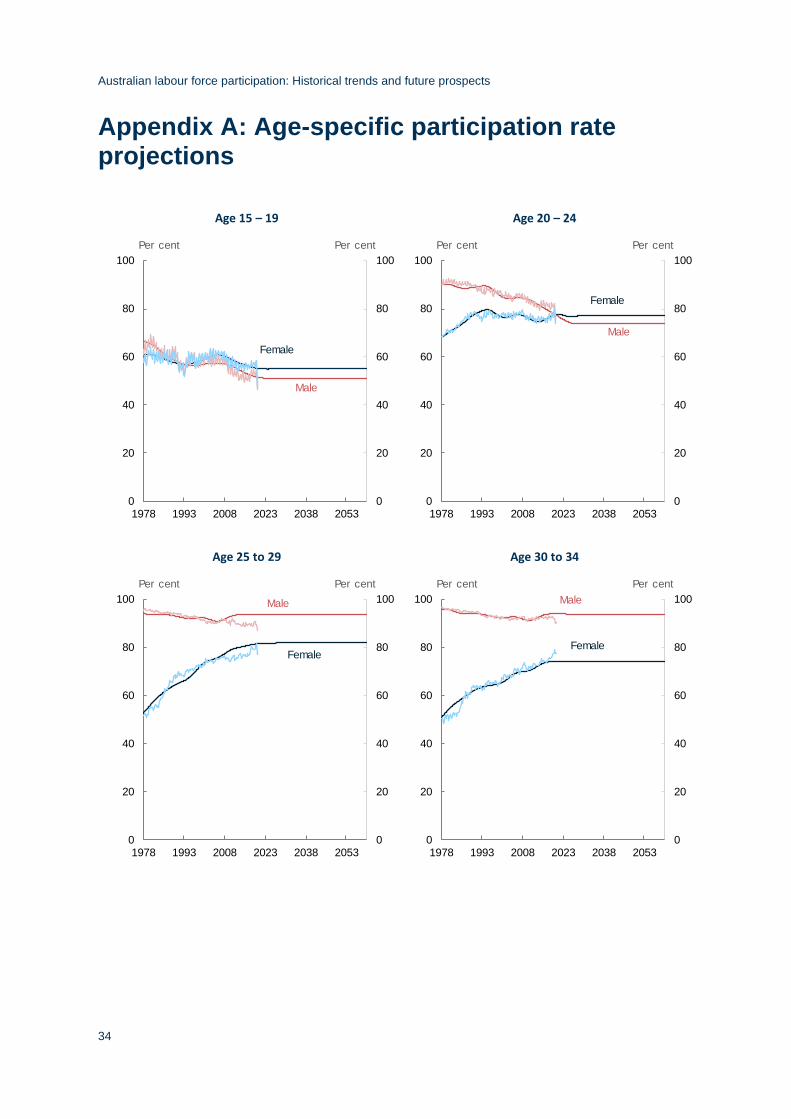
Australian labour force participation: Historical trends and future prospects
34
Appendix A: Age-specific participation rate projections
Age 15 – 19
Age 20 – 24
Age 25 to 29
Age 30 to 34
0
20
40
60
80
100
0
20
40
60
80
100
1978 1993 2008 2023 2038 2053
Per centPer cent
Female
Male
0
20
40
60
80
100
0
20
40
60
80
100
1978 1993 2008 2023 2038 2053
Per centPer cent
Female
Male
0
20
40
60
80
100
0
20
40
60
80
100
1978 1993 2008 2023 2038 2053
Per centPer cent
Female
Male
0
20
40
60
80
100
0
20
40
60
80
100
1978 1993 2008 2023 2038 2053
Per centPer cent
Female
Male
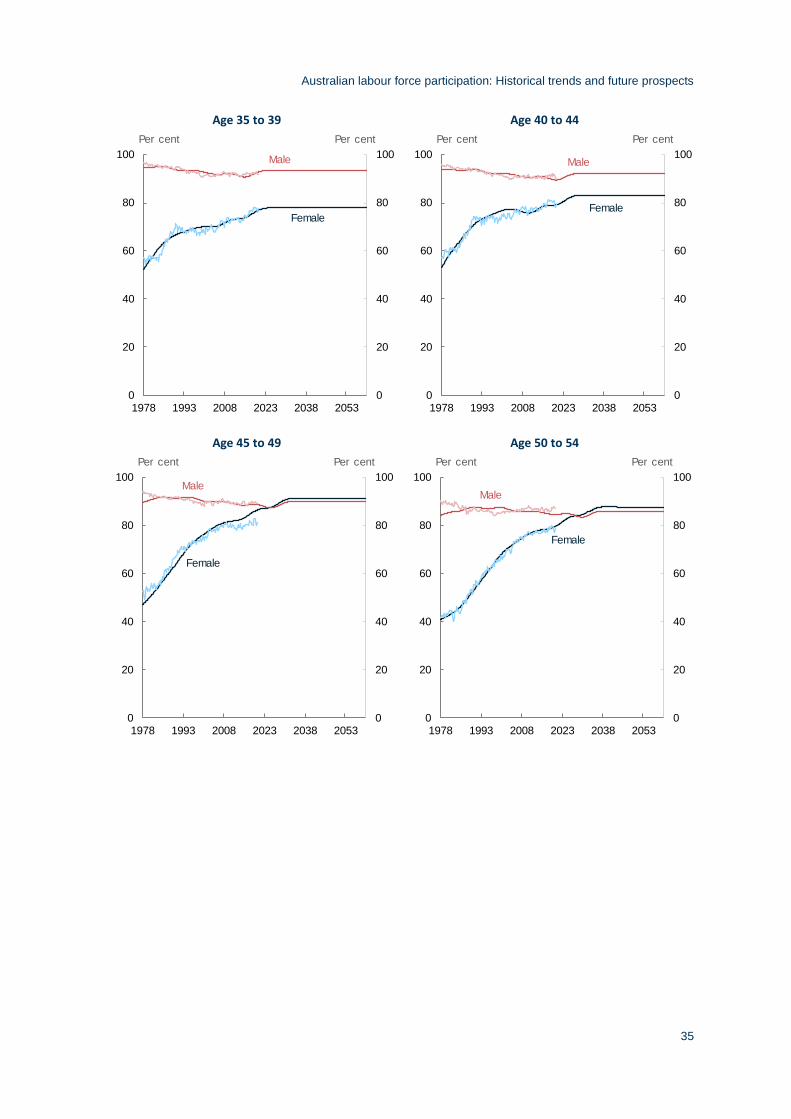
Australian labour force participation: Historical trends and future prospects
35
Age 35 to 39
Age 40 to 44
Age 45 to 49
Age 50 to 54
0
20
40
60
80
100
0
20
40
60
80
100
1978 1993 2008 2023 2038 2053
Per centPer cent
Female
Male
0
20
40
60
80
100
0
20
40
60
80
100
1978 1993 2008 2023 2038 2053
Per centPer cent
Female
Male
0
20
40
60
80
100
0
20
40
60
80
100
1978 1993 2008 2023 2038 2053
Per centPer cent
Female
Male
0
20
40
60
80
100
0
20
40
60
80
100
1978 1993 2008 2023 2038 2053
Per centPer cent
Female
Male
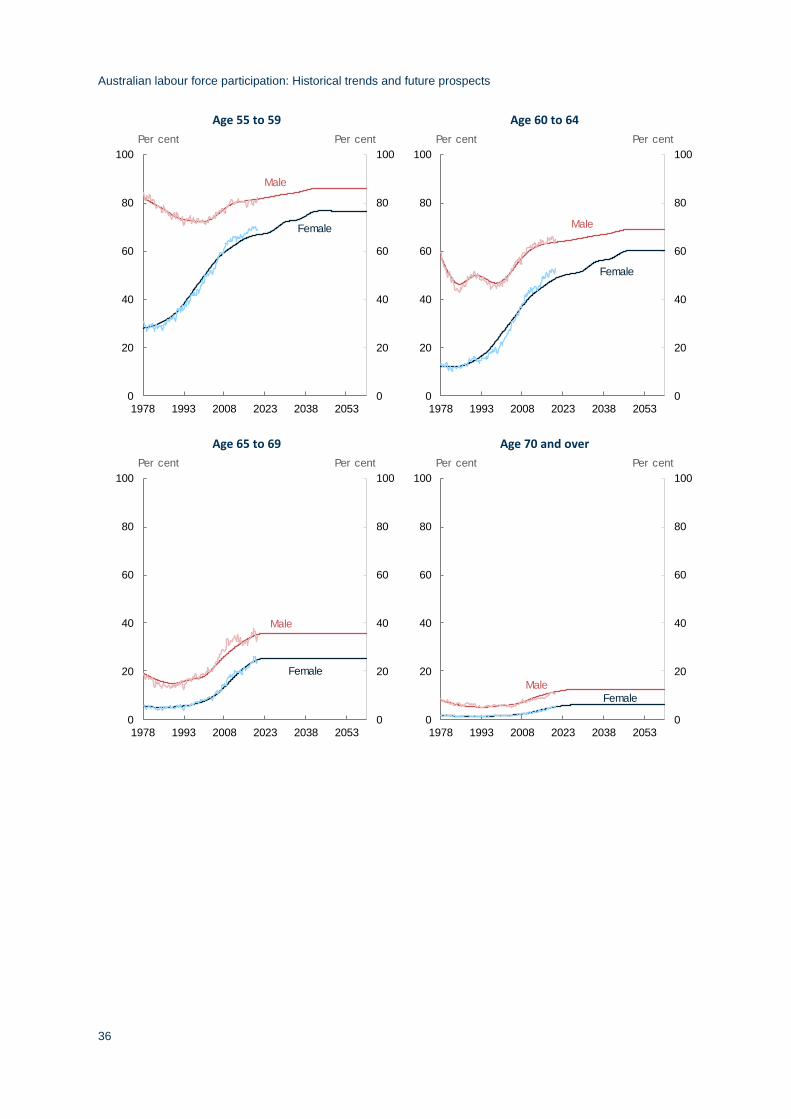
Australian labour force participation: Historical trends and future prospects
36
Age 55 to 59
Age 60 to 64
Age 65 to 69
Age 70 and over
0
20
40
60
80
100
0
20
40
60
80
100
1978 1993 2008 2023 2038 2053
Per centPer cent
Female
Male
0
20
40
60
80
100
0
20
40
60
80
100
1978 1993 2008 2023 2038 2053
Per centPer cent
Female
Male
0
20
40
60
80
100
0
20
40
60
80
100
1978 1993 2008 2023 2038 2053
Per centPer cent
Female
Male
0
20
40
60
80
100
0
20
40
60
80
100
1978 1993 2008 2023 2038 2053
Per centPer cent
Female
Male
Australian labour force participation: Historical trends and future prospects
37
Appendix B: Data
Participation rates
The participation rate is defined as the per cent of the working-age (15 and over) population that is participating in the labour force. Individuals are considered to be participating if they are either working or actively looking for work. The Australian Bureau of Statistics (ABS) publishes labour force data at a monthly frequency in the Labour Force Survey (ABS Cat. No. 6202 and ABS Cat. No. 6291). Data in original terms are available by sex and by five-year age groups between 15-19 and 60-64 and for those aged 65 and over. In addition, this paper uses unpublished ABS data that splits the 65 and over category into those aged 65-69 and 70 and over. The monthly data has been converted to quarterly frequency by averaging the monthly data.
Full-time and part-time participation rates
The ABS defines a full-time employee as somebody who usually works 35 hours or more per week, or did so in the survey week, and a part-time employee as someone who worked between one and 34 hours per week. Consistent with this definition, we adopt the following participation rate definitions: i) full-time participation rate is defined as the share of the civilian working-age population that is either working full-time, or unemployed and looking for full-time or part-time work; ii) part-time participation rate is defined as the share of the civilian working-age population that is either working part-time, or unemployed and only looking for part-time work.
Educational attendance rates
The educational attendance rate is defined as the proportion of a group that attends an educational institution full-time. The ABS publishes monthly data on the number of individuals in age groups 15-19 and 20-24, by sex, that attends an educational institution full-time. This data is available for the period since April 1986 (Cat. No. 6202). We then construct a series for the 1981 to 1985 period from the ABS ‘Transition from education to work Australia’ publication (Cat. No. 6227), which provides observations for the May month of 1981 to 1985. For the missing months in this period we interpolate the values. The educational attendance rate is then calculated using the population data by age group and sex from the labour force survey.
The data were converted from monthly to quarterly frequency by averaging the monthly observations. In order to be able to utilise the full sample of participation rate data (the quarterly series starts in the second quarter of 1978), we extrapolate the educational attendance rate data backwards using a linear trend fitted through the earliest 10 years of data available.
Fertility rates
The ABS publishes data on fertility rates by single year of age at an annual frequency (ABS Cat. No. 3301). We aggregate the single-year of age data into age groups consistent with the labour force data.