australian science - home - productivity commission
TRANSCRIPT
Australian SciencePerformance from published papers
Report 96/3
January 1996
Australian Government Publishing ServiceCanberra

© Commonwealth of Australia 1996
This work is copyright. Apart from any use as permitted under the Copyright Act1968, no part may be reproduced by any process without written permission fromthe Australian Government Publishing Service. Requests and inquiries concerningreproduction and rights should be directed to the Manager, CommonwealthInformation Services, Australian Government Publishing Service, GPO Box 84,Canberra ACT 2601.
ISBN 0 644
The Bureau of Industry Economics is a centre for research into the manufacturingand commerce sectors and is formally attached to the Department of Industry,Science and Technology. It has professional independence in conducting andreporting its research.
Inquiries about this and all other BIE publications should be directed to:
Publications OfficerBureau of Industry EconomicsGPO Box 9839CANBERRA ACT 2601
Ph: (06) 276 2347 Fax: (06) 276 1846 E-mail: [email protected]
Printed in Australia by

iii
Foreword
In 1995, the BIE undertook to benchmark the Australian science and technologysystem. As in all our international benchmarking studies, the major objective of theproject was to learn how we compare with leading nations and, perhaps, how to dothings better. By having a few well understood indicators, we will be better able tomonitor our progress. The science benchmarking project involves identifyingquantitative and qualitative indicators of outputs, inputs and science capabilities.This is one of three reports associated with the project. The first, Science Awarenessand Understanding (June 1995), dealt with the Australian public’s understandingand awareness of science. The second, Science System: International benchmarking(January 1996), is the major report of the project. This, the third, deals in moredetail with the performance of codified scientific research as measured by papersand citations.
In producing this report we are indebted to Paul Bourke and Linda Butler of theResearch School of Social Sciences at the Australian National University for theprovision of data, insights and comments on a draft. Dr Lyn Grigg provided someadditional useful insights. We also wish to thank David Pendlebury of the Instituteof Scientific Information, whose ISI database form the backbone of this study. Wealso extend our thanks to the Department of Industry, Science and Technology’sS&T counsellors – Dr Mike Fitzpatrick (London), Daryl Back (Washington) andDon Smale (Japan) – who provided valuable data for this report.
The report was prepared by Ralph Lattimore and John Revesz with some researchassistance from Samantha Welsh. John Houghton was an internal referee andprovided very useful comments as did Barbara Martin.
January 1996 Bob HawkinsDirector


v
Contents
Foreword iii
Summary xv
1. Introduction 11.1 Introduction 1
1.2 Background 1
1.3 Why codified knowledge matters 1
1.4 The database 2
1.5 Organisation of the report 3
2. A snapshot of Australia’s performance 42.1 The results for total publications 4
2.2 Australia’s contribution by field of research 9
2.3 Scientific proclivity 17
3. Internationally co-authored publications 203.1 Introduction 203.2 Where does Australia collaborate? 23
4. Australia’s scientific publications and citations over time 284.1 Publications over time 284.2 Citations over time 304.3 Possible reasons for the decline in citation rates 414.4 A model of the decline in citation rates 504.5 Structural changes in science fields over time 524.6 Basic science proclivity over time 55
5. Conclusion 60
Appendixes
A The Use and abuse of bibliometrics 61

vi CONTENTS
BE
B Formulas 66
C Bibliometric statistics 68
D Could the decline be illusory? 85
References 87
Tables2.1 Papers and citations, 1981 to 1994 52.2 Citation impacts, 1981 to 1994 72.3 Hypothetical impact of structural differences on citation impact 72.4 Citations per paper adjusted for science structure 82.5 Papers and citations by field of science, 1981-1994 102.6 Australia’s world ranking by scientific field, 1981-1994 122.7 Scientific performance adjusted for population and income, 1992 183.1 Share of national publications which are internationally co-authored 203.2 Internationally co-authored publications over time 213.3 Australian international collaboration by region by time (percentage
share of Australian co-publications) 243.4 Percentage distribution of Australian higher education international
co-publications 1981-92 253.5 Scores of collaborative intensity by field by region, 1981-92 253.6 International collaboration (percentage share of each country’s total
collaborative articles with other countries), 1988-94 263.7 Measures of the strength of international collaboration 274.1 Growth rates in scientific papers 294.2 Australia’s scientific publication performance over time,
1981 to 1994 324.3 Trend rates of growth in citation/paper performance,
1981-85 to 1990-94 364.4 The visibility and quality of science, 1981-85, 1985-1989
and 1990-94 374.5 Trends in relative citation impacts, high and low performing fields,
1981-85 to 1990-94 404.6 What does the model imply about the change in Australia’s relative
citation impact between 1981 and 1990? 524.7 Structural change in science, 1981-85 to 1990-94 534.8 The effect of structural change in Australian science on relative
citation impact 55

BUREAU OF INDUSTRY ECONOMICS
CONTENTS vii
4.9 Changes in the consistency and specialisation of science, 1981-85 to1990-94 56
4.10 Papers per population and GDP over time 57C.1 Fields in the database 68C.2 Share of world papers by field, 1981-1994 (selected countries) 69C.3 Share of world citations by field, 1981-1994 (selected countries) 71C.4 Relative citation rate per paper by field, 1981-1994 (selected
countries) 73C.5 Niches of comparative advantage and disadvantage in codified
science, 1981-1994 75C.6 Absolute advantages and disadvantages high and low citation shares
by field by country 77C.7 Absolute quality advantages and disadvantages high and low citation
rates by field by country 79C.8 Relative growth rates in publication shares by field by country,
1981-1985 to 1990-1994 81C.9 Growth rates in relative citation impacts by field by country,
1981-1985 to 1990-1994 83D.1 How the declining rates could be spurious: some simulated numbers 86
Figures2.1 Comparative advantage and quality 132.2 Patterns of comparative advantage in publications 142.3 Evenness of quality and specialisation in science, 1981-1994 163.1 Type of authorship, Australian higher education scientific papers,
1981 and 1992 223.2 Distribution of collaboration by region, 1981-92 234.1 Growth in Australian and world scientific papers, 1981 to 1994 284.2 Australia’s share of world scientific publications, 1973 to 1994 304.3 Australia’s relative citation impact, 1973 to 1994 334.4 Citation rates in Australian science, 1981-85 to 1990-94 344.5 Trend rates of growth in relative citation impacts by field, Australia 344.6 Growth in paper and citation shares by country, 1981-85 to 1990-94 394.7 Distribution of growth rates in relative citation impacts 424.8 Structural change and quality in Australian science 434.9 Distribution of citations, Australia, 1981-90 454.10 Is there convergence in scientific performance? 484.11 Changes in revealed comparative advantage in Australia, 1981-85 to
1990-94 54
viii CONTENTS
BE
4.12 Index of ISI papers per research scientist and engineer (Australia1981 figures =100.0) 1981 to 1992 59
A.1 Bias in the last year data for Australian relative citation impacts 62
Boxes2.1 The whimsical nature of technology 172.2 Scientific proclivity 194.1 Modelling the falling relative citation rate 50

ix
Abbreviations
BIE Bureau of Industry Economics
ISI Institute of Scientific Information
S&T Science and technology
RCA Revealed comparative advantage
NSF National Science Foundation
ASRC Australian Standard Research Classification


xi
Summary
This publication accompanies the BIE’s benchmarking report on science(BIE 1996). In this report, we use data on scientific papers and citations to look atthe performance of Australian academic science relative to other countries.Scientific papers only measure one part of a science system, but they suggestsomething of the quality, productivity and breadth of basic scientific research.
Australia’s relative performance
Australian science produced 180 000 papers from 1981 to 1994 or 2.1 per cent ofscience papers in the world. By world standing this is a large contribution. Australiais ranked tenth in the world in our absolute contribution to scientific papers.
® Australia produces 25 per cent more than Sweden, 50 per cent more thanSwitzerland, twice as much as China, five times more than Taiwan and nearlynine times more than South Korea.
Australian scientific papers are widely cited relative to most countries:
® citations per paper provide a measure of the visibility and, to some extent,quality of academic scientific research. Australia has higher average citationrates than Germany, France, Italy and Japan. Australia has the third highestcitation rate among APEC countries (behind the US and Canada).
Australia has particular excellence in fields close to our rich natural endowments,with high relative citation rates for papers in agriculture, ecology and theenvironment, geoscience and plant and animals science.
Australia has broad scientific capabilities as measured by the shares of papers across20 scientific fields. Australian science is less broad than the US, Canada and themajor European economies, but broader than Sweden, Norway and Japan. Broadnessincreases the technological and scientific options available to a country – which isimportant when it is hard to foresee new scientific developments.

xii SUMMARY
BE
Australia has highly consistent quality in scientific publications across fields – moreso than the UK, Netherlands and France (ie quality does not vary too much acrossfields).
Australia contributes more to published science than its income or population wouldsuggest. For example, Australian scientists publish 60 per cent more papers thanwould be normally expected given our income.
International links
Australia has strong and rapidly growing academic linkages with other countries.Over one fifth of Australia’s higher education scientific papers were co-authoredwith a foreign scientist – a near doubling of the proportion since 1981.
Europe and North America are still the most important sites for collaboration. From1981 to 1992, nearly 80 per cent of Australia’s academic collaborative papers werewith the US, Canada, the UK and Europe. Over the last decade, Europe has grown inprominence while the UK has declined. We also found particularly strong growth incollaboration with Asia, and particularly Japan and China. Interestingly, there wasnegligible growth in the already weak levels of scientific academic collaborationwith either Taiwan or South Korea – two of the most dynamic of the emergingscientifically developed countries in the region.
Dynamic performance
At 3.6 per cent per annum over the last 14 years, Australia’s growth in papers hasbeen roughly on par with world trends. However, much of this growth occurredsince 1988 – so that Australia’s share of world’s most prominent scientificpublications grew during the last six years.
But the picture suggested by citation rates is more complex. Citation rates roseslowly from the early 1980s before plateauing in the late 1980s. In contrast, worldcitation rates continued to grow, so that Australia’s relative citation impact has beenfalling (with a particularly abrupt downturn since the late 1980s).
The fields experiencing the biggest reductions in relative citation impact wereimmunology, chemistry, materials science and microbiology. In contrast, fields suchas engineering, mathematics, astrophysics and multidisciplinary science increasedtheir relative citation impact over the last decade.

BUREAU OF INDUSTRY ECONOMICS
SUMMARY xiii
It is hard to interpret these falling relative citation impacts. We find that:
® Australia’s case is not exceptional. Countries like Denmark, Norway andSweden have faced similar reductions. Nor is it the case that the newlyindustrialised countries are overtaking us: both Taiwan and South Korea alsofaced reductions of the same order as Australia (albeit they expanded their shareof world publications dramatically at the same time).
® There have been other periods (such as the mid 1970s) when Australia’srelative citation impacts have fallen – only to recover later.
® All countries have some fields which have been declining. Indeed we find thatthe ‘average’ country has nine fields out of twenty experiencing such a decline.But Australia is distinctive in that so many (15 of 20) scientific fields haveexhibited a trend decline in relative citation impacts from 1981-85 to 1990-94.
The report examines a wide range of reasons which might underlie the generaldecline in impact. Some of the pattern of falling relative citation rates appears to bedue to convergence by countries with poorer systems. We also found evidence thattwo factors are positively correlated with citation rates – R&D spending per head ofpopulation (especially on higher education), and published papers per researcher.The former has risen in Australia in recent years, while the latter has fallen – withthe second effect dominating.
The report considered a range of other possible factors, such as dilution of resourcesfor the best scientists, structural change in science, poorer access to networks,ageing of scientists, a weakening in the quality of our scientists, and data errors. Insome cases, such as ageing and structural change, these are unlikely to underlie thedecline. For most of the others, there was insufficient evidence to come to a clear-cut conclusion.
BUREAU OF INDUSTRY ECONOMICS
INTRODUCTION 1
1. Introduction
1.1 Introduction
In 1993 Science Watch, a journal produced by the Institute of Scientific Information(ISI) in the US, revealed a recent decline in the impact of Australian scientificpublications. This study was followed by Bourke and Butlers’ (1994) elaborate andcareful examination of data based on scientific papers. They found a decline inAustralia’s share of world citations, and a relatively stable share of world publications.We re-assess this issue in this report by looking closely at the Australian data, makingdetailed comparisons with other countries and trying to discover some of the causes ofthe patterns that we find.
But our interest in these data extends beyond this re-assessment. We use the publicationdata to examine other aspects of the Australian science system, such as structuralchange, its relative standing in the region, and the extent to which Australian scientistsare establishing linkages with other countries. This report is a companion volume toBIE (1996) which makes a detailed assessment of how the Australian science system isperforming relative to other countries.
1.2 Background
Since 1991 the BIE has conducted a comprehensive set of benchmarking studies ofinfrastructure services. These have included electricity, telecommunications and gas,among others. More recently we have extended benchmarking to less tangibleinfrastructure, including Australia’s science and technology system (S&T). In thisreport we present results on the performance of Australia’s science system using dataon scientific papers, while in BIE (1996) we present an overall appraisal of the system.
1.3 Why codified knowledge matters
Many of the major benefits of a science system occur through tacit transfers ofknowledge and skill transfers rather than through codified knowledge, such as patents

2 AUSTRALIAN SCIENCE
BE
or scientific papers. Nevertheless, codified knowledge in the form of publishedscientific literature remains important. It:
• provides valuable knowledge to institutions or firms with enough scientificcapacity to absorb it;
• is accessible to many users and can be disseminated easily and cheaply;
• provides a permanent store of knowledge that can be exploited years after itsproduction;
• provides pointers to key research and to important practitioners of science –whether they are institutions or individual researchers; and
• certifies the origin of ideas, which is important in determining status andpromotion within the institutions producing research outputs.
It is therefore worthwhile measuring the magnitude, productivity, and impact of suchscientific codified knowledge. This is the subject of this report. We use statisticalanalysis of publications and citations – so-called bibliometrics – to do this.
1.4 The database
The Institute for Scientific Information (ISI) in Philadelphia has produced a majorstatistical database on scientific papers and citations for about 80 countries and morethan 4000 journals for the years 1981 to 1994.1 The countries included are those whichpublished 1000 or more papers2 in science journals indexed by the ISI over this period,while the journals cover the most influential peer reviewed scientific journals. Therecords of papers and citations have been divided into 20 fields of science.3
1 We thank David Pendlebury of ISI for assistance with the ISI database and for permission to publish the
results in this chapter. The ISI country listing needed to be adapted for our purposes. The list includes somedouble counting (for example it incorporates Wales, Scotland, Northern Ireland and England as well as theUK). For recent years it also incorporates some new countries such as the Ukraine, Russia and the othernew states formed after the collapse of the Soviet Union, while maintaining listing of the USSR for pastyears. Since many benchmark measures (such as ranking) make little sense if there are changes in thecountries, we maintained a constant country list through time by ignoring these changes in boundaries andby excluding any double counted countries. Altogether that left 79 countries.
2 Papers are defined as articles, notes, reviews and proceedings papers but not editorials, letters, correctionsor abstracts. A paper is attributed to a country so long as one of the authors was addressed to that country.For this reason, the sum of papers across countries is higher than the total number of papers produced.
3 The ISI database actually covers some additional social science disciplines, but we have excludedthese fields from our analysis. At this level of aggregation, the ISI classification of fields vary from thoseof the Australian Standard Research Classification (ASRC).

BUREAU OF INDUSTRY ECONOMICS
INTRODUCTION 3
There are many different ways in which the database can be used to indicate the outputand impact of scientific papers, running from absolute counts of citations and papers tocomparisons of citations per paper between countries and fields.
The ISI database has limitations (appendix A). It does not include all codified forms ofknowledge, such as books, conference papers, working papers, and Internet notes. Nordoes it cover all significant scientific journals – many Australian journals are notincluded. Nor are journals from non-English speaking countries as well represented asthose from English speaking countries. Nevertheless:
• coverage is still high for most fields; and
• many of these deficiencies are irrelevant if the purpose is to compare relativeperformance over time. A bias would only be produced if Australian journalswere increasingly under or over-represented compared to other countries.
We emphasise that when we make ‘world’ comparisons using the ISI database, someparts of the world are less represented in the journal set than is desirable.
1.5 Organisation of the report
In chapter 2 we take a snapshot of Australia’s performance in scientific papers andcitations relative to the world. We explore our strengths and weaknesses by scientificfield – and make an overall assessment of Australia’s scientific proclivity.
In chapter 3 we examine the pattern of collaboration with other countries – to see theextent and focus of academic scientific collaborative publishing.
In chapter 4 we turn to Australia’s performance over time. In particular, we criticallyexamine whether and why Australian scientific papers are being cited less often relativeto the world.
We interpret and summarise the overall results in chapter 5.
AUSTRALIAN SCIENCE
\BE
4
2 A snapshot of Australia’sperformance
2.1 The results for total publications
Over the period from 1981-1994 Australia produced about 180 000 papers1 or 2.1 percent of science papers in the world (table 2.1).
While this is small in absolute terms, it is far larger than many other countries.Australia produces 10 per cent more than the Netherlands, 25 per cent more thanSweden, 50 per cent more than Switzerland, more than twice as much as China, fivetimes more than Taiwan, and nearly nine times more than South Korea. Australia isranked fourth (behind the US, Japan and Canada) in its production of scientific papersamong the 18 countries of APEC.
Counts of papers suffer some limitations as a measure of codified knowledge. Inparticular, a superb and path breaking paper is given the same weight as a mediocreone. One method of adjusting for quality differences is to look at citations rather thanpapers. This method also suffers from limitations:
• Scientists find it costly to search all journals for high quality articles relevant to agiven scientific field. Researchers will often reduce these search costs by using(and citing) articles in the most prominent journals and by the most prominentscientists. This suggests, for example, that citation rates of an excellent article bya researcher with a known reputation published in a well known journal will behigher than that of an equally excellent paper by a relatively unknown researcherin a less well known journal.
• Papers which describe technical methods may be cited thousands of times, whilepath breaking papers which are ahead of the times may be cited relatively slightlyfor many years. For example, in chemistry most of the highly cited publicationsare simple trade recipes, analytical methods in biochemistry and manipulativetechniques rather than profound science (NBEET 1993, p.60).
1 Note that this relates only to peer reviewed papers in the journals covered by the ISI. The total would be
higher if other journals were included.

BUREAU OF INDUSTRY ECONOMICS
A SNAPSHOT OF AUSTRALIA’S PERFORMANCE 5
• Papers published in English will tend to be cited more frequently than non-English papers.
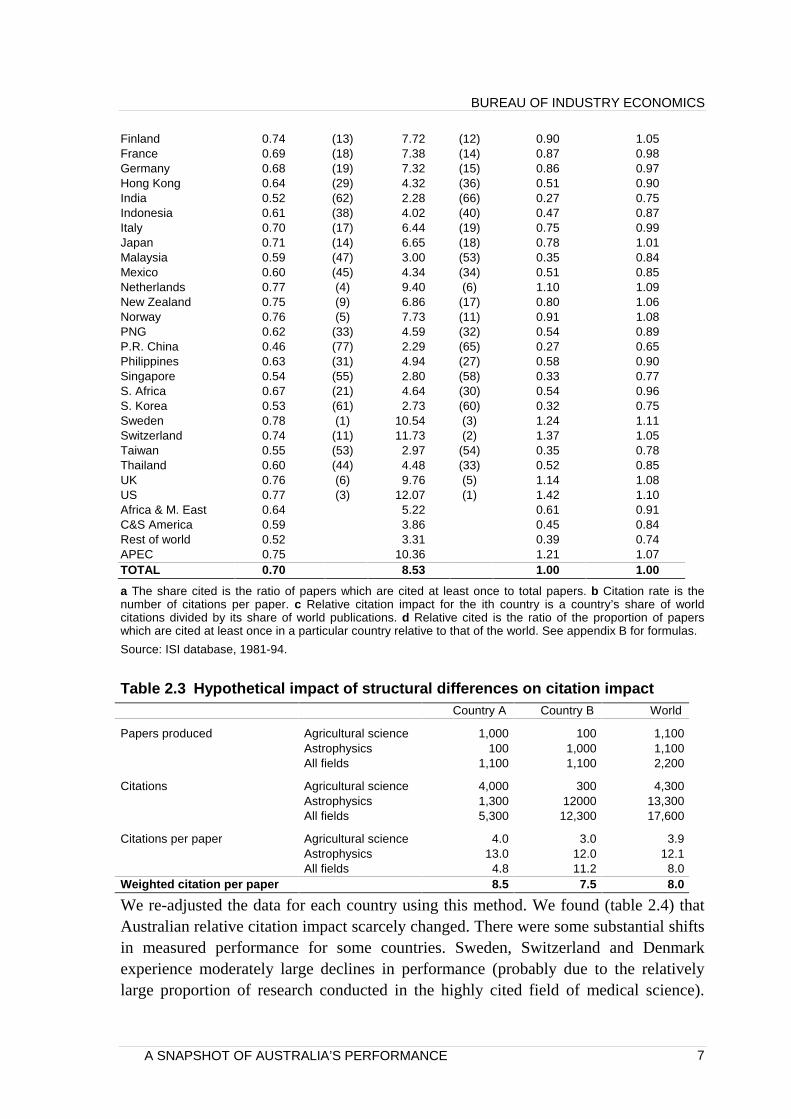
Table 2.1 Papers and citations, 1981 to 1994 a
Papers Rank Citations Rank Papers citedat least once
Rank
Shareof
worldpapers
Share ofworld
citations
Share ofworldcited
papersAustralia 180,133 (10) 1,484,804 (9) 136,477 (9) 0.021 0.021 0.023Canada 376,588 (7) 3,222,103 (5) 283,573 (6) 0.045 0.045 0.048Chile 13,780 (38) 64,902 (34) 8,604 (37) 0.002 0.001 0.001Denmark 71,025 (19) 705,579 (14) 55,355 (17) 0.008 0.010 0.009Finland 56,870 (21) 438,978 (18) 41,926 (19) 0.007 0.006 0.007France 434,218 (6) 3,204,053 (6) 299,306 (5) 0.052 0.045 0.050Germany 593,503 (3) 4,341,845 (3) 406,123 (4) 0.070 0.060 0.068Hong Kong 12,964 (39) 56,064 (36) 8,241 (38) 0.002 0.001 0.001India 205,195 (9) 467,570 (17) 107,667 (12) 0.024 0.007 0.018Indonesia 2,142 (61) 8,610 (58) 1,312 (59) 0.000 0.000 0.000Italy 228,901 (8) 1,473,742 (10) 159,292 (8) 0.027 0.021 0.027Japan 613,114 (4) 4,080,152 (4) 437,791 (3) 0.073 0.057 0.074Malaysia 4,632 (49) 13,918 (49) 2,736 (48) 0.001 0.000 0.000Mexico 21,130 (34) 91,669 (32) 12,586 (34) 0.003 0.001 0.002Netherlands 164,558 (11) 1,547,286 (7) 126,100 (10) 0.020 0.022 0.021New Zealand 37,841 (27) 259,557 (22) 28,211 (25) 0.004 0.004 0.005Norway 43,564 (25) 336,736 (19) 33,061 (23) 0.005 0.005 0.006PNG 1,517 (71) 6,965 (62) 948 (71) 0.000 0.000 0.000P.R. China 79,419 (17) 181,860 (24) 36,391 (20) 0.009 0.003 0.006Philippines 3,307 (51) 16,328 (48) 2,090 (51) 0.000 0.000 0.000Singapore 9,649 (43) 27,063 (47) 5,254 (44) 0.001 0.000 0.001S. Africa 43,042 (24) 199,584 (23) 28,945 (24) 0.005 0.003 0.005S. Korea 20,850 (36) 56,825 (35) 11,056 (35) 0.002 0.001 0.002Sweden 143,261 (12) 1,510,356 (8) 111,795 (11) 0.017 0.021 0.019Switzerland 119,094 (13) 1,396,597 (11) 88,243 (13) 0.014 0.019 0.015Taiwan 34,091 (28) 101,375 (31) 18,746 (28) 0.004 0.001 0.003Thailand 6,887 (46) 30,827 (43) 4,122 (46) 0.001 0.000 0.001UK 671,944 (2) 6,560,169 (2) 509,185 (2) 0.080 0.091 0.086US 2,919,889 (1) 35,248,880 (1) 2,254,415 (1) 0.346 0.490 0.380Africa & M.E 182722 953782 116798 0.022 0.013 0.020C&S America 90199 348291 53429 0.011 0.005 0.009Rest of world 1,042,115 3,449,564 540,748 0.124 0.048 0.091APEC 4,337,933 44,951,902 3,252,553 0.515 0.625 0.548TOTAL 8,428,144 71,886,034 5,930,526 1.000 1.000 1.000
a Africa and M.E. is Africa and Middle Eastern states except S. Africa. C&S America is central and SouthAmerica except Chile. APEC are the countries making up APEC except Brunei for which no information wasavailable. Some journal articles are written by authors from different countries. Each of these is recorded asan article attributed to a country. Thus the total number of papers exceeds the real world total -but we use theinflated total so that any shares add to one. We did not use the full set of ISI fields in computing the abovestatistics. The following fields were excluded: Economics & business, Education, and Social Sciences.Accordingly, the above data will not match ISI totals. The rankings are among the 79 countries that make upour amended ISI database. No rankings are defined for regions (as in Africa and the Middle East, Central andSouth America and the Rest of the world) which are composed of many countries.
Source: ISI database, 1981-94.
• Review articles can mask citations of the articles they review. Once a reviewarticle covering a topic is published, other papers may quote from the reviewarticle rather than tracking back to the original research underpinning the review.

AUSTRALIAN SCIENCE
\BE
6
• Citation practices vary by scientific field. For example, citation rates in papers inmolecular biology and genetics are far higher than those in materials science. Weare reluctant to view the differences between scientific fields as indicative ofdiffering quality standards. These large variations in citation rates between fieldssuggests a need to correct for the structure of scientific study in differentcountries, a point we return to later.
Nevertheless, we believe that the ISI database on citations provides a good measure ofthe visibility of Australian science and a possible guide to its overall quality. Australiacommands just over 2 per cent of the total citations of papers in the world – with anaverage citation rate per paper2 being just over eight (table 2.2). This citation rateplaces Australia in eighth ranking in the world – just behind Canada – but ahead ofcountries like Germany, France, Italy, and Japan. Australia has the third highest citationrate among APEC countries (behind the US and Canada) – and notably ahead of Japan.
But as we noted above, structural differences in the nature of scientific research indifferent countries may distort our perspective of Australia’s standing. For example,imagine that there are just two scientific fields: astrophysics and agricultural scienceand only two countries. Both countries produce 1 100 papers, but country A producesmainly agricultural science papers, while country B produces mainly astrophysics (table2.3).
Looked at from a disaggregated level, country A seems to produce superior qualitypapers. Citations per paper are higher for both fields. But because country A specialisesin the production of agricultural science, a discipline whose practices and nature meanthat citation rates are lower, the overall picture of citation rates suggests that country Ahas poorer quality science than country B.
One way of overcoming this measurement problem is to produce a weighted average ofcitations per paper using fixed weights for both countries. One sensible choice ofweights is the world share of papers in each field (in this case 50 per cent).3 Thissuggests that country A is clearly superior to B.
Table 2.2 Citation impacts, 1981 to 1994Shareciteda
Rank Citationrateb
Rank Relativeimpactc
Relativecitedd
Australia 0.76 (7) 8.24 (8) 0.97 1.08Canada 0.75 (8) 8.56 (7) 1.00 1.07Chile 0.62 (34) 4.71 (28) 0.55 0.89Denmark 0.78 (2) 9.93 (4) 1.16 1.11
2 Of those produced over the period from 1981-1994. The ISI has many other ways of recording citations. We
look at these more closely in chapter 4.3 There are many other possible choices for weights. Two others are the weights facing country A or the
weights facing country B. The critical thing is that the same weights be used for both countries.
BUREAU OF INDUSTRY ECONOMICS
A SNAPSHOT OF AUSTRALIA’S PERFORMANCE 7
Finland 0.74 (13) 7.72 (12) 0.90 1.05France 0.69 (18) 7.38 (14) 0.87 0.98Germany 0.68 (19) 7.32 (15) 0.86 0.97Hong Kong 0.64 (29) 4.32 (36) 0.51 0.90India 0.52 (62) 2.28 (66) 0.27 0.75Indonesia 0.61 (38) 4.02 (40) 0.47 0.87Italy 0.70 (17) 6.44 (19) 0.75 0.99Japan 0.71 (14) 6.65 (18) 0.78 1.01Malaysia 0.59 (47) 3.00 (53) 0.35 0.84Mexico 0.60 (45) 4.34 (34) 0.51 0.85Netherlands 0.77 (4) 9.40 (6) 1.10 1.09New Zealand 0.75 (9) 6.86 (17) 0.80 1.06Norway 0.76 (5) 7.73 (11) 0.91 1.08PNG 0.62 (33) 4.59 (32) 0.54 0.89P.R. China 0.46 (77) 2.29 (65) 0.27 0.65Philippines 0.63 (31) 4.94 (27) 0.58 0.90Singapore 0.54 (55) 2.80 (58) 0.33 0.77S. Africa 0.67 (21) 4.64 (30) 0.54 0.96S. Korea 0.53 (61) 2.73 (60) 0.32 0.75Sweden 0.78 (1) 10.54 (3) 1.24 1.11Switzerland 0.74 (11) 11.73 (2) 1.37 1.05Taiwan 0.55 (53) 2.97 (54) 0.35 0.78Thailand 0.60 (44) 4.48 (33) 0.52 0.85UK 0.76 (6) 9.76 (5) 1.14 1.08US 0.77 (3) 12.07 (1) 1.42 1.10Africa & M. East 0.64 5.22 0.61 0.91C&S America 0.59 3.86 0.45 0.84Rest of world 0.52 3.31 0.39 0.74APEC 0.75 10.36 1.21 1.07TOTAL 0.70 8.53 1.00 1.00
a The share cited is the ratio of papers which are cited at least once to total papers. b Citation rate is thenumber of citations per paper. c Relative citation impact for the ith country is a country’s share of worldcitations divided by its share of world publications. d Relative cited is the ratio of the proportion of paperswhich are cited at least once in a particular country relative to that of the world. See appendix B for formulas.
Source: ISI database, 1981-94.
Table 2.3 Hypothetical impact of structural differences on citation impactCountry A Country B World
Papers produced Agricultural science 1,000 100 1,100Astrophysics 100 1,000 1,100All fields 1,100 1,100 2,200
Citations Agricultural science 4,000 300 4,300Astrophysics 1,300 12000 13,300All fields 5,300 12,300 17,600
Citations per paper Agricultural science 4.0 3.0 3.9Astrophysics 13.0 12.0 12.1All fields 4.8 11.2 8.0
Weighted citation per paper 8.5 7.5 8.0
We re-adjusted the data for each country using this method. We found (table 2.4) thatAustralian relative citation impact scarcely changed. There were some substantial shiftsin measured performance for some countries. Sweden, Switzerland and Denmarkexperience moderately large declines in performance (probably due to the relativelylarge proportion of research conducted in the highly cited field of medical science).

AUSTRALIAN SCIENCE
\BE
8
Relatively large increases in performance are apparent for China, Philippines andTaiwan.
Table 2.4 Citations per paper adjusted for science structure a
Australianweights
Rank World weights Rank Unadjustedresults
Rank
Australia 8.24 (8) 8.22 (8) 8.24 (8)Canada 8.62 (7) 8.71 (7) 8.56 (7)Chile 4.18 (37) 4.14 (38) 4.71 (28)Denmark 9.09 (5) 9.44 (5) 9.93 (4)Finland 6.95 (15) 7.17 (14) 7.72 (12)France 6.94 (16) 7.14 (15) 7.38 (14)Germany 7.22 (12) 7.46 (11) 7.32 (15)Hong Kong 4.33 (34) 4.38 (34) 4.32 (36)India 2.52 (69) 2.64 (65) 2.28 (66)Indonesia 4.16 (38) 3.94 (43) 4.02 (40)Italy 5.84 (23) 6.07 (22) 6.44 (19)Japan 6.26 (20) 6.44 (20) 6.65 (18)Malaysia 3.18 (58) 3.12 (58) 3.00 (53)Mexico 4.33 (35) 4.37 (35) 4.34 (34)Netherlands 8.69 (6) 8.90 (6) 9.40 (6)New Zealand 7.15 (13) 7.40 (12) 6.86 (17)Norway 7.36 (11) 7.31 (13) 7.73 (11)PNG 4.62 (31) 4.30 (36) 4.59 (32)P.R. China 3.22 (57) 3.18 (57) 2.29 (65)Philippines 6.49 (18) 6.52 (19) 4.94 (27)Singapore 3.24 (55) 3.26 (54) 2.80 (58)S. Africa 5.03 (27) 5.04 (27) 4.64 (30)S. Korea 3.22 (56) 3.21 (55) 2.73 (60)Sweden 9.54 (4) 9.61 (3) 10.54 (3)Switzerland 10.42 (2) 10.83 (2) 11.73 (2)Taiwan 3.58 (49) 3.59 (48) 2.97 (54)Thailand 4.48 (32) 4.48 (33) 4.48 (33)UK 9.54 (3) 9.52 (4) 9.76 (5)US 11.66 (1) 11.92 (1) 12.07 (1)
a The Australian weights are the share of papers in a given field in Australia, the world weights are the shareof papers in a given field in the world, while the unadjusted results use each country’s own weights tocalculate the overall citation rate. Note that for some countries (such as Thailand) there are some scientificfields where citation rates could not be calculated because no papers were produced in those fields. Wesimply used the unadjusted citation rate for those countries, when computing rankings (ie we did not actuallyadjust the data for these countries at all).
Source: BIE calculations based on the ISI database.
Australia’s position in the league tables of science ‘quality’ does not alter after theadjustments for field structure (although the position of some other countries, like thePhilippines, China, the UK and New Zealand, did shift).
Another measure of visibility and/or quality of research is whether a paper is cited atall. Over the period from 1981 to 1994, 76 per cent of scientific papers published by

BUREAU OF INDUSTRY ECONOMICS
A SNAPSHOT OF AUSTRALIA’S PERFORMANCE 9
Australians were cited at least once.4 Australia is ranked seventh in the world and justbehind the US in APEC countries on this measure.
2.2 Australia’s contribution by field of research
Four fields dominate Australian scientific publications: biology and biochemistry,clinical medicine, chemistry and plant and animal science. Together these account for51.2 per cent of scientific papers produced by Australians from 1981 to 1994 (table2.5). However, other than the prominent role of plant and animal science, this pattern isnot extraordinary. Indeed, if Australia matched the rest of the world, a greater share ofour papers would be produced in the first three fields. To put the Australian numbers incontext we must turn to international comparisons.
It is worth drawing a distinction between three international measures of performanceby field for a given country:
• a country’s share of total world papers or citations in that field. This is anindicator of the ‘raw’ scientific strength of a country by field of science;
• a country’s citation rate in a field relative to world citation rates in that field. Thisis an indicator of the quality and visibility of different fields of science; and
• the share of a country’s papers (or citations) in a given field relative to the shareof the world’s papers (or citations) in that field. This is a measure of revealedcomparative advantage (RCA) by scientific field. A country has a revealedcomparative advantage in a field if the share of that country’s papers or citationsin that field is much higher than the world share of papers or citations in thatfield.5 Thus if the measure is well above one then a comparative advantage is
4 This figure should not be taken to imply that about one quarter of papers are never cited. The process of
citation takes time. The data used to calculate the 76 per cent figure span fourteen years from 1981 to 1994.Papers published in 1994 have very little time to be cited, while those published in 1981 have had fourteenyears. The ISI database records that 87 per cent of scientific papers published in 1981 by Australians werecited at least once by 1994, while only 16.5 per cent of papers published in 1994 were cited at least once.
5 The premise underlying the use of this measure is that countries with a comparative advantage in aparticular field devote proportionately more resources (and produce more outputs) to that field than othercountries. More formally, the measure of comparative advantage we are using here is:
RCAi, j = (Pi, j / Pi, ji=1N∑ ) Pi, j / Pi, jj=1
k∑j=1N∑j=1
k∑( )= (Pi, j / Pi, jj=1k∑ ) Pi, j / Pi, jj=1
k∑j=1N∑i=1
N∑( )This shows that the measure of revealed comparative advantage can be thought of in two ways. It is acountry’s share of total world papers in that field relative to that country’s share of total world papers in allfields and equivalently as the share of a country’s papers in a given field relative to the share of worldpapers in that field. We emphasise that the measure suffers some limitations as a measure of comparativeadvantage. After all, the allocation of resources in the science system is not determined in a purelycompetitive market – in much of the science system the allocation of funding is determined by federal and

AUSTRALIAN SCIENCE
\BE
10
revealed, while if the measure is well below one then a comparative disadvantageis suggested.
Table 2.5 Papers and citations by field of science, 1981-1994Field
share ofAustralian
papers
FieldShare of
Australiancitations
Relativecitationimpact
Share ofworld
papers
Share ofworld
citations
Numberof papers
Numberof
citations
Citationrate
% a % b c % d % e fAgricultural Sciences 4.9 2.7 1.22 3.9 4.8 8,845 40,022 4.52Astrophysics 1.5 2.3 1.07 2.5 2.7 2,734 34,889 12.76Biology & Biochemistry 12.3 18.5 0.90 2.0 1.8 22,138 274,246 12.39Chemistry 8.9 9.5 1.24 1.5 1.9 16,065 140,523 8.75Clinical Medicine 17.0 16.2 0.97 2.0 1.9 30,550 239,798 7.85Computer Science 0.8 0.3 0.84 1.5 1.3 1,392 3,851 2.77Ecology/Env’t 3.3 2.6 1.12 3.6 4.1 5,923 38,483 6.50Engineering 4.7 2.1 1.16 1.6 1.8 8,514 31,353 3.68Geosciences 4.6 4.9 1.16 3.9 4.5 8,202 72,067 8.79Immunology 2.7 4.7 0.86 2.9 2.5 4,810 70,419 14.64Materials Science 1.9 0.9 1.10 1.4 1.6 3,459 13,756 3.98Mathematics 1.9 0.9 1.05 2.2 2.4 3,390 12,790 3.77Microbiology 2.7 3.6 0.86 2.6 2.2 4,930 53,689 10.89Molec Biol & Genetics 3.1 5.7 0.73 2.3 1.7 5,660 84,751 14.97Multidisciplinary 1.2 0.7 1.09 1.7 1.9 2,165 9,717 4.49Neuroscience 3.2 5.0 0.87 2.1 1.8 5,830 74,155 12.72Pharmacology 2.4 2.8 1.06 1.9 2.0 4,375 41,789 9.55Physics 6.3 4.8 0.83 1.2 1.0 11,366 70,890 6.24Plant & Animal Sc 13.0 9.5 1.21 4.0 4.9 23,330 140,339 6.02Psychology/psychiatry 3.6 2.5 0.80 3.0 2.4 6,455 37,277 5.77All fields 100.0 100.0 0.97 2.1 2.1 180,133 1,484,804 8.24
a This is the ratio of Australian papers in a given field to total Australian scientific papers. b This is the ratio ofAustralian citations in a given field to total Australian scientific citations. c The ratio of the share of worldcitations divided by the share of world publications for a given field. d The share of world papers by field. eThe share of world citations by field. f The ratio of citations to papers in Australia for a given field.
Source: Data from the ISI database.
We looked at international scientific strength by field by ranking all countries from topto bottom in terms of shares of world citations. We prefer citation shares because theytake account of both the volume of publications and to some extent their visibility andquality. The US clearly dominates the production of codified knowledge – producingfrom 37 to 70 per cent of world scientific citations, depending on the field (table C.3 inappendix C). No other country contributes more in any field – the US has an absoluteadvantage spanning all fields. But what about others in the top ten percent? We take thetop eight performing countries in the world as demonstrating some clear advantage in ascientific field. Notwithstanding Australia’s size, Australia is within the top eight of 79
state governments. They may not always devote resources to the areas with the greatest potential socialreturns. Even so, we think the measure does reveal Australia’s broad comparative advantages.

BUREAU OF INDUSTRY ECONOMICS
A SNAPSHOT OF AUSTRALIA’S PERFORMANCE 11
countries in terms of citation shares for 10 of the 20 fields. Japan is within the top eightfor 18 of the 20 fields, Canada for 19, Sweden for 6, Switzerland for 4, and India forone (table C.5 in appendix C). Other than Japan, Asian economies still rank relativelylow in terms of their absolute contribution to world science.
One problem with publication or citation shares is that they may overlook smallcountries with very high quality publications. We calculated relative citation impacts byfield and country – these measure the quality (and visibility) of the scientific research.Australia was ranked 8th in the world or better in nine of the twenty scientific fields. Itis interesting to compare these results (table A2.3) with those obtained by looking atcitation shares. The US and the UK dominate world science both in quantity andquality stakes, but Japan, France, Germany and Canada fall in their rankings whenquality measures are considered. While Japan is a big world player in terms of theabsolute number of publications and citations, its citation rates are relatively low. Infact, Japan does not make it to the top eight in any field using this measure. In contrast,some smaller countries, like Switzerland, Sweden and the Netherlands may contributerelatively little to the stock of codified knowledge, but what they do produce is highlycited.
We summarise the fields where Australia ranks highly in world terms in table 2.6. Wehave international strengths in ecology and the environmental sciences, geoscience,plant and animal science and psychology/psychiatry and to a lesser extent, agriculturalscience, astrophysics, engineering, materials science and mathematics.6 These are ourabsolute strengths. What about our revealed comparative advantages?
Some fields have a far greater share of Australia’s total published scientific papers thanthey do in the world’s total papers. For example, agricultural science accounts for 4.9per cent of Australian papers but only 2.67 per cent of world papers. This implies that ithas a revealed comparative advantage index (RCAI) of 1.84. We found that the RCAindex was high for other natural sciences too: ecology and the environment (1.69),geosciences (1.81) and plant and animal sciences (1.88). This pattern of specialisationis not accidental, but reflects Australia’s economic advantages in using its naturalresources.7
Table 2.6 Australia’s world ranking by scientific field, 1981-1994 a
Worldpublication shares
World citationshares
Relative citationimpact
6 Some care must be used when interpreting these numbers. In one field, psychology/psychiatry, Australia has
fewer citations per paper than the world average, yet ranks quite highly in world terms in terms of citationrates. This oddity reflects the fact that this discipline is dominated by a very few countries, particularly theUS, Canada and the UK.
7 A similar, even more stark, picture of our comparative advantage in these fields emerges when we look atAustralia’s share of world citations by field relative to our overall share of citations.

AUSTRALIAN SCIENCE
\BE
12
Agricultural Sciences 7 6 9Astrophysics 10 8 6 Biology & Biochemistry 11 11 10Chemistry 13 11 7 Clinical Medicine 11 10 13Computer Science 10 10 12Ecology/Env’t 5 4 6 Engineering 10 8 5 Geosciences 7 5 4 Immunology 8 10 11Materials Science 11 8 7 Mathematics 9 8 7 Microbiology 9 8 10Molec Biol & Genetics 10 9 15Multidisciplinary 10 9 18Neuroscience 10 10 10Pharmacology 10 11 9Physics 15 16 18Plant & Animal Science 8 5 5 Psychology/psychiatry 5 4 7
a The rankings are based on Australia’s position among 79 countries on the ISI database. Three measureswere constructed for all the countries from i=1 to N and for each of the fields from j =1 to K:
PSHij = Pij Piji=1
N∑.,
CSHij = Cij Ciji=1N∑
. and IMPij = Cij / Pij( ) Ciji=1
N∑ / Piji=1N∑( )
.
IMP is highly unstable when there are very few papers and is clearly not defined at all if no papers arepublished. We omitted a country from the analysis of citation rates if it produced less than fifty papers in afield over the period from 1981 to 1994. We then recorded where Australia ranked in the world on the threemeasures. We record a tick if Australia is in the top eight in any field.
Source: ISI database.
Other fields have much lower indexes. The measures of RCA for chemistry (0.71),computer science (0.71), materials science (0.66), and physics (0.54) suggest somecomparative disadvantage. We emphasise that these are comparative not absoluteadvantage measures. For example, in materials science, Australia has a 1.42 per centshare of the world’s papers (11th in the world), 1.56 per cent of the world’s citations(8th) and a relative citation impact of 1.1 (7th) – all of these suggesting that Australiahas a better than average absolute standing in materials science relative to othercountries (table 2.6). But even so, this field accounts for a relatively low share ofAustralia’s total papers or citations compared to the world as a whole.
Interestingly, for Australia there is at best only a weak positive correlation betweencomparative advantage in a field and quality (figure 2.1). Certainly, the four naturalscience fields identified above all have well above average world citation rates, butdisciplines like chemistry and engineering, where a distinctive comparative advantageis not revealed, are still well above average world citation rates. This is not anAustralian oddity. We found that correlations were typically weak for other countries.And indeed for 14 of the 32 countries/regions in table 6.2 the correlation is negative.

BUREAU OF INDUSTRY ECONOMICS
A SNAPSHOT OF AUSTRALIA’S PERFORMANCE 13
This suggests that the pattern of specialisation by any country within scientific fields isnot driven by the differences in quality between these fields.
Figure 2.1 Comparative advantage and quality
0.70
0.80
0.90
1.00
1.10
1.20
1.30
0.40 0.60 0.80 1.00 1.20 1.40 1.60 1.80 2.00
Revealed comparative advantage index
Rel
ativ
e ci
tatio
n im
pact
Physics
Materials
Chemistry
Computer
Pharm
ClinMed
BiologyNeuro
Math
Molec
Astrophysics
MicrobiologyImmunology
Engineering
Agriculture
Ecology
Multi
Psychology
Geosciences Plant
But what about revealed comparative advantage by field of science around the world?A few patterns emerge: countries with strong natural endowments, like Australia, SouthAfrica, Chile, Norway and Indonesia tend to devote greater resources to scientificresearch and publication related to their economic endowments (figure 2.2). Thesmaller European economies (for example, Denmark, Sweden, Switzerland) havecarved a niche in medical or medical related research. The more dynamic Asianeconomies have tended to specialise in published science related to industry(Singapore, South Korea, Taiwan and India). Finally, there are countries whose patternof specialisation does not fit these categories. There are two distinct groups in thiscategory. The first group comprises the most scientifically dominant in the world (forexample the US, Japan, France and Germany). The second, are the least developedscientifically (Papua New Guinea, Thailand).
Two other important questions can be posed about patterns of advantage by field:
• to what extent do countries specialise in fields? (narrowness vs breadth); and
• to what extent does relative citation impact vary between fields (potentially ameasure of the evenness of quality)?

AUSTRALIAN SCIENCE
\BE
14
Figure 2.2 Patterns of comparative advantage in publications a
(agriculture, ecology, geoscience, plant & animal)
(engineering, computing, chemistry, materials science)
(clinical medicine, immunology, molecular biology and genetics, pharmacology)
Australia, Canada, Chile, Indonesia, Malaysia, Mexico, New Zealand, Norway, Philippines,South Africa
Denmark, Sweden, Finland, Switzerland, UK
India, Singapore, South Korea, Taiwan
France, Germany, Japan, Italy, Netherlands, US, Hong Kong, PNG, Thailand
Medical
Natural resource based
Industry based
Other (mixed)
a We identified the top four fields for any country in terms of the ratio of citation share by discipline to citationshare of the country as a whole. We then allocated a country to one of the categories above (either medical,natural, industry or other), if they had three or more of the associated fields in their top four.
Source: ISI database.
BUREAU OF INDUSTRY ECONOMICS
A SNAPSHOT OF AUSTRALIA’S PERFORMANCE 15
Measures of breadth and evenness based on the publications and citations data suggestthat:
• Australia has broad scientific capabilities as measured by the shares of papersacross 20 scientific fields8 (figure 2.3). Not surprisingly Australia has less broadcapabilities than the US, Canada and the major European economies, but greaterbroadness than Sweden, Norway and Japan. In the APEC region, Australia isthird on this measure. Other countries, such as the Philippines and Indonesia areniche players – choosing to specialise in particular fields. But is broadness a‘good’ thing? On the one hand, if a country has few resources to devote to scienceit seems sensible to make a few strategic choices that match some of the mostpressing economic and social needs of the country. For developing economies itmay well pay to select a few fields. On the other hand, broadness increases thetechnological and scientific options available to a country. Science andtechnology moves very rapidly and new areas of inquiry emerge which requirebackground knowledge. For example biotechnology, superconductivity,nanotechnology are newer areas for research which are only open to countrieswhich have the prerequisites in the right fields. Broadness is like portfoliodiversification in share markets – it allows a country to spread its scientific andtechnological risks. This is important given the unpredictable nature oftechnological developments and the difficulties of foreseeing technologicaltrajectories in an economy (box 2.1 and Bourke and Butler 1995a, pp. 2-3).
• Australia has the least variation in its (normalised) relative citation impacts 9 inthe world, followed by the UK, Netherlands and France (figure 2.3). In the APEC
8 To measure broadness we first measured the field shares of a country, normalised by the field shares of the
world. That is we measured the disparity between a country’s field share and the world’s field shares
PDISPij = Pij / PWorld, j( ) Pi, all fields / PWorld ,all fields( ) where P is the number of papers. We then
calculated the variance of this measure across j for each country as our measure of narrowness. If acountry’s field shares exactly matched that of the world, then narrowness is zero (or broadness at itsmaximum). This may seem odd. After all you might suppose that if field shares within a country wereexactly equal then such a country had the most broad scientific capability. But the problem with this is theconcept of fields. Fields are simply pigeonholes for associating similar types of scientific inquiry. Somefields, like chemistry and physics, are very wide, covering many sub-fields, while others, such asastronomy, are narrower. By normalising a country’s field shares by world field shares, we take account ofthe underlying breadth and importance of some fields. Figure 2.3 reports the variances of PDISP relative toAustralia (with Australia=100.0). So for example, the variance of the normalised field shares is abouttwenty times greater in the Philippines than Australia.
9 We measured the normalised relative citation impact in any field for any country as:
RCITij = CRij / CRWorld, j( ) CRi,all fields / CRWorld ,all fields( ) where CR is the citation rate defined as:
CRij = (Cij Pij ). The measure looks at relative citation rates by field, normalised by the overall citation
impact of a country across all fields. We need to normalise so that we can meaningfully compare variancesacross different countries. We measured evenness of this measure by calculating the variance of RCITacross j for a given country. If a country has a high variance relative to other countries it means that therelative citation impact in some fields is much higher or lower than the average for that country. Figure 2.3

AUSTRALIAN SCIENCE
\BE
16
region, Australia, Canada and the US lead the pack, followed by far morevariation in these rates for Japan, Hong Kong, Taiwan, South Korea andSingapore. Care must be taken in interpreting such measures of evenness. Acountry could have very little variation in its relative citation impacts becausethey were uniformly poor! However, we know that this is not true for Australia.
Figure 2.3 Evenness of quality and specialisation in science, 1981-1994 a
0 500 1000 1500 2000 2500 3000 3500 4000
Australia
UK
Netherlands
France
Finland
Canada
US
Switzerland
Italy
Sweden
Germany
Denmark
Japan
New Zealand
Hong Kong
Taiwan
Norway
S. Africa
Mexico
S. Korea
P.R. China
India
Singapore
Thailand
Malaysia
Chile
Indonesia
PNG
Philippines
0 500 1000 1500 2000
UK
Germany
US
Netherlands
Switzerland
France
Finland
Canada
Italy
Denmark
Australia
Sweden
Japan
Norway
Hong Kong
Mexico
S. Africa
PNG
Malaysia
India
New Zealand
Taiwan
S. Korea
Thailand
Singapore
Indonesia
Chile
P.R. China
Philippines
International specialisationUneveness in quality
a Australia is indexed at 100 and measures of quality unevenness and specialisation are then measuredrelative to Australia. The higher the score on unevenness the more variable is quality across scientific fields,while the higher the score on international specialisation the more specialised is a country within certainscientific disciplines.
Source: Based on ISI data.
reports the variances of RCIT relative to Australia (with Australia=100.0). So for example, the variance ofthe normalised citation impacts is about forty times greater in the Philippines than Australia.

BUREAU OF INDUSTRY ECONOMICS
A SNAPSHOT OF AUSTRALIA’S PERFORMANCE 17
Box 2.1 The whimsical nature of technology
“Everything that can be invented has been invented” Charles Duell, US Patent Office,1899.
“The computer has no commercial future” IBM 1948.
“X rays will prove to be a hoax” Lord Kelvin.
“That is how the atom is split, but what does it mean? To us who think in terms of practicaluse it means nothing” Lord Richie Calder, 1932.
“The possibilities of the aeroplane have been exhausted” Thomas Edison, 1895.
“Space travel is utter bilge” Astronomer Royal, 1956 (one year before Sputnik).
Source: Milsted (1995) and White (1993).
2.3 Scientific proclivity
So far we have measured the quantity, visibility and quality of (codified) sciencearound the world. But poorer and less developed countries must often concentrate onother things than a well developed science base. Thus a comparison between citationand publications shares between Australia and, say Thailand, is obviously not a fairone. We should take account of differences in population, income and other factorswhen comparing countries around the world (table 2.7).
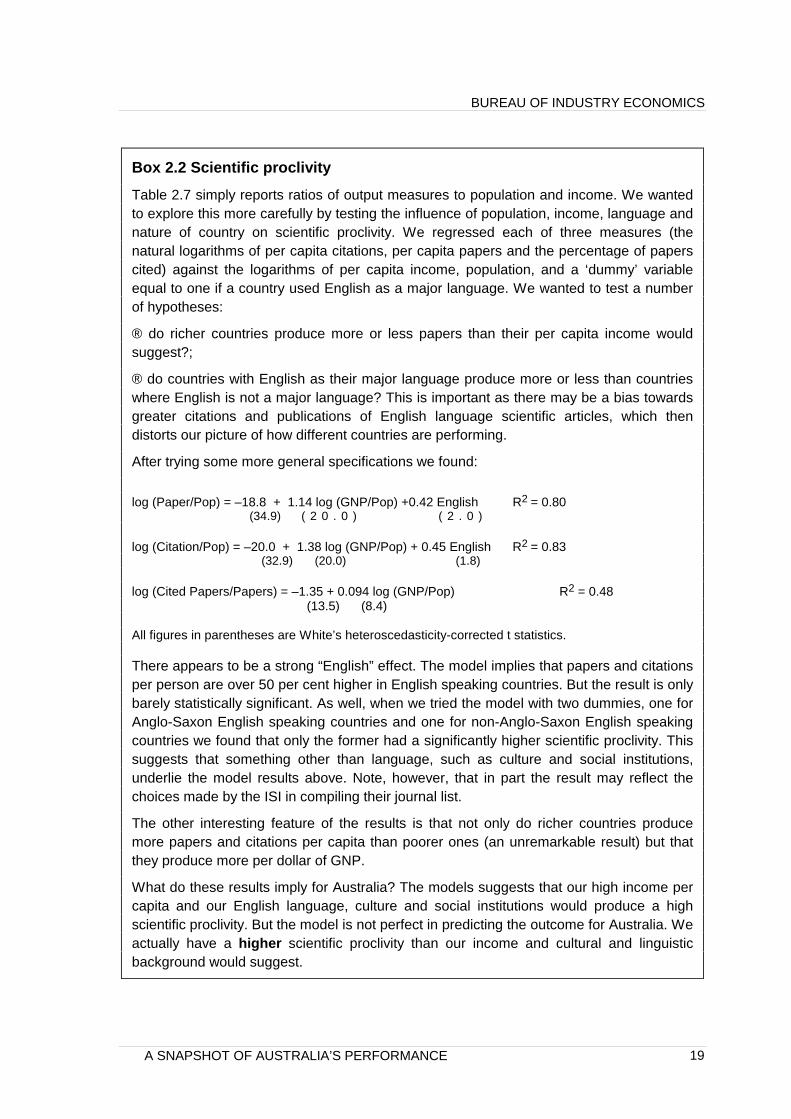
Using this approach we still find Australia is contributing more to published sciencethan its income or population would suggest. Australian scientists publish 1.6 times asmany papers than would be normally expected given our income (table 2.7). This isconsiderably more than the US (1.3), Japan (0.5), Singapore (0.9), and South Korea(0.3) – but less than New Zealand (2.4), India (1.9), the UK (1.7), Israel (3.4) and arange of Eastern European countries.
The per capita contribution made by Australian scientists is well in excess of the worldaverage – but this simply reflects the fact that most highly populated countries have lowper capita incomes. We explore scientific proclivity more rigorously in box 2.2.

AUSTRALIAN SCIENCE
\BE
18
Table 2.7 Scientific performance adjusted for population and income, 1992Papers
perGNP
relativeto world
Citationsper GNP
relativeto world
Papersper
personrelativeto world
Citationsper
personrelativeto world
Papersper GNP
relativeto world
Citationsper GNP
relativeto world
Papersper
personrelativeto world
Citationsper
personrelative to
worldAlgeria 18.0 7.3 7.7 3.1 Malaysia 24.9 9.9 16.3 6.4Argentina 34.9 19.4 49.3 27.4 Mexico 23.5 13.3 19.0 10.8Australia 161.2 141.5 649.9 570.5 Morocco 50.9 16.3 12.3 3.9Austria 81.3 78.0 425.0 407.6 Netherlands 160.0 188.9 765.8 904.1Bangladesh 40.9 16.3 2.1 0.8 New
Zealand240.9 191.0 692.2 549.0
Belgium 108.8 115.8 530.6 564.9 Nigeria 92.7 17.9 6.9 1.3Brazil 36.7 17.5 23.7 11.4 Norway 111.5 97.9 672.7 590.3Bulgaria 479.4 166.4 149.0 51.7 Pakistan 30.8 9.4 3.0 0.9Cameroon 48.5 16.6 9.3 3.2 PNG 80.1 27.4 17.8 6.1Canada 184.4 183.3 892.2 887.2 P R. China 54.0 20.7 5.9 2.3Chile 108.1 67.9 69.0 43.3 Peru 22.9 11.2 5.1 2.5Colombia 16.6 12.2 5.2 3.8 Philippines 18.1 10.4 3.3 1.9Costa Rica 95.0 55.6 43.5 25.5 Poland 271.7 138.4 121.3 61.8Czech. 420.7 190.1 240.8 108.8 Portugal 52.9 37.2 92.2 64.8Denmark 147.1 159.4 893.5 968.4 Romania 110.1 31.6 29.1 8.3Egypt 193.2 47.7 28.9 7.1 Saudi Arabia 35.0 7.6 61.5 13.3Ethiopia 95.5 33.2 2.5 0.9 Singapore 85.5 47.4 314.3 174.3Finland 146.3 155.5 751.1 798.3 South Africa 103.2 53.2 64.4 33.2France 96.5 92.4 501.9 480.5 South Korea 29.8 14.4 47.3 22.8Germany 86.8 85.2 466.9 458.4 Spain 78.0 57.0 254.5 185.9Ghana 54.7 16.2 5.7 1.7 Sri Lanka 47.0 17.9 5.9 2.3Greece 113.2 63.8 192.8 108.7 Sweden 163.4 185.2 1031.3 1168.8Hong Kong 47.7 30.6 171.2 109.9 Switzerland 138.6 199.7 1168.5 1683.8Hungary 309.2 202.1 214.6 140.2 Taiwan 75.1 37.0 179.3 88.3Iceland 100.5 128.0 560.9 714.0 Tanzania 200.6 92.6 5.2 2.4India 186.2 55.2 13.5 4.0 Thailand 17.2 11.6 7.4 5.0Indonesia 4.8 2.5 0.8 0.4 Trinidad. 64.0 14.3 58.9 13.2Iran 6.4 1.8 3.3 0.9 Tunisia 65.2 20.8 26.2 8.4Ireland 174.6 148.0 498.0 422.1 Turkey 43.2 13.7 20.0 6.4Israel 345.0 319.6 1065.5 987.2 UK 174.7 199.0 726.1 827.3Italy 60.6 54.1 289.6 258.5 Uruguay 38.9 20.8 30.4 16.2Ivory Coast 33.9 26.7 5.3 4.2 US 129.1 172.8 701.2 938.3Jamaica 119.9 49.4 37.5 15.5 USSR 187.4 45.3 109.9 26.6Japan 52.5 43.8 345.8 288.5 Venezuela 33.0 16.9 22.4 11.5Jordan 169.0 41.3 44.2 10.8 Zimbabwe 96.9 41.5 12.9 5.5Kenya 214.6 131.7 15.5 9.5 World 100.0 100.0 100.0 100.0
Source: The bibliometric data are from ISI database. The real PPP adjusted GNP data are from the WorldBank Stars data base except for Taiwan, which comes from the Taiwan Statistical data book (1993, Councilof Economic Planning and development, Republic of China). The population data are from the InternationalFinancial Statistics (IMF, 1994, Vol. XLVII, Washington DC) and the World Bank Stars database.
BUREAU OF INDUSTRY ECONOMICS
A SNAPSHOT OF AUSTRALIA’S PERFORMANCE 19
Box 2.2 Scientific proclivity
Table 2.7 simply reports ratios of output measures to population and income. We wantedto explore this more carefully by testing the influence of population, income, language andnature of country on scientific proclivity. We regressed each of three measures (thenatural logarithms of per capita citations, per capita papers and the percentage of paperscited) against the logarithms of per capita income, population, and a ‘dummy’ variableequal to one if a country used English as a major language. We wanted to test a numberof hypotheses:
® do richer countries produce more or less papers than their per capita income wouldsuggest?;
® do countries with English as their major language produce more or less than countrieswhere English is not a major language? This is important as there may be a bias towardsgreater citations and publications of English language scientific articles, which thendistorts our picture of how different countries are performing.
After trying some more general specifications we found:
log (Paper/Pop) = –18.8 + 1.14 log (GNP/Pop) +0.42 English R2 = 0.80(34.9) ( 2 0 . 0 ) ( 2 . 0 )
log (Citation/Pop) = –20.0 + 1.38 log (GNP/Pop) + 0.45 English R2 = 0.83(32.9) (20.0) (1.8)
log (Cited Papers/Papers) = –1.35 + 0.094 log (GNP/Pop) R2 = 0.48(13.5) (8.4)
All figures in parentheses are White’s heteroscedasticity-corrected t statistics.
There appears to be a strong “English” effect. The model implies that papers and citationsper person are over 50 per cent higher in English speaking countries. But the result is onlybarely statistically significant. As well, when we tried the model with two dummies, one forAnglo-Saxon English speaking countries and one for non-Anglo-Saxon English speakingcountries we found that only the former had a significantly higher scientific proclivity. Thissuggests that something other than language, such as culture and social institutions,underlie the model results above. Note, however, that in part the result may reflect thechoices made by the ISI in compiling their journal list.
The other interesting feature of the results is that not only do richer countries producemore papers and citations per capita than poorer ones (an unremarkable result) but thatthey produce more per dollar of GNP.
What do these results imply for Australia? The models suggests that our high income percapita and our English language, culture and social institutions would produce a highscientific proclivity. But the model is not perfect in predicting the outcome for Australia. Weactually have a higher scientific proclivity than our income and cultural and linguisticbackground would suggest.

AUSTRALIAN SCIENCE
BE
20
3 Internationally co-authoredpublications
3.1 Introduction
Data on internationally co-authored papers provide measures of the strength of cross-border scientific linkages (table 3.1). Just under 12 per cent of Australia’s scientificpapers were internationally co-authored in 1991. This is just above the world averageof 11 per cent, but is below most Western European countries, where a high level ofinternational co-publications is stimulated by strong S&T cross-country cooperationinside Europe.
Table 3.1 Share of national publications which are internationally co-authoredCountry % share Country % shareAustralia 11.5 France 13.7Japan 5.2 Ireland 22.8United States 6.6 Italy 13.2Belgium 19.5 Luxembourg 53.6Denmark 17.3 Netherlands 13.4Germany 14.2 Portugal 23.7Greece 16.6 UK 11.0Spain 12.5 EC with countries outside EC 8.3
World 11.0
Source: European Commission (1994) Bourke and Butler (1994) for Australia. The datum for the world comesfrom the NSF (1993). All sources use ISI data and cover all papers from higher education, public scienceagencies and private institutions.
However, when intra-EC co-publications are excluded, the aggregate EC level ofcollaboration is only 8.3 per cent and Australia’s relative standing rises. Australia alsoscores well above the USA and Japan. But this is not surprising. We expect that largerR&D performing countries will tend to develop more linkages within their own systemsrather than outside. Even so, the data point forcefully to the idea of global rather thanjust national systems of innovation.
Furthermore, the globalisation of science is rapidly growing. Bourke and Butler (1994)report that the percentage of internationally co-authored scientific publications inAustralia nearly doubled between 1982 and 1991, a finding that was replicated by
BUREAU OF INDUSTRY ECONOMICS
INTERNATIONALLY CO-AUTHORED PUBLICATIONS 21
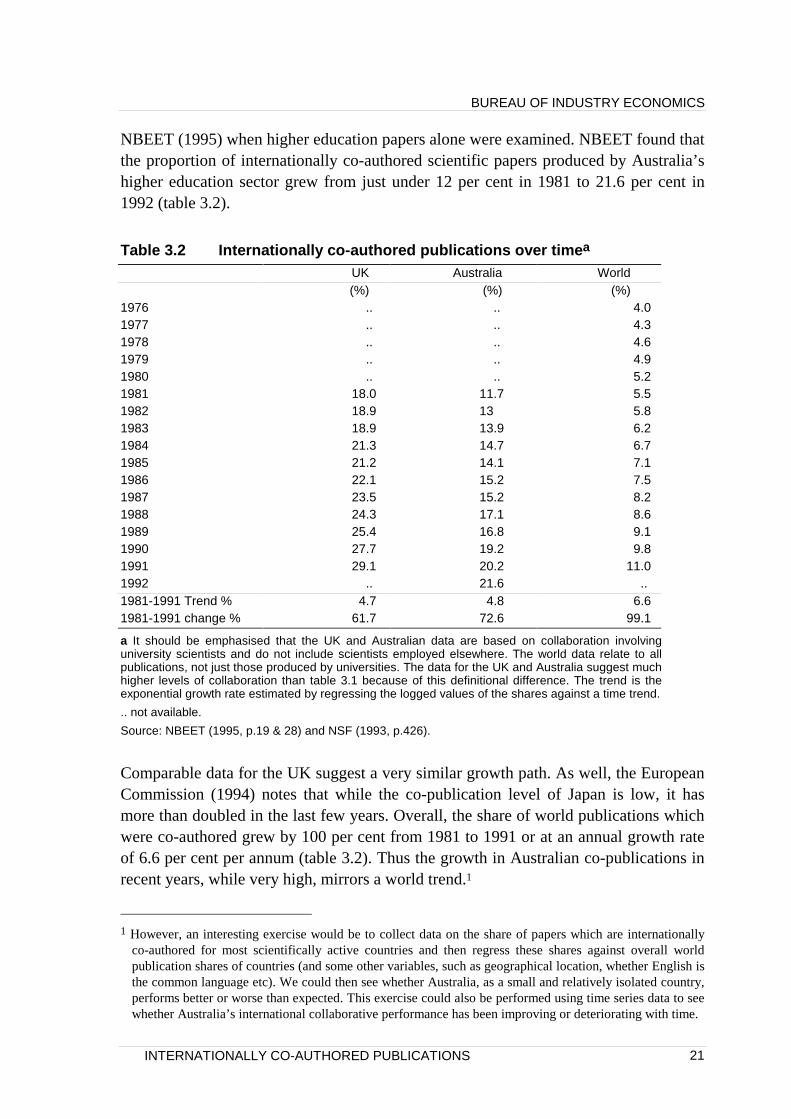
NBEET (1995) when higher education papers alone were examined. NBEET found thatthe proportion of internationally co-authored scientific papers produced by Australia’shigher education sector grew from just under 12 per cent in 1981 to 21.6 per cent in1992 (table 3.2).
Table 3.2 Internationally co-authored publications over timea
UK Australia World(%) (%) (%)
1976 .. .. 4.01977 .. .. 4.31978 .. .. 4.61979 .. .. 4.91980 .. .. 5.21981 18.0 11.7 5.51982 18.9 13 5.81983 18.9 13.9 6.21984 21.3 14.7 6.71985 21.2 14.1 7.11986 22.1 15.2 7.51987 23.5 15.2 8.21988 24.3 17.1 8.61989 25.4 16.8 9.11990 27.7 19.2 9.81991 29.1 20.2 11.01992 .. 21.6 ..1981-1991 Trend % 4.7 4.8 6.61981-1991 change % 61.7 72.6 99.1
a It should be emphasised that the UK and Australian data are based on collaboration involvinguniversity scientists and do not include scientists employed elsewhere. The world data relate to allpublications, not just those produced by universities. The data for the UK and Australia suggest muchhigher levels of collaboration than table 3.1 because of this definitional difference. The trend is theexponential growth rate estimated by regressing the logged values of the shares against a time trend.
.. not available.
Source: NBEET (1995, p.19 & 28) and NSF (1993, p.426).
Comparable data for the UK suggest a very similar growth path. As well, the EuropeanCommission (1994) notes that while the co-publication level of Japan is low, it hasmore than doubled in the last few years. Overall, the share of world publications whichwere co-authored grew by 100 per cent from 1981 to 1991 or at an annual growth rateof 6.6 per cent per annum (table 3.2). Thus the growth in Australian co-publications inrecent years, while very high, mirrors a world trend.1
1 However, an interesting exercise would be to collect data on the share of papers which are internationally
co-authored for most scientifically active countries and then regress these shares against overall worldpublication shares of countries (and some other variables, such as geographical location, whether English isthe common language etc). We could then see whether Australia, as a small and relatively isolated country,performs better or worse than expected. This exercise could also be performed using time series data to seewhether Australia’s international collaborative performance has been improving or deteriorating with time.

AUSTRALIAN SCIENCE
BE
22
The trend represents more than just internationalisation – but also growth of linkagesgenerally (figure 3.1). While nothing as extreme as the ‘death’ of the sole author isapparent, the really striking feature of the data on authorship is the strong decline inpapers produced by a lone author. Teams – whether they be nationally orinternationally based – appear to increasingly dominate the production of scientificknowledge.2
Figure 3.1 Type of authorship, Australian higher education scientific papers,1981 and 1992a
sole author 32%
group 37%
institutional 4%
national 15%
international 12%
sole author 20%
group 33%
institutional 5%
national 20%
international 22%
1981 1992
a A sole author is one author only (no collaboration); a group is more than one author with the samedepartmental address, institutional is more than one author from different departments within the sameinstitution, national is more than one author from different institutions in Australia and international involvesauthors from different countries.
Source: NBEET (1995, p.27 & 28).
3.2 Where does Australia collaborate?
The US and Europe – still the most powerful sources of basic scientific research –dominate Australia’s academic scientific collaboration. Over the period from 1981 to1992, nearly 80 per cent of Australia’s academic collaborative papers were with theUS, Canada, Western Europe and the UK. Just over ten per cent were with Asian
2 Interestingly, team based research is on average more highly cited than sole authored research. For most
fields, the greater the distance of the link, the more highly cited is the article. So, on average, sole authorsare cited 86 per cent of the average citation rate, group authored articles 95 per cent, institutionallyauthored papers 98 per cent, nationally authored papers 106 per cent and internationally authored papers115 per cent (NBEET, 1995, p.33).

BUREAU OF INDUSTRY ECONOMICS
INTERNATIONALLY CO-AUTHORED PUBLICATIONS 23
countries (figure 3.2) and about six per cent were with Oceanic countries (mainly NewZealand).
Figure 3.2 Distribution of collaboration by region, 1981-92a
US32%
Oceania6%
W. Europe20%
NE Asia 6%
Other Asia 2%
SE Asia 3%
Others6%
UK & Ireland18%
Canada7%
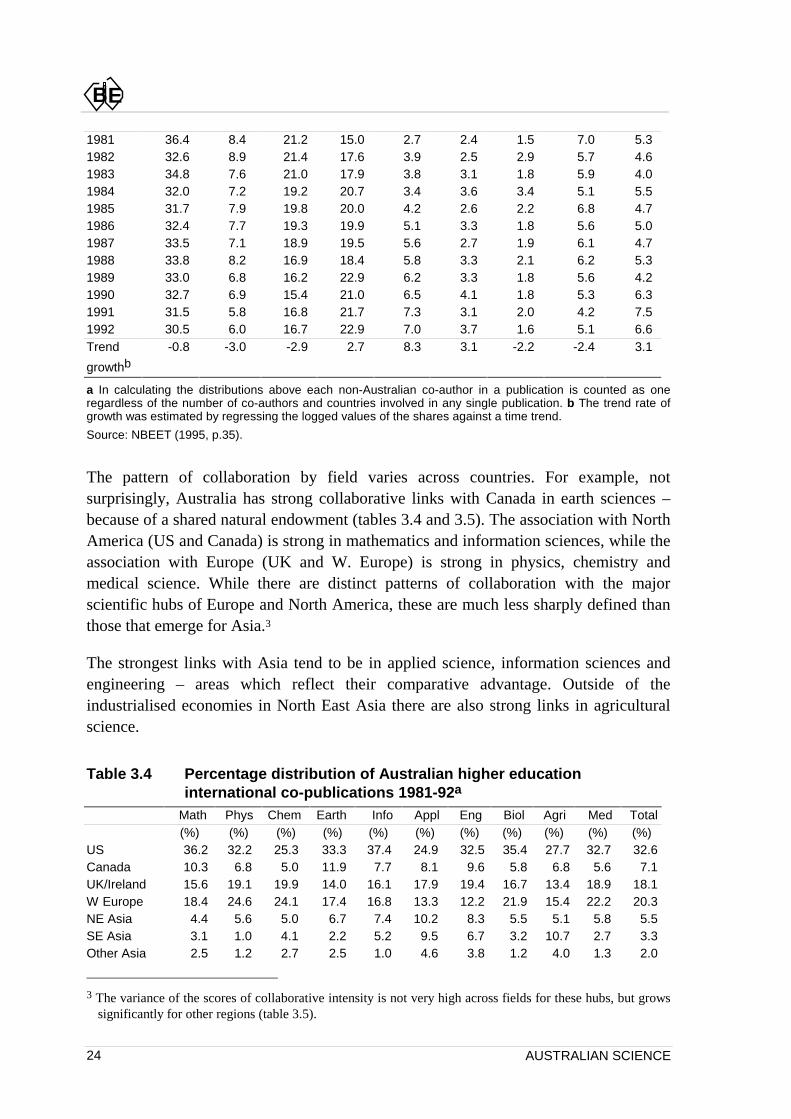
a In calculating the distributions above each non-Australian co-author in a publication is counted as oneregardless of the number of co-authors and countries involved in any single publication. The data relate to thetotal period from 1981 to 1992.
Source: NBEET (1995, p.35).
However, this pattern is changing. Asian countries accounted for about 6.6 per cent ofAustralian internationally co-authored academic papers in 1981. By 1992, this hadnearly doubled to 12.2 per cent (table 3.3). Particularly strong growth was apparent forpapers authored with Japan and China. Interestingly, there has been negligible growthin the already weak levels of academic scientific collaboration with either Taiwan orSouth Korea – two of the most dynamic of the emerging scientifically developedeconomies of the region.
Collaboration with Western Europe has also grown significantly, with the shareincreasing by 53 per cent from 1981 to 1992 – but this has been mirrored by an almostequal waning of the UK.
Table 3.3 Australian international collaboration by region by time(percentage share of Australian co-publications)a
US Canada UK W.Europe
NE Asia SE Asia OtherAsia
Oceania Others
AUSTRALIAN SCIENCE
BE
24
1981 36.4 8.4 21.2 15.0 2.7 2.4 1.5 7.0 5.31982 32.6 8.9 21.4 17.6 3.9 2.5 2.9 5.7 4.61983 34.8 7.6 21.0 17.9 3.8 3.1 1.8 5.9 4.01984 32.0 7.2 19.2 20.7 3.4 3.6 3.4 5.1 5.51985 31.7 7.9 19.8 20.0 4.2 2.6 2.2 6.8 4.71986 32.4 7.7 19.3 19.9 5.1 3.3 1.8 5.6 5.01987 33.5 7.1 18.9 19.5 5.6 2.7 1.9 6.1 4.71988 33.8 8.2 16.9 18.4 5.8 3.3 2.1 6.2 5.31989 33.0 6.8 16.2 22.9 6.2 3.3 1.8 5.6 4.21990 32.7 6.9 15.4 21.0 6.5 4.1 1.8 5.3 6.31991 31.5 5.8 16.8 21.7 7.3 3.1 2.0 4.2 7.51992 30.5 6.0 16.7 22.9 7.0 3.7 1.6 5.1 6.6Trend
growthb-0.8 -3.0 -2.9 2.7 8.3 3.1 -2.2 -2.4 3.1
a In calculating the distributions above each non-Australian co-author in a publication is counted as oneregardless of the number of co-authors and countries involved in any single publication. b The trend rate ofgrowth was estimated by regressing the logged values of the shares against a time trend.
Source: NBEET (1995, p.35).
The pattern of collaboration by field varies across countries. For example, notsurprisingly, Australia has strong collaborative links with Canada in earth sciences –because of a shared natural endowment (tables 3.4 and 3.5). The association with NorthAmerica (US and Canada) is strong in mathematics and information sciences, while theassociation with Europe (UK and W. Europe) is strong in physics, chemistry andmedical science. While there are distinct patterns of collaboration with the majorscientific hubs of Europe and North America, these are much less sharply defined thanthose that emerge for Asia.3
The strongest links with Asia tend to be in applied science, information sciences andengineering – areas which reflect their comparative advantage. Outside of theindustrialised economies in North East Asia there are also strong links in agriculturalscience.
Table 3.4 Percentage distribution of Australian higher educationinternational co-publications 1981-92a
Math Phys Chem Earth Info Appl Eng Biol Agri Med Total(%) (%) (%) (%) (%) (%) (%) (%) (%) (%) (%)
US 36.2 32.2 25.3 33.3 37.4 24.9 32.5 35.4 27.7 32.7 32.6Canada 10.3 6.8 5.0 11.9 7.7 8.1 9.6 5.8 6.8 5.6 7.1UK/Ireland 15.6 19.1 19.9 14.0 16.1 17.9 19.4 16.7 13.4 18.9 18.1W Europe 18.4 24.6 24.1 17.4 16.8 13.3 12.2 21.9 15.4 22.2 20.3NE Asia 4.4 5.6 5.0 6.7 7.4 10.2 8.3 5.5 5.1 5.8 5.5SE Asia 3.1 1.0 4.1 2.2 5.2 9.5 6.7 3.2 10.7 2.7 3.3Other Asia 2.5 1.2 2.7 2.5 1.0 4.6 3.8 1.2 4.0 1.3 2.0
3 The variance of the scores of collaborative intensity is not very high across fields for these hubs, but grows
significantly for other regions (table 3.5).

BUREAU OF INDUSTRY ECONOMICS
INTERNATIONALLY CO-AUTHORED PUBLICATIONS 25
Oceania 3.0 3.3 8.7 7.2 3.2 7.0 2.8 5.7 8.6 6.1 5.6Others 6.5 6.3 5.2 4.8 5.2 4.6 4.8 4.6 8.2 4.7 5.5Total 100.0 100.0 100.0 100.0 100.0 100.0 100.0 100.0 100.0 100.0 100.0
a Math is mathematics, Phys is physics, Chem is chemistry, Earth is earth sciences, Info is informationsciences, Appl is applied sciences, Eng is engineering, Biol is biological sciences, Agri is agriculturalsciences, Med is medical sciences and Total is all fields (including social sciences, humanities andmultidisciplinary publications). Western Europe includes all Europe except Eastern Europe and UK/Ireland.NE. Asia includes China, Hong Kong, Japan, South Korea and Taiwan. SE. Asia includes Brunei, Burma,Indonesia, Laos, Malaysia, Philippines, Singapore, Thailand and Vietnam. Other Asia includes all other Asiancountries. Oceania includes Polynesian and Melanesian countries plus New Zealand. In calculating thedistributions above each non-Australian co-author in a publication is counted as one regardless of thenumber of co-authors and countries involved in any single publication.
Source: NBEET (1995, pp. 49-50).
Table 3.5 Scores of collaborative intensity by field by region, 1981-92a
Math Phys Chem Earth Info Appl Eng Biol Agri Med VarianceUS 1.11 0.99 0.78 1.02 1.15 0.76 1.00 1.09 0.85 1.00 0.018Canada 1.45 0.96 0.70 1.68 1.08 1.14 1.35 0.82 0.96 0.79 0.099UK/Ireland 0.86 1.06 1.10 0.77 0.89 0.99 1.07 0.92 0.74 1.04 0.016W. Europe 0.91 1.21 1.19 0.86 0.83 0.66 0.60 1.08 0.76 1.09 0.047NE. Asia 0.80 1.02 0.91 1.22 1.35 1.85 1.51 1.00 0.93 1.05 0.105SE. Asia 0.94 0.30 1.24 0.67 1.58 2.88 2.03 0.97 3.24 0.82 0.941Other Asia 1.25 0.60 1.35 1.25 0.50 2.30 1.90 0.60 2.00 0.65 0.429Oceania 0.54 0.59 1.55 1.29 0.57 1.25 0.50 1.02 1.54 1.09 0.174Others 1.18 1.15 0.95 0.87 0.95 0.84 0.87 0.84 1.49 0.85 0.045
a See previous table for mnemonics. The data above represent scores of the intensity of collaboration bydiscipline calculated simply by dividing each of the cell entries in the previous table by the corresponding rowentry in the extreme right column. That is:SCOREij = COLLij COLLij j =1
k∑ ( COLLiji =1N∑ COLLij )i=1
N∑j =1k∑ where COLLij is the number of
collaborative papers by country i with Australia in field j. This tells us whether a country has a higher or lowerlevel of collaboration in a field than it does for science overall. The variance of the scores were calculated foreach region. This tells us how variable the extent of collaboration is across fields for different regions.
Source: Data based on NBEET (1995, pp. 49-50).
So far we have only looked at Australia’s regional pattern of collaboration withoutseeing how this fits into the web of scientific collaborative relationships that developbetween countries. Using NBEET (1995) data we can explore more deeply this web ofrelationships between players in the region (table 3.6). Each column in table 3.6 showsthe share of a country’s collaborative articles with the countries shown in each of therows. Thus 0.2 per cent of Australia’s co-authored papers are with Taiwan and 0.8 percent of Taiwan’s co-authored papers are with Australia. The first row of the tableshows the extent to which countries in the region are collaborating with Australia. Forthe major NE Asian economies of Japan, South Korea, Taiwan and China it appearsthat Australia is unimportant as a collaborative partner – with the US being dominant.
However, table 3.6 can be somewhat misleading in indicating the strength ofcollaborative relationships. In particular, Australia produces many fewer collaborativepapers in this region than Japan, US, England or France – and so we would expectsmaller shares. The question to ask is: given the number of Australia’s collaborative

AUSTRALIAN SCIENCE
BE
26
papers how well do we perform relative to other countries? We adapted table 3.6 bynormalising each of the shares to take account of this “size” problem (table 3.7). Wefound that Australia has stronger than expected collaborative arrangements with Japan,Singapore, Malaysia, Thailand and Indonesia and weaker ones with Taiwan, SouthKorea and Vietnam. Collaborative arrangements with China, Hong Kong and thePhilippines are roughly at their expected levels.
Table 3.6 International collaboration (percentage share of each country’stotal collaborative articles with other countries), 1988-94 a
Aust Taiw Chin Jap SK Sing Mal Phil Viet Thai Indon HKAustralia .. 0.8 4.6 3.1 0.8 13.5 16.9 8.1 2.9 10.8 18.3 8.2Taiwan 0.2 .. 1.2 1.3 0.7 2.5 0.6 1.1 0.0 0.5 0.8 3.8China 3.0 3.2 .. 5.4 2.6 5.3 1.7 4.8 0.0 1.4 1.1 18.6Japan 5.7 9.5 15.1 .. 20.1 7.8 11.7 19.8 12.4 18.7 23.4 3.1South Korea 0.2 0.8 1.0 2.9 .. 0.5 0.8 2.5 0.4 0.6 0.7 0.4Singapore 1.2 0.9 0.7 0.4 0.2 .. 5.0 0.8 0.0 1.1 0.8 2.2Malaysia 0.9 0.1 0.1 0.3 0.2 2.9 .. 1.0 0.0 0.9 0.9 1.3Philippines 0.4 0.2 0.4 0.5 0.5 0.5 1.0 .. 3.3 1.6 1.7 0.3Vietnam 0.0 0.0 0.0 0.1 0.0 0.0 0.0 0.8 .. 1.0 0.1 0.2Thailand 1.1 0.2 0.2 1.0 0.2 1.2 1.8 3.2 8.3 .. 1.3 0.4Indonesia 0.9 0.1 0.1 0.6 0.1 0.4 0.8 1.6 0.4 0.6 .. 0.3Hong Kong 1.1 2.1 3.9 0.2 0.2 3.4 3.4 0.7 2.5 0.6 1.0 ..US 46.7 73.1 47.2 62.0 64.2 30.6 23.5 41.2 20.7 37.0 29.9 30.1Canada 10.4 3.8 9.8 7.1 3.6 8.4 5.0 4.0 3.3 6.0 3.9 8.9England 22.8 3.5 9.1 8.5 2.9 21.0 23.2 6.0 10.8 14.9 8.6 21.0France 5.5 1.7 6.6 6.5 3.7 2.0 4.4 4.4 34.9 4.4 7.7 1.1
a The country mnemonics in the top row follow the countries listed in the left hand column. To read the table,note the following examples. 0.8 per cent of Taiwan’s total collaborative papers (where the total is based ononly the countries listed) are with Australia while 73.1 per cent are with the US. In contrast 0.2 per cent ofAustralia’s collaborative papers are with Taiwan. These data include collaborative publications from allsectors of the economy and are not isolated to the higher education sector.
.. not relevant
Source: NBEET (1995, p.49-50).
The low levels of collaboration with South Korea and Taiwan are not anomalous forAustralia. Most countries in the region, with the exception of Japan, have low levels ofacademic scientific collaboration with these two countries.4 Even so, the reasonsunderlying Australia’s low level of collaboration with these emerging scientificallyadvanced countries should be pursued.
Table 3.7 Measures of the strength of international collaboration a
Aust Taiw Chin Jap SK Sing Mal Phil Viet Thai Indon HKAustralia .. 0.3 1.0 1.2 0.2 2.2 2.4 1.1 0.6 1.8 2.3 1.3Taiwan 0.3 .. 0.9 1.7 0.6 1.3 0.3 0.5 0.0 0.2 0.3 2.0
4 As noted in table 3.7 we do not have data to be able to include the US in this analysis. However, there is
little question that the US would be the major site of collaborative research for these two countries.

BUREAU OF INDUSTRY ECONOMICS
INTERNATIONALLY CO-AUTHORED PUBLICATIONS 27
China 1.0 0.9 .. 1.8 0.5 0.7 0.2 0.6 0.0 0.2 0.1 2.5Japan 1.2 1.7 1.8 .. 2.5 0.7 0.9 1.4 1.3 1.6 1.5 0.3South Korea 0.2 0.6 0.5 2.5 .. 0.2 0.3 0.8 0.2 0.2 0.2 0.1Singapore 2.2 1.3 0.7 0.7 0.2 .. 3.1 0.5 0.0 0.8 0.4 1.6Malaysia 2.4 0.3 0.2 0.8 0.3 3.1 .. 1.0 0.0 1.0 0.7 1.4Philippines 1.1 0.5 0.6 1.4 0.8 0.5 1.0 .. 4.6 1.8 1.4 0.3Vietnam 0.6 0.0 0.0 1.3 0.2 0.0 0.0 4.6 .. 6.7 0.5 1.4Thailand 1.8 0.2 0.2 1.6 0.2 0.8 1.0 1.8 6.6 .. 0.6 0.3Indonesia 2.3 0.3 0.1 1.5 0.2 0.4 0.7 1.4 0.5 0.6 .. 0.3Hong Kong 1.3 2.0 2.5 0.3 0.1 1.6 1.4 0.3 1.4 0.3 0.3 ..
a The country mnemonics in the top row follow the countries listed in the left hand column. The data arebased on the following measure: LINKiq = (COLLiq COLLi ) COLLq TCOLL where COLLiq is thenumber of collaborative papers of country i with country q, COLLi is the number of collaborative papers ofcountry i with all other countries in the region and TCOLL is the total number of collaborative papers in theregion. The total will include double counting but this is necessary to ensure that the sum over q ofCOLLq TCOLL adds to one. NBEET (1995) provide some further data on collaboration of the abovecountries with the US, Canada, England and France as in the previous table. However, we could not computemeasures of the intensity of linkages using the NBEET data because data on total collaborative papers bythese countries were not available. Note that the data above include collaborative publications from allsectors of the economy and are not isolated to the higher education sector.
.. not relevant.
Source: NBEET (1995, p.49).

AUSTRALIAN SCIENCE
BE
28
4 Australia’s scientific publicationsand citations over time
4.1 Publications over time
Australia’s production of scientific papers has grown strongly in absolute terms overthe period from 1981 to 1994 – increasing at a trend rate of about 3.6 per cent perannum (figure 4.1 and table 4.1). Over this fourteen year period the overall number ofannual scientific papers has increased by around 60 per cent. But much of this growthhas occurred in the second half of the period. Growth from 1981 to 1987 was modestwith only a 13.6 per cent increase in the number of papers. In contrast, in the periodfrom 1988 to 1994 the number of scientific papers published increased by nearly 40 percent.
Figure 4.1 Growth in Australian and world scientific papers, 1981 to 1994
1981 1982 1983 1984 1985 1986 1987 1988 1989 1990 1991 1992 1993 199490
100
110
120
130
140
150
160
170
Australia
World
Index, 1981=100.0
Source: ISI database.
Table 4.1 Growth rates in scientific papers a
1981 to 1987 1987 to 1994 1981 to 1994

BUREAU OF INDUSTRY ECONOMICS
AUSTRALIA’S SCIENTIFIC PUBLICATIONS AND CITATIONS OVER TIME 29
Trend Rank Trend Rank Trend Rank Years todouble
Australia 0.026 (50) 0.049 (47) 0.036 (21) 19.0Canada 0.049 (31) 0.037 (59) 0.041 (17) 16.7Chile 0.048 (32) 0.055 (40) 0.054 (13) 12.8Denmark 0.021 (56) 0.054 (41) 0.036 (22) 19.5Finland 0.045 (34) 0.065 (34) 0.049 (14) 14.1France 0.032 (44) 0.052 (43) 0.044 (16) 15.9Germany 0.024 (53) 0.041 (55) 0.033 (24) 21.1Greece 0.081 (19) 0.089 (23) 0.087 (6) 7.9Hong Kong 0.143 (9) 0.107 (14) 0.117 (5) 5.9India -0.002 (71) 0.018 (68) 0.011 (29) 61.4Indonesia 0.061 (26) 0.096 (21) 0.079 (7) 8.8Italy 0.057 (27) 0.078 (27) 0.068 (9) 10.1Japan 0.054 (30) 0.060 (37) 0.058 (12) 11.9Malaysia 0.020 (57) 0.091 (22) 0.062 (11) 11.2Mexico 0.071 (24) 0.098 (19) 0.079 (8) 8.8Netherlands 0.062 (25) 0.066 (33) 0.063 (10) 11.0New Zealand 0.013 (62) 0.043 (50) 0.029 (26) 23.7Norway 0.029 (46) 0.052 (44) 0.037 (20) 18.9Papua New Guinea 0.039 (39) -0.031 (74) 0.001 (30) 658.2Peoples R. China 0.182 (6) 0.103 (16) 0.147 (4) 4.7Philippines -0.025 (76) 0.041 (52) 0.019 (28) 36.8Singapore 0.207 (4) 0.153 (6) 0.161 (3) 4.3South Africa 0.073 (22) 0.002 (71) 0.035 (23) 19.8South Korea 0.214 (3) 0.216 (1) 0.216 (1) 3.2Sweden 0.045 (35) 0.040 (56) 0.039 (19) 17.8Switzerland 0.034 (42) 0.067 (32) 0.046 (15) 15.0Taiwan 0.178 (8) 0.200 (2) 0.200 (2) 3.5Thailand 0.016 (60) 0.077 (29) 0.040 (18) 17.5UK 0.028 (47) 0.040 (58) 0.030 (25) 22.8US 0.023 (54) 0.029 (63) 0.027 (27) 25.8World 0.032 0.043 0.037 18.6
a The trend growth rates were calculated by regressing the logged values of the number of scientific papersagainst a time trend. The years to double the volume of papers was calculated as ln(2)/r where r is theexponential trend rate of growth.
Source: ISI database.
Australia’s growth in papers has been roughly on par with world trends. Relativegrowth was lower during the 1980s and higher in the 1990s – so that at the end of thefourteen year period Australia’s share of world papers was close to its value in 1981.We also examined a longer data set on publication shares (figure 4.2). These datasuggest an erratic pattern, with the share fluctuating around 2.1 per cent. These datasuggest that the present level is about 5 per cent above the historical average.

AUSTRALIAN SCIENCE
BE
30
Figure 4.2 Australia’s share of world scientific publications, 1973 to 1994a
0.02
0.0205
0.021
0.0215
0.022
0.022519
73
1974
1975
1976
1977
1978
1979
1980
1981
1982
1983
1984
1985
1986
1987
1988
1989
1990
1991
1992
1993
1994
ISI datasetCHI dataset
a The Computer Horizons Incorporated (CHI) data is based on around 2300 journals covered by the ScienceCitation Index in 1973 (excluding psychology and social sciences). This series was spliced on to the ISI dataset using backward recursion: ISIt−1 = ISIt × (CHIt −1 CHIt ) where ISI is the ISI value and CHI is the CHIvalue. The spliced data is indicative only because of differences in the coverage of the two databases and thelower precision in the CHI data.
Source: ISI database and CHI data from DITAC (1987, p.352).
But the rate of growth of codified scientific knowledge in Australia (and indeed mostother advanced scientific countries) is paltry compared to some of the fast growingcountries in the region. At the current rate of growth, it will take Australia nearlytwenty years to double its count of papers. If present trends continue, this will takeabout four to five years for Singapore, China, South Korea and Taiwan.
4.2 Citations over time
Measuring papers is easy. We can simply look at how many papers were published in agiven year. But measuring citations is far more difficult because citations for a givenpaper accumulate over time. In the ISI database there are two ways of dealing withelapsed time when recording citations: the variable and fixed window approaches.

BUREAU OF INDUSTRY ECONOMICS
AUSTRALIA’S SCIENTIFIC PUBLICATIONS AND CITATIONS OVER TIME 31
The variable window method
For any given paper in any given year the current ISI database counts citations fromthat year until 1994. So a paper published in 1981 has 14 years of citations recorded,while a paper published in 1994 has only one year of citations recorded.
The fixed window method
Citations are recorded over a number of five year ‘windows’. So as an illustration, for apaper written in 1981-85 the ISI will record only those citations occurring within thatfive year period. The database produces information on ten overlapping windowsrunning from 1981-85, 1982-86 to 1990-94.
The advantage of the variable window method is that it uses the maximum data, but itsuffers from two limitations:
• Papers of different ages have different chances of earning high citation rates. Toovercome this we look at citation rates relative to other countries. Thus while it istrue that an Australian paper in 1993 has only two years to be cited this is alsotrue of a US or Canadian paper.
• The number of publications and citations in a given year can be quite small at thefield level or for countries with smaller science systems. Fluctuations in the datatends to mask trends. Accordingly, for much of this chapter we use the fixedwindow data.
The data confirm the facts (but not necessarily the interpretation) first disclosed inScience Watch and amplified by Bourke and Butler (1994): Australian citation sharesand relative citation rates are falling (table 4.2). It appears that there is a recovery in1994 but we believe this is an illusion caused by the earlier citation of scientific articleswritten in English.1
A longer time series of data (constructed by splicing two datasets together) suggest thatAustralia’s relative citation impact has risen and fallen in the past (figure 4.3). The mid-1970s represent, for example, a clear period of relative decline, close to thatexperienced since 1988. Overall, the series suggests a long run decline in the relativecitation impact.
1 Large revisions occur for final year data. For example, the measures of Australian citation shares and
relative impacts for 1993 cited in the 1993 version of the ISI database were considerably loweredin the 1994 version. We expect the same will happen for the 1994 data in the 1995 database. Therevisions in citation shares and relative citation impacts are much smaller after the second year ofdata.

AUSTRALIAN SCIENCE
BE
32
While relative citation impacts have been falling – absolute citation rates have stillrisen in Australia over the last 14 years (figure 4.4). Interestingly, the very low growthin absolute citation rates from the late 1980s coincides with the rapid expansion ofpapers published by Australian scientists. This could be one of the keys to the reducedvisibility of Australian science – and we look at it further later.
Table 4.2 Australia’s scientific publication performance over time,1981 to 1994a
Variable windowdata
Share ofworld
citations
Share of worldpapers
Share ofworld cited
papers
Relative citationimpact
Relative impact forcited papers
1981 0.0220 0.0223 0.0243 0.986 0.9051982 0.0213 0.0215 0.0236 0.990 0.9031983 0.0219 0.0213 0.0233 1.025 0.9381984 0.0208 0.0213 0.0233 0.975 0.8931985 0.0215 0.0213 0.0231 1.008 0.9311986 0.0214 0.0215 0.0234 0.997 0.9161987 0.0200 0.0213 0.0230 0.942 0.8711988 0.0211 0.0208 0.0227 1.014 0.9281989 0.0197 0.0211 0.0228 0.936 0.8641990 0.0185 0.0209 0.0226 0.888 0.8211991 0.0183 0.0209 0.0222 0.875 0.8241992 0.0183 0.0209 0.0222 0.878 0.8271993 0.0193 0.0219 0.0231 0.881 0.8361994 0.0211 0.0223 0.0235 0.949 0.900Trend to 1993 (%) -1.53 -0.25 -0.53 -1.28 -1.00Fixed window data81-85 0.0206 0.0216 0.0238 0.957 0.86882-86 0.0205 0.0214 0.0235 0.958 0.87483-87 0.0205 0.0214 0.0233 0.962 0.88184-88 0.0204 0.0212 0.0232 0.961 0.88085-89 0.0206 0.0212 0.0232 0.972 0.88686-90 0.0204 0.0211 0.0232 0.969 0.88187-91 0.0199 0.0210 0.0228 0.949 0.87288-92 0.0197 0.0209 0.0225 0.940 0.87289-93 0.0189 0.0211 0.0225 0.896 0.84490-94 0.0185 0.0214 0.0225 0.867 0.823Trend to 90-94 (%) -1.10 -0.20 -0.63 -0.92 -0.49
a The trend growth rates were calculated by regressing the logged values of the relevant variables against atime trend.
Source: ISI database.

BUREAU OF INDUSTRY ECONOMICS
AUSTRALIA’S SCIENTIFIC PUBLICATIONS AND CITATIONS OVER TIME 33
Figure 4.3 Australia’s relative citation impact, 1973 to 1994a
0.85
0.87
0.89
0.91
0.93
0.95
0.97
0.99
1.01
1.03
1.0519
73
1974
1975
1976
1977
1978
1979
1980
1981
1982
1983
1984
1985
1986
1987
1988
1989
1990
1991
1992
1993
CHI dataset
ISI dataset
Relative citation impact
a We constructed the CHI measure of Australia’s relative citation impact from 1973 to 1982 using moredisaggregated data in DITAC(1987). We formed an all-fields score for Australia by calculating a weightedaverage of the citation impacts for 8 scientific disciplines (using the 1973 publications shares as the weights).We then spliced this series on to the ISI data set using backward recursion: ISIt−1 = ISIt × (CHIt −1 CHIt )
where ISI is the ISI value and CHI is the CHI value. The spliced data is indicative only because of differencesin the journal coverage of the two databases, and errors from the weighting method used to form the CHIestimates.
Source: ISI database and CHI data from DITAC (1987, p.352).
Has the decline been uniform across fields or have some fields been responsible formuch of the decline? We found that three fields had suffered particularly largereductions in relative citation impact (with trend declines of greater than 2 per cent perannum): immunology, chemistry and material science (figure 4.5). And two of thesefields, immunology and chemistry, had experienced falling absolute citation rates aswell.
In the middle, there are thirteen fields subject to slight positive or negative trends inrelative citation impacts (between minus and plus one per cent per annum). At the otherend of the spectrum there are two fields (astrophysics and multidisciplinary science)with trend increases in relative citation impacts of over 2 per cent per annum. Clearlythen, there have been considerable movements at the extremes, but with most fieldssharing falls in line with the 1 per cent per annum general decline.

AUSTRALIAN SCIENCE
BE
34
Figure 4.4 Citation rates in Australian science, 1981-85 to 1990-94
99.0
101.0
103.0
105.0
107.0
109.0
111.0
81-85 82-86 83-87 84-88 85-89 86-90 87-91 88-92 89-93 90-94
Citation rate of cited papers
Citation rate
Index (1981-85=100.0)
Source: ISI database.
Figure 4.5 Trend rates of growth in relative citation impacts by field, Australiaa
-0.050
-0.040
-0.030
-0.020
-0.010
0.000
0.010
0.020
0.030
0.040
0.050
imm
une
chem
mat
er
mic
rob
mol
ec
neur
o
plan
t
all
agric
com
put
phar
m
clin
med
geos
ci
biol
og
phys
ic
psyc
h
ecol
ogy
engi
n
mat
hs
astr
on
mul
ti
Trend in relative citation impact, 1981-85 to 1990-94
a Trend rates of growth were calculated by regressing the natural log of the relative citation impact against atime trend. The mnemonics for the fields are detailed in appendix C.
Source: ISI database.

BUREAU OF INDUSTRY ECONOMICS
AUSTRALIA’S SCIENTIFIC PUBLICATIONS AND CITATIONS OVER TIME 35
How have other countries fared and where are we in league ladder terms? It is usefulwhen making these comparisons to break a country’s relative citation performance intotwo components2:
• First, for a given country look at those papers which receive at least one citation,then gauge the citation rates for these papers relative to the world and finally seehow this relative citation performance has changed over time.
• Second, look at those papers which are not cited at all. Then calculate theproportion of a country’s papers which fall into this group. We can then comparethis proportion with that of the world. Finally we can calculate how this relativeproportion has shifted over time.
There was a trend decline of about half a percent per annum in the relative citationimpact for Australian papers receiving at least one citation. This placed Australia in54th position in the global league ladder – ahead of countries like Sweden, Denmark,South Korea and Taiwan – but well behind the US and UK.
In Australia’s case there was a trend decline of just over 0.1 per cent per annum in thepercentage of cited papers compared to the world where it grew at just over 0.3 per centper annum. Thus the trend in the relative proportion of cited papers was just below -0.4per cent per annum. This places Australia in 60th position among 79 countries, ahead ofJapan, Malaysia, South Korea, Mexico and Norway and just behind countries like theUK and Denmark. Many countries with relatively underdeveloped systems haveexperienced the greatest growth rates in the percentage of cited papers (such asSenegambia, Vietnam and the Ivory Coast). Thus a low ranking for Australia shouldnot be seen as a particularly adverse outcome.
Overall, Australia’s relative citation rate fell by just under 1 per cent per annum from1981-85 to 1990-94. Australia’s ranking in terms of growth in relative citation rateswas 56 out of 79 (table 4.3). Australia’s position in the world league ladder of quality(as measured by relative citation impact) has fallen from 9th (1981-1985) to 16th(1990-1994) (table 4.4). But Australia’s falling relative citation rate is by no meansanomalous. Most of the advanced scientific countries were ranked in the bottom fiftypercent of world performers. Countries like Denmark, Norway and Sweden have facedsimilar reductions in their relative citation rates. Nor is it the case that the newlyindustrialising countries have all experienced rapidly increasing citation rates: Taiwan
2 Namely the trend in relative citation impact RCI = • ln (cit/pap)a – • ln (cit/pap)w = • ln
(cit/cited)a – • ln (cit/cited)w + • ln (ba/bw) where cit is citations, pap is papers, cited is paperswhich are cited at least once, a and w denote Australia and the world and b is the share of paperswhich are cited.

AUSTRALIAN SCIENCE
BE
36
and South Korea have also faced reductions in relative citation rates of the same orderas Australia.
Table 4.3 Trend rates of growth in citation/paper performance,1981-85 to 1990-94 a
Share ofworld
citations
Share ofworld
papers
Share ofworld cited
papers
Relativecitationimpact
Rank Relativeimpact for
cited papers
Rank
Australia -0.011 -0.002 -0.006 -0.009 (56) -0.005 (54)Canada 0.005 0.003 0.003 0.001 (36) 0.002 (36)Chile 0.013 0.020 0.024 -0.007 (52) -0.011 (63)Denmark -0.012 -0.003 -0.006 -0.009 (58) -0.006 (55)Finland 0.012 0.007 0.008 0.004 (33) 0.004 (32)France 0.013 0.007 0.010 0.006 (29) 0.003 (34)Germany 0.005 -0.004 -0.002 0.009 (25) 0.007 (23)Hong Kong 0.076 0.075 0.080 0.001 (38) -0.004 (49)India -0.029 -0.024 -0.027 -0.006 (50) -0.002 (42)Indonesia 0.030 0.040 0.052 -0.011 (59) -0.022 (72)Italy 0.036 0.031 0.033 0.005 (30) 0.003 (33)Japan 0.023 0.021 0.016 0.001 (37) 0.006 (24)Malaysia 0.027 0.027 0.019 -0.001 (43) 0.007 (22)Mexico 0.014 0.038 0.032 -0.024 (69) -0.017 (69)Netherlands 0.026 0.026 0.025 0.000 (39) 0.001 (40)New Zealand 0.005 -0.009 -0.006 0.014 (19) 0.011 (12)Norway -0.012 -0.003 -0.008 -0.009 (55) -0.004 (46)PNG 0.022 -0.038 -0.023 0.060 (3) 0.044 (3)PR. China 0.152 0.109 0.149 0.043 (7) 0.002 (35)Philippines 0.015 -0.009 0.022 0.024 (15) -0.007 (56)Singapore 0.148 0.111 0.120 0.037 (9) 0.028 (4)S. Africa -0.007 -0.003 -0.003 -0.004 (46) -0.004 (50)S. Korea 0.154 0.178 0.169 -0.024 (68) -0.014 (66)Sweden -0.010 -0.001 -0.001 -0.009 (54) -0.009 (58)Switzerland 0.004 0.006 0.006 -0.002 (45) -0.003 (43)Taiwan 0.161 0.171 0.174 -0.009 (57) -0.013 (64)Thailand 0.033 -0.004 0.033 0.037 (8) 0.000 (41)UK -0.011 -0.009 -0.013 -0.002 (44) 0.002 (38)US -0.008 -0.010 -0.010 0.001 (35) 0.002 (37)
a The trend growth rates were calculated by regressing the logged values of the relevant variables against atime trend.
Source: ISI database.

BUREAU OF INDUSTRY ECONOMICS
AUSTRALIA’S SCIENTIFIC PUBLICATIONS AND CITATIONS OVER TIME 37
Table 4.4 The visibility and quality of science, 1981-85, 1985-1989and 1990-94
1981-85 relative citationrates
1985-89 relative citationrates
1990-94 relative citationrates
Rate Rank Rate Rank Rate RankAustralia 0.96 (9) 0.97 (9) 0.87 (16)Canada 0.97 (8) 0.96 (10) 0.99 (10)Chile 0.59 (28) 0.52 (38) 0.53 (36)Denmark 1.24 (3) 1.12 (6) 1.13 (6)Finland 0.90 (12) 0.91 (14) 0.95 (12)France 0.88 (14) 0.90 (16) 0.93 (13)Germany 0.88 (13) 0.90 (15) 0.96 (11)Hong Kong 0.54 (34) 0.57 (28) 0.51 (38)India 0.29 (66) 0.27 (66) 0.28 (66)Indonesia 0.46 (41) 0.46 (41) 0.48 (43)Italy 0.80 (18) 0.78 (20) 0.84 (18)Japan 0.82 (16) 0.83 (17) 0.81 (19)Malaysia 0.38 (51) 0.33 (58) 0.37 (55)Mexico 0.60 (27) 0.55 (33) 0.48 (42)Netherlands 1.15 (5) 1.14 (4) 1.15 (4)New Zealand 0.70 (21) 0.82 (18) 0.80 (20)Norway 0.93 (10) 0.91 (13) 0.86 (17)Papua N Guinea 0.37 (54) 0.61 (26) 0.62 (27)Peoples R China 0.24 (73) 0.28 (63) 0.35 (59)Philippines 0.44 (44) 0.65 (25) 0.55 (33)Singapore 0.31 (64) 0.39 (52) 0.45 (45)South Africa 0.55 (31) 0.53 (36) 0.54 (35)South Korea 0.49 (36) 0.41 (47) 0.40 (53)Sweden 1.22 (4) 1.18 (3) 1.13 (7)Switzerland 1.45 (1) 1.53 (1) 1.41 (1)Taiwan 0.47 (39) 0.42 (45) 0.42 (48)Thailand 0.43 (46) 0.56 (31) 0.63 (25)UK 1.14 (6) 1.12 (5) 1.13 (5)US 1.36 (2) 1.38 (2) 1.38 (2)
Source: ISI database.
It is instructive, as in Bourke and Butler (1994, p.49), to break the trend in the relativecitation rate into two parts: the trend in the share of world publications and the trend inthe share of world citations. We decompose the relative citation impact into thesecomponents because:
• it may be able to tell us something about the source of the change in the relativecitation impact; and
• there may be a trade-off between the desire for visibility or quality (as measuredby the relative citation impact) and the desire for a higher share of worldpublications. Thus a government, as the coordinator of the science system, might

AUSTRALIAN SCIENCE
BE
38
be happy to see a small decline in relative citation rates if this accommodated anincrease in the world publication share.
We graph the performance of all countries on these two measures in figure 4.6. If acountry lies below (above) the diagonal line on the graph, then the trend in the relativecitation impact of that country is positive (negative). We note that Australia lies (a)quite close to this diagonal line compared to many countries and (b) in a dense mass ofother countries – so much so that we need to magnify this section to see any detail. Thissuggests immediately that Australia’s position is scarcely exceptional. We are with the‘pack’ – but running a little behind.
Second, as observed by Bourke and Butler, only a few countries share Australia’s caseof a relatively stable publication share and a declining citation share. How are we tointerpret this? The answer depends very much on the sort of trade-off that governmentswish between ‘quality’ and publications shares. For example, South Korea and Taiwanhave experienced rapidly increasing citation and publications shares. But the growth ofthe latter has outstripped the former, so that their relative citation impacts have fallen.In this context, the overseers of these systems will probably not diagnose a crisis fromfalling relative citation rates. What does this trade off imply for diagnosing the health ofthe Australian system?
• There are countries like South Korea, Taiwan, Portugal and Turkey with equal orbigger falls in relative citation impact compared to Australia – but large increasesin their penetration of world publications. Judged on the basis of relative citationimpact alone, the performance over time of Australia’s system may seem to bebetter than these countries, but the existence of the trade-off between publicationsand quality casts doubt on this.
• There are some countries, like the US and UK, with bigger falls in publicationshares than Australia, but better growth in relative citation impacts. The trade-offimplies that the trajectory of Australia’s science system may be no worse thantheirs.
• There are many other countries with only modest expansions of paper and citationshares and more severely falling relative citation rates than Australia (forexample, Mexico, Pakistan and Uruguay). For many of these countries thetradeoff between publications and quality may not be enough to alter the rankingof the dynamic performance of their science systems compared to Australia. Thatis, it does not seem clear that the trajectory of Australia’s science system is worsethan another country with a more severely falling relative citation rate but only amodestly increasing publication share.

BUREAU OF INDUSTRY ECONOMICS
AUSTRALIA’S SCIENTIFIC PUBLICATIONS AND CITATIONS OVER TIME 39
• Finally, there are countries with both falling citation impacts and fallingpublication shares. The existence of a trade-off implies that these countries arefaring even worse than merely looking at the relative citation impact would imply.
Figure 4.6 Growth in paper and citation shares by country,1981-85 to 1990-94a
-0.1500
-0.1000
-0.0500
0.0000
0.0500
0.1000
0.1500
0.2000
-0.1500 -0.1000 -0.0500 0.0000 0.0500 0.1000 0.1500 0.2000
Taiwan
S. Korea
Cameroon
ChinaSingapore
Senegambia
Ivory Coast
Lebanon
Iraq
Romania
Ghana
Bangladesh
Tre
nd g
row
th r
ate
in w
orld
pap
er s
hare
-0.025
-0.015
-0.005
0.005
0.015
0.025
0.035
-0.015 -0.010 -0.005 0.000 0.005 0.010
SwedenDenmark
Australia
UK
Norway
Iran
US
Egypt
S Africa
Switzerland
Canada
Germany
NZPoland
Belgium
Trend growth rate in world citation share
Source: ISI database.
We now look at how Australia’s performance by scientific field compares to othercountries. We present detailed data on trend growth rates in world publication sharesand in relative citation impacts for 20 fields and 29 countries in appendix C. Fourinteresting features emerge:

AUSTRALIAN SCIENCE
BE
40
• Every country experiences a decline in the relative citation impact of at least 6 ofthe 20 ISI scientific fields. The ‘average’ country experiences a decline in 9 out ofthe 20 fields. Decline should therefore not be seen as exceptional: it is normal.
• The performance of Australia’s most adversely affected field (immunology with a4 per cent reduction in its relative citation impact per annum) is roughly on parwith the most adversely affected fields of other countries with developedscientific systems. But countries with less developed systems exhibit much moreextreme reductions in their relative citation impacts for their most adverselyaffected fields (table 4.5). For example, the relative citation impact ofimmunology fell by a trend rate of 18.8 per cent in South Korea.
Table 4.5 Trends in relative citation impacts, high and low performing fields,1981-85 to 1990-94
Minimumgrowth rate
Field with miniumgrowth
Maximumgrowth rate
Field withmaximum growth
Fieldswith
negativegrowth
Range
(%) (%) No. (%)S Korea -18.81 immunology 19.58 multidisciplinary 10 38.39Mexico -15.86 computer 6.61 clin. medicine 14 22.47Taiwan -11.50 ecology 8.89 astrophysics 7 20.39Chile -8.67 ecology 12.25 microbiology 9 20.92India -8.47 immunology 3.90 mathematics 11 12.37Hong Kong -8.26 multidisciplinary 8.49 microbiology 9 16.75PR China -6.89 computer 14.11 plant 6 21.00Netherlands -5.75 materials 2.87 clin. medicine 9 8.61Norway -5.64 mathematics 4.18 multidisciplinary 10 9.83US -4.99 multidisciplinary 1.29 agriculture 9 6.29S Africa -4.77 pharmacology 4.30 engineering 9 9.07Denmark -4.53 molecular biol 4.31 astrophysics 12 8.84Australia -4.05 immunology 4.48 multidisciplinary 15 8.53Japan -3.90 computer 5.45 multidisciplinary 8 9.35New Zealand -3.63 molecular biol 7.40 neuroscience 7 11.02Switzerland -3.38 molecular biol 5.38 multidisciplinary 8 8.76Finland -3.27 microbiology 5.85 multidisciplinary 8 9.12Italy -2.89 geoscience 3.93 computer 7 6.81France -2.75 materials 4.15 ecology 6 6.90Sweden -2.68 molecular biol 9.43 multidisciplinary 11 12.11UK -2.26 agriculture 4.01 pharmacology 12 6.28Canada -2.23 agriculture 4.22 multidisciplinary 7 6.45Germany -0.95 pharmacology 4.14 ecology 7 5.09
Source: appendix C.
• As well, the performance of Australia’s highest performing field(multidisciplinary with a 4.5 per cent increase in its relative citation impact perannum) is roughly on par with the highest performing fields of other countries
BUREAU OF INDUSTRY ECONOMICS
AUSTRALIA’S SCIENTIFIC PUBLICATIONS AND CITATIONS OVER TIME 41
with developed scientific systems. But just as before, countries with lessdeveloped systems exhibit much more extreme increases in their relative citationimpacts for their highest performing fields (table 4.5). For example, the relativecitation impact of multidisciplinary science increased by a trend rate of nearly 40per cent in South Korea.
• Australia is unusual in that more fields have declined in impact than othercountries. 15 of the 20 fields show a trend decline in relative citation impact from1981-85 to 1990-94 (table 4.5). While many other countries show a more extremedecline in aggregate relative citation impacts, this can often be traced to just a fewfields. Australia presents a case where the aggregate decline in relative impact hasbeen relatively small – but is distributed over many fields.
• Related to the above two points, changes in relative citation impacts by field aremuch less variable in Australia compared to many other countries. Figure 4.7depicts growth rates in relative citation impacts, sorted in ascending order foreach country. The ‘topography’ formed by these growth rates reveals that theslope from the least performing field in Australia to the highest performing isrelatively gentle and smooth. This is also true for most other scientificallyadvanced countries.3 On the other hand, those with developing systems face asteeper and more jagged slope – their systems are far more turbulent thanAustralia’s – an issue we return to later.
4.3 Possible reasons for the decline in citation rates
What are possible reasons for the decline? We consider a list of hypotheses for thepattern in the data, many of them originating from Bourke and Butler (1994) and fromdiscussions we have had with observers of Australian science.
1. Changes in the field structure of science, with a re-orientation to fields with lowercitation rates?
It is certainly true that over the last 13 years there has been a re-orientation from somefields where Australian science experienced high relative citation rates (figure 4.8).
3 Another way of appraising this is to look at the range between the maximum and minimum growth rates in
relative citation impacts for each country in table 4.5.

AUSTRALIAN SCIENCE
BE
42

BUREAU OF INDUSTRY ECONOMICS
AUSTRALIA’S SCIENTIFIC PUBLICATIONS AND CITATIONS OVER TIME 43
Figure 4.8 Structural change and quality in Australian science
0.70
0.80
0.90
1.00
1.10
1.20
1.30
-60.0% -40.0% -20.0% 0.0% 20.0% 40.0% 60.0%
Multidisciplinary
Agricultural sci
Chemistry
Mathematics
Plant & animal sci
Pharmacology
Biology & biochemistry
Computer sci
Psychology/psychiatry
Geosciences
Clinical medicine
Microbiology
Neuroscience Immunology
Materials sci
Astrophysics
Ecology/environment
Physics
Engineering
Molecular biology/genetics
% change in share of Australian papers
Cita
tions
per
pap
er r
elat
ive
to w
orld
(av
erag
e 19
81-9
4)
Source: ISI database.
And some fields, like molecular biology, where Australia has a very low relativecitation rate, have expanded rapidly. We explore structural change in more depth in thenext section – but we find little evidence that shifts in field structure have had any morethan a slight impact on the decline in Australia’s relative citation rate.
2. Greying of science?
While we have incomplete data on the age profile of scientists, the evidence availabledoes not point to a marked ageing of Australian scientists relative to other developedeconomies.
In any case, some of the countries where population age profiles are generally tiltingtowards the aged, such as Germany and Japan, have improved their relative citationimpact. In contrast, in many of the Asian economies where there has been a rapidgrowth in the number of new (and therefore younger) scientists, relative citation ratesappear to have fallen. In fact, it may be that some of the story of Australia’s decline canbe explained by an ‘immaturity’ effect: Australia’s higher education system hasexpanded rapidly from the late 1980s. Perhaps new academics are cited less often thanexperienced ones? On the other hand, we doubt whether such an effect would yet showup in the data, except perhaps in the last few years.

AUSTRALIAN SCIENCE
BE
44
In any case it should be noted that changes in the age structure of any large grouptypically evolve slowly, so that it seems implausible that the relatively abrupt change inAustralia’s relative citation performance in the 1980s can be principally ascribed to agedistribution effects.
3. Inadequate total funding of infrastructure so that researchers do not haveadequate resources to undertake high quality science?
While we did not have detailed figures on infrastructure spending, we were able togauge expenditure on fixed assets in public sector research (BIE 1996). The datasuggests that there has been strong growth in expenditure per researcher from 1978-79to 1990-91 followed by a fall in 1992-93. But what about other countries? Perhaps theyhave increased their expenditure at a faster rate? The answer is generally no.Nevertheless, more detailed research is required at the field level to gauge whetherrelative infrastructure inadequacies play a role in the decline. In particular, it has beenwidely observed that smaller countries find it difficult to afford some of the extremelycapital-intensive areas of frontier science: so-called ‘big’ science (such as particlephysics, superconductivity, and fusion research).
4. Changes in the distribution of resources?
There have been large shifts in the structure of the Australian higher education systemin the last ten years – with the establishment of many new universities under theUnified National System – each with claims on resources. Not all science funding isdetermined by competition between researchers – so that it is possible that theexpansion of the system may have diluted resourcing for the most able scientists andthe best institutions. However, the major deficit in this argument is one of timing – thedecline appears to have started prior to the change in the system. So while a shift inemphasis away from the pre-1987 universities may have a role in the continuation ofthe decline, it is probably not the trigger.
But there may be other reasons why resources have shifted away from the bestscientists. One other way of testing whether resources have shifted this way is toexamine whether there has been a change in the distribution of citations over time. Wedo not have the data to undertake this analysis. We do know, however, that ‘highflying’ articles (those with citations exceeding 50) account for about one third of allcitations (figure 4.9). This means that changes in the resourcing for, or the number of,gifted researchers, can have a sizeable impact on aggregate citations.

BUREAU OF INDUSTRY ECONOMICS
AUSTRALIA’S SCIENTIFIC PUBLICATIONS AND CITATIONS OVER TIME 45
Figure 4.9 Distribution of citations, Australia, 1981-90
0
0.02
0.04
0.06
0.08
0.1
0.12
0.14
0.16
0.18
0.2P
ropo
rtio
n of
cita
tions
1 to 10 11 to 20 21 to 30 31 to 40 41 to 50 51 to 70 71 to 100 100+
Citations per paper
Source: Data kindly provided by Paul Bourke and Linda Butler.
5. An exodus of quality researchers?
We were unable to appraise the influence of this factor. To do so carefully wouldrequire detailed data on the characteristics of outgoing and incoming scientists and theduration of their absence. The immigration data in BIE (1996) shows that Australia is anet gainer of scientific personnel – and this suggests we are still an attractive locationfor mobile international scientists. On the other hand, relative wage and salary ratesseem to have shifted in favour of other countries – and this could put a pressure on thebest to leave.
6. A shift from basic to applied science?
Public scientific institutions have been increasingly urged to undertake applied ratherthan basic research. Could it be that there has been a shift in the scientific orientation ofagencies like CSIRO towards more practical – but less cited – research? The evidencesuggests that citation rates have not suffered from any such shift. Data on citations ratesprovided by Bourke and Butler suggest that CSIRO increased its citation rate by around20 per cent from 1981-85 to 1988-92, or roughly double the increase apparent forAustralia as a whole.

AUSTRALIAN SCIENCE
BE
46
7. Dislocations in the system?
There have been large institutional changes (in the public science agencies such asCSIRO and the changes brought about by the creation of the new universities) thatcould temporarily lower productivity and quality in science. As noted above, the datapoint to increases in citation rates in CSIRO relative to other parts of the Australiansystem.
Other than the dilution of resources, considered under point 4, changes in the universitysystem may have had an impact in two other ways:
• the time taken to re-organise resources under the new system; and
• an increased flow of lesser quality (less cited) published articles from scientists inthe new universities. In fact, the counted ISI publication output from the ‘new’universities is slight (Bourke and Butler 1995b).4 Accordingly, the newuniversities could only make a small difference to the relative citation rate via thisroute.
We consider that these changes are unlikely to explain the decline in relative citationrates experienced in the 1980s.
8. The visibility of Australian science has declined because Australian scientists aretapping networks less effectively?
Networks between scientists have an important role in scientific research. Such linksinclude those fostered by (among others):
• Australian postgraduate students and post-doctoral researchers abroad;
• sabbatical leave;
• incoming high quality foreign scientists and postgraduate students;
• shared use of facilities;
• participation in conferences and seminars;
• informal discussion groups between scientists; and
4 Indeed, the number of ISI listed papers per researcher is significantly lower in the new universities at
around 0.6 per person compared to the pre-1987 universities at around 5.2 per person (Lowe, 1995).

BUREAU OF INDUSTRY ECONOMICS
AUSTRALIA’S SCIENTIFIC PUBLICATIONS AND CITATIONS OVER TIME 47
• mobility between universities and other institutions.
Any factors which weaken the establishment and maintenance of such networks can (a)weaken Australian scientist’s access to frontier ideas and techniques, thus affectingquality and citation rates and/or (b) lower the visibility of Australian science thuslowering citation rates. On the other hand, the rate of change of internationally co-authored papers with an Australian author (one measure of the degree of access to suchnetworks) seems to be high and roughly in line with other countries. As well, we find itimplausible that changes in networks alone could explain the relatively abrupt nature ofthe change in the later 1980s, although they may be a contributing factor.
9. The quality of Australian papers hasn’t fallen, but the improving quality ofmaturing science systems around the world has displaced some Australianpapers?
Many developing economies have experienced rapidly increasing citation rates. It ispossible that this could lower relative citation rates for Australian papers due todisplacement effects.
Is the scope for improvement greater for science under-performers than high performers(like Australia)? How does this affect our interpretation of the citation rate data? Welooked at this issue by seeing whether there was any relationship between improvementin science quality (as measured by relative citation rates) and the initial level ofperformance. We found that those countries with low relative citation rates in theperiod from 1981-85 tended to achieve greater improvements in their relative citationperformance than countries which had high initial relative citation rates (figure 4.10).But the relationship was very weak. There were many countries which defied the trend– with some of the good getting better and some of the bad getting worse. Nevertheless,the model predicted that Australia would face a trend decline in relative citationimpacts of around 0.7 per cent per annum (compared to the actually realised reductionof just over 0.9 per cent).
While we think convergence towards ‘better’ science might explain some of the shift inour relative citation rates, a puzzle remains. Why have so many of the other advancedscientific countries not experienced similar displacement? We conjectured whether onepossible answer might be that Australia’s field strengths are more closely aligned withthe countries which are experiencing the most rapidly increasing citation rates. In thiscase Australian papers would be disproportionately affected by any displacement. Butin fact, the decline in citations span most fields (and indeed is less in the resource basedfields where we have the greatest field strengths).

AUSTRALIAN SCIENCE
BE
48
Figure 4.10 Is there convergence in scientific performance? a
-0.080 -0.060 -0.040 -0.020 0.000 0.020 0.040 0.060 0.080 0.100 0.1200.000
0.200
0.400
0.600
0.800
1.000
1.200
1.400
1.600
Rel
ativ
e ci
tatio
n im
pact
198
1-85
Trend growth rate in relative citation impact 1981-85 to 1990-94
Australia
a We estimated a simple model of convergence by regressing the trend change in the relative citation impact(from 1981-85 to 1990-94) against a constant and the initial value of the relative citation impact (in 1981-85):
∆ ln Rˆ E LC = –0. 00789 – 0. 01404 ln RELC1981−85(2.2) (2.8)
The t statistics are corrected for heteroscedasticity. Note that the model has poor fit, explaining only about 5per cent of the variation in relative citation impacts.
Source: ISI database.
10. Foreign libraries have poorer access to ISI journals which disproportionatelyfeature Australian scientists?.
Journal costs have risen rapidly in recent years. For example, average medicalperiodical prices in the UK increased from £124 in 1989 to £226 in 1994 (an increaseof 82 per cent) while those in science and technology increased from £214 in 1989 to£402 in 1994 (an increase of 88 per cent) (LISU 1995). This has rationalised librarypurchases at a time of increasing demand by students and researchers. In the US,Perrault (1995) found that academic library collections are beginning to look more andmore alike – with an increased concentration on core materials. To the extent thatAustralian papers are disproportionately represented in the ‘peripheral’ journals makingup the ISI journal list, we would expect declining citation rates. This is a case where thedecline would have to be seen as declining visibility rather than quality.

BUREAU OF INDUSTRY ECONOMICS
AUSTRALIA’S SCIENTIFIC PUBLICATIONS AND CITATIONS OVER TIME 49
11. Maybe relative citation impacts only appear to have fallen?
Data problems could cloud the real long term citation impact of Australian papers.What data problems could matter?
• Is the ISI journal coverage increasingly biased against Australia? As noted byBourke and Butler (1994), the use of dynamic rather than fixed journal sets areunlikely to alter citation results significantly, but this warrants further exploration.
• Is the treatment of collaboratively written papers biasing the results?Collaborative papers receive more citations on average than single authoredpapers. Perhaps Australians are collaborating less? In fact, the proportion ofAustralian papers which involve international collaboration doubled from 1982 to1991 (Bourke and Butler 1994).
• Australians scientists who are temporarily abroad and submit papers while at aforeign university may have these recorded as papers coming from the foreigncountry, not Australia. Of course, the converse is true for foreign scientists inAustralia. Nevertheless, any change in the number or duration of stays by visitingscientists, either Australians abroad, or foreigners here, could affect relativecitation rates.5
• As noted previously, citations take time to accumulate. The way the ISI databasedeals with this accumulation can lead to false pictures of declining citation shares(appendix D). We do not have the data to confirm whether this is true or not.
12 The expansion in the number of researchers has diminished the average qualityof the pool of scientists?
This is nothing more than a re-statement of the old principle of diminishing returns. Wefind some evidence in favour of this hypothesis – but we still find some strong counter-examples. For example, in Singapore the numbers of scientists have expanded rapidly,papers per scientist have grown and relative citation impacts increased.
5 This also assumes that the citation rates of the mobile scientists are different from those that stay at home.
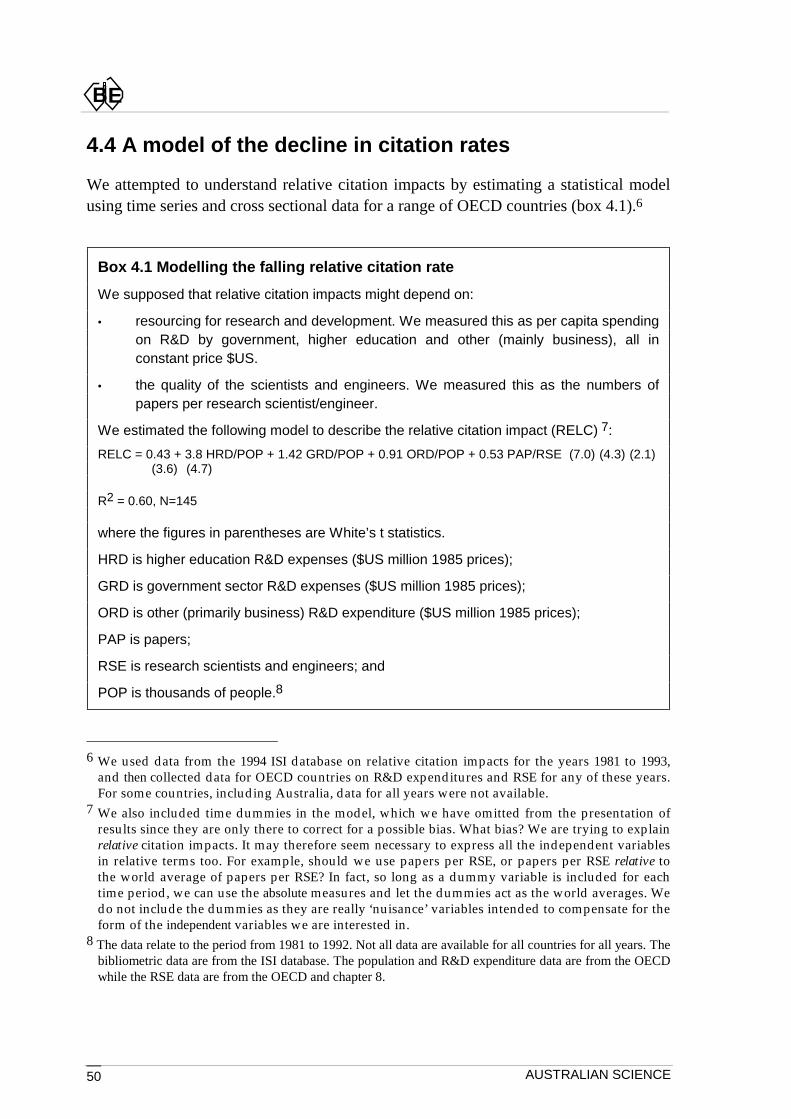
AUSTRALIAN SCIENCE
BE
50
4.4 A model of the decline in citation rates
We attempted to understand relative citation impacts by estimating a statistical modelusing time series and cross sectional data for a range of OECD countries (box 4.1).6
Box 4.1 Modelling the falling relative citation rate
We supposed that relative citation impacts might depend on:
• resourcing for research and development. We measured this as per capita spendingon R&D by government, higher education and other (mainly business), all inconstant price $US.
• the quality of the scientists and engineers. We measured this as the numbers ofpapers per research scientist/engineer.
We estimated the following model to describe the relative citation impact (RELC) 7:
RELC = 0.43 + 3.8 HRD/POP + 1.42 GRD/POP + 0.91 ORD/POP + 0.53 PAP/RSE (7.0) (4.3) (2.1)(3.6) (4.7)
R2 = 0.60, N=145
where the figures in parentheses are White’s t statistics.
HRD is higher education R&D expenses ($US million 1985 prices);
GRD is government sector R&D expenses ($US million 1985 prices);
ORD is other (primarily business) R&D expenditure ($US million 1985 prices);
PAP is papers;
RSE is research scientists and engineers; and
POP is thousands of people.8
6 We used data from the 1994 ISI database on relative citation impacts for the years 1981 to 1993,
and then collected data for OECD countries on R&D expenditures and RSE for any of these years.For some countries, including Australia, data for all years were not available.
7 We also included time dummies in the model, which we have omitted from the presentation ofresults since they are only there to correct for a possible bias. What bias? We are trying to explainrelative citation impacts. It may therefore seem necessary to express all the independent variablesin relative terms too. For example, should we use papers per RSE, or papers per RSE relative tothe world average of papers per RSE? In fact, so long as a dummy variable is included for eachtime period, we can use the absolute measures and let the dummies act as the world averages. Wedo not include the dummies as they are really ‘nuisance’ variables intended to compensate for theform of the independent variables we are interested in.
8 The data relate to the period from 1981 to 1992. Not all data are available for all countries for all years. Thebibliometric data are from the ISI database. The population and R&D expenditure data are from the OECDwhile the RSE data are from the OECD and chapter 8.

BUREAU OF INDUSTRY ECONOMICS
AUSTRALIA’S SCIENTIFIC PUBLICATIONS AND CITATIONS OVER TIME 51
The results suggests that the impact of increasing higher education R&D spending percapita has a greater impact on relative citation rates than other government R&Dexpenditure, which in turn has a greater impact than business R&D. The modelsuggests that if a country’s people each contributed another ten dollars (in 1985 prices$US) to higher education R&D then the country’s relative citation impact would rise byabout 3.8 percentage points. Of course, this is an average result only – any givencountry might find the impact greater or lesser than this.
The model may partly explain why countries with a strong industrial orientation in theirR&D (such as Japan) tend to have less relative citation impact than those who allocatethese R&D resources to higher education. We are not asserting that either configurationis better than the other – merely that choices about where to devote R&D hasimplications for a country’s relative performance in codified scientific knowledge.
Perhaps more interestingly the model suggests that as the number of papers perresearcher rises, the greater is the relative citation impact. In Australia, there has been afall in the papers published per researcher – which in part may explain why our relativecitation impact has fallen (but of course invites the question as to why the papers perresearcher might have fallen).
We can use the model to understand how movements in resources and the‘productivity’ of researchers may have influenced Australia’s relative citation scorefrom 1981 to 1990 (table 4.6).
The model suggests9 that:
• the increase in higher education R&D expenditure led to a modest increase inAustralia’s score (by about 0.7 percentage points);
• this was more than offset by the influence of falling government R&Dexpenditures per capita;
• notwithstanding the small multiplier associated with business R&D expenditure,the massive increase in business R&D led to an increase in Australia’s relativecitation impact by around three percentage points; but
• the conspicuous fall in the number of papers published per researcher led to anearly 7 percentage point drop in Australia’s score – this appears to be thedominant factor underlying the fall in Australia’s relative citation impact. It seems
9 We emphasise the word ‘suggests’, since these are the results of a statistical model based on a
limited number of years of data and a very heterogeneous group of countries. That, combined withfears over the magnitude of errors in the data, makes us cautious about being more definitive.

AUSTRALIAN SCIENCE
BE
52
plausible than the expansion in the number of scientists and engineers in Australiaover the last decade may have lowered average quality. As a country expands itsscience system it tends to draw on less talented researchers and paper productivityand relative citation rates fall. This does not mean that the solution is to cut thenumber of researchers to raise quality. After all, if this line of logic were taken toan extreme this would suggest it is optimal to have just one brilliant scientistproducing path breaking papers. It may well be optimal to increase the number ofresearchers even if this has the effect of depressing relative citation rates so longas the additional researchers produce outputs which are valuable and do not takeaway scarce resources from their better peers.
Overall the model ‘explains’ most of the fall in Australia’s relative citation rate from1981 to 1990.
Table 4.6 What does the model imply about the change in Australia’srelative citation impact between 1981 and 1990? a
HRD/POP GRD/POP ORD/POP PAP/RSE Total1981 0.0422 0.0665 0.0388 0.4339 ..1990 0.0440 0.0549 0.0710 0.3016 ..Explained change 0.0070 -0.0165 0.0295 -0.0696 -0.0497
a HRD/POP is higher education R&D expenses per person ($US million 1985 prices); GRD/POP isgovernment sector R&D expenses per person ($US million 1985 prices); ORD/POP is other (primarilybusiness) R&D expenditure per person ($US million 1985 prices); and PAP/RSE is papers per researchscientists and engineers
4.5 Structural change in science fields over time
Structural change is important because (a) it can disrupt a system if it is too rapid, withconsequences for output and quality, (b) it can make it difficult to compareperformance over time and (c) it tells you something about the direction of a sciencesystem.
Structural change (as measured by changes in the shares of papers by field) has beenrelatively modest compared to most other countries. Australia is ranked 65 in 79countries in terms of the degree of structural change (table 4.7).
However, structural change has been appreciably greater than that experienced by manyother advanced scientific countries – with the US, UK, Canada, Denmark, Finland,France, and Switzerland all facing less change. Like many other countries, there seemsto have been a significant shift to clinical medicine in Australia.
But what of shifting revealed comparative advantages? Have the historical patterns ofadvantage been replicated in the 1990s? We find for Australia that the old advantageshave been strengthened (figure 4.11).

BUREAU OF INDUSTRY ECONOMICS
AUSTRALIA’S SCIENTIFIC PUBLICATIONS AND CITATIONS OVER TIME 53

AUSTRALIAN SCIENCE
BE
54
Table 4.7 Structural change in science, 1981-85 to 1990-94 a
Structuralchange score
World rank field with highest
relative Increase bfield with greatest
relative decrease c
Australia 7.7 65 clinmed chemCanada 5.0 78 agric physicChile 10.9 47 chem biologDenmark 6.8 70 plant clinmedFinland 7.5 67 plant clinmedFrance 7.2 68 biolog clinmedGermany 6.7 71 physic clinmedHong Kong 14.6 35 clinmed biologIndia 9.7 54 clinmed multiIndonesia 15.8 32 plant clinmedItaly 6.9 69 clinmed chemJapan 9.7 53 clinmed chemMalaysia 13.2 39 chem plantMexico 15.3 33 plant clinmedNetherlands 6.5 72 clinmed physicNew Zealand 8.5 59 clinmed agricNorway 8.3 60 plant clinmedPapua New Guinea 13.9 37 agric plantPeoples R. China 25.7 5 physic multiPhilippines 21.6 10 plant clinmedSingapore 19.4 17 engin clinmedSouth Africa 11.5 45 plant clinmedSouth Korea 8.1 63 engin chemSweden 8.2 61 plant clinmedSwitzerland 6.0 75 biolog clinmedTaiwan 20.6 15 engin plantThailand 24.1 6 plant clinmedUK 6.0 76 clinmed enginUS 4.3 79 chem psych
a The Lawrence measure of structural change (SC) was employed. This is bounded between 0 (minimum
structural change) and 100 (maximum structural change). thus SC = 50 × α jt − α jt−1j=1
K∑ where α is the
share of papers in each field. b The change in field shares (relative to the world) was calculated for eachcountry and field:
∆FSij = Pijt ( Pijtj=1k∑ ) − Pijt −1 ( Pijt−1j=1
k∑ )( )− Pijti=1N∑ ( Pijtj=1
k∑i=1N∑ ) − Pijt−1i=1
N∑ ( Pijt −1j=1k∑i=1
N∑ )( )and then the field with the biggest value of appendix C. c The field with the smallest value of
Source: ISI database.
Agricultural science, geoscience, ecology/environment and psychology/psychiatry haveall faced increasing degrees of RCA. Clinical medicine has shifted from a positionwhere it was proportionately under-represented in Australian science to one where itnow matches the situation globally. In contrast, astronomy, maths and chemistry havedeclined in relative importance.

BUREAU OF INDUSTRY ECONOMICS
AUSTRALIA’S SCIENTIFIC PUBLICATIONS AND CITATIONS OVER TIME 55
Figure 4.11 Changes in revealed comparative advantage in Australia, 1981-85 to 1990-94 a
0.00
0.50
1.00
1.50
2.00physic
mater
chem
comput
engin
pharm
multi
biolog
maths
neuroclinmed
molec
astron
microb
immune
psych
ecology
geosci
plant
agric
81-8590-94
a The graph shows the revealed comparative advantage index discussed in chapter 2 for each field for 1981-85 and 1990-94.
Source: ISI database.
We have already noted that differences between countries in the structure of sciencecan bias relative measures of performance. Differences over time can also have thiseffect. Accordingly we measured Australia’s relative citation impact using a fixed set ofweights (table 4.8). This has very little effect on our story – with Australian relativecitation rates still declining steadily. It is true, however, that structural change hasslightly exaggerated the real extent of the decline.
In chapter 2 we looked at a static picture of the consistency in quality across fields andthe degree of specialisation. But are there any trends in performance over time? Weneed to be careful interpreting such trends. Over time a country may show a greaterdegree of variation in quality across fields simply because one or two fields improvedin quality, while the rest remained at their older levels of quality. Similarly, a countrymay show a lower degree of variation in quality across fields if one or two ‘star’ fieldsfade in quality. Accordingly we look at the change in relative quality as well as changesin the evenness of quality.

AUSTRALIAN SCIENCE
BE
56
Table 4.8 The effect of structural change in Australian science on relativecitation impact a
Variable weightRCI
Fixed weightFWRCI
Variable weightindex form
1981-85=100
Fixed weightindex form
1981-85=10081-85 0.957 0.957 100.0 100.082-86 0.958 0.958 100.1 100.183-87 0.962 0.963 100.5 100.684-88 0.961 0.962 100.5 100.685-89 0.972 0.972 101.5 101.586-90 0.969 0.971 101.2 101.587-91 0.949 0.952 99.1 99.588-92 0.940 0.943 98.2 98.589-93 0.896 0.902 93.7 94.390-94 0.867 0.878 90.5 91.7
a The relative citation impact (RCI) and fixed weight relative citation impact (FWRCI) are defined as followswhere C and P are citations and papers respectively:
RCIt =CAUST, t, jj=1
K∑
PAUST, t, jj=1K∑
CWORLD,t , jj=1K∑
PWORLD, t , jj=1K∑
FWRCIt = (PAUST,81−85, j
( PAUST,81−85, j )j=1K∑
×CAUST,t , j
PAUST, t , jj =1
K∑ ) (
PWORLD,81−85, j
( PWORLD,81−85, j )j=1K∑j=1
K∑ ×
CWORLD,t , j
PWORLD,t , j
Source: ISI database.
In Australia, as in all of the developed scientific countries, the changes are very slight(table 4.9). There has been a very small increase in specialisation and a tiny reductionin the amount of variation in quality across fields. The big changes are most apparentfor the developing economies – with dramatically increasing consistency for Mexico,China, South Korea and Taiwan (though in the latter two cases this has been associatedwith a fall in overall quality). Surprisingly, most of the developing countries (exceptChina and Indonesia) have tended to specialise more rather than less as their sciencesystems have evolved. It does not appear that Australia’s position as one of the mostwell rounded scientific societies in the APEC region will be challenged quickly.
4.6 Basic scientific proclivity over time
In chapter 2 we looked at a static picture of the scientific proclivity of Australiarelative to other countries. Here we present a brief dynamic picture (table 4.10).

BUREAU OF INDUSTRY ECONOMICS
AUSTRALIA’S SCIENTIFIC PUBLICATIONS AND CITATIONS OVER TIME 57
Table 4.9 Changes in the consistency and specialisation of science, 1981-85to 1990-94 a
Unevenness Specialisation Change in relativequality
Australia -0.002 0.039 -0.099Canada -0.004 0.009 0.019Chile -0.026 0.480 -0.107Denmark 0.009 -0.024 -0.089Finland 0.002 -0.060 0.053France -0.025 -0.056 0.061Germany -0.009 -0.037 0.081Hong Kong 0.000 -0.023 -0.043India -0.023 -0.007 -0.027Indonesia -0.167 -0.117 0.044Italy -0.014 -0.033 0.051Japan 0.038 -0.033 -0.007Malaysia 0.396 0.060 -0.005Mexico -0.470 0.148 -0.226Netherlands -0.023 -0.053 0.004New Zealand -0.015 -0.010 0.137Norway 0.086 0.025 -0.071Papua New Guinea 3.266 0.199 0.505Peoples R. China -0.703 -1.485 0.381Philippines 0.568 0.736 0.216Singapore -0.009 0.557 0.387South Africa 0.048 0.349 -0.023South Korea -0.223 0.016 -0.200Sweden 0.003 -0.093 -0.078Switzerland -0.008 -0.041 -0.025Taiwan -0.431 0.327 -0.098Thailand -0.283 0.269 0.371UK -0.004 0.004 -0.009US -0.085 -0.020 0.009
a Specialisation and unevenness of quality (consistency) by field are defined in chapter 2. Here we simplytake the numerical difference between these measures for two periods: 1981-1985 and 1990-94. The changein relative quality is measured as:
∆IMPi = log Ci, j ,90−95j=1
K∑ / Pi, j ,90−95
j =1
K∑
Ci, j ,90−95
j=1
K∑
i=1
N∑ /
j=1
K∑ Pi, j , 90−95
i=1
N∑
− log Ci, j ,81−85j=1
K∑ / Pi, j, 81−85
j=1
K∑
Ci, j ,81−85
j=1
K∑
i=1
N∑ /
j=1
K∑ Pi, j ,81−85
i=1
N∑
.

AUSTRALIAN SCIENCE
BE
58
Table 4.10 Papers per population and GDP over timePapers
per1000
people
1981
Indexof
papersper
person
1981
Trend1981
to1993
Papersper
$billionUS
1981
Indexof
papersper
GDP
1981
Trend1981
to1993
Papersper
1000people
1993
Indexof
papersper
person
1993
Papersper
$billionUS
1993
Index ofpapers
perGDP
1993
Australia 0.704 100.0 0.017 47.8 100.0 0.029 0.854 100.0 67.1 100.0Austria 0.365 51.8 0.036 34.5 72.1 0.007 0.540 63.2 36.9 54.9Belgium 0.433 61.5 0.036 36.8 76.9 0.010 0.661 77.4 43.7 65.1Canada 0.800 113.7 0.028 52.1 108.9 0.018 1.075 125.9 67.6 100.7Denmark 0.751 106.7 0.030 60.7 126.9 0.015 1.074 125.7 70.6 105.2Finland 0.548 77.8 0.040 43.3 90.7 0.053 0.964 112.9 95.2 141.9France 0.428 60.9 0.034 30.7 64.2 0.026 0.621 72.7 43.4 64.7Germany 0.554 78.7 0.005 48.4 101.2 -0.023 0.569 66.6 37.1 55.3Greece 0.100 14.2 0.080 9.5 19.8 0.195 0.247 28.9 102.1 152.2Iceland 0.190 27.1 0.100 4.0 8.4 0.275 0.740 86.7 159.6 237.9Ireland 0.387 55.1 0.039 45.6 95.5 0.004 0.631 73.8 51.8 77.2Italy 0.171 24.3 0.064 11.9 25.0 0.084 0.362 42.4 35.7 53.2Japan 0.231 32.9 0.052 23.7 49.6 -0.004 0.416 48.7 22.9 34.2Mexico 0.013 1.8 0.051 na na na 0.024 2.8 na naNetherlands 0.510 72.4 0.055 47.0 98.3 0.014 0.962 112.7 57.1 85.1New Zealand 0.696 98.9 0.016 51.6 108.0 0.051 0.832 97.4 84.8 126.4Norway 0.563 80.0 0.028 38.6 80.7 0.044 0.817 95.7 64.1 95.5Portugal 0.024 3.4 0.138 2.5 5.1 0.209 0.121 14.2 31.8 47.4Spain 0.092 13.0 0.104 9.7 20.3 0.113 0.329 38.5 42.7 63.7Sweden 0.833 118.3 0.033 57.9 121.1 0.059 1.297 151.9 132.1 196.8Switzerland 0.960 136.4 0.034 67.3 140.9 0.015 1.471 172.2 87.7 130.7Turkey 0.007 1.0 0.120 0.7 1.4 0.442 0.027 3.2 103.5 154.2UK 0.678 96.3 0.024 62.9 131.6 0.022 0.912 106.7 84.8 126.3US 0.750 106.5 0.017 47.9 100.2 -0.001 0.886 103.8 47.4 70.6India 0.020 2.8 -0.012 21.6 45.2 -0.001 0.016 1.9 20.0 29.8Singapore 0.081 11.6 0.136 10.5 21.9 0.072 0.452 53.0 25.8 38.5South Korea 0.006 0.9 0.202 2.2 4.6 0.111 0.068 8.0 8.2 12.2Taiwan 0.029 4.2 0.182 6.5 13.5 0.105 0.225 26.4 21.1 31.5Malaysia 0.016 2.3 0.025 0.0 0.1 0.368 0.023 2.7 3.2 4.8Indonesia 0.001 0.1 0.053 0.3 0.6 0.080 0.001 0.1 0.8 1.2PR China 0.001 0.2 0.135 1.1 2.4 0.055 0.007 0.9 1.9 2.8
Sources: The bibliometric data are from the ISI database. The remaining data are from the OECD.
Scientific papers per person in Australia have increased at a trend rate of around 1.7 percent per annum from 1981 to 1993. This places Australia in 27th ranking among the 31countries in table 4.10 – but in line with the moderate rates of growth achieved by otherscientifically advanced countries like the US, Germany and the UK. Countries withfastest growing scientific proclivities are, not surprisingly, those with a less developedbase – such as South Korea (20 per cent per annum), Taiwan (18.2 per cent) and China(13.5 per cent per annum).
But if we turn to papers published for each dollar of real GDP a different pictureemerges. The growth in scientific papers in Australia has outstripped real GDP growth
BUREAU OF INDUSTRY ECONOMICS
AUSTRALIA’S SCIENTIFIC PUBLICATIONS AND CITATIONS OVER TIME 59
– with papers per GDP increasing at a trend rate of nearly 3 per cent per annum.10 Thisis much higher than for most other scientifically advanced countries. Given our income,Australians are making an increasingly greater contribution to science.
While the overall picture is of increasing scientific proclivity in Australia, actual papersper research scientist and engineer have fallen (figure 4.12). This is not an anomalousresult as most other scientifically advanced countries have also shown a decrease –although the decline is particularly pronounced in Australia. The decline may reflect:
• lower publication rates for the large group of new academics who have joined thesystem over the period; and/or
• a shift from papers to other scientific and technological outputs. In this context itshould be emphasised that an increasing proportion of Australia’s engineers andscientists are engaged in research in industry – where papers are less frequently anoutput.
It is notable that the industrialised Asian countries show generally increasing paperproductivity - a shift which we think represents both a movement of scientific resourcestowards basic research and the increasing quality of those resources. The otherconspicuous feature of figure 4.11 is that notwithstanding the sharp decline in paperproductivity in Australia, it still remains high by comparison with countries like the US,Japan, and the newly industrialising countries. 11
10 Note that the GDP measure is in real PPP $US, not in real Australian dollars. We use PPP adjusted GDP
figures because we are trying to measure the income of different countries over time on a comparable basis.But PPP measures can have large errors. We also looked at the trend rate of growth in Australian papersper dollar of GDP (in real Australian dollars) and this was close to zero. The PPP results may still be right,but it is important to understand that it is the influence of the PPP index which drives this result.
11 Though we emphasise that paper productivity is only a partial measure. It is clear that much of thescientific human capital in Japan and the NICs is not devoted to the sort of research which produces papersin scientific journals.

AUSTRALIAN SCIENCE
BE
60
Figure 4.12 Index of ISI papers per research scientist and engineer (Australia1981 figures =100.0), 1981 to 1992
0.400
0.500
0.600
0.700
0.800
0.900
1.000
1.100
1.200
1.300
1.400
1981
1982
1983
1984
1985
1986
1987
1988
1989
1990
1991
1992
SwedenAustralia
UK
USNorway
France
Denmark
0.000
0.100
0.200
0.300
0.400
0.500
0.600
0.700
0.800
0.900
1.000
1981
1982
1983
1984
1985
1986
1987
1988
1989
1990
1991
1992
S. Korea
Taiwan
Australia
Singapore
Japan
Most advanced western countries exhibit declining paper productivity
But industrialised Asian countries exhibit increasing paper productivity
Source: Data for research scientists and engineers from BIE (1996) and publications data from the ISIdatabase.

BUREAU OF INDUSTRY ECONOMICS
THE USE AND ABUSE OF BIBLIOMETRICS 61
Appendix A The use and abuse ofbibliometrics
The use of bibliometrics – the statistical analysis of published research papers – has a longheritage as a performance indicator. The National Science Foundation has used such indicatorssince the 1970s. These indicators have gained, a sometimes grudging, acceptance as one of asuite of tools for looking at basic research. As noted in chapter one and two, such indicatorshave limitations:
• These particularly stem from the bias of the major index (the ISI) towards Romanscripts (Carpenter and Nairn 1981) and English language journals (Walley,1986).1 There is an additional bias towards early citation of English papers. Thusthe latest year of the ISI database point to an increase in Australia’s relativecitation performance – but this evaporates when the ISI releases revised data ayear later (figure A1.1).
• High search costs imply that there will be 'hysteresis' in citations – the renownedreceive continued citations, while quality papers by less known authors may takelonger to be discovered.
• Technical papers and recipes can be cited thousands of times, though theyembody little frontier science. On the other hand, since these are clearly of wideapplication and usefulness to practising scientists, why should their value not berepresented in citation indexes?
• It is sometimes argued that scientists in the US take a very insular view of thediscipline and tend to give publications by their own nationals first preference.For example, Wood (1989) argues that the top US journals are reluctant topublish the results of research based on Australian material because of its
1 For example, NBEET (1993) found a significant difference between Australia’s share of
world chemistry publications using the Chemical Abstracts Service (CAS), a wide rangingabstract service, and the Science Citation Index (SCI). Australia accounts for 1 per centof world chemistry literature using CAS and 1.6 per cent using the SCI. NBEET interpretthe difference as a bias due to language and script – but of course, other factors, such asdifferences in the classification of research, might also account for some of the differences.As well, it is possible that the SCI is more discriminating in its choice of journal set – asmaller journal set is not necessarily a worse one for making performance comparisons.
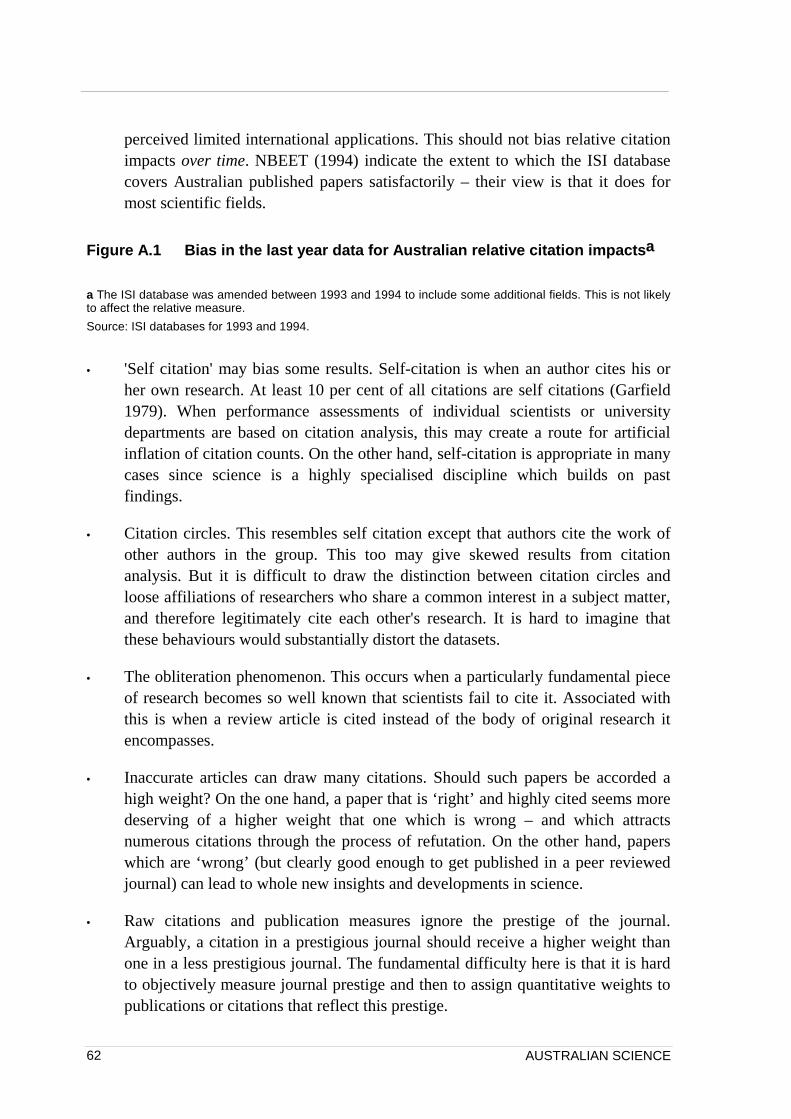
AUSTRALIAN SCIENCE62
perceived limited international applications. This should not bias relative citationimpacts over time. NBEET (1994) indicate the extent to which the ISI databasecovers Australian published papers satisfactorily – their view is that it does formost scientific fields.
Figure A.1 Bias in the last year data for Australian relative citation impactsa
a The ISI database was amended between 1993 and 1994 to include some additional fields. This is not likelyto affect the relative measure.
Source: ISI databases for 1993 and 1994.
• 'Self citation' may bias some results. Self-citation is when an author cites his orher own research. At least 10 per cent of all citations are self citations (Garfield1979). When performance assessments of individual scientists or universitydepartments are based on citation analysis, this may create a route for artificialinflation of citation counts. On the other hand, self-citation is appropriate in manycases since science is a highly specialised discipline which builds on pastfindings.
• Citation circles. This resembles self citation except that authors cite the work ofother authors in the group. This too may give skewed results from citationanalysis. But it is difficult to draw the distinction between citation circles andloose affiliations of researchers who share a common interest in a subject matter,and therefore legitimately cite each other's research. It is hard to imagine thatthese behaviours would substantially distort the datasets.
• The obliteration phenomenon. This occurs when a particularly fundamental pieceof research becomes so well known that scientists fail to cite it. Associated withthis is when a review article is cited instead of the body of original research itencompasses.
• Inaccurate articles can draw many citations. Should such papers be accorded ahigh weight? On the one hand, a paper that is ‘right’ and highly cited seems moredeserving of a higher weight that one which is wrong – and which attractsnumerous citations through the process of refutation. On the other hand, paperswhich are ‘wrong’ (but clearly good enough to get published in a peer reviewedjournal) can lead to whole new insights and developments in science.
• Raw citations and publication measures ignore the prestige of the journal.Arguably, a citation in a prestigious journal should receive a higher weight thanone in a less prestigious journal. The fundamental difficulty here is that it is hardto objectively measure journal prestige and then to assign quantitative weights topublications or citations that reflect this prestige.

BUREAU OF INDUSTRY ECONOMICS
THE USE AND ABUSE OF BIBLIOMETRICS 63
• Errors in interpretation can arise if analysts of bibliometrics do not acknowledgevariations among disciplines.
• There are several ways of counting authors of collaborative articles. For instance,Martin (1994) differentiates among three methods of counting citations of suchmulti-author articles – first author, all authors, or fractionated counts (when eachauthor receives a count equal to the article divided by the number of authors).Under ‘all author’ counts a single paper may be counted as an entry many timesfor many countries (as used in this report). The data from Bourke and Butler(1994) suggest different counting methods have little impact. Similarly, for theUK, Martin finds that most methodologies still produce the same qualitativeresults.
• Double counting can occur in other ways. For example, a paper may be allocatedto more than one field – so that totals of papers across fields exceed the real total.There are a variety of means of dealing with this – in this report we use theincorrectly inflated total – so that field shares add to unity. Otherwise it is hard tointerpret shares at all.
• Editorial practices may affect citation rates, for example, a page limitation on theamount of references allowed.
• The journal set used in the analysis can expand over time. This can give thespurious impression of growing publication counts. This affects the analysisconducted in the main text of this report since the ISI database used is not basedon a fixed journal set. We checked the degree to which this mattered for the lastfew years. We compared results of the 1993 ISI dataset with those of the 1994dataset for a common year, 1993. With a fixed journal set the number ofpublications should stay fixed for 1993, regardless of when the data are collected.We find that (for a fixed group of fields between the two datasets2) journalinflation has a small impact on Australian publications counts. The ISI 1994dataset suggests growth in Australian scientific publications (excludingpsychology) of 3.5 per cent in 1993 and 7.8 per cent in 1994. The differencebetween the 1994 and the 1993 database counts of publications for 1993 is only1.1 per cent. So most of the growth recorded in publications appears to begenuine, rather than a product of a varying journal set. As well, journal inflationshould not generally matter when relative comparisons are being made – butreaders should note possible problems when they look at the material on changesin paper productivity in chapter 4. Martin et al (1990) finds that the UK
2 The ISI not only expanded the journal set in 1994 – but also introduced some field changes, including the
addition of psychology/psychiatry and some social sciences. We have excluded social sciences from any ofthe analysis reported in this report – but do include psychology/psychiatry. For the purpose of thiscomparison, this field had to be removed.

AUSTRALIAN SCIENCE64
publication share data do not appear grossly affected by a dynamic rather than aconstant journal set. It is possible, though, that measurement of Australia’srelative performance over the 1980s might have been adversely affected by thegreater introduction into the ISI database of non-English journals. This wouldcorrect a past bias against foreign language journals. In this case, Australia’srelative citation performance in the past would have been biased up, while morerecent measures would have been less biased – leading to a potentially spuriousdrop in relative performance over time. As noted in the main text, it is worthfinding out if there has been a change in the nature of new journals introduced tothe ISI database.
• Lowly or zero cited papers may be ‘ahead of the times’ rather than low quality.
• All sorts of modes of communication of significant research – from workingpapers, physical prototypes of scientific equipment, computer programs, andseminar papers are not counted as publications in the main publication indexes.
• There are many other outputs of scientists – such as teaching, advice togovernment, non-published research for commercial purposes, scientific services(such as meteorological services) which are not counted as outputs usingbibliometrics. Bibliometric measures are necessarily partial.
• Time lag errors. Citation counts take time to accumulate. This can lead to biases(see appendix 4 for more details).
• Publication counts can multiply as authors put slight elaborations of the samematerial into many journals or break up a substantial article into several moreminor ones.
• Citation rates certainly measure visibility – but do they measure quality as well?The view taken in this report is that while we can imagine circumstances wherecitation rates measure only visibility, that on average they do correlate withquality too. We view a high relative citation impact as an indicator of the qualityof that body of knowledge. Of course, small changes in relative citation impactsover a few years may not reflect quality changes – but either statistical ‘noise’ orchanges in visibility not correlated with quality.
Nevertheless, despite this litany of difficulties, there is probably no better data source forobjective measurement of basic scientific performance between countries.

AUSTRALIAN SCIENCE
BE
66
Appendix B Formulas
We list the major formulas used in manipulating the ISI database here.
1 CPij is the number of papers in the ith country and jth field which are cited at least once.
2 Cij is the number of citations in the ith country and jth field.
3 Pij is the number of papers in the ith country and jth field.
4 Share cited is the ratio of papers which are cited at least once (CP) to total papers (P) or
Share citedi = CPijj =1k∑ / Pijj =1
k∑( ) where there are k fields.
5 Citation impact is the number of citations (C) per paper: Citation impacti = Cijj =1
k∑ / Pijj =1k∑( )
where there are k fields
6 Relative citation impact (IMP) is the ratio of the share of world citations to the share of worldpublications. It can be calculated for a whole country or for just one field of one country. Forexample, IMP for a whole country is defined as:
IMPi = Cijj=1k∑ / Cijj =1
k∑i=1N∑( ) Pijj =1
k∑ / Pijj =1k∑i=1
N∑( )or
Cijj =1k∑ / Pijj =1
k∑( ) Cijj =1k∑i=1
N∑ / Pijj=1k∑i =1
N∑( )where there are N countries and k fields.
7 Relative cited (REL) is the ratio of the share of world papers which are cited at least once to theworld share of publications. It can be formed for a whole country or a particular field. For a wholecountry, the measure is:
RELi = CPijj =1k∑ / Pijj=1
k∑( ) CPijj=1k∑i=1
N∑ / Pijj=1k∑i=1
N∑( )where there are N countries and kfields.
8 Share of Australian papers in the jth field isAPSHAUST, j = PAUST, j PAUST, jj=1
k∑( )where there arek fields.
9 Share of Australian citations in a given field: CSHAUST, j = CAUST, j CAUST, jj=1
k∑( ).
10 The world publication share in the ith country and jth field is PSHij = Pij Piji =1
N∑( ).
11 The world citation share in the ith country and jth field is CSHij = Cij Ciji=1
N∑.
12 The measure of comparative advantage we are using here is:

BUREAU OF INDUSTRY ECONOMICS
FORMULAS 67
RCAi, j = (Pi, j / Pi, ji=1N∑ ) Pi, j / Pi, jj=1
k∑j=1N∑j=1
k∑( )= (Pi, j / Pi, jj=1k∑ ) Pi, j / Pi, jj=1
k∑j=1N∑i=1
N∑( )13 The score of the intensity of collaboration by discipline is:
SCOREij = COLLij COLLij j =1k∑ ( COLLiji =1
N∑ COLLij )i=1N∑j =1
k∑ where COLLij is the numberof collaborative papers by country i with Australia in field j.
14 The strength of collaborative links are LINKiq = (COLLiq / COLLi ) / COLLq / TCOLL whereCOLLiq is the number of collaborative papers of country i with country q, COLLi is the number ofcollaborative papers of country i with all other countries in the region and TCOLL is the totalnumber of collaborative papers in the region.
15 The change in field shares (relative to the world) was calculated for each country and field:
∆FSij = Pijt ( Pijtj =1k∑ ) − Pijt −1 ( Pijt −1j =1
k∑ )( )− Pijti=1
N∑ ( Pijtj =1k∑i =1
N∑ ) − Pijt −1i =1N∑ ( Pijt −1j =1
k∑i =1N∑ )( )
and then the field with the biggest value of
16 The relative citation impact (RCI) and fixed weight relative citation impact (FWRCI) are defined asfollows where C and P are citations and papers respectively:
RCIt =CAUST, t, jj=1
K∑
PAUST, t, jj=1K∑
CWORLD,t , jj=1K∑
PWORLD, t , jj=1K∑
FWRCIt = (PAUST,81−85, j
( PAUST,81−85, j )j=1K∑
×CAUST,t , j
PAUST, t , jj =1
K∑ ) (
PWORLD,81−85, j
( PWORLD,81−85, j )j=1K∑j=1
K∑ ×
CWORLD,t , j
PWORLD,t , j
17 The change in relative quality is measured as:
∆IMPi = log Ci , j, 90− 95j =1
K
∑ / Pi, j,90 − 95j =1
K
∑
Ci, j ,90 −95
j =1
K
∑i =1
N
∑ /j =1
K
∑ Pi, j ,90 −95i =1
N
∑
− log Ci , j,81−85j=1
K
∑ / Pi, j,81−85j =1
K
∑
Ci, j ,81−85
j =1
K
∑i =1
N
∑ /j =1
K
∑ Pi, j ,81−85i =1
N
∑

AUSTRALIAN SCIENCE
BE
68
Appendix C Bibliometric statistics
The data were obtained by manipulating the ISI database for 1994. Some journalarticles are written by authors from different countries. Each of these is recorded as anarticle attributed to a country. Thus the total number of papers exceeds the real worldtotal – but we use the inflated total so that any shares add to one. We did not use thefull set of ISI fields in computing the above statistics, but compiled data for 20scientific fields (table C.1). The following fields were excluded: Economics andbusiness, Education, and Social Sciences. Accordingly, the data recorded here and inthe main text will not match ISI totals.
Table C.1 Fields in the databaseField description Field mnemonicAgricultural Sciences agricAstrophysics astronBiology & Biochemistry biologChemistry chemClinical Medicine clinmedComputer Science computEcology and the environment ecologyEngineering enginGeosciences geosciImmunology immuneMaterials Science materMathematics mathsMicrobiology microbMolecular biology & Genetics molecMultidisciplinary multiNeuroscience neuroPharmacology pharmPhysics physicPlant & Animal Science plantPsychology/psychiatry psychAll fields all

BUREAU OF INDUSTRY ECONOMICS
BIBLIOMETRIC STATISTICS 69
Table C.2 Share of world papersa by field, 1981-1994 (selected countries)b
agric astron biolog chem clinmed comput ecology engin geosci immuneAustralia 3.93 2.53 2.04 1.53 2.01 1.53 3.62 1.57 3.88 2.95Canada 4.37 4.08 4.48 3.39 3.90 5.46 7.43 4.62 8.23 3.68Chile 0.26 1.16 0.17 0.16 0.22 0.08 0.26 0.04 0.11 0.06Denmark 0.53 0.61 1.13 0.47 1.43 0.44 0.86 0.39 0.54 1.05Finland 0.75 0.51 0.79 0.37 1.10 0.66 0.83 0.41 0.33 0.89France 3.61 5.23 5.20 5.32 5.58 3.72 2.89 3.55 5.92 5.74Germany 7.39 7.78 5.55 8.96 7.26 6.28 4.97 6.88 4.81 5.33Hong Kong 0.03 0.06 0.13 0.12 0.26 0.30 0.17 0.26 0.05 0.11India 6.56 2.35 1.71 4.13 0.55 1.47 3.34 3.00 2.54 0.53Indonesia 0.09 0.04 0.02 0.01 0.02 0.00 0.08 0.02 0.08 0.03Italy 1.69 4.49 3.14 3.14 2.99 3.31 1.49 2.27 1.66 2.89Japan 10.00 3.34 9.01 10.22 4.23 5.44 3.18 8.46 3.02 7.08Malaysia 0.17 0.01 0.05 0.06 0.05 0.02 0.12 0.04 0.04 0.03Mexico 0.47 0.68 0.19 0.18 0.24 0.06 0.37 0.15 0.25 0.15Netherlands 1.50 2.71 2.32 1.67 2.03 1.95 2.27 1.54 1.47 3.26New Zealand 1.52 0.25 0.40 0.26 0.45 0.22 0.92 0.23 0.97 0.19Norway 0.38 0.29 0.62 0.34 0.70 0.32 0.89 0.32 1.08 0.87PNG 0.04 0.00 0.02 0.00 0.04 0.00 0.03 0.01 0.03 0.03P.R. China 0.38 0.78 0.27 1.21 0.36 0.76 0.50 1.52 1.41 0.17Philippines 0.28 0.00 0.03 0.00 0.03 0.00 0.15 0.01 0.03 0.04Singapore 0.05 0.01 0.08 0.10 0.11 0.45 0.12 0.38 0.04 0.06S. Africa 0.36 0.74 0.34 0.36 0.72 0.25 1.02 0.29 0.92 0.24S. Korea 0.14 0.12 0.13 0.48 0.09 0.51 0.11 0.55 0.09 0.07Sweden 0.97 0.94 2.31 1.11 2.55 1.11 2.33 0.93 1.01 2.92Switzerland 0.66 0.87 1.41 1.31 1.70 1.05 0.83 1.11 1.08 2.44Taiwan 0.45 0.06 0.23 0.50 0.25 1.20 0.25 1.09 0.13 0.17Thailand 0.19 0.00 0.07 0.03 0.15 0.04 0.18 0.09 0.04 0.17UK 6.14 8.55 8.32 6.53 10.10 8.61 6.93 8.55 8.50 9.13US 30.76 36.54 37.62 22.79 39.25 45.25 43.19 38.37 35.95 41.75Africa & M.East 3.58 1.11 2.07 2.05 2.31 2.37 3.09 2.43 1.93 2.07C&S America 3.28 1.71 1.51 0.90 0.65 0.45 1.24 0.62 0.85 0.90Rest of world 9.46 12.43 8.67 22.31 8.66 6.69 6.35 10.31 13.00 5.01APEC 53.13 49.67 54.93 41.05 51.68 61.34 60.67 57.41 54.35 56.73TOTAL 100.0 100.0 100.0 100.0 100.0 100.0 100.0 100.0 100.0 100.0
Continued overleaf

AUSTRALIAN SCIENCE
BE
70
Table C.2 continuedmater maths microb molec multi neuro pharm physic plant psych all
Australia 1.42 2.24 2.59 2.25 1.73 2.05 1.85 1.15 4.03 2.98 2.14Canada 3.80 5.30 4.33 4.24 1.90 6.24 4.10 2.81 7.35 7.77 4.47Chile 0.07 0.18 0.12 0.10 0.08 0.12 0.16 0.08 0.24 0.05 0.16Denmark 0.25 0.61 1.34 0.87 0.27 0.98 0.96 0.66 0.74 0.38 0.84Finland 0.61 0.49 0.82 0.80 0.20 0.89 0.87 0.42 0.61 0.40 0.67France 4.38 7.49 4.95 6.42 9.91 4.77 4.78 6.31 4.17 1.22 5.15Germany 9.09 7.90 7.75 7.26 3.23 5.14 7.42 8.43 6.62 4.08 7.04Hong Kong 0.10 0.19 0.10 0.18 0.08 0.12 0.18 0.10 0.07 0.25 0.15India 4.17 2.38 1.84 0.75 7.33 0.36 1.59 2.98 4.27 0.38 2.43Indonesia 0.01 0.01 0.04 0.01 0.04 0.00 0.02 0.01 0.08 0.01 0.03Italy 1.45 2.93 2.15 2.85 0.94 3.27 4.78 3.17 1.32 0.86 2.72Japan 12.15 4.60 7.10 6.32 1.57 5.89 13.32 9.40 5.41 1.33 7.27Malaysia 0.05 0.04 0.06 0.03 0.05 0.01 0.05 0.02 0.14 0.02 0.05Mexico 0.21 0.25 0.31 0.23 0.15 0.32 0.23 0.33 0.37 0.21 0.25Netherlands 1.04 1.62 2.78 2.58 0.85 2.09 2.41 1.64 2.22 1.82 1.95New Zealand 0.20 0.37 0.50 0.34 0.70 0.39 0.49 0.14 1.07 0.64 0.45Norway 0.24 0.40 0.73 0.43 0.16 0.56 0.52 0.25 0.72 0.46 0.52PNG 0.00 0.01 0.02 0.01 0.02 0.00 0.01 0.00 0.04 0.01 0.02P.R. China 1.73 1.57 0.29 0.27 6.73 0.23 0.94 2.11 0.57 0.11 0.94Philippines 0.01 0.01 0.04 0.03 0.12 0.01 0.02 0.01 0.17 0.02 0.04Singapore 0.14 0.19 0.08 0.08 0.03 0.05 0.13 0.09 0.07 0.06 0.11S. Africa 0.37 0.37 0.48 0.22 1.24 0.12 0.26 0.24 1.54 0.27 0.51S. Korea 0.75 0.24 0.22 0.07 0.03 0.05 0.16 0.49 0.08 0.04 0.25Sweden 1.40 0.76 2.41 1.84 0.53 2.70 2.39 1.06 1.26 1.11 1.70Switzerland 0.89 0.91 1.51 1.88 1.23 1.51 1.57 1.99 0.97 0.62 1.41Taiwan 1.00 0.44 0.28 0.17 0.10 0.21 0.43 0.57 0.32 0.10 0.40Thailand 0.02 0.01 0.16 0.05 0.26 0.02 0.11 0.01 0.11 0.02 0.08UK 6.46 6.30 9.77 8.93 6.80 9.04 8.46 5.57 7.72 8.14 7.97US 28.68 36.64 33.06 39.48 17.18 44.62 30.95 27.12 33.66 60.41 34.64Africa & M.East 1.80 3.14 2.02 1.43 2.00 1.42 1.87 1.73 3.08 1.89 2.17C&S America 0.64 1.14 1.36 1.15 1.15 0.78 0.85 1.31 1.39 0.31 1.07Rest of world 16.87 11.28 10.80 8.72 33.41 6.06 8.11 19.80 9.58 4.03 12.36APEC 50.35 52.29 49.30 53.87 30.76 60.33 53.16 44.44 53.79 74.02 51.47TOTAL 100.0 100.0 100.0 100.0 100.0 100.0 100.0 100.0 100.0 100.0 100.0
a Some papers are written jointly by authors from more than one country. Such papers are counted in each ofthe countries of the authors. In order that percentages add to one hundred we define the world total of papersas the sum of papers across all countries, even though this involves some double counting. b The measurehere is the world share of papers for each country in each field (formula 10 in appendix B)
Source: ISI database.

BUREAU OF INDUSTRY ECONOMICS
BIBLIOMETRIC STATISTICS 71
Table C.3 Share of world citations by field, 1981-1994 (selected countries)a
agric astron biolog chem clinmed comput ecology engin geosci immune
Australia 4.80 2.70 1.83 1.89 1.95 1.28 4.07 1.82 4.51 2.54
Canada 5.96 4.01 4.20 4.39 4.39 5.91 7.74 4.55 7.10 3.04
Chile 0.24 1.32 0.07 0.09 0.07 0.03 0.13 0.02 0.07 0.04
Denmark 0.73 0.54 1.07 0.58 1.52 0.46 0.83 0.62 0.52 0.80
Finland 0.57 0.29 0.64 0.26 1.06 0.58 0.89 0.36 0.21 0.64
France 3.85 4.75 4.19 5.60 3.02 3.22 1.89 3.54 6.07 4.71
Germany 5.00 7.53 5.32 9.36 3.56 4.23 3.55 5.72 4.21 4.16
Hong Kong 0.02 0.03 0.06 0.10 0.15 0.14 0.06 0.13 0.02 0.04
India 2.07 0.62 0.38 1.67 0.19 0.73 1.11 1.30 0.73 0.18
Indonesia 0.05 0.02 0.01 0.00 0.02 0.00 0.03 0.01 0.05 0.02
Italy 1.24 3.28 1.90 2.94 2.17 2.06 0.96 1.94 1.04 1.82
Japan 10.74 2.52 6.79 9.61 2.99 3.13 1.95 7.54 2.28 4.50
Malaysia 0.13 0.00 0.01 0.03 0.02 0.01 0.06 0.02 0.01 0.01
Mexico 0.31 0.39 0.09 0.11 0.12 0.06 0.19 0.10 0.16 0.09
Netherlands 1.98 3.34 2.15 2.17 2.10 2.00 2.47 1.69 1.26 2.86
New Zealand 1.64 0.14 0.29 0.26 0.45 0.14 0.93 0.21 0.76 0.11
Norway 0.47 0.19 0.48 0.32 0.64 0.30 1.14 0.35 0.88 0.70
PNG 0.03 0.00 0.01 0.00 0.02 0.00 0.01 0.00 0.02 0.03
P.R. China 0.24 0.24 0.10 0.39 0.14 0.38 0.23 0.71 0.58 0.07
Philippines 0.27 0.00 0.02 0.00 0.02 0.00 0.10 0.01 0.01 0.03
Singapore 0.03 0.00 0.03 0.05 0.04 0.18 0.04 0.13 0.01 0.01
S. Africa 0.39 0.65 0.19 0.27 0.40 0.13 0.72 0.19 0.65 0.13
S. Korea 0.08 0.03 0.04 0.19 0.04 0.18 0.04 0.23 0.04 0.02
Sweden 1.88 0.94 2.54 1.44 2.77 0.86 3.27 1.26 0.83 2.59
Switzerland 0.79 1.17 1.91 2.00 1.39 1.24 0.93 1.35 1.21 3.29
Taiwan 0.22 0.02 0.09 0.22 0.14 0.44 0.12 0.55 0.06 0.05
Thailand 0.12 0.00 0.03 0.01 0.09 0.01 0.07 0.04 0.01 0.11
UK 9.58 9.68 8.77 7.94 11.12 5.92 7.22 8.37 9.61 8.79
US 38.53 49.21 51.37 37.12 54.79 59.70 53.70 50.29 51.46 53.54
Africa & M.East 2.27 0.71 1.26 1.48 1.20 2.54 1.83 1.68 1.09 1.45
C&S America 1.30 0.84 0.44 0.49 0.40 0.28 0.76 0.44 0.54 0.47
Rest of world 4.45 4.84 3.70 9.02 3.02 3.84 2.96 4.83 3.99 3.16
APEC 63.41 60.63 65.05 54.47 65.44 71.59 69.46 66.36 67.15 64.25
TOTAL 100.0 100.0 100.0 100.0 100.0 100.0 100.0 100.0 100.0 100.0
Continued overleaf

AUSTRALIAN SCIENCE
BE
72
Table C.3 continued
mater maths microb molec multi neuro pharm physic plant psych all
Australia 1.56 2.35 2.21 1.65 1.88 1.78 1.96 0.95 4.88 2.38 2.07
Canada 3.70 5.04 3.88 3.37 3.17 5.89 4.59 2.67 8.70 7.76 4.48
Chile 0.04 0.12 0.04 0.03 0.10 0.05 0.08 0.04 0.14 0.02 0.09
Denmark 0.33 0.95 0.93 0.73 0.49 1.04 1.08 1.07 0.96 0.44 0.98
Finland 0.42 0.47 0.64 0.63 0.24 0.56 0.69 0.48 0.49 0.27 0.61
France 4.70 6.95 4.29 4.87 8.19 4.10 4.64 7.01 3.45 0.65 4.46
Germany 7.33 6.81 7.15 7.64 4.42 4.53 6.72 9.72 5.95 1.76 6.04
Hong Kong 0.05 0.13 0.04 0.06 0.07 0.06 0.09 0.04 0.05 0.13 0.08
India 2.49 0.93 0.43 0.15 1.72 0.11 0.51 1.17 0.97 0.12 0.65
Indonesia 0.00 0.00 0.03 0.00 0.03 0.00 0.00 0.00 0.04 0.01 0.01
Italy 1.35 2.42 1.04 1.55 1.17 1.99 3.31 2.82 0.92 0.61 2.05
Japan 11.27 3.34 5.17 3.86 2.12 3.86 8.95 8.14 4.27 0.37 5.68
Malaysia 0.03 0.03 0.02 0.01 0.03 0.00 0.02 0.01 0.07 0.01 0.02
Mexico 0.13 0.22 0.18 0.09 0.10 0.16 0.11 0.17 0.20 0.02 0.13
Netherlands 1.34 1.98 2.69 2.44 1.16 1.69 2.45 2.03 2.65 1.22 2.15
New Zealand 0.13 0.32 0.41 0.19 0.65 0.26 0.71 0.16 0.91 0.48 0.36
Norway 0.21 0.53 0.46 0.26 0.28 0.47 0.41 0.20 0.86 0.32 0.47
PNG 0.00 0.00 0.02 0.01 0.03 0.00 0.00 0.00 0.03 0.00 0.01
P.R. China 0.73 0.70 0.12 0.09 1.14 0.10 0.24 0.65 0.19 0.04 0.25
Philippines 0.00 0.00 0.02 0.01 0.05 0.02 0.00 0.00 0.11 0.01 0.02
Singapore 0.08 0.11 0.04 0.03 0.01 0.02 0.05 0.03 0.04 0.01 0.04
S. Africa 0.32 0.31 0.31 0.10 0.75 0.05 0.13 0.15 0.98 0.11 0.28
S. Korea 0.51 0.08 0.09 0.02 0.01 0.01 0.05 0.17 0.04 0.02 0.08
Sweden 1.50 0.86 1.98 1.61 0.94 3.30 3.00 1.20 1.70 1.26 2.10
Switzerland 1.05 0.94 1.73 2.88 2.27 1.80 2.37 3.30 1.03 0.32 1.94
Taiwan 0.55 0.27 0.14 0.06 0.07 0.07 0.17 0.18 0.14 0.03 0.14
Thailand 0.01 0.01 0.09 0.02 0.16 0.01 0.06 0.00 0.06 0.01 0.04
UK 7.28 7.95 9.95 9.37 9.77 10.19 11.59 6.08 10.74 9.06 9.13
US 45.64 45.72 49.86 53.63 44.18 53.48 40.19 40.10 42.40 70.05 49.03
Africa & M.East 1.28 2.64 1.32 1.17 1.26 0.92 0.82 1.51 2.02 1.06 1.33
C&S America 0.52 0.84 0.60 0.21 0.63 0.39 0.43 0.70 0.73 0.10 0.48
Rest of world 5.45 6.99 4.13 3.28 12.93 3.07 4.59 9.23 4.27 1.31 4.80
APEC 64.43 58.43 62.37 63.11 53.78 65.79 57.27 53.33 62.28 81.38 62.53
TOTAL 100.0 100.0 100.0 100.0 100.0 100.0 100.0 100.0 100.0 100.0 100.0
a See note a in table C.2. The measure here is the world share of citations for country j in a given field.(formula 11 in appendix B).
Source: ISI database.

BUREAU OF INDUSTRY ECONOMICS
BIBLIOMETRIC STATISTICS 73
Table C.4 Relative citation rate per paper by field, 1981-1994 (selectedcountries) a
agric astron biolog chem clinmed comput ecology engin geosci immune
Australia 1.22 1.07 0.90 1.24 0.97 0.84 1.12 1.16 1.16 0.86
Canada 1.36 0.98 0.94 1.30 1.12 1.08 1.04 0.98 0.86 0.83
Chile 0.92 1.14 0.43 0.55 0.31 0.40 0.50 0.54 0.63 0.66
Denmark 1.38 0.88 0.94 1.23 1.06 1.05 0.97 1.59 0.96 0.76
Finland 0.76 0.57 0.81 0.70 0.96 0.89 1.07 0.88 0.64 0.72
France 1.07 0.91 0.81 1.05 0.54 0.87 0.66 1.00 1.03 0.82
Germany 0.68 0.97 0.96 1.04 0.49 0.67 0.71 0.83 0.88 0.78
Hong Kong 0.60 0.46 0.48 0.80 0.58 0.45 0.37 0.49 0.37 0.37
India 0.32 0.26 0.22 0.40 0.35 0.50 0.33 0.43 0.29 0.34
Indonesia 0.58 0.48 0.40 0.37 0.82 0.15 0.33 0.50 0.55 0.73
Italy 0.73 0.73 0.60 0.94 0.73 0.62 0.65 0.85 0.63 0.63
Japan 1.07 0.75 0.75 0.94 0.71 0.58 0.61 0.89 0.75 0.64
Malaysia 0.77 0.15 0.26 0.52 0.36 0.51 0.48 0.44 0.41 0.41
Mexico 0.67 0.58 0.46 0.60 0.49 0.97 0.51 0.70 0.66 0.56
Netherlands 1.32 1.23 0.93 1.30 1.04 1.03 1.09 1.10 0.86 0.88
New Zealand 1.08 0.57 0.73 1.00 1.01 0.63 1.01 0.90 0.78 0.61
Norway 1.23 0.64 0.78 0.95 0.91 0.96 1.28 1.10 0.82 0.80
PNG 0.76 0.50 0.55 0.33 0.44 0.15 0.49 0.30 0.55 0.94
P.R. China 0.64 0.30 0.39 0.32 0.38 0.50 0.45 0.47 0.41 0.40
Philippines 0.99 0.11 0.82 0.82 0.74 0.91 0.67 0.50 0.47 0.81
Singapore 0.57 0.09 0.36 0.54 0.38 0.41 0.33 0.35 0.32 0.21
S. Africa 1.10 0.88 0.56 0.74 0.55 0.53 0.71 0.66 0.71 0.52
S. Korea 0.56 0.23 0.34 0.40 0.47 0.34 0.41 0.42 0.42 0.23
Sweden 1.93 1.01 1.10 1.30 1.09 0.78 1.40 1.35 0.82 0.89
Switzerland 1.21 1.35 1.36 1.53 0.82 1.18 1.12 1.22 1.13 1.35
Taiwan 0.48 0.30 0.39 0.44 0.57 0.37 0.47 0.51 0.44 0.29
Thailand 0.66 0.00 0.38 0.57 0.64 0.28 0.42 0.45 0.29 0.65
UK 1.56 1.13 1.05 1.21 1.10 0.69 1.04 0.98 1.13 0.96
US 1.25 1.35 1.37 1.63 1.40 1.32 1.24 1.31 1.43 1.28
Africa & M.East 0.63 0.63 0.61 0.72 0.52 1.07 0.59 0.69 0.57 0.70
C&S America 0.39 0.49 0.29 0.55 0.62 0.62 0.62 0.71 0.63 0.52
Rest of world 0.47 0.39 0.43 0.40 0.35 0.57 0.47 0.47 0.31 0.63
APEC 1.19 1.22 1.18 1.33 1.27 1.17 1.14 1.16 1.24 1.13
TOTAL 1.00 1.00 1.00 1.00 1.00 1.00 1.00 1.00 1.00 1.00
Continued overleaf

AUSTRALIAN SCIENCE
BE
74
Table C.4 continuedmater maths microb molec multi neuro pharm physic plant psych all
Australia 1.10 1.05 0.86 0.73 1.09 0.87 1.06 0.83 1.21 0.80 0.97Canada 0.97 0.95 0.90 0.79 1.67 0.94 1.12 0.95 1.18 1.00 1.00Chile 0.59 0.66 0.37 0.33 1.19 0.46 0.52 0.60 0.57 0.50 0.55Denmark 1.32 1.57 0.69 0.84 1.82 1.06 1.13 1.61 1.30 1.14 1.16Finland 0.68 0.96 0.77 0.78 1.22 0.63 0.79 1.16 0.80 0.68 0.90France 1.07 0.93 0.87 0.76 0.83 0.86 0.97 1.11 0.83 0.54 0.87Germany 0.81 0.86 0.92 1.05 1.37 0.88 0.91 1.15 0.90 0.43 0.86Hong Kong 0.54 0.71 0.43 0.30 0.89 0.50 0.48 0.38 0.70 0.53 0.51India 0.60 0.39 0.24 0.20 0.23 0.31 0.32 0.39 0.23 0.31 0.27Indonesia 0.33 0.13 0.68 0.21 0.80 0.18 0.13 0.19 0.52 1.10 0.47Italy 0.93 0.83 0.48 0.55 1.25 0.61 0.69 0.89 0.70 0.70 0.75Japan 0.93 0.73 0.73 0.61 1.34 0.66 0.67 0.87 0.79 0.28 0.78Malaysia 0.54 0.67 0.39 0.42 0.56 0.32 0.30 0.28 0.48 0.29 0.35Mexico 0.60 0.87 0.58 0.38 0.68 0.52 0.47 0.53 0.54 0.12 0.51Netherlands 1.29 1.22 0.97 0.95 1.36 0.81 1.02 1.24 1.19 0.67 1.10New Zealand 0.65 0.87 0.83 0.55 0.93 0.67 1.45 1.13 0.85 0.75 0.80Norway 0.88 1.33 0.63 0.61 1.75 0.85 0.78 0.80 1.20 0.71 0.91PNG 0.28 0.19 1.01 0.64 1.84 0.65 0.07 0.23 0.71 0.42 0.54P.R. China 0.42 0.44 0.41 0.34 0.17 0.46 0.26 0.31 0.34 0.37 0.27Philippines 0.16 0.17 0.65 0.31 0.43 2.91 0.29 0.40 0.64 0.38 0.58Singapore 0.56 0.54 0.44 0.33 0.39 0.43 0.38 0.31 0.55 0.23 0.33S. Africa 0.88 0.85 0.64 0.45 0.61 0.41 0.51 0.61 0.64 0.42 0.54S. Korea 0.68 0.34 0.39 0.29 0.32 0.30 0.30 0.36 0.50 0.42 0.32Sweden 1.07 1.14 0.82 0.88 1.78 1.23 1.26 1.14 1.35 1.14 1.24Switzerland 1.18 1.04 1.15 1.54 1.84 1.19 1.51 1.66 1.07 0.51 1.37Taiwan 0.55 0.62 0.50 0.33 0.65 0.33 0.40 0.32 0.44 0.33 0.35Thailand 0.29 0.98 0.55 0.39 0.62 0.56 0.50 0.31 0.60 0.68 0.52UK 1.13 1.26 1.02 1.05 1.44 1.13 1.37 1.09 1.39 1.11 1.14US 1.59 1.25 1.51 1.36 2.57 1.20 1.30 1.48 1.26 1.16 1.42Africa & M.East 0.71 0.84 0.65 0.82 0.63 0.65 0.44 0.87 0.66 0.56 0.61C&S America 0.82 0.73 0.44 0.19 0.55 0.50 0.50 0.53 0.52 0.34 0.45Rest of world 0.32 0.62 0.38 0.38 0.39 0.51 0.57 0.47 0.45 0.33 0.39APEC 1.28 1.12 1.27 1.17 1.75 1.09 1.08 1.20 1.16 1.10 1.21TOTAL 1.00 1.00 1.00 1.00 1.00 1.00 1.00 1.00 1.00 1.00 1.00
a See note a from table C.2 and formula 6 in appendix B.
For example, the number of citations per paper in agriculture for Australia is 22 per cent greater than thenumber of citations per paper in agriculture for the world as a whole.
Source: ISI database.
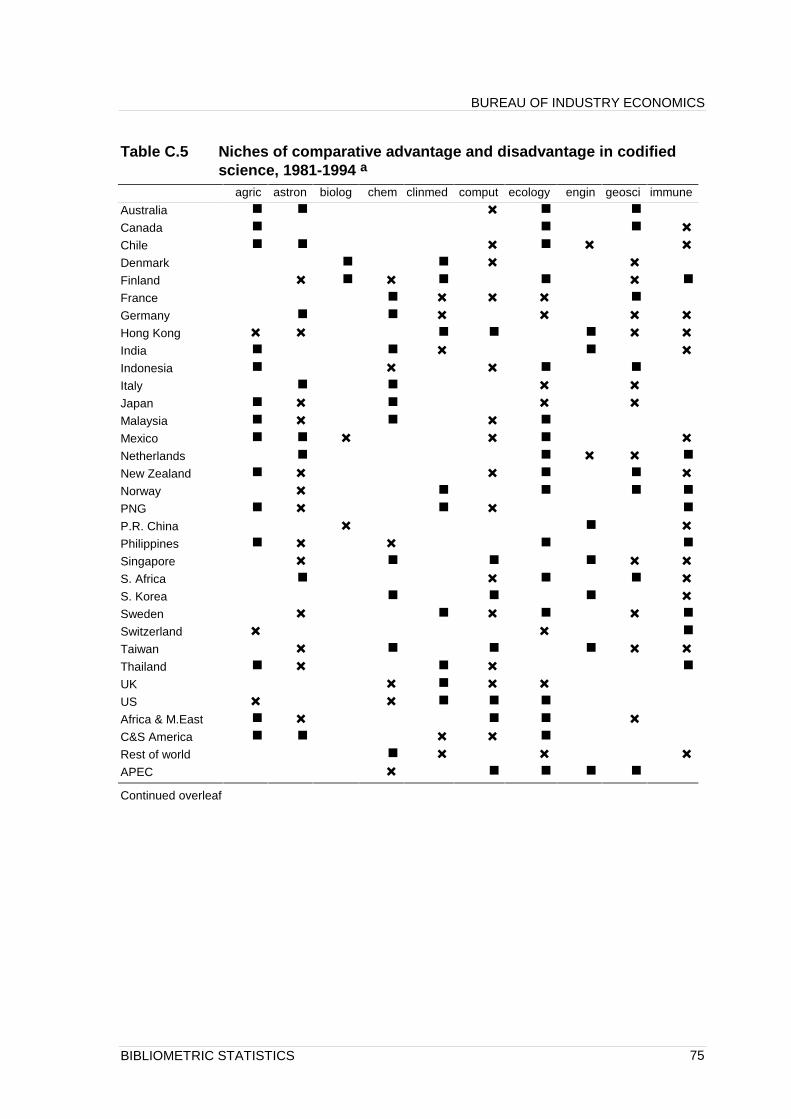
BUREAU OF INDUSTRY ECONOMICS
BIBLIOMETRIC STATISTICS 75
Table C.5 Niches of comparative advantage and disadvantage in codifiedscience, 1981-1994 a
agric astron biolog chem clinmed comput ecology engin geosci immune
Australia
Canada
Chile
Denmark
Finland
France
Germany
Hong Kong
India
Indonesia
Italy
Japan
Malaysia
Mexico
Netherlands
New Zealand
Norway
PNG
P.R. China
Philippines
Singapore
S. Africa
S. Korea
Sweden
Switzerland
Taiwan
Thailand
UK
US
Africa & M.East
C&S America
Rest of world
APEC
Continued overleaf

AUSTRALIAN SCIENCE
BE
76
Table C.5 continuedmater maths microb molec multi neuro pharm physic plant psych
Australia
Canada
Chile
Denmark
Finland
France
Germany
Hong Kong
India
Indonesia
Italy
Japan
Malaysia
Mexico
Netherlands
New Zealand
Norway
PNG
P.R. China
Philippines
Singapore
S. Africa
S. Korea
Sweden
Switzerland
Taiwan
Thailand
UK
US
Africa & M.East
C&S America
Rest of world
APEC
a This table is based on the citation share data (CSH in table C.3). For each country, we have ranked theshares by field running from top to bottom. The top five fields (in terms of world share) for a given country aremarked by a box, while the bottom five fields are marked by a cross. Thus for Australia, plant science ranksas first (with nearly 5 per cent of world citations) while physics ranks as last with less than 1 per cent of worldcitations.
Source: ISI database.

BUREAU OF INDUSTRY ECONOMICS
BIBLIOMETRIC STATISTICS 77
Table C.6 Absolute advantages and disadvantages: high and low citationshares by field by country a
agric astron biolog chem clinmed comput ecology engin geosci immuneAustralia
Canada
Chile
Denmark
Finland
France
Germany
Hong Kong
India
Indonesia
Italy
Japan
Malaysia
Mexico
Netherlands
New Zealand
Norway
PNG
P.R. China
Philippines
Singapore
S. Africa
S. Korea
Sweden
Switzerland
Taiwan
Thailand
UK
US
Continued overleaf

AUSTRALIAN SCIENCE
BE
78
Table C.6 continuedmater maths microb molec multi neuro pharm physic plant psych
Australia
Canada
Chile
Denmark
Finland
France
Germany
Hong Kong
India
Indonesia
Italy
Japan
Malaysia
Mexico
Netherlands
New Zealand
Norway
PNG
P.R. China
Philippines
Singapore
S. Africa
S. Korea
Sweden
Switzerland
Taiwan
Thailand
UK
US
a Based on the top and bottom eight performers in terms of citation shares among 79 countries. The darksquare denotes a country and a field which is represented in the top 10 per cent decile in terms ofinternational citation share. The cross denotes the bottom 10 per cent decile. For example, Australia is in thetop decile of countries in terms of citation shares in agriculture, while Papua New Guinea (PNG) is in thebottom decile in chemistry. We have not included all countries in the listing. We have included ones whichare important in science or which are important for regional comparisons. This is why there are few countrieswith crosses.
Source: ISI database.

BUREAU OF INDUSTRY ECONOMICS
BIBLIOMETRIC STATISTICS 79
Table C.7 Absolute quality advantages and disadvantages: high and lowcitation rates by field by country a
agric astron biolog chem clinmed comput ecology engin geosci immuneAustralia
Canada
Chile
Denmark
Finland
France
Germany
Hong Kong
India
Indonesia
Italy
Japan
Malaysia
Mexico
Netherlands
New Zealand
Norway
PNG
P.R. China
Philippines
Singapore
S. Africa
S. Korea
Sweden
Switzerland
Taiwan
Thailand
UK
US
Continued overleaf

AUSTRALIAN SCIENCE
BE
80
Table C.7 continuedmater maths microb molec multi neuro pharm physic plant psych
Australia
Canada
Chile
Denmark
Finland
France
Germany
Hong Kong
India
Indonesia
Italy
Japan
Malaysia
Mexico
Netherlands
New Zealand
Norway
PNG
P.R. China
Philippines
Singapore
S. Africa
S. Korea
Sweden
Switzerland
Taiwan
Thailand
UK
US
a Based on the top and bottom 10 per cent quartiles of citation rates. The dark square denotes a country anda field which is represented in the top decile (top eight countries) in terms of international citation rates perpaper. The cross denotes the bottom decile. For example, Australia is in the top 10 percent of countries interms of citation rates per paper in astronomy, while Japan lies in the middle 80 percent of countries for thisfield. We excluded countries which had less than fifty papers in a field from 1981 to 1994 inclusive from thecalculations of rank.
Source: ISI database.

BUREAU OF INDUSTRY ECONOMICS
BIBLIOMETRIC STATISTICS 81
Table C.8 Relative growth rates in publication shares by field by country,1981-1985 to 1990-1994 a
agric astron biolog chem clinmed comput ecology engin geosci immune(%) (%) (%) (%) (%) (%) (%) (%) (%) (%)
Australia 0.65 -3.77 -0.49 -2.42 2.01 -0.82 1.45 0.97 0.92 0.54Canada 4.10 0.78 0.65 -0.74 0.58 -0.15 -0.12 1.31 1.68 -0.47Chile 4.29 3.33 -1.27 5.21 0.93 12.93 7.71 5.00 8.06 2.30Denmark 2.99 5.22 -0.34 1.00 -1.92 3.16 3.32 0.69 -0.10 -3.04Finland 3.34 7.44 0.41 0.61 -0.74 0.00 6.13 4.73 2.73 -2.86France 1.77 1.71 1.19 0.96 -0.86 3.39 1.15 1.47 1.38 0.90Germany -2.13 -0.18 0.54 -0.39 -0.71 -2.31 0.27 -1.77 0.59 2.71Hong Kong 9.95 23.27 2.78 6.35 9.80 8.01 7.85 8.89 -3.44 6.51India 0.72 -0.61 -3.51 -2.64 4.37 -1.81 -3.39 -2.67 -0.12 5.90Indonesia 3.40 11.40 5.36 7.80 -0.11 .. 1.70 0.39 -2.16 -1.69Italy 2.47 4.40 2.87 0.52 3.74 2.42 6.20 5.20 4.88 4.69Japan 3.13 2.67 1.22 0.49 6.60 1.88 2.55 -0.12 2.42 2.70Malaysia 2.24 -21.47 1.93 5.60 5.10 19.40 3.96 1.36 -1.57 -4.65Mexico 7.17 5.33 6.39 4.28 -3.71 0.44 12.03 4.53 4.76 -0.08Netherlands 4.23 -0.40 1.82 1.40 4.93 3.15 4.66 3.01 1.12 1.39New Zealand -1.52 -0.01 -2.75 0.11 0.84 2.10 1.58 -2.57 0.87 -2.39Norway -1.76 3.95 -0.35 -1.21 -1.35 -4.68 -0.56 2.48 4.33 -4.82PNG 4.85 .. 0.32 -3.31 -3.45 .. -6.55 -5.35 0.21 -0.90P.R. China 20.83 5.86 13.41 14.29 4.82 10.09 14.13 13.67 -4.08 5.52Philippines 2.27 .. -1.37 17.66 -8.93 3.76 1.36 0.11 9.60 14.18Singapore 10.77 -16.11 9.98 17.16 4.90 15.87 8.78 15.10 4.41 30.63S. Africa 3.40 -0.61 0.28 0.64 -5.04 1.24 2.36 0.82 3.30 2.20S. Korea 12.54 18.15 17.68 16.83 20.73 26.92 17.36 18.71 13.37 15.11Sweden 1.91 2.08 -0.71 0.93 -2.00 -4.57 3.19 3.91 3.05 -1.71Switzerland 2.15 1.00 2.08 0.50 -0.22 -1.88 5.11 -2.23 4.96 -0.29Taiwan 9.54 8.97 15.81 15.62 17.86 25.68 17.34 20.45 16.12 24.68Thailand 9.90 .. 4.48 1.02 -8.07 5.66 1.25 1.39 11.97 13.41UK -2.79 -1.22 -1.30 -1.10 0.67 -3.64 -0.75 -2.95 -0.03 -1.07US -2.13 -2.14 -0.87 -0.07 -1.02 -1.28 -2.37 -1.25 -1.21 -1.52
Continued overleaf

AUSTRALIAN SCIENCE
BE
82
Table C.8 continued
mater maths microb molec multi neuro pharm physic plant psych
Australia -2.00 -2.96 1.14 -0.86 2.29 0.60 0.27 -0.49 -0.51 1.17
Canada 0.79 -0.16 -0.47 0.76 2.11 -0.19 -0.37 -0.49 0.17 1.50
Chile -0.81 8.49 3.20 -4.25 -1.30 -0.55 2.25 2.83 2.86 2.36
Denmark 3.81 -0.73 3.31 -0.78 0.54 -3.62 2.09 -1.60 3.87 0.91
Finland -2.83 -0.35 1.42 -1.66 -1.94 0.64 -1.00 0.63 4.85 10.58
France 2.80 1.78 2.60 0.70 -1.82 2.53 2.02 -0.33 1.30 5.68
Germany -2.87 -1.33 0.24 -0.16 2.41 2.26 -2.21 -0.04 -0.89 1.19
Hong Kong 18.18 0.42 6.29 6.72 1.91 8.24 2.86 11.14 2.25 7.70
India 1.50 -5.31 -2.28 -5.18 -5.11 0.70 0.16 -2.39 -3.08 0.04
Indonesia 2.73 .. 10.24 13.13 6.87 25.21 18.27 5.16 10.10 -4.10
Italy 4.77 5.11 1.07 3.72 0.17 4.33 1.62 1.84 4.95 5.85
Japan 3.62 -1.12 0.97 1.35 1.74 4.37 1.15 1.97 2.33 2.84
Malaysia 4.40 -10.37 6.79 -0.90 6.20 -5.47 16.85 6.80 1.38 4.80
Mexico 9.28 5.24 8.50 -0.98 9.39 1.32 4.85 4.35 8.36 8.72
Netherlands 4.90 -0.05 2.52 -0.63 5.83 2.41 1.60 0.48 2.68 6.33
New Zealand -2.22 2.21 -3.26 1.12 -4.50 0.23 4.22 -2.00 0.48 1.85
Norway -0.30 -2.38 -2.01 -1.44 -1.59 -2.56 -2.73 1.07 3.11 5.83
PNG -17.56 2.15 10.66 -6.15 -3.54 .. .. .. -9.58 -12.89
P.R. China 20.60 12.92 12.28 8.13 7.89 13.47 11.79 15.47 -2.35 15.85
Philippines 0.10 .. -4.48 9.80 -19.96 -1.61 6.02 16.62 3.11 5.89
Singapore 17.52 7.44 12.80 11.75 -0.39 1.50 12.79 5.93 13.77 21.51
S. Africa 1.16 -1.23 1.34 1.25 6.48 -2.07 4.28 0.71 3.17 2.73
S. Korea 16.98 20.82 14.31 14.75 13.75 27.78 14.10 16.88 17.58 15.30
Sweden -2.77 -0.56 -0.43 -0.42 5.68 -0.91 -2.18 1.58 4.99 0.19
Switzerland -0.86 -1.00 1.47 0.07 0.00 -0.59 -0.81 -0.33 2.22 3.92
Taiwan 22.69 4.46 21.41 19.58 12.62 12.68 12.74 19.21 10.68 4.48
Thailand -2.97 -21.85 5.99 -1.75 -3.48 6.79 5.61 -0.78 7.03 7.47
UK -1.19 -2.64 -1.07 -0.56 0.26 -1.49 -0.15 -1.06 -2.43 0.73
US 0.43 -0.82 -0.99 -0.25 1.46 -1.47 -1.29 -0.93 -1.09 -1.33
a The data are based on the divergence between trends in country field shares and world fieldshares:
∆GRTRENDij = trend(Pij Pijj=1k∑ ) − trend( Piji=1
N∑ Pijj =1k∑i=1
N∑ ). The trend rates of growth in
publication shares were estimated by regressing the logged value of publication shares against a time trend.Some values are zero, hence are not defined (..).
Source: ISI database.

BUREAU OF INDUSTRY ECONOMICS
BIBLIOMETRIC STATISTICS 83
Table C.9 Growth rates in relative citation impacts by field by country,1981-1985 to 1990-1994 a
agric astron biolog chem clinmed comput ecology engin geosci immune
(%) (%) (%) (%) (%) (%) (%) (%) (%) (%)
Australia -0.85 2.26 -0.09 -2.77 -0.54 -0.81 0.19 0.90 -0.10 -4.05
Canada -2.23 3.44 -0.39 -0.97 0.52 -0.68 1.52 0.95 1.57 0.02
Chile 5.03 -2.56 0.47 -2.88 1.53 2.43 -8.67 -2.16 5.90 3.96
Denmark -1.19 4.31 -0.40 -1.89 1.08 3.45 -0.71 -1.85 -2.55 0.96
Finland 0.55 1.24 2.04 -2.83 1.88 -0.01 -0.46 4.38 0.53 -3.15
France 3.26 1.45 0.65 -0.69 4.09 -1.73 4.15 3.16 0.93 0.16
Germany 1.00 1.06 0.21 -0.45 3.01 0.67 4.14 3.80 2.50 -0.04
Hong Kong 6.14 -6.53 -2.70 4.09 1.84 5.13 -1.60 5.70 -4.85 1.11
India -5.94 3.41 -0.95 -0.09 0.48 0.37 1.39 -0.88 -4.25 -8.47
Indonesia -1.43 5.59 1.88 -7.42 -5.32 .. 7.31 3.01 3.11 -5.29
Italy 1.51 -0.14 1.10 0.18 3.76 3.93 1.66 3.93 -2.89 -0.99
Japan -2.39 4.56 1.12 -0.11 0.54 -3.90 -1.50 -0.11 0.07 -0.47
Malaysia -3.01 .. 5.04 -1.67 2.50 .. -8.03 -4.28 7.79 0.54
Mexico -4.24 -1.29 -6.72 -4.53 6.61 -15.86 1.76 2.78 -4.15 -2.56
Netherlands 1.32 -1.76 -0.24 -1.09 2.87 1.52 2.71 2.32 2.37 2.53
New Zealand -0.66 -0.40 2.60 0.26 3.15 -0.17 -1.49 -2.79 1.91 0.71
Norway 0.58 3.00 -0.09 -3.34 -0.19 3.61 0.10 3.42 0.88 0.21
PNG -3.38 .. 5.73 -6.57 8.14 .. 3.11 22.07 -5.58 -4.19
P.R. China 0.63 1.66 3.28 7.13 7.44 -6.89 -1.44 1.89 5.79 6.77
Philippines -0.79 .. 2.23 5.99 5.88 .. 2.71 -1.70 -0.66 -16.27
Singapore 7.80 .. 6.53 3.70 4.49 10.32 -3.78 3.23 -0.28 -0.68
S. Africa -0.54 3.11 -0.67 0.19 0.97 0.51 -2.45 4.30 0.22 2.95
S. Korea 3.12 7.49 0.28 0.95 -1.51 -8.10 0.56 -2.41 4.18 -18.81
Sweden -2.62 1.60 -2.01 -0.14 0.58 1.16 0.84 2.13 -0.08 -0.54
Switzerland 2.37 1.54 -0.60 -1.58 2.50 4.96 -0.47 4.35 -1.60 1.99
Taiwan 6.21 8.89 2.32 3.99 -6.42 -3.94 -11.50 -7.00 5.00 -10.97
Thailand 2.46 .. 0.11 0.21 10.75 .. 8.02 -1.36 8.57 -7.07
UK -2.26 2.35 -0.37 -1.42 -1.23 1.93 -0.42 2.76 -1.74 1.03
US 1.29 -0.68 0.26 0.65 -0.82 0.57 0.03 -1.41 -0.25 0.71
Continued overleaf

AUSTRALIAN SCIENCE
BE
84
Table C.9 continued
mater maths microb molec multi neuro pharm physic plant psych
Australia -2.31 1.00 -1.40 -1.09 4.48 -1.02 -0.54 -0.07 -1.01 -0.03
Canada -0.35 1.06 0.52 2.77 4.22 0.40 -1.53 2.35 -0.49 0.17
Chile -1.16 3.58 12.25 -6.18 -1.40 -2.12 0.12 9.41 2.32 -1.43
Denmark 2.41 2.88 1.32 -4.53 0.41 -0.32 -0.25 -3.35 -1.61 -0.84
Finland -1.52 0.61 -3.27 -0.20 5.85 2.88 1.38 -1.47 0.05 4.15
France -2.75 -1.02 0.34 0.96 4.04 -1.07 0.02 -1.41 1.25 3.41
Germany 1.87 -0.59 -0.63 -0.11 4.12 2.54 -0.95 -0.37 0.51 2.21
Hong Kong -1.57 6.33 8.49 3.32 -8.26 -6.66 1.91 -1.91 -4.35 2.06
India -2.84 3.90 2.60 -1.10 3.16 -2.81 -2.43 2.19 -2.15 2.46
Indonesia 17.08 .. -9.28 -0.42 12.87 .. -1.05 -7.99 7.44 -8.55
Italy -1.69 -0.86 2.86 -0.26 0.92 1.08 1.86 -0.90 0.52 1.49
Japan -0.60 0.70 0.81 0.88 5.45 0.46 0.31 1.41 -0.71 4.26
Malaysia -13.27 6.68 7.44 -7.68 3.81 -7.44 5.38 -9.24 0.97 -8.65
Mexico -5.41 -6.79 0.20 -2.85 -5.32 0.38 -3.53 -4.14 -4.96 5.36
Netherlands -5.75 0.37 1.65 -1.20 -0.44 -1.28 -2.25 0.64 1.41 -0.04
New Zealand 1.14 1.44 -2.12 -3.63 3.06 7.40 2.30 0.40 0.79 1.47
Norway -1.03 -5.64 2.88 -3.77 4.18 -0.53 -2.32 -1.19 -0.44 0.15
PNG .. .. -1.70 4.60 13.75 .. .. .. 6.52 ..
P.R. China -3.01 -1.43 -3.12 7.20 -0.72 9.25 4.09 3.95 14.11 2.88
Philippines .. .. 8.51 8.87 24.57 16.70 0.54 .. -0.88 2.65
Singapore 0.70 -0.85 20.54 2.98 18.12 4.34 0.53 5.02 5.38 4.33
S. Africa -1.93 3.82 0.82 -0.56 -0.97 0.87 -4.77 1.57 -1.52 -4.13
S. Korea -4.42 6.43 -7.44 -2.76 19.58 -4.39 3.32 -2.92 -1.35 11.10
Sweden -0.40 3.81 0.94 -2.68 9.43 -1.69 -0.04 -1.84 0.94 -1.21
Switzerland 4.99 0.56 -1.11 -3.38 5.38 -0.05 0.58 -2.24 3.31 2.32
Taiwan 1.21 -3.36 7.93 8.35 1.66 2.57 -3.35 0.98 6.56 3.88
Thailand 9.21 .. -1.97 -0.37 0.55 -11.83 3.95 0.38 -2.72 -9.11
UK -2.25 1.43 -0.34 0.14 3.11 -0.25 4.01 -0.79 -0.31 -0.08
US -0.81 -0.03 -0.07 0.34 -4.99 0.54 -0.17 0.49 0.10 0.24
a The data are based on the divergence between trends in country citation rates and world citation rates. Thetrend rates of growth in citation rates were estimated by regressing the logged value of citation rates againsta time trend. Some values are zero, hence are not defined (..).
Source: ISI database.

BUREAU OF INDUSTRY ECONOMICS
COULD THE DECLINE BE ILLUSORY 85
Appendix D Could the decline beillusory?
As noted in the main text, citations accrue over time. In most fields, few papers arecited in the first or even second year. Over time, citations per paper slowly rise untilthey plateau – we call this path the ‘time profile’ of citations. However, this does notaffect relative citation impacts, so long as all countries have the same and invariantshape of time profile. This appendix shows that if this is not true, then the data can givethe false appearance of a decline in relative citation impacts. This does not mean weview this as a highly likely source of the change in Australia’s relative citation impact –but we think it establishes a case for removing this factor as a potential explanator.
Say that there is no long run change in Australia’s or the rest of the world’s citation rates. That is, after many years
an Australian paper published in 1981 or 1994 or any other year will get cited roughly the same amount. But
imagine that the period taken to get to this long run grows over time for Australian papers. For example say that 15
years ago it took seven years for a paper to get cited on average 10 times. But now it takes seven and half years to
be cited this amount. If this happens, the data from both the moving and fixed window data will suggest declining
citation shares and relative citation impacts, even though by definition the long run relative citation rate remains
fixed. We can illustrate how this could happen with a very simple model. We must distinguish first between the
time that an article was published (denoted by t) and by its citation rate at time t+v. Say that citation rates at time
t+v for papers written at time t for the ith country is given by the equation:
CITRitv = eαi − βi
v+ φi
v2
In this simple model α is the variable determining the long run citation rate while β and φ determine the path to
the long run. Now it is possible that either α , φ or/and β change over time. People who claim that Australia is
facing a crisis in science are implicitly suggesting that Australia’s α is slowly falling over time. But there is
another possibility. Say that βi = Ωi (t ) and that this is rising over time. For a higher value of β the citation rate
at any given time is lower, though in the long run it approaches the same value (eαi ). Say in particular that for
Australia: βt = β1981 (1. 005t−1981) and that β1981 = 5. 9843, φ = 2.011 and α =3.1028. For the rest of the
world suppose that β = 5.639, φ = 1.3366 and α = 3.0802 . These values were estimated from the data on the
profile of citation rates over time.1 We use the estimated trend growth rates for papers to see how total papers
change over time for t=1981 to 1994:
PapersAustralia,t =10674 × e0.0364×(t−1981) and PapersRest of world,t = 468,093 ×e0.0372×(t −1981)
1 In estimating the Australian parameters we imposed the constraint that the beta coefficient grew at
0.5 per cent per year. This is a very modest change. Such a modest change implies that after 14years the citation rate for Australian papers is around 14.66 for the 1981 cohort of papers and14.25 for the 1994 cohort. The fact that we can get such large changes in apparent relative citation

AUSTRALIAN SCIENCE
BE
86
We can then estimate the citations for Australia, the rest of the world and the whole world as:Citationsi, t = Papersi ,t ×CITRi,t ,1994−t for t =1981 to 1994 , We can then calculate citation shares and
relative citation impacts. An analogous set of calculations can be done to derive the fixed window results. The
results (table D.1) suggest a steady decline in Australia’s citation shares and relative citation impact even though
we know that by construction the long run relative citation rate remains unchanged! We are not sure what citing
practices could underlie such a change. But this remains as a theoretical possibility for the apparent decline.
Table D.1 How the declining rates could be spurious: some simulatednumbers a
Variable window Fixed windowCitation share Relative citation
impactCitation share Relative citation
impact1981 0.022 1.012 1981-85 0.022 0.9801982 0.022 1.007 1982-86 0.022 0.9711983 0.022 1.001 1983-87 0.021 0.9631984 0.022 0.994 1984-88 0.021 0.9551985 0.022 0.987 1985-89 0.021 0.9461986 0.022 0.978 1986-90 0.021 0.9381987 0.021 0.969 1987-91 0.021 0.9301988 0.021 0.957 1988-92 0.020 0.9211989 0.021 0.943 1989-93 0.020 0.9131990 0.021 0.925 1990-94 0.020 0.9051991 0.020 0.9021992 0.019 0.8721993 0.019 0.8401994 0.021 0.943
a The simulated numbers replicate the major features of the real data, showing declining citation shares andrelative citation impacts even though by construction the long run relative citation rate is unchanged.
Source: Calculations using the algorithm described above.
rates out of a modest change in the parameters of the process determining citation rates increasesthe plausibility of our results. The alpha coefficients suggest a long run citation rate of about 22for either Australian or rest of world papers.
BUREAU OF INDUSTRY ECONOMICS
REFERENCES 8787
References
ASTEC (Australian Science and Technology Council) 1989, Profile of Australian Science,A study of the current state and potential of basic scientific research, A report to thePrime Minister by ASTEC, August, AGPS, Canberra.
Barré, Rémi and Pierre Papon 1995, ‘Indicators: purpose and limitations’. In UNESCO(Ed), World Science Report . pp. 136-8.
Bourke, Paul and Linda Butler 1994, A Crisis for Australian Science?, PerformanceIndicators Project Monograph Series No. 1, Research School of Social Sciences, TheAustralian National University.
——,—— 1995a, Recent Foresight Studies: Implications for Australia, PerformanceIndicators Project Monograph Series No. 2, Research School of Social Sciences, TheAustralian National University.
——,—— 1995b ‘Science in our unis: what’s done where?’, The Australian, March 8,p.29.
Bureau of Industry Economics 1996, Science System: International Benchmarking, AGPS,Canberra, forthcoming.
Carpenter, M.P. and F. Narin 1981, ‘The adequacy of the Science Citation Index (SCI) asan Indicator of International Scientific Activity’, Journal of American Society forInformation Science, 32, 430-439.
——,—— and P. Wolf 1981, ‘Citation Rates to Technologically Important Papers’. WorldPatent Information 3. pp. 160-3.
DITAC (Department of Industry, Technology and Commerce) 1987, Measures of Scienceand Innovation, Australian Science and Technology Indicators Report, 1987,Canberra, November.
European Commission 1994, The European Report on Science and Technology Indicators.1994, EC, Luxembourg.
Freeman, Christopher (ed) 1987, Output Measurement in Science and Technology: Essaysin honor of Yvan Fabien. North-Holland.
Garfield, Eugene and Alfred Welljams-Dorof 1992, ‘Citation data: their use as quantitativeindicators for science and technology evaluation and policy-making’. Science andPublic Policy, 19 (5): 321-7.
Garfield, Eugene 1979, Citation Indexing: Its Theory and Application in Science,Technology and Humanities, Wiley, New York.

AUSTRALIAN SCIENCE
BE
88
Kyrillidou, Martha 1995, ’Trends in Research Library Acquisitions and ILL Services’,Bimonthly Newsletter of Research Library Issues and Actions, Association ofResearch Libraries (US), May.
LISU (Library and Information Statistics Unit) 1995, The LIST,(http://info.lut.ac.uk/departments/dils/lisu/LIST.html), Loughborough University,August 1995.
Lowe, Ian 1995, ‘Useful Insights from Snapshot of Science’, The Australian, March 22,p.28.
Martin, B.R., J. Irvine, F. Narin, C. Sterritt and K. Stevens 1990, ‘Recent Trends in theOutput and Impact of British Science’, Science and Public Policy, 17, 14-26.
Martin, B.R. 1994, British Science in the 1980s – has the Relative Decline Continued?,Scientometrics, 29(1), 27-56.
Milsted, David, 1995, "Even Geniuses makes mistakes', New Scientist, Volume 147, 19August, 49-50.
NBEET (National Board of Employment Education and Training) 1993, Chemistry: AVision for Australia, prepared by a Review Panel appointed by the Royal AustralianChemical Institute, Commissioned Report No. 27 , April.
—— 1994, Quantitative Indicators of Australian Academic Research, CommissionedReport No. 27 , April.
—— 1995, International Links in Higher Education Research., Paper produced by PaulBourke and Linda Butler, Commissioned Report 37, Canberra, May.
NSF (National Science Foundation) 1993, Science and Engineering Indicators. NSF 93-1,Washington DC.
Perrault, Anna 1995, Summary of 'The Changing Print Resource Base of AcademicLibraries in the United States, A Comparison of Collection Patterns in Seventy-twoARL Academic Libraries of Non-serial Imprints for the Years 1985 and 1989',Bimonthly Newsletter of Research Library Issues and Actions, Association ofResearch Libraries (US), May.
van Raan, A.F.J. (ed) 1988, Handbook of Quantitative Studies of Science and Technology.North-Holland.
Walley, B. 1986, ‘Uncovering Third World Science’, Search, 17, 186.
White, Kenneth J. 1993, SHAZAM, the Econometrics Computer Program, V.7.0, User’sreference Manual, McGraw-Hill Book Company, New York.
Wood, F.1989, ‘Assessing Research Performance of University Academic Staff’ in HigherEducation R&D, 8(2), University of Queensland, pp. 243ff.