australian taxi drivers association - ipart · rc wage fixation 18. standards of service ... the...
TRANSCRIPT
NSW TAXI FARES – 2008
Submission by the
AUSTRALIAN TAXI DRIVERS ASSOCIATION
To the
Independent Pricing and Regulatory Tribunal
March 2008
ATDA 2008 IPART Submission: Page 2 of 36
Australian Taxi Drivers Association 33b Bourke Road, (PO Box 7181) Alexandria NSW 2015 Ph. 0419 272 744 .. (Inc. Association 9886630)
www.tda.net.au [email protected]
2008 IPART SUBMISSION
Foreword:
It is regrettable - to the point of absurdity - that the seven year cycle of incompetent analysis of the Sydney Taxi Industry by PriceWaterhouseCoopers continues in 2008. That such inadequate performance continues to be funded by taxi operators, previously through fees to the Taxi Council Limited, and now through fees to the Taxi Advisory Committee, is bizarre.
It is especially bizarre in the situation ‘established’ by the PWC report to, and accepted by IPART where the
income derived by taxi operators is $32,600 per annum less than their total operating costs and expenses, the fare revenue is $50,000 less than operating costs, and where the taxi driver continues to earn a net hourly rate of less than the NSW minimum wage of $13.00 per hour.
IPART then appears to adopt the flawed conclusions of a flawed study as the basis for a fare setting process
which is really required to consider costs, possible abuses of monopoly power, and the needs for efficiency and standards of service. Its average cab only works 70% of the year, and then for only 75% of the time, and through the Taxi Networks systems only pick up 65% of all bookings in less than fifteen minutes. The only winners are the cartels whose charges are self determined and who pick up a significant margin on almost all non-cash taxi trips.
Over the years we have been the reluctant sufferers of a “Notional Taxi Drivers Wage” which serves only to
minimise the real costs and expenses of taxi drivers; to deny them the basic wage justice of a fair share of a fair fare; and to distort any reasoned analysis of the industry.
The Australian Taxi Drivers Association has, over those same six years, presented data and argument which
accurately reflect and model the Taxi Industry, and prove the desperate plight of taxi drivers working over seventy hours a week without holiday or sick pay or any Annual Leave.
It is a mark of the depressed conditions, the workplace isolation and lack of safety, and the vested interests of
both Government and the Taxi Industry Network Cartel, as well as the fragmentation of driver groups that situation has been permitted to continue.
To date, the taxi drivers of Sydney, and of NSW, have been docile and accepting of a socially unacceptable
determination which has enabled over a hundred million passengers to be carried in taxis last year – saving much embarrassment to the NSW Public Transport system. But, now, in 2008 when our staple LPG fuel has gone from 50 cents a litre to 70 cents a litre in early February, and where IPART appears unwilling to validate the very basic item of data – how many trips a year per taxi – such as would be the elementary starting point of proper fare analysis, we have had enough.
The objective is not simply to raise fares to such a level as is appropriate to current cost inputs, because that
would affect passenger demand and disadvantage our needy customers. It is to validate those costs and to fairly apportion an acceptable increased fare between drivers and operators. Let the market forces of a competitive free market then determine capital investment, and drive productivity improvements.
The ATDA would have the average fare set at a rate from which a one half share returns to the taxi driver an
average net earning hourly rate of $20.00 per hour. That fare would be $25.00 without industry reform. With an industry led productivity programme the fare would be $20.00. Is there a choice?

ATDA 2008 IPART Submission: Page 3 of 36
Contents
1. Introduction 2. The Taxi Model 3. Current Taxi fare Components 4. Average Fare Calculations 5. Taxi Cost Index 6. Wheelchair and Premium Taxis 7. Productivity Impact 8. Country Taxis 9. Superannuation 10. Taxi Operators Operating Costs 11. Taxi Ownership 12. The Missing Cost Item I 13. The Missing Cost Item II 14. The Missing Cost Item III 15. The Missing Cost Item IV 16. IPART and I Spreadsheet 1 17. RC Wage Fixation 18. Standards of Service 19. A Perspective - what the numbers were… 20. Two Social Issues 21. The Average Fare revisited 22. Conclusion – the Taxi Reality
Appendices
• Validated Taxi Data • Validated Cost Items • Spreadsheet 1 - Current Industry Data - Standard Taxi • Spreadsheet 1I – Premium Taxis • Spreadsheet III – Effect of $20 fare plus 2 trips per shift • Spreadsheet IV – With $25 fare and estimated pay-ins
ATDA 2008 IPART Submission: Page 4 of 36
1. Introduction 1.1 The purpose of the ATDA is to obtain for the Taxi Driver a “fair share of a fair fare”. We hold to the
basic premise that a fair share is half the fare, and that the other half should be sufficient to cover all operating costs of the taxi. The Taxi Cost Index should accurately count all costs in a transparent and verifiable manner, and make annual variations based on percentile weighted increases.
1.2 We would see net earnings for taxi drivers from this share as being not less than $20.00 per hour,
and that a fair fare is set to obtain the average rate in a model structure that fairly represents the revenue and trip productivity levels. It must also be acceptable to the travelling public, and provide appropriate service.
1.3 IPART appears to have concluded that the ‘notional wage’, given that taxi drivers are essentially
self-employed, is - or should be - $20.00 an hour. We see a major inconsistency with the current calculations in that the driver is now earning only $13.00 an hour, and that a fare in the order of $25.00 is required to generate a net rate of $20.00 as determined. Such an increase, however meretricious, is commercially unsound.
1.4 The Taxi Operator’s components of the Taxi Cost Index have been substantially reduced as a result
of the PriceWaterhouseCoopers survey, and possibly reflect actual average costs better than previously. Such was the quality and extent of the survey, and our own understanding of cost inputs that the ATDA is not prepared to accept those costs unequivocally. They do not adequately represent the costs payable for a acceptable standard of taxi services. The public deserves a higher standard of service.
1.5 Unfortunately, and even at a cost less than it might be, the current fare structure, and the current
levels of productivity does not generate an adequate earning rate for the taxi driver. As has been the case for many years, a low earning rate for drivers has subsidized a low fare structure compounded by low productivity levels beyond the control of drivers.
1.6 This submission aims at presenting an accurate assessment of the current state of the industry, and of
confirmation of that unacceptable low rate of driver earnings. We have sympathy also for taxi operators caught in a squeeze where their own survival depends on cutting cost below safety levels , and on setting pay-in rates at a level where the denial of legal entitlements can be justified. Our calculations have not provided any pay-in increases other than where a 50/50 fare sharing contract exists. Before we do so there needs be a transparent and verifiable detailing of costs. PWC has not provided that information.
1.7 The ATDA goes beyond just whinging: we are offering a positive and rational solution which, whilst
incorporating a reasonable monetary increase in fares, also provides for a driver and operator productivity improvement. Out of experience rather than pessimism we do not assume Network productivity enhancements. We put forward a challenge for IPART to go forward and recommend a self supported improvement to the major privately operated mode of Public Transport in NSW.
1.8 Taxi industry realities are such that:
For an operator an extra shift a week is $6,500 a year in extra income. For drivers two extra jobs a shift is $10,000 a year in extra income. The extra cost to an operator is $1500. The extra cost to drivers is nil.
If IPART and the rest of the taxi industry have genuine productivity concerns, then this must be the focus. Not a model based on 70% efficiencies.
ATDA 2008 IPART Submission: Page 5 of 36
2. The Taxi Model 2.1 Fundamental to any understanding of the Taxi Industry is the establishment and agreement on a
model or structural base. The ATDA has, over several years, stressed this point and has developed a validated statistical model from actual taxi data. Critically it has cross-tested that model, and the fare structure of the “Average Fare” to validate the data, and to ensure that, as a whole, it reflects reality. Since 2001, and even with the PWC Survey, the disparate modeling of IPART is at odds with taxi reality.
2.2 The issue arises from a basic misconception and misunderstanding of the duality of the industry.
IPART would lump all the operators’ operating costs together, sum the total, add a notional drivers wage and call it all, the “cost index”. It omits the drivers operating costs entirely, and it omits also any margin for profit by the operator, but not for the investor; and fails to validate the total by any revenue balance. Even worse is the failure to comprehend and incorporate the cost / revenue flow.
2.3 The total revenue from fares is a function of the fare multiplied by the total trips, and it flows
directly to the several taxi drivers of the taxi. The taxi drivers then allocate a bailment pay-in to the operator, pay for fuel and wash and pay GST on the balance. From the remaining amount they deduct their taxable input expenses and the balance is their retained earnings.
2.4 Historically, and within the context of the Industrial Relations Commission, that amount is 50% of
chargeable fares. Originally, the alternate bailment payment under Method II, of a maximum set pay-in was meant to reflect that percentage, and with qualifications, the hourly downtime rate quantified the amount and established an Annual Leave rate. This is currently set at $17.60 per hour.
2.5 The operator’s sole source of taxi revenue is from the bailment paid by the driver. (Excluding
marginal revenue from advertising placed on the cab.) 2.6 Logically, the totality of the Operators operating costs must be less than the gross revenue from
bailment. If it were consistently more, there would be no taxi industry, and logically there must be some margin of profit for the operator as distinct from the investor owner of the taxi plates to remain in the industry. An additional factor to consider is the traditional losses in January when a significant proportion of cabs do not even get on the road, and how to account for this divergence.
2.7 Since 2000 the Taxi Council Limited cost model, which originated from the PWC survey of 2000
has been adopted uncritically by IPART, despite this model claiming operators’ costs exceed the maximum revenue obtainable from charging the maximum set pay-in amounts – a scenario which is simply not possible.
2.8 Neither the ATDA, nor any other interested party, has been supplied with an acceptable set of the
operators operating costs. The leaps of faith required to accept PWC’s 95% probabilities are not appropriate. The response of what unfortunately few drivers and operators reported in an ill-prepared survey been inadequately tested against easily verifiable industry costs.
2.9 Both the various models previously advanced, as well as those currently being are simply incapable
of accommodating a driver’s ability to pay even the lower market pay-in on the basis of shifts worked or trips driven, GST obligations and expenses, and still be able to pay the equivalent to the driver of even the minimum state wage. Logical analysis must reject all those models.
2.10 For IPART to now insert yet another variant on the Drivers Notional Wage is an absurdity. It started
as 46% of the ACT Taxi Operators Costs (the relevance of which to the NSW industry is far from clear), and then became the minimum cost at which a driver could be induced to drive a taxi as opposed to engaging in any other occupation. It’s now been set as equivalent to bus drivers’ basic rate

ATDA 2008 IPART Submission: Page 6 of 36
exclusive of overtime rates, money handling rates, meal breaks , or, most basic to the disdain with which taxi drivers are treated, conditions as to hours worked without a break. Bus Drivers enjoy an award under which holiday and sick entitlements are paid - not treated as a potential trade off. And the 9% Superannuation factor is integrated as a basic entitlement.
2.11 Further, bus drivers enjoy an award which pays a base rate of $20 an hour, and not exploited for the
‘whatever’s left over’ of about $13 an hour. 2.12 What then is the actual model, reflecting reality, maximum economic utilization, and representative
of Sydney taxis? 2.13 A standard taxi is driven by two full time bailee drivers and a number of casual drivers for six day
and seven night shifts over 50 weeks of the year for 650 shifts. The plate is owned by a single plate licensee and operated from a multiple taxi base. The taxi travels a total of 131,000 kilometers and uses 29,000 litres of LPG. The average fare is $17.60. Average total fare revenue is $209,750.
2.14 It makes 11,900 trips with a hired distance of 5.7 kms per trip and is occupied for an average of 55%
of total distance. It obtains 2150 Bookings through the Network, and spends 6650 hours on the road. The average earning rate is $1.60 per kilometer traveled, of which 32% of the paid distance is at “Waiting Time” rates.
2.15 The principle variant is a premium taxi which now represent 15% of Sydney taxis, and whilst the
overall rate per kilometer is still $1.60, these taxi take marginally fewer trips but for longer journeys (about 18 kms total paid/vacant trip) and for about 33% more in total kilometers. Accordingly, it is hired for a greater percentage of time on the road, with more bookings, both obtained privately and through network dispatch systems. One of the two principal drivers is also the plate lessee/operator, and extra drivers are for annual leave relief, rather than for extra week-by-week shifts Total kilometers are 173,700 on a usage rate of five days and six nights for 50 weeks with total fares of $280,000. The average fare is $28.50.
2.16 This variant is important because it illustrates very clearly the benefit to a driver of an improved
service model. Because the level of demand for booked trips, which tend to be longer, is greater, all productivity factors are affected. Put simply, the professional owner driver drives his own Silver Service Taxi. And, consequentially, his passengers are better serviced, albeit at a surcharge external to the regulated fare.
2.17 The other issue to which IPART must address its attention is the cost recovery for taxi drivers. Thus
far, for six years, the misplaced focus has been on the operators cost recovery. Perhaps now we may see a change. Clearly, and totally misunderstood, is the indisputable fact that the operators total revenue, which logically must exceed his costs, is from his taxi drivers’ bailment pay-ins. Not for the first time do we now present the model of a taxi drivers operating costs.
2.18 A difficulty in the PWC Survey is the misinterpretation of the essentially limited data. By assuming
statistical confidence based on median data, without separating that data by the two essential differences – day / night shift operations and bailee/operator driver operations there is a major skew. Evidence of this in but one example is the reported pay-in of $120 per shift.
2.19 This figure is true of the day shift bailee on market rates of the maximum pay-in less 20%, and is no
doubt the median result obtained. On that pay-in the Operator goes broke. 2.20 The weighted average of posted, market rate, pay-ins for six days and seven nights, at taxi bases in
Alexandria, covering over 1500 taxis, and easily accessible to a interested researcher from PWC or IPART, is $134.40. The maximum set pay-in is $2168.00 per week. On this rate an operator’s income

ATDA 2008 IPART Submission: Page 7 of 36
from bailment for IPART’s 520 shifts is $69,888 or, at the modeled 650 shifts it is $87,036. Again, with only ten shifts a week the Operator is losing money. As a basic survival process he must strive to have his cab on the road for as close to 13 shifts week and for 50 weeks a year. When does IPART grasp this reality ??
2.21 For the two full time taxi drivers, and the casuals, operating costs, are fivefold :
One: Bailment of the Taxi for 650 shifts at market rates, or at maximum set pay-ins, or on a 50% Method I Commission on which he might obtain entitlements.
Two: Fuel and Wash expenses (other than on Method I). Three: His operating expenses as a driver, which, if employed, would have been a
cost to the employer, but which are subsequently available to be deducted from his taxable income as a self-employed person.
Four: GST payable on the balance remaining after the above deductions. Five: The remaining balance retained as their net earnings from driving, and
thereby their net taxable income. These are their ‘wages”. This is amounts to an average $13.00 per hour.
2.22 And this is the functional reality of taxi driving, for a Standard Taxi, which is supported and
validated by the ATDA model. It is also the only statistical fit for all reasoned and verifiable data. It is not the $20.00 an hour which IPART glibly and erroneously describes as “Notional Taxi Driver Wages”.
2.23 That which IPART and PWC would have counted as some notional proxy for opportunity income-
the entitlements of Annual Leave and Sick Pay may be as disregarded by IPART as they are by the industry generally.
2.24 Apart from the several years in which IPART has chosen to totally ignore the GST component, and
which this in year it makes the totally incorrect comment that the existing TCI is GST exclusive, is the issue of the drivers own operating expenses. The survey said these are a zero cost. Using the survey median response of a skewed data base it’s possible. The reality check of other aspects of the survey, and of the real world indicate otherwise.
2.25 For example: these are just some of the many questions left unanswered:
If the operator is paying $275 on uniforms for their drivers, who is paying the rest? If they have a GPS, who is buying it? If the driver spends $100 a week on shift administration, where is this accounted for? How are the eight or more fare evasions experienced by 78% of taxi drivers every year accounted for? Who can run a Mobile Phone on $5 a week? What happened to the Bus Driver equivalent’s meal breaks not counted as hours worked? If the driver takes $550 in fares per week, how can they possibly survive?
2.26 To conclude, with the otherwise laudable notion of a $20.00 per hour earning rate, and based on a
model taxi’s operating revenue from fares and costs payable by the driver, the average fare must be $25.00, with existing modeling and structures.
ATDA 2008 IPART Submission: Page 8 of 36
2.27 Will IPART have the temerity to advise the NSW Government that, consistent with its obligation to set fares which cover the operating costs of a taxi service, the 2008 Taxi Fare needs be $25.00. Or will it advise a more rational restructuring with active participation by the stakeholders and recommend a $20.00 fare ?
2.28 It has already, and at least in our view, improperly determined that it will not recommend a
substantive adjustment to redress past Cost Index inequities. Equally, the ATDA has determined that it will seek to oblige IPART to fully pursue its Terms of Reference. Together there is a workable alternative.
2.29 The PWC survey results have a bewildering variety of model taxi parameters, and, for the most part
they are self contradictory. The most consistently repeated model PWC/IPART profiles are :
Two full time bailee drivers driving nine hours a shift for a total of ten shifts a week over 47 weeks and with casual drivers picking up the extra 5 weeks. Average weekly distance of 2500 kilometers per vehicle. An average pay-in of $120 per shift paid to the bailor. Fifteen trips made per shift with an average distance calculated as per the average fare) of 7kms. The taxi runs vacant for 45 percent distance travelled, and the total distance per trip is thus twelve kkm. The taxi costs the Operator $86,632 a year to run.
Viewed as a whole none of this is consistent. Further, the fare revenue generated on this model is insufficient to run a taxi and pay either driver or operator costs, or provide a basic living.

ATDA 2008 IPART Submission: Page 9 of 36
3. The Current Taxi Fare Components 3.1 Every industry has its own particular features, practices and peculiarities – the taxi industry is no
exception. A body, such as IPART, which has had over six years of exposure to, and analysis of taxis could be expected to have a clear grasp of the industry specifics, and especially of the cost/ revenue inputs. In the 2008 commentary on Fares IPART remains confused about the various tariff components terminology and purpose. It advances two flawed examples which are then used to justify later, equally flawed reasoning.
3.2 As an example: one of the 30 kph twenty minute 10 kilometre trip is a one way trip to either
cemetery or madhouse – neither passenger nor driver would accept travel at this rate. Nor is it possible for a trip to occur without incurring some waiting time at a suggested rate of $20.90. IPART’s hypothetical model trip is invalid
3.3 Example Two is of a hot-footed driver in suburban traffic. Maintain a 60kmp average would be
death defying for passenger and driver. If this trip is partly on a freeway, thereby accounting for the phenomenal speed, there would not be the ten minutes at lights. $28.60. Once again IPART’s hypothetical model trip is invalid
3.4 Example Three (omitted by IPART) is the average fare applied to a trip of ten kms on Distance rate
and five minutes at Waiting Time rate, which amounts to $24.75 3.5 According to Ministry Notices, Tariff II is the urban night rate, Tariff III is a Maxi/WATS day rate
and Tariff IV is a Maxi/WATS night rate. IPART has failed to properly comprehend the wording and definitions of tariffs as applied by the Ministry of Transport.
3.6 Flag Fall: this should be sufficient to cover, as IPART says, the fixed costs of pick-up, set-down and
fare transaction. Maintaining the current relativities is actually an incentive for accepting short trips, contrary to IPART’s inferences. Perhaps there should be a surcharge to cover the extra time of credit card fare transactions, in which case $3.50 is reasonable compensation for the driver’s time involved.
3.7 Distance Rate: longer trips costs the same as a shorter trips per kilometer. IPART states the bleeding
obvious that it costs in total more because it is longer. It fails to perceive that the longer trip has a longer return trip (unless networks can improve booking related productivity) and the real cost to the driver is significantly greater than just the one-way costs. IPART is correct in that the Distance Rate encourages a quicker trip, but more because it then gives more time available to the driver to obtain more work. Thus $2.00 per kilometer gives the balancing item for a $20.00 fare, and applies to a 5.5 km hired trip.
3.8 Tariff II: the Night Time Surcharge, which also applies to Weekend and Public Holidays in the
Country, and which in all equity should so apply in Urban areas, was , as IPART confirms, designed to compensate drivers for their late night/early morning presence on the road, thereby ensuring a supply of taxis at otherwise unreasonable and/or uneconomic times. It fulfills those objectives. It should apply to the Waiting Time component as well as the Distance Rate, and the resulting net effect would not be so great as to affect the total fare structure, but it would compensate for those times when, atypically, there is a late night traffic issue, or a requirement by the passenger to wait.
3.9 That it might represent a mark-up of 20 to 30 percent of labour costs is appropriate considering the
fact that overtime and holiday pay rates are in the order of a 50% mark-up. Maybe it should be more than 20% , but that will do.Booking Fee: IPART appears to be suggesting an increase in the Booking Fee to around $4.20, and ties that cost to Network Fees. The traditional interpretation of the Radio Booking Fee was also to cover the dead running costs for the driver to pick-up a booking, both as time and distance costs. The current $1.60 satisfies neither approach, nor does it do anything to promote

ATDA 2008 IPART Submission: Page 10 of 36
customer service by way of M1 “call on approach”,nor does it solve in any way the current problem of one in eight jobs being a M3 “no show”.
3.10 The ATDA suggests a higher rate, with a mandatory “call on approach” confirmation with the Taxi
Number provided. $5.00 would be within customer acceptance levels, and would also ensure service. For the present and saving better services from Networks, $3.50 will suffice.
3.11 The comments made by IPART about regulation of the fee, in view of competition between
Networks implies, quite improperly, an option for a taxi booking offer to negotiate the price. 3.12 Waiting Time: We have been asked to consider the rationale that, according to IPART, the Waiting
Time Component should be reduced to reflect the drivers $19.64 proxy hourly rate. 3.13 What IPART fails to consider is that to cover the totality of his costs the driver must meet all of the
bailment fees, fuel and wash, GST, return tolls, his outgoing expenses and then the notional hourly wage rate.
3.14 These costs vary from a Day Driver at $160 to a Friday Night Driver at $300 per shift of expenses
plus the ten day hours ‘wages’ of $200 or twelve night hours of $240. The average hourly cost is actually $40.90 per hour. The current rate is $46.20. The real waiting time is 5 minutes per trip.
3.15 Yet the driver is hired for about 55% of the hours on the road, and the Waiting Time rate actually
needs to reflect that the opportunity to recover costs should be in the order of $60.00 an hour. Will IPART move to that rate, or, more importantly is it consumer acceptable? The answer is probably $50 an hour or 85 cents per minute, which is about a ten percent increase.
3.16 Luggage Fees: The ATDA has previously suggested that these are not even worth consideration. The
maximum 55 cents is far more likely to be picked up as tip to a co-operative and helpful driver than as a chargeable fee. What does require regulation is the opportunity to charge Tariff III or Tariff IV (Maxi Taxi Rates) when the Station Wagon Taxi or Maxi is being used primarily to transport goods, as a de facto truck or removals van.
ATDA 2008 IPART Submission: Page 11 of 36
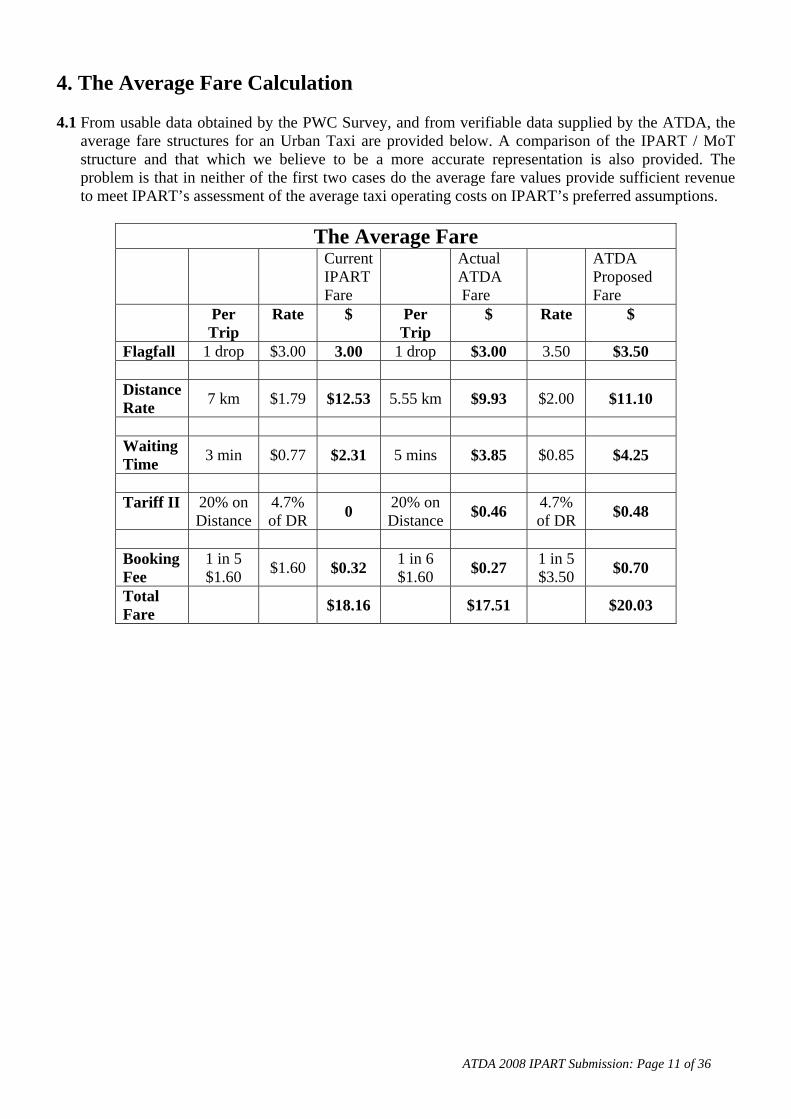
4. The Average Fare Calculation 4.1 From usable data obtained by the PWC Survey, and from verifiable data supplied by the ATDA, the
average fare structures for an Urban Taxi are provided below. A comparison of the IPART / MoT structure and that which we believe to be a more accurate representation is also provided. The problem is that in neither of the first two cases do the average fare values provide sufficient revenue to meet IPART’s assessment of the average taxi operating costs on IPART’s preferred assumptions.
The Average Fare
Current IPART Fare
Actual ATDA Fare
ATDA Proposed Fare
Per Trip
Rate $ Per Trip
$ Rate $
Flagfall 1 drop $3.00 3.00 1 drop $3.00 3.50 $3.50 Distance Rate 7 km $1.79 $12.53 5.55 km $9.93 $2.00 $11.10
Waiting Time 3 min $0.77 $2.31 5 mins $3.85 $0.85 $4.25
Tariff II 20% on
Distance 4.7% of DR 0 20% on
Distance $0.46 4.7% of DR $0.48
Booking Fee
1 in 5 $1.60 $1.60 $0.32 1 in 6
$1.60 $0.27 1 in 5 $3.50 $0.70
Total Fare $18.16 $17.51 $20.03

ATDA 2008 IPART Submission: Page 12 of 36
5. The Taxi Cost Index 5.1 Without much respect we state that IPART and PWC have got it wrong. The Index which has been
modified and re-interpreted for years now would now gratuitously add a non-existent 11 % to the drivers share and maintain past inequitable relativities. Notwithstanding an expensive and long overdue survey, the critical data on which to base firm analysis remains missing.
5.2 Whatever the Operators operating costs actually prove to be - and we await the Taxi Council
Limited’s comments on that aspect - simple logic dictates that their sum must be less than bailment revenue received.
5.3 The disparate model data now assumed by IPART, when constructed into a matrix, is distributed over.
130,000 kilometers in ten shifts over 52 weeks with 15 trips a shift at the average $18.00 fare. For 7 kms a trip (plus a figure of 6 kms vacant derived from the 55% occupancy rate) it simply does not compute.
5.4 To combine operator and driver costs serves no purpose other than to confuse. 5.5 To “lose” the substantial cost to the driver of a daily required wash which in any event is above the
2% threshold is at best mischievous, and at worst old fashioned ‘cabbie bashing’. 5.6 If there is to be a cost item for Notional entitlements for Drivers, should the same not apply to
Operators ? Or as in the case of a few years ago, are entitlements, such as Operator Superannuation, not regularly paid, to be dropped?
5.7 Perhaps either or both PWC and IPART could observe that no entitlements are available to Country
taxi drivers – both notional and otherwise. 5.8 The information in the PWC Report and reflected but not detailed by IPART, is that “Other Costs” are
comprised of $1404 for tyres, $400 for detailing/cleaning and $903 for Government Charges which total $2707. Mentioned are costs for mobile phones, uniforms, driver administration and paperwork, but are unquantified. Yet somehow the detailed $2707 grows to $10,309 - more comprehensive explanation is necessary. We suspect that $2600 of driver wash costs has washed its way in here, but feel that a index proposed by such as PWC should be more explicit.
5.9 The liability of Operators to pay entitlements is not extinguished by any trade-off in bailment rates,
but nor are those entitlements regularly paid. Accordingly we include that $8113 as a contingent liability.
5.10 Equally we note that there should be an item which represents the Operators’ profit margin and
essentially is the reason he is in the Taxi Industry. Not even IPART can assume that the Operator works for love alone.
5.11 The fundamental problem becomes clearer and clearer. The Operators Operating Costs of a Single
Taxi are $78,519, before adding the contingent liability for driver entitlements, or any margin for his own profit, or return on investment. On current bond rate equivalents, and taking up liabilities, the total costs are at least $95,000 pa.
5.12 The only source of funds from which to recover the costs before liabilities or return on investment
(plus a bit of advertising revenue) is the bailment received from drivers. IPART puts that at $120 a shift on 520 shifts a year: Total $62,400 - resulting in an operating loss per taxi $32,600
ATDA 2008 IPART Submission: Page 13 of 36
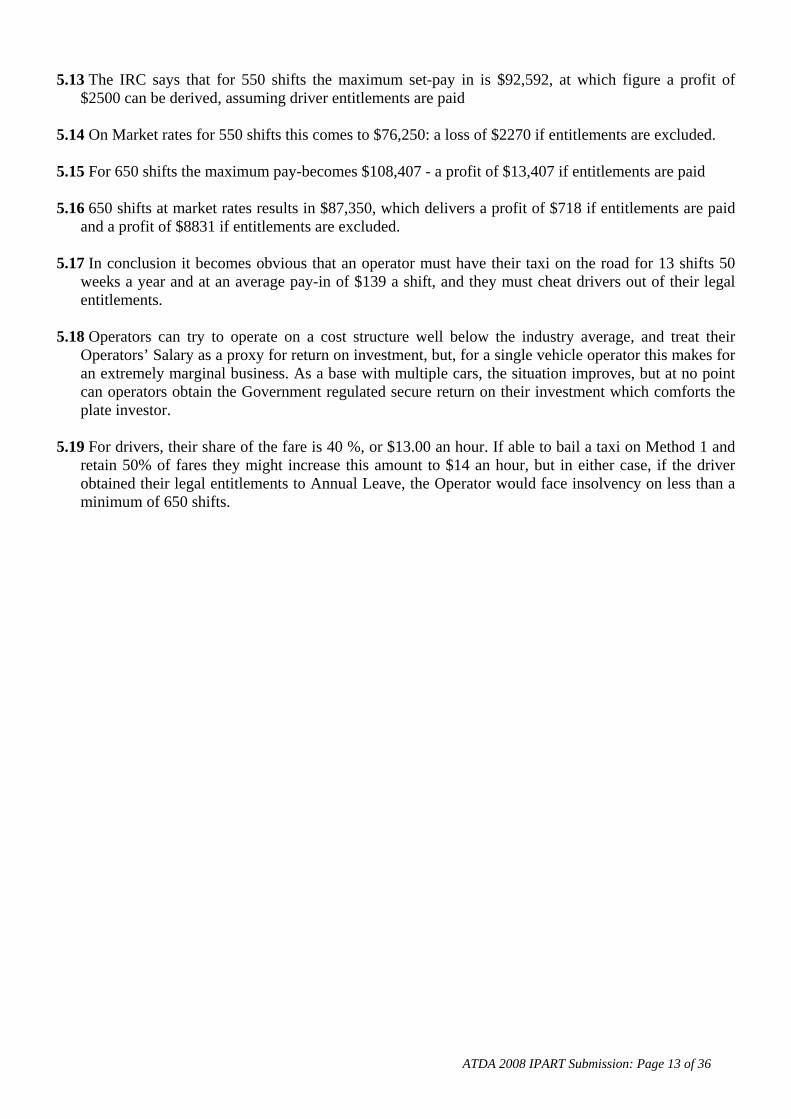
5.13 The IRC says that for 550 shifts the maximum set-pay in is $92,592, at which figure a profit of $2500 can be derived, assuming driver entitlements are paid
5.14 On Market rates for 550 shifts this comes to $76,250: a loss of $2270 if entitlements are excluded. 5.15 For 650 shifts the maximum pay-becomes $108,407 - a profit of $13,407 if entitlements are paid 5.16 650 shifts at market rates results in $87,350, which delivers a profit of $718 if entitlements are paid
and a profit of $8831 if entitlements are excluded. 5.17 In conclusion it becomes obvious that an operator must have their taxi on the road for 13 shifts 50
weeks a year and at an average pay-in of $139 a shift, and they must cheat drivers out of their legal entitlements.
5.18 Operators can try to operate on a cost structure well below the industry average, and treat their
Operators’ Salary as a proxy for return on investment, but, for a single vehicle operator this makes for an extremely marginal business. As a base with multiple cars, the situation improves, but at no point can operators obtain the Government regulated secure return on their investment which comforts the plate investor.
5.19 For drivers, their share of the fare is 40 %, or $13.00 an hour. If able to bail a taxi on Method 1 and
retain 50% of fares they might increase this amount to $14 an hour, but in either case, if the driver obtained their legal entitlements to Annual Leave, the Operator would face insolvency on less than a minimum of 650 shifts.

ATDA 2008 IPART Submission: Page 14 of 36
5.20 Table of Urban Taxi Costs calculated as per Method 1:
Urban Taxi Cost Index Method 1 Drivers’
Costs IPART ATDA ADTA Operators Costs IPART Re
Weighted 520
shifts 550 shifts
650 shifts
50 / 52 weeks
% %
Notional Wages
91,915 Plate Lease Cost
25,000 13.00 11.92%
Insurance 13,536 7.04 6.45% Bailment 76,250 87,350 Operator Salary 9,617 5.00 4.48% Network Fees 6,564 3.41 3.13% Fuel 13,780 17,796 20,362 9.55% Parts & Panels 5,018 2.61 2.39% Wash 3,000 3,500 1.67% Maintenance 4,368 2.27 2.08% Operating Expenses
6,400 7,500 3.57% Vehicle Lease 4,107 2.14 1.94%
GST Payable
6,692 7,586 3.62% Other 10,309 5.36 4.91%
Net Earnings
73,612 83,451 40.26%
Sub Total: 78,519 Driver
Entitlement Contingent Liability
8,113 4.22
Sub Totals
$105,695 183,750
209,750 : $86,632,
Operators Margin
$8,368
Total Revenue
192,327 183,750 207,750 Total Costs $95,000
ATDA 2008 IPART Submission: Page 15 of 36
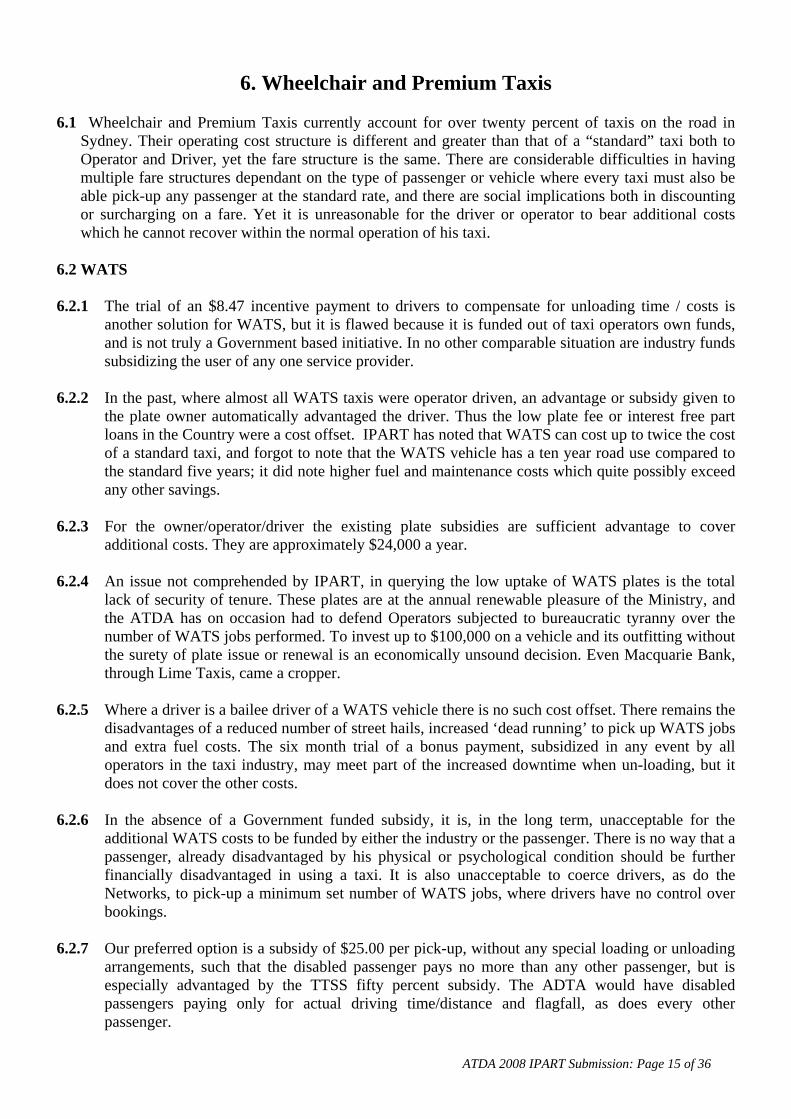
6. Wheelchair and Premium Taxis 6.1 Wheelchair and Premium Taxis currently account for over twenty percent of taxis on the road in
Sydney. Their operating cost structure is different and greater than that of a “standard” taxi both to Operator and Driver, yet the fare structure is the same. There are considerable difficulties in having multiple fare structures dependant on the type of passenger or vehicle where every taxi must also be able pick-up any passenger at the standard rate, and there are social implications both in discounting or surcharging on a fare. Yet it is unreasonable for the driver or operator to bear additional costs which he cannot recover within the normal operation of his taxi.
6.2 WATS 6.2.1 The trial of an $8.47 incentive payment to drivers to compensate for unloading time / costs is
another solution for WATS, but it is flawed because it is funded out of taxi operators own funds, and is not truly a Government based initiative. In no other comparable situation are industry funds subsidizing the user of any one service provider.
6.2.2 In the past, where almost all WATS taxis were operator driven, an advantage or subsidy given to
the plate owner automatically advantaged the driver. Thus the low plate fee or interest free part loans in the Country were a cost offset. IPART has noted that WATS can cost up to twice the cost of a standard taxi, and forgot to note that the WATS vehicle has a ten year road use compared to the standard five years; it did note higher fuel and maintenance costs which quite possibly exceed any other savings.
6.2.3 For the owner/operator/driver the existing plate subsidies are sufficient advantage to cover
additional costs. They are approximately $24,000 a year. 6.2.4 An issue not comprehended by IPART, in querying the low uptake of WATS plates is the total
lack of security of tenure. These plates are at the annual renewable pleasure of the Ministry, and the ATDA has on occasion had to defend Operators subjected to bureaucratic tyranny over the number of WATS jobs performed. To invest up to $100,000 on a vehicle and its outfitting without the surety of plate issue or renewal is an economically unsound decision. Even Macquarie Bank, through Lime Taxis, came a cropper.
6.2.5 Where a driver is a bailee driver of a WATS vehicle there is no such cost offset. There remains the
disadvantages of a reduced number of street hails, increased ‘dead running’ to pick up WATS jobs and extra fuel costs. The six month trial of a bonus payment, subsidized in any event by all operators in the taxi industry, may meet part of the increased downtime when un-loading, but it does not cover the other costs.
6.2.6 In the absence of a Government funded subsidy, it is, in the long term, unacceptable for the
additional WATS costs to be funded by either the industry or the passenger. There is no way that a passenger, already disadvantaged by his physical or psychological condition should be further financially disadvantaged in using a taxi. It is also unacceptable to coerce drivers, as do the Networks, to pick-up a minimum set number of WATS jobs, where drivers have no control over bookings.
6.2.7 Our preferred option is a subsidy of $25.00 per pick-up, without any special loading or unloading
arrangements, such that the disabled passenger pays no more than any other passenger, but is especially advantaged by the TTSS fifty percent subsidy. The ADTA would have disabled passengers paying only for actual driving time/distance and flagfall, as does every other passenger.
ATDA 2008 IPART Submission: Page 16 of 36
6.2.8 The ATDA would have the $25.00 payable by those existing Taxi Networks who are already beneficiaries, and have been advantaged for some twenty years, of the Nexus Plates granted to them, both as unrestricted plates and as WATS–type plates.
6.2.9 We proposed this last year and still await comment or reaction from IPART. 6.2.10 In our view such an amount would be sufficient to not only cover additional costs, but also to
provide incentives to pick-up WATS jobs. The impediment of the current Zero 200 booking service as the primary dispatcher, and as mandatory hardware equipment in all taxis is a folly.
6.2.11 Each WATS driver should have access to all available forward bookings so he can more
efficiently forward plan his working schedule. Most WATS jobs are pre-planned by the passenger, most have a favourite driver, and most have a driver who is familiar with their needs.
6.2.12 The simple logic is to match up driver and passenger. Zero 200 already promotes such
driver/passenger private bookings and publicly comments that up to half the work is covered in this way. Yet their administration is such that only jobs booked through the Network are recorded as WATS jobs, and there is a continuing issue about WATS vehicles fulfilling their so-called “quota” of jobs. But nowhere in plate license conditions is the magical quota specified.
6.2.13 IPART has commented that the low number of responses to the PCW survey invalidated the
received WATS data. The ATDA would question this, inasmuch as of the now 450 WATS vehicles, there were 72 WATS respondents or 16%. Data from one operator who had 50 vehicles (more likely than not Lime Taxis) should be of all, the most reliable, given the management record keeping practices of MACT. Informed analysis of their data would be most illuminating.
6.2.14 From the personal records of one driver, the earnings per kilometer are well below industry
averages at $1.35 per kilometer, and this is reflected in average number of hirings and total kilometers.
6.3 Premium Taxis 6.3.1 The application of a premium booking fee as an additional charge on any booking for a Premium
taxi is one solution to meet costs not otherwise recovered. 6.3.2 Many of the Premium Taxis now operating under such fleet banners as Silver Service, Diamond,
Prestige and True Blue, as well as the “trunk” groupings have solved the problem for themselves by charging a premium “set fare” and running off meter. This is an illegal solution, as all taxis are required to use the meter and charge no more than the metered fare. It is however common practice in close to twenty percent of Sydney cabs. Given the level of competition presented by Hire Cars, operating at a lower total cost structure than taxis, it may well be a beneficial Regulatory change to permit an “agreed” fare where passenger and driver may freely determine such a fare. Provision already exists for an ‘out-of-area’ fare to be negotiated prior to the journey, and there is no particular reason for that negotiation not to be available ‘in-area’.
6.3.3 If for no better reason than ensuring the safety of the driver and as a reduction in fare evasions, the
agreement on a set and pre-paid fare needs consideration. 6.3.4 Issues of touting and fare gouging do need examination, but are not incapable of resolution. 6.3.5 IPART has raised as an issue the maintenance of minimum standards of quality and service, and
our initial comment is that all taxis must be of a suitable standard for all passengers, and that a
ATDA 2008 IPART Submission: Page 17 of 36
premium fee, or the application of a set fare should only apply to a booked taxi service where there is an informed passenger with choice options. We note, and repeat, at this point the long standing issue of the ATDA with the Taxi Network performance and KPI’s on passenger service both as the loss of bookings passed on to taxis, and the response time from booking. We would see an open and competitive market for taxi bookings such that a passenger requirement is efficiently filled, rather than that Network exclusivity is protected. As such we would envisage a premium fee on all bookings, and / or an agreement on the set fare, provided that a control flow of records regarding the booking and trip are available and publicly presented to the Ministry, in a timely and transparent manner.
6.3.6 It is surely appropriate that the traveling public be able to assess the actual quality of service
maintained by a network or booking service prior to accepting any surcharge. 6.3.7 It is up to both the industry and IPART to establish and ascertain the incremental operating costs
of a Premium Taxi and to balance those extra costs against incremental productivity of the taxis, especially as regards levels of bookings, average length of journey and number of job hirings.
6.3.8 We have no issue with the reality of a higher level of operating costs, but there needs be adequate
quantification and verification as part of the process. We suggest that as a model, it is the Premium Taxi which is most likely to be owner /operator driven as one of the two drivers, and on an eleven shift / 50 week a year basis.
6.3.9 The ATDA attaches a spreadsheet of its estimates of the Premium Taxi Model which indicates
that although the average earning per kilometer are the same as for Standard Taxi, it is the extra length of journeys, primarily from booked jobs, that substantially increases earnings. We note also a higher market pay-in. Booked jobs in this sense also include “trunk” and private bookings.
6.3.10 Our calculations are that a negotiated premium booking fee, together with greater productivity,
will sufficiently compensate for any extra operating costs, and avoid the impracticalities of a dual fare structure.

ATDA 2008 IPART Submission: Page 18 of 36
7. Productivity 7.1 IPART adopts as a statement of faith the generally agreed notion that in a competitive market, firms
are constantly innovating to improve production methods, and reduce costs in order to undercut competitors and improve market share whilst maintaining profit levels.
7.2 Consequentially, IPART has applied a productivity adjustment to offset (reduce) input cost increases
on the assumption that there are productivity gains; that negative adjustment will encourage productivity growth; and that such an adjustment will ensure consumer benefit.
7.3 Sound academic reasoning, but not for the Taxi Industry. Other than for hungry drivers cutting off
their fellows for a fare, it is not a freely competitive industry. Nor, on IPART’s figures are there profit levels to maintain. Total industry costs per taxi exceed total industry revenue per taxi.
7.4 The monopolistic overlay of Cabcharge and its effectively subsidiary Taxi Networks act to negate
competition in the booking and despatch of taxis. A pay-in structure which is very much the externalized Industrial Relations Commissions’ maximum pay-in less the non–paid entitlements negates base operator incentives for productivity. A maximum metered fare negates downward price negotiation by the driver, and encourages other illegal possibilities.
7.5 Cost items beyond the purview of IPART permit stakeholders to take excess profits which are then
validated by the Taxi Cost Index, or as with the credit card surcharges grow and flourish parasitically. 7.6 The assumption that there is more scope for drivers to make labour productivity gains is invalid. GPS
devices and the use of Toll Roads lead to travel time savings, but, from the data, lessening demand and traffic congestion has more than outweighed any productivity gain. Certainly the drivers could work more hours and drive more kilometers, but is that the objective of any sane analyst?
7.7 The dot point sources of potential productivity growth [ p52] are more a source of wonderment than
enlightenment.. 7.8 Most are activities which a Taxi Network might or should engage in, but have no bearing on the
productivity of driver or operator, nor of their cost structures. 7.9 Fuel efficiency is one such issue. 7.9.1 Since 2001 IPART and the Taxi Council Limited have manipulated the costs borne by the Taxi
Driver for fuel by varying the ‘model’ kilometers driven, and now we are down to 130,000 kms. But the usage rate of 5 kms per litre remains unquestioned. In the traffic congestion of 2008, in summer with Air Conditioning, with 20% of taxis non-‘Standard’, and with base cab operators unconcerned about fuel efficient tuning, this is more an urban 4 kms per litre.
7.9.2 The measurement of the TCI of LPG fuel at 50 cents a litre, and the application of a twelve month
average pump price may well produce a 60 cent current price; but this does nothing for the driver faced with unavoidable price gouging of 80 cents and price spikes outside the average. Nor does it assist him mid-year when he is paying market prices and receiving historical cost inputs.
7.9.3 The Airlines are not so bound, nor are the Toll Operators, and nor should a Taxi Industry where
“smart” meters can be remotely adjusted at minimal cost, other than once a year. 7.10 An Informed IPART is another.

ATDA 2008 IPART Submission: Page 19 of 36
7.10.1 IPART note on Page 56 that it considers four critical input/output measures required for a driver productivity assessment as currently available to the Taxi Industry but not provided to IPART, and speciously determines to use broader transport industry data, and bemoans the lack of data.
7.10.2 Not so. The first item – the number of Taxi Licenses - is available and has been used in all IPART
reports from the Ministry of Transport and the Taxi Council publicly. And the 1999 Parry Report analysed plate ownership sufficiently to establish that the current model of a single operator is unsound.
7.10.3 The other three, number of passenger trips, kilometers paid and revenue generated, and hours on
the road are available. The ATDA has supplied that data to IPART many times over, and in verifiable form. Other stakeholders, with equal access, have not been so forthcoming.
7.10.4 Equally available and relevant is the revenue per distance / time generated, and total kilometers
driven. Every taxi‘s meter can be read for its last shift and for its totals. Instead of pussy-footing disclaimers, IPART should have consulted as it may, by arrangement through the Ministry, and could even have obtained the information by direct contact with drivers.
7.10.5 In any event we attach information obtained from meter readings covering over 200,000 urban
trips, 20,000,000 kilometers and $35,000,000 of revenue. Statistically sound data on which to work.
7.10.6 The spreadsheets attached gives a shift by shift analysis of an average urban taxi. 7.11 Critical Analysis of the PWC Survey is an issue. 7.11.1 Of the 30,000 survey forms distributed, only 1767 were completed, and PWC claims a 95%
confidence level +-2.26%. The ATDA had suggested face-to-face interviews would be more productive and, long term, less costly. Because of the manner of wording the results are in many cases unusable. The language, layout and complexity of the forms is lamentable and should have been modified from the start. A waste of taxi drivers own money. We now have disparate data with such irreconcilable highlights as:
7.11.2 Tyres: from 137 operator respondents the survey [and thence IPART] produces a cost per tyre of
$85. The cost from other data sources is $160, for new tyres.. For six years drivers were disadvantaged by a cost input of [200] $3920. Now it’s $1260. It well may be that most base cabs use re-treads at $50.00 or less, and many safety conscious operators may, as the Taxi Council Limited suggests, use new tyres; it would be better to base the index on validated and verifiable data.
7.11.3 Uniforms: from 156 operators we now have a cost per vehicle of $275. For many years this
became a factor in the Operators Cost Index of $ 2365. Given the almost total industry wide disregard of the legal requirement to supply uniforms, this is of no surprise. The issue that arises is why other so-called costs that are similarly disregarded are included – entitlements for example.
7.11.4 IPART would consolidate those cost items of less than 2% of the total in an “other” group;
however it also mixes the driver and operator costs into one item, and thereby creates an inability to properly allocate costs.
7.11.5 Fares: this was the area of most concern to IPART and the Industry. We all desperately need to
confirm a functional industry model against which to test specific data, and to validate the average
ATDA 2008 IPART Submission: Page 20 of 36
fare. The request to separate day and night shift data was ignored. Maybe the raw data can still separate standard and premium data. Maybe an industry expert could help. But …
7.11.6 Daily Taxi Wash: unintentionally left blank by PWC and IPART the actual cost to drivers
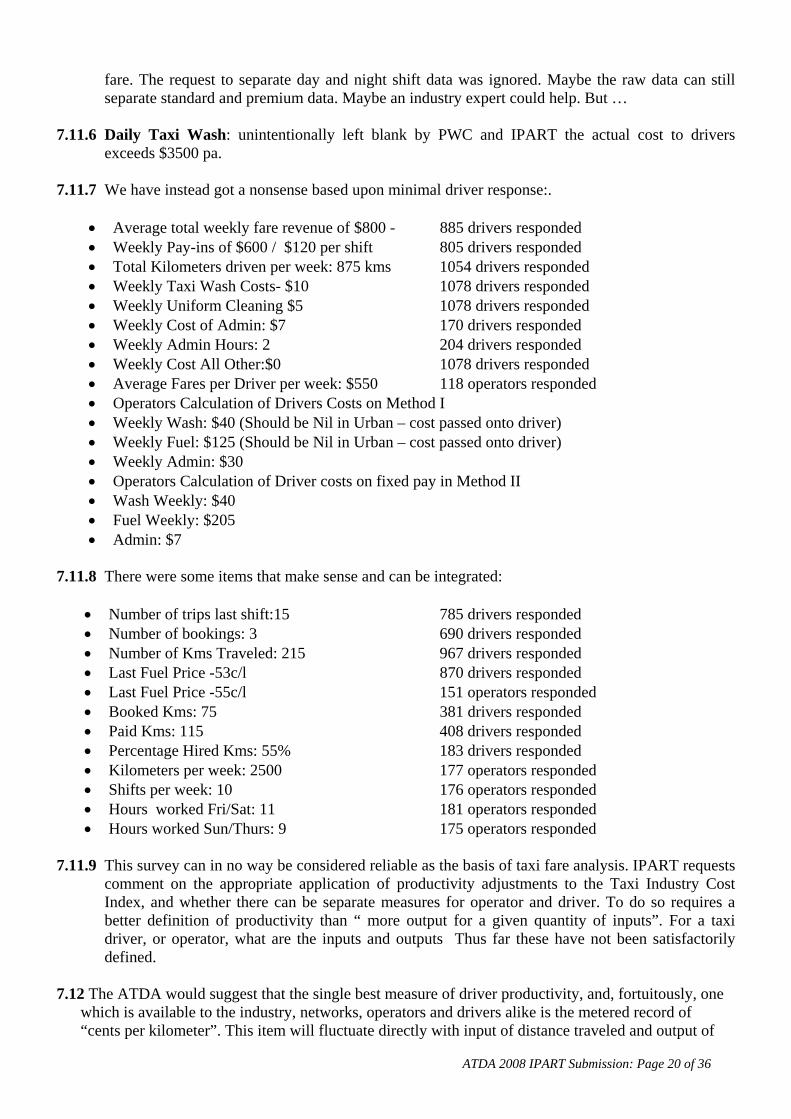
exceeds $3500 pa. 7.11.7 We have instead got a nonsense based upon minimal driver response:.
• Average total weekly fare revenue of $800 - 885 drivers responded • Weekly Pay-ins of $600 / $120 per shift 805 drivers responded • Total Kilometers driven per week: 875 kms 1054 drivers responded • Weekly Taxi Wash Costs- $10 1078 drivers responded • Weekly Uniform Cleaning $5 1078 drivers responded • Weekly Cost of Admin: $7 170 drivers responded • Weekly Admin Hours: 2 204 drivers responded • Weekly Cost All Other:$0 1078 drivers responded • Average Fares per Driver per week: $550 118 operators responded • Operators Calculation of Drivers Costs on Method I • Weekly Wash: $40 (Should be Nil in Urban – cost passed onto driver) • Weekly Fuel: $125 (Should be Nil in Urban – cost passed onto driver) • Weekly Admin: $30 • Operators Calculation of Driver costs on fixed pay in Method II • Wash Weekly: $40 • Fuel Weekly: $205 • Admin: $7
7.11.8 There were some items that make sense and can be integrated:
• Number of trips last shift:15 785 drivers responded • Number of bookings: 3 690 drivers responded • Number of Kms Traveled: 215 967 drivers responded • Last Fuel Price -53c/l 870 drivers responded • Last Fuel Price -55c/l 151 operators responded • Booked Kms: 75 381 drivers responded • Paid Kms: 115 408 drivers responded • Percentage Hired Kms: 55% 183 drivers responded • Kilometers per week: 2500 177 operators responded • Shifts per week: 10 176 operators responded • Hours worked Fri/Sat: 11 181 operators responded • Hours worked Sun/Thurs: 9 175 operators responded
7.11.9 This survey can in no way be considered reliable as the basis of taxi fare analysis. IPART requests
comment on the appropriate application of productivity adjustments to the Taxi Industry Cost Index, and whether there can be separate measures for operator and driver. To do so requires a better definition of productivity than “ more output for a given quantity of inputs”. For a taxi driver, or operator, what are the inputs and outputs Thus far these have not been satisfactorily defined.
7.12 The ATDA would suggest that the single best measure of driver productivity, and, fortuitously, one
which is available to the industry, networks, operators and drivers alike is the metered record of “cents per kilometer”. This item will fluctuate directly with input of distance traveled and output of

ATDA 2008 IPART Submission: Page 21 of 36
dollars earned at the metered rate. Time per trip, nor hours on the road are not factored. Tolls are excluded, Numbers of trips are irrelevant. Revenue from fares at Waiting Time Rate and Tariff II are included.
7.13 As a statistical check the c/km validates all other data. As at March 2008 the industry wide [with the
exception of WATS vehicles] rate is $1.60. 7.14 For the Operator the issue is complicated. At the moment, on cost data apparently accepted by
IPART, and less than previously admitted, the total revenue received by the operator as his bailment income from drivers is significantly less than his total expenses. IPART states its own confusion at this anomaly. How can it then even begin to consider a productivity adjustment when the industry is so far in the red?
7.15 The problem is not in the argument, it is in the lack of data supporting any reasoned argument. Until IPART adopts a balanced and rational model, capable of sustaining its assumptions on proven data, this whole issue is an academic nonsense. The ATDA, as the one force for commonsense, offers the validated information and presents a working model for both Standard and Premium Urban Taxis. 7.16 But we must go further. IPART must set a fare such that the taxi earning rate per kilometer generates
revenue based on average kilometer driven per shift to provide a determined hourly net earning rate to the driver [ net of GST and his work related outgoings] and of which half is sufficient to cover the operators costs, fuel and wash and a margin for profit.
7.17 Once the taxi driver is assured of a net standard hourly rate of at least $20.00, then we can discuss
productivity adjustments. That fare is, incidentally, $25.00 on existing modeling. 7.18 The ATDA has a revolutionary alternative. Increase productivity. 7.18.1 Modify existing work practices such that the average taxi does two more jobs per shift, and such
that the average cab is on the road at least 650 shifts a year. Then the average fare can be $20.00.
ATDA 2008 IPART Submission: Page 22 of 36
8. Country Taxis 8.1 We regret that in the limited time available to the ATDA to prepare this submission, and still drive a
taxi four nights a week, the principal contributor has not pursued the interests of Country Taxis. We will endeavor to give greater detail during the process.
8.2 Generally we see no reason for a taxi driver to earn other than the same rate of net earnings= , or to
have other than the same entitlements, wherever he works. There well may be a local area subsidy for extra costs or particular hardships, but the underlying rate should be the same. Likewise for the passenger, the rate for a comparable journey should be constant, with marginal variations for variations in average distances.
8.3 We would rather see a Governmental based subsidy that evens out differing rates of fuel costs than
that the burden be paced on drivers. And, in line with the Madden Safety Taskforce Report, we see all NSW taxi drivers as entitled to a safe and secure workplace.

ATDA 2008 IPART Submission: Page 23 of 36
9. Superannuation 9.1 Between IPART and the IRC the issue of Taxi Driver Superannuation has been bouncing back and
forth awaiting Ministerial intervention that never comes. The Transport Workers Union fought a long battle to have Superannuation incorporated into the Taxi Contract Determination, but the final activation awaits a specific recommendation by IPART to allocate a portion of the average fare to Superannuation. Will it ever happen?
9.2 As self employed contractors it is up to taxi drivers to fund their Superanuation personally; but it is
necessary to incorporate into the cost of the services they provide an amount [9% of net income] from which the funds are derived. Taxi fares have never been adjusted for Driver Superannuation, and such adjustment is long overdue.
9.3 The notional $20.00 an hour simply does not cover Superannuation, yet it is a mandatory part of the
package of the bus driver with whom IPART makes comparisons.

ATDA 2008 IPART Submission: Page 24 of 36
10. The Taxi Operators Operating Costs 10.1 The ATDA will delay its comments on the detail of the Operators operating costs until it has had the
opportunity to analyse the Taxi Council Limited’s submission. We do pre-empt our position that the revenue obtained by bailment to taxi drivers must exceed the operators operating costs, and that an Operators’ Cost Index greater than total bailment is fundamentally flawed.

ATDA 2008 IPART Submission: Page 25 of 36
11. Taxi Ownership and Operation 11.1 From the survey, PWC has concluded that the typical taxi is operated as a single unit by one
Operator. Use of median data validates this conclusion, but it is not reflective of Urban taxis. 11.2 The Parry Report of 1999 and MoT data indicate that a majority of taxis are operated by an operator
operating more than one taxi, and this impacts significantly on the cost inputs per taxi. Additionally, from the survey data, over 70% of operators are also a driver of the taxi. This tends to confirm the kilometer data of 2500 kms, but leaves in confusion the data of total fares being $550 per week.
11.3 IPART needs to delve a little deeper and ascertain an accurate weighted average of taxis per
operator. It also needs consider the proportions of Taxi Plate Ownership per individual owner/driver and investor/multiple plate owner. Even more relevant is the head lessee control over plates leased by the ‘owner’ to network subsidiaries who then effectively control the plate and its network allocation. And that is the issue covered by the required consideration of monopoly influences in the Terms of Reference.

ATDA 2008 IPART Submission: Page 26 of 36
12. The Missing Cost Item I 12.1 There is academic merit in the exclusion from analysis of one particular related cost item that
impacts significantly upon the average fare paid by consumers. That item is in the order of an extra 11% on over half the taxi fares in NSW, and it is cost which escalates directly with every recommended fare increase, without scrutiny or validation of cost increases.
12.2 We refer of course to Cabcharge and the almost 10% plus GST surcharge on non-cash fare
payments. (On Cabcharge’s own account cards GST is not payable on the 10% surcharge.) 12.3 This is a monopoly based charge borne by passengers, over which IPART does not, or perhaps
cannot exercise an interest. Whatever, it is a failing to safeguard the interests of the people of NSW from the abuses of monopoly power.
12.4 The ATDA is firmly committed to the introduction of alternative credit card and account card
processing methods, such as would benefit consumers and drivers, and is firmly committed also to freeing up the industry to competitive forces such as would break the current monopolistic stranglehold.
ATDA 2008 IPART Submission: Page 27 of 36
13. The Missing Cost Item II 13.1 The ATDA, after several years of IPART submissions, continues to be mystified, at the refusal to
acknowledge the GST component of fares for which the taxi driver is accountable. It has determined that the cost of administration occurs, and even allows two hours weekly, but not that GST is an amount to be deducted from fares and passed on to the Commonwealth Government.
13.2 GST is included in the average fare at one end of the process. It is included in the pay-ins made from
baillee to bailor, it is included in LPG and other fuel costs. It is included in the daily wash. A driver may include it in his tax deductible expenses as expenses incidental to his business. But then it stops.
13.3 IPART appears to resolutely believe that the remaining monies, having paid out the bailment, fuel
and wash, all then go to the driver as his “wages”. IPART still will not itemize the GST as a deduction prior to determining the retained earnings of the driver, and prior to assuming a “wage”. The GST ten percent is about $7500 per taxi. Too big an amount to be passed over, and far too big an amount to be included in the drivers share of the fare.

ATDA 2008 IPART Submission: Page 28 of 36
14. The Missing Cost Item III 14.1 Equally curious in the strange saga of IPART’s analysis is the missing item of “Operator Profit
Margin”. 14.2 For a few years we thought it to be a proxy, represented by a hugely inflated “Operators Salary
Equivalent”, but now that is claimed to be some seven and a half hours a week that the sole taxi operator works on administrative function per cab. If only he would fix up the cameras at the same time. Idly, we wonder how he fills in the rest of his week – is he the full time day driver, and if so, what’s the real change-over time cost? Given that it is now a cost item per se, and as PWC/IPART suggest, all cost items are now accounted for, or at least all operators cost items are accounted for; where is the profit margin such as would induce an operator to stay in the taxi industry?
14.3 The Plate Investor is getting his bond rate equivalent, but the Operator is doing it all for love. No
doubt his problems are even greater, since the total bailment income is substantially less than his total costs, even before considering the profit margin. Just when are the calculations going to reflect reality?
ATDA 2008 IPART Submission: Page 29 of 36
15. The Missing Cost Item IV - The Taxi Drivers Operating Costs 15.1 Just because IPART has ignored the reality that Drivers’ also have operating costs in their own, self
employed, business does not mean that the ATDA will cease presenting the case to recognize those costs as part of the total operating costs. Just because PWC omitted some relevant questions and framed others so poorly that no usable information was obtained, does not negate the reality that taxi drivers have expenses in their operating the taxi service.
15.2 Who pays for the GPS, the uniforms not supplied, or their laundry? If the operator can include the
cost of these in accounting and administrative expenses, why not the driver – who actually bears these costs? The mobile phone used for safety and communications does not cost $5 a week.
15.3 For IPART to blend all “other” costs into one does not adequately reflect or identify the distinct and
separate costs of drivers and operators. And neither the Issues paper, nor the PWC Report offer transparent and verifiable data, let alone its validation.
15.4 Fare Evasions are a cost. The downtime of reporting crimes is a cost. Meal allowances and late night
transport are costs. Even ATDA membership at a mere $35 a year is a cost. All and many more are legitimate and reason able deductions from revenue prior to determination of taxable earnings. In any other industry they are employer-payable cost expenses. Our $7000 to $7500 is conservative, reasonable and forms a part of the operating costs of a taxi.
15.5 Where is the $300 to $500 pre-payment on e-tags as recommended by the RTA counted? It’s a
requirement on Networks to ensure that taxis are so equipped, but who pays? Just another minor detail which has been ignored.

ATDA 2008 IPART Submission: Page 30 of 36
16. IPART and its Wage Fixing Role 16.1 The Industrial Relations Commission, which regulates the award wages and conditions of Taxi
Drivers in Newcastle, Sydney and Wollongong (but ignores the rest of NSW) as well as the Central Coast through the Taxi Drivers Contract Determination, (but not elsewhere in NSW) will no doubt be interested in IPART’s apparent determination that taxi drivers are the equivalent of bus drivers, should, or do earn the same hourly rate and are yet are paid Annual Leave holidays at the taxi driver rate.
16.2 Labor economists will no doubt be fascinated by the facile conclusion made that labour costs are
equated with wage rates. 16.3 The 2008 upgrade of Notional Taxi Drivers Wages to equate with the standard 38 hour wage rate of
a Bus Driver, and thence to use this as the extraordinarily simplistic measure of the operating costs of taxi drivers is totally unacceptable.
16.4 The impact of doing so perpetuates the imbalance of cost relativities that have unfairly affected taxi
drivers since IPART started using the distorted, and now disproven data of the Taxi Council Limited’s original PWC survey. If IPART were to go back to the 1999 Parry Report they would be less than astounded to see operator costs much more similar to the 2008 results.
16.5 The Contract Determination clearly spells out the requirement on Bailors to pay their permanent
Bailees specific amounts for Annual Leave (on Method II), Sick Pay, an hourly Down Time Rate ($17.60) and for Method I drivers a percentage of earnings as Annual Leave. All of these were developed out of the 1984 Agreement with an underlying 50 /50 share of fares.
16.6 In the IRC, in sworn statements by executive officers of the Taxi Industry Association [attached] Mr
John Bowe quite unequivocally said that the market rate “discount” on maximum set pay-ins was proportionate to the non-payment of entitlements. For IPART to now use as a Notional Entitlements Discount factor the abstracted Bus Driver wage rate is inappropriate.
16.7 How IPART or PWC extends this to Country Taxi Drivers who have neither Award or Contract
Determination nor any entitlements is mysterious at the least. 16.8 How PWC can propose or sustain an argument that the $20.00 per hour bus driver rate, without
reference to the add-ons for fare collection, meal breaks, continuous hours and number of days of rostered work, even compares to the taxi driver’s expectations is bizarre. That $20.00 would be a suitable rate of net earnings is welcomed, but there must be recognition that, to achieve such a net rate, the gross rate is about $26.00 per hour. Plus 9% for Superannuation.
ATDA 2008 IPART Submission: Page 31 of 36
17. Standards of Service 17.1 IPART’s Terms of Reference also require consideration of the quality, reliability and safety of the
[taxi] services and of suggested or actual changes. For the 2008 issues, there has been no comment. The Taxi Service Standards, drafted back in 1993, are still not available. The Taxi Task Force considered them at length two years ago. The Department set out an Urgent Issues Paper over a year ago.
17.2 It is no understatement to describe these matters as being till in limbo. And the issue is that there are
no penalties in default. Elsewhere in the Regulations, drivers face a monumental array of penalties for even the most minor breaches; but a non-responsive network, on whose watch a driver is murdered, has no obligations.
17.3 As requested by the ATDA, and as a part of reasoned comment by stakeholders, at the very least, the
Ministry of Transport should make available current performance data of both Networks and Drivers. The arguments on Productivity relate directly to the Key Performance Indicators of Networks, and to the Complaints data on Drivers. Where is the data?
17.4 Ever suspicious, and on the basis of previous years records, the ATDA suspects the worse. We know
that Networks in the past have been unable to meet the requirement that 85% of bookings be picked up within 15 minutes. We know that literally millions of bookings are not passed on to drivers for acceptance. And, in the past we were able to sight the two comparable measures of complaints and justified complaints against drivers. Where is that information now?
17.5 The comparison of WATS Data on page 44 of the issues paper refers erroneously to a page reference
in the 2007 Report and maintains the error of comparable pick-up performance. The average WATS pick up is 71% within 15 minutes of the call being answered, and that is laudable. Yet the Other Networks figure is not 92% as quoted: it is (according to the data on page 34 of the 2007 Report), a miserable 65%.
17.6 Unless that service standard has been vastly improved, there are no network productivity
improvements to consider. But, from the guidelines of IPART, is that a cause to adjust fares up or down ? As we read it, a productivity improvement causes a downward fare adjustment; are we here being confronted with a justification by networks to increase fees because of poor performance?
17.7 The Passenger Transport Regulations have been amended to require cameras in all NSW Taxis. For
Urban taxis this will impact prior to the planned recommendation report: for Country Taxis it is a post IPART certainty. Where is the cost counted? Or will it be a post hoc adjustment, (like fuel costs) that leaves the operator carrying the cost for another twelve months ?

ATDA 2008 IPART Submission: Page 32 of 36
18. Perspective – what the numbers were:
18.1 Before embracing the new Model of PWC it is salutary to compare the new and, no doubt, vastly improved snapshot of the Taxi Industry with the abomination up with which we have had to put. No doubt all can be excused on the basis that it was only the year to year index changes which were been measured. Yet the result of this short-sighted practice is that fundamental errors in base values have caused a long standing inequity in fare setting and fare sharing.
18.2 IPART needs to get the model and the base data right before another five years of erroneous
procedure. The correct weighting of all participant costs is absolutely vital for a fair and transparent process. As it stands, IPART is about to launch yet another unrepresentative set of weights as the base for the next five years.
18.3 The ATDA would make a strong comment, unusually, that Taxi Drivers have been massively
disadvantaged over many years by the flaws and incorrect base data on which previous relativities have been calculated. That is why the new “Notional Taxi Driver Wage” is an anathema, and must be examined and analyzed as the sum of taxi diver operating costs.
18.4 Six years of disputing the appropriateness of operator costs are apparently justified by what is
certainly a ‘bodgy’ survey. By chance the total costs are now about right, but we await the input from the Operators champion, the Taxi Council Limited, as to their version of the truth. For our part it is simply foolish to cost, say, tyres at either $1200 or $4000 - just get it right!
18.5 Taxi Operational Costs:
Taxi Operators Operating Costs 2007 // plus IPART 2008 TDA Estimate IPART 2006 IPART 2008Bailment Income 83250 62400 Advertising Income 1250 0 Vehicle Lease Expenses 8500 9498 4107 Insurance 14500 14396 13536 Government Charges 800 811 903* Network Fees 7000 6849 6564 Plate Lease Fees 18200 21674 25000 Annualized Establishment Costs 1200 1661 1200* Maintenance Labour 5500 9163 4368 Vehicle Parts & Panels 8000 11709 5018 Cleaning 400 480 400* Tyres 2000 3920 1260* Operators Salary Equivalent 2000 14488 9617 Other 1150 3854 6311*
Sub Total 70150 98603 78244 Uniforms 500 2369 275* Driver Entitlements 6500 4827 8113
Total 77150 105159 86632 Marginal Return : Profit/ Loss $7350 -$20659 -$24232
ATDA 2008 IPART Submission: Page 33 of 36
19. Two Social Issues 19.1 Two social issues overdue for consideration are the workplace safety of taxi drivers and the average
hours of work. In the drive to achieve a basic living from driving a taxi, the drivers have been obliged to work longer hours and with less attention to their personal safety. There are no maximum hours of work for a taxi driver. The bus driver, with whom he is now compared, operates under stringent and reasonable limitations on the length of shifts and the number of shifts over a period.
19.2 A few rocks through bus windows initiate a major response from the Ministry for Transport and the
Public Transport Authorities. Routes are changed, on-line cameras are installed. Drivers are cared for. A few taxi murders get a Taskforce Report after two years, a survey showing 3000 assaults, 4000 robberies and 130,000 fare evasions. And as the most vocal of complainants, I personally can recount total inaction on reported evasions with camera imagery, and one total failure to proceed on one assault, again with imagery.
19.3 Drivers may well object to been restricted to less than a seventy two hour working week. Their
passengers may not. And a couple more jobs a night can make the difference, not only in income but in safety as well.

ATDA 2008 IPART Submission: Page 34 of 36
20. The Average Fare Revisited 20.1 The ATDA suggests that the most appropriate average fare be $20.00 with a structure that maintains
the level of demand and promotes a higher level of service. It needs be adjusted to account for real distances traveled and real time spent at waiting rates.
20.2 The Tariff II factor should be recognized as a cost component. The substantial increase in Booking
Fees and a increase in the proportion of those trips will, we hopefully assume, improve services and attendance at pick-up points by both driver and passenger.
20.3 The average fare analysed:
The Average Fare Current
IPART Fare
Actual ATDA Fare
ATDA
ProposedFare
Per Trip Rate $ Per
Trip $ Rate $
Flagfall 1 drop $3.00 3.00 1 drop $3.00 3.50 $3.50 Distance Rate 7 km $1.79 $12.53 5.55 km $9.93 $2.00 $11.10
Waiting Time 3 min $0.77 $2.31 5 mins $3.85 $0.85 $4.25
Tariff II 20% on
Distance
4.7% of
D.R. 20% on
Distance $0.47 $0.48
Booking Fee
1 in 5 $1.60 $0.32 1 in 6
$1.60 $0.27 1 in 5 $3.50 $0.70
Total Fare $18.16 $17.52 $20.03
ATDA 2008 IPART Submission: Page 35 of 36
21. Taxi Reality - The Conclusion 21.1 For an operator an extra shift a week is $6,500 a year in extra income. 21.2 For drivers two extra jobs a shift is $10,000 a year in extra income. 21.3 The extra cost to an operator is about $1500. The extra cost to drivers is nil. 21.4 Which way do we go? We certainly should not base fares on 70% efficiency. 21.4.1 This is the direction the ATDA suggests. Do not stand on the status quo, the existing
performance, and seek as the only solution, a higher fare from passengers. The industry must take an initiative as well, and improve its performance.
21.4.2 In order to get the $20.00 an hour as the net earning rate for taxi drivers we need to increase
fares by $2.00, there must be an increase of just journeys per shift, along with a corresponding increase of in shifts to at least 650 per vehicle.
21.4.3 The onus to achieve is then placed where it should be – on the industry. Network dispatch
must be improved to issue the existing and available jobs to a greater number of available taxis. Operators need to adjust their work patterns to have more of their cabs on the road on more shifts. Drivers can adopt smarter – more efficient - means of forward planning pre-bookings.
21.4.4 A rising tide which lifts the standard of ‘standard’ taxis to the existing performance of
‘premium’ taxis will benefit all stakeholders: passengers, drivers, and operators alike, as well as ensuring a profitable industry for investors.
21.4.5 The statistical attachments indicate firstly the current state of the Sydney taxi industry for a
Standard taxi. Secondly is shown the current Premium model, and third is a model using existing productivity levels, and indicating the average fare required to sustain a $20.00 per hour driver net earnings. Fourth is a desired model ,with increased productivity utilization , demonstrating that a $20.00 fare can produce a net earning rate of $20.00.
21.4.6 The Taxi Drivers of Sydney are not in a begging mode, nor do we demand a large fare
increase. We understand the market realities too well to ask for more than the passenger is prepared or willing to pay.
21.4.7 We are ready to do our share to lift the game. Those two extra trips a shift make all the
difference. Technology is at hand to assist – GPS, on-line bookings, smarter payment systems.
21.4.8 The Operators will have no qualms about their cabs been on the road to a maximum
utilization. Their bailment income increases also. They may need more efficient rostering to achieve those results, and again technology is to hand with an on-call driver data base.
21.4.9 There are two lines of data on the Network KPI’s that must be changed: (a) Number of
Taxis on the road at 9am and 9pm, and (b) Percentage of Passenger Bookings Picked-up in less than 15 minutes.
21.4.10 Our industry cannot any longer operate at two thirds efficiency.
ATDA 2008 IPART Submission: Page 36 of 36
21.5 To indulge in one last bit of finger pointing: 21.5.1 The Taxi Networks, under monopolistic domination, are where the rot started. There is no
incentive for efficiency, better customer service for passengers or drivers, and no accountability. The Service Standards effectively do not exist. The Network fees are not a fee for service based on the quantum of radio bookings. The non-cash surcharges for eftpos are excessive. Safety issues are not a concern.
21.5.2 The whole booking / despatch system is significantly outdated and does not promote better
fleet utilization, neither for the taxi cab, nor for the taxi driver. Yet Governmental regulatory protection is on the side of the Network and their owner. Penalties abound for the errant driver, and pressures to limit their effective customer service. For the Networks there are un-enforced, and almost non-existent standards, and no penalties.
21.5.3 But there are solutions, and a there is a will to implement new technology for improved
taxi efficiencies. Prepared by Michael Jools Australian Taxi Drivers Association March 2008

Taxi Meter Totals 2008
Hirings Total Kms Paid Kms Distance $ Time $ cents /km $ Fares Total $6 5 4 C D A E *I $1
T002 25/02/2008 31719 346232 176208 $314,716 $113,303 $1.53 $529,735 $533,096
T4463 23/02/2008 39545 414203 208119 368314 144868 1.53 $633,731 634060
T4847 6/02/2008 25798 286279 151532 272059 96067 1.58 $452,321 453775
T609 30/01/2008 9103 94201 48032 89653 34256 1.61 $151,664 151863
T296 11/02/2008 ss 888 12312 6663 12503 3752 1.57 $19,330 19426
T4847 7/02/2008 25822 286471 151613 272214 96172 1.58 $452,624 454106
T515 26/01/2008 2361 23113 11545 22158 8919 1.69 $39,061 39254
Waiting Rate: $0.7700
135236 1462811 753712 $1,351,617 $497,337 $2,278,465 $2,285,580
$1.58All Fares T609 new taxi
The Average Fare Total Kms / Trip 10.82 10.35
Paid Kms per trip 5.57 5.28
$ per trip $16.90 $16.66
% Kms Hired 51.52% 53.58%
% Waiting Time 36.80% 38.21%
Waiting Time Mins / Trip 4.78 4.89

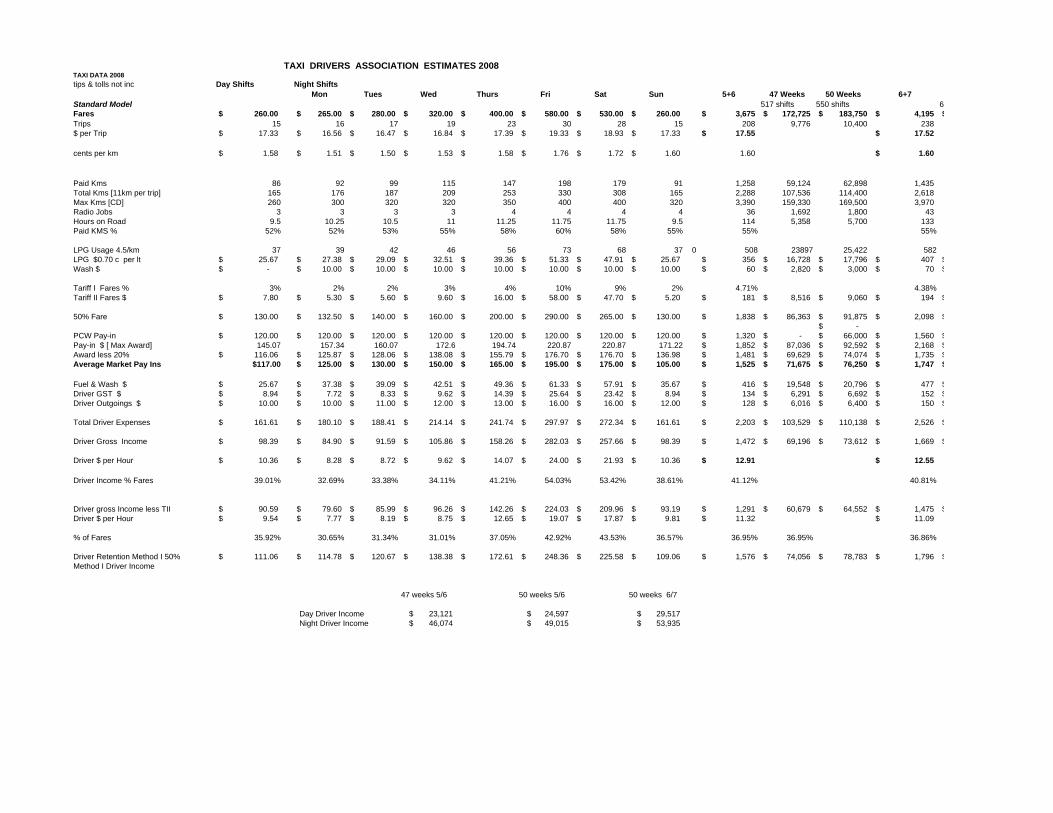
TAXI DRIVERS ASSOCIATION ESTIMATES 2008TAXI DATA 2008tips & tolls not inc Day Shifts Night Shifts
Mon Tues Wed Thurs Fri Sat Sun 5+6 47 Weeks 50 Weeks 6+7Standard Model 517 shifts 550 shifts 6Fares 260.00$ 265.00$ 280.00$ 320.00$ 400.00$ 580.00$ 530.00$ 260.00$ 3,675$ 172,725$ 183,750$ 4,195$ $Trips 15 16 17 19 23 30 28 15 208 9,776 10,400 238 $ per Trip 17.33$ 16.56$ 16.47$ 16.84$ 17.39$ 19.33$ 18.93$ 17.33$ 17.55$ 17.52$
cents per km 1.58$ 1.51$ 1.50$ 1.53$ 1.58$ 1.76$ 1.72$ 1.60$ 1.60 1.60$
Paid Kms 86 92 99 115 147 198 179 91 1,258 59,124 62,898 1,435 Total Kms [11km per trip] 165 176 187 209 253 330 308 165 2,288 107,536 114,400 2,618 Max Kms [CD] 260 300 320 320 350 400 400 320 3,390 159,330 169,500 3,970 Radio Jobs 3 3 3 3 4 4 4 4 36 1,692 1,800 43 Hours on Road 9.5 10.25 10.5 11 11.25 11.75 11.75 9.5 114 5,358 5,700 133 Paid KMS % 52% 52% 53% 55% 58% 60% 58% 55% 55% 55%
LPG Usage 4.5/km 37 39 42 46 56 73 68 37 0 508 23897 25,422 582LPG $0.70 c per lt 25.67$ 27.38$ 29.09$ 32.51$ 39.36$ 51.33$ 47.91$ 25.67$ 356$ 16,728$ 17,796$ 407$ $Wash $ -$ 10.00$ 10.00$ 10.00$ 10.00$ 10.00$ 10.00$ 10.00$ 60$ 2,820$ 3,000$ 70$ $
Tariff I Fares % 3% 2% 2% 3% 4% 10% 9% 2% 4.71% 4.38%Tariff II Fares $ 7.80$ 5.30$ 5.60$ 9.60$ 16.00$ 58.00$ 47.70$ 5.20$ 181$ 8,516$ 9,060$ 194$ $
50% Fare 130.00$ 132.50$ 140.00$ 160.00$ 200.00$ 290.00$ 265.00$ 130.00$ 1,838$ 86,363$ 91,875$ 2,098$ $-$
PCW Pay-in 120.00$ 120.00$ 120.00$ 120.00$ 120.00$ 120.00$ 120.00$ 120.00$ 1,320$ -$ 66,000$ 1,560$ $Pay-in $ [ Max Award] 145.07 157.34 160.07 172.6 194.74 220.87 220.87 171.22 1,852$ 87,036$ 92,592$ 2,168$ $Award less 20% 116.06$ 125.87$ 128.06$ 138.08$ 155.79$ 176.70$ 176.70$ 136.98$ 1,481$ 69,629$ 74,074$ 1,735$ $Average Market Pay Ins $117.00 125.00$ 130.00$ 150.00$ 165.00$ 195.00$ 175.00$ 105.00$ 1,525$ 71,675$ 76,250$ 1,747$ $
Fuel & Wash $ 25.67$ 37.38$ 39.09$ 42.51$ 49.36$ 61.33$ 57.91$ 35.67$ 416$ 19,548$ 20,796$ 477$ $Driver GST $ 8.94$ 7.72$ 8.33$ 9.62$ 14.39$ 25.64$ 23.42$ 8.94$ 134$ 6,291$ 6,692$ 152$ $Driver Outgoings $ 10.00$ 10.00$ 11.00$ 12.00$ 13.00$ 16.00$ 16.00$ 12.00$ 128$ 6,016$ 6,400$ 150$ $
Total Driver Expenses 161.61$ 180.10$ 188.41$ 214.14$ 241.74$ 297.97$ 272.34$ 161.61$ 2,203$ 103,529$ 110,138$ 2,526$ $
Driver Gross Income 98.39$ 84.90$ 91.59$ 105.86$ 158.26$ 282.03$ 257.66$ 98.39$ 1,472$ 69,196$ 73,612$ 1,669$ $
Driver $ per Hour 10.36$ 8.28$ 8.72$ 9.62$ 14.07$ 24.00$ 21.93$ 10.36$ 12.91$ 12.55$
Driver Income % Fares 39.01% 32.69% 33.38% 34.11% 41.21% 54.03% 53.42% 38.61% 41.12% 40.81%
Driver gross Income less TII 90.59$ 79.60$ 85.99$ 96.26$ 142.26$ 224.03$ 209.96$ 93.19$ 1,291$ 60,679$ 64,552$ 1,475$ $Driver $ per Hour 9.54$ 7.77$ 8.19$ 8.75$ 12.65$ 19.07$ 17.87$ 9.81$ 11.32$ 11.09$
% of Fares 35.92% 30.65% 31.34% 31.01% 37.05% 42.92% 43.53% 36.57% 36.95% 36.95% 36.86%
Driver Retention Method I 50% 111.06$ 114.78$ 120.67$ 138.38$ 172.61$ 248.36$ 225.58$ 109.06$ 1,576$ 74,056$ 78,783$ 1,796$ $Method I Driver Income
47 weeks 5/6 50 weeks 5/6 50 weeks 6/7
Day Driver Income 23,121$ 24,597$ 29,517$ Night Driver Income 46,074$ 49,015$ 53,935$
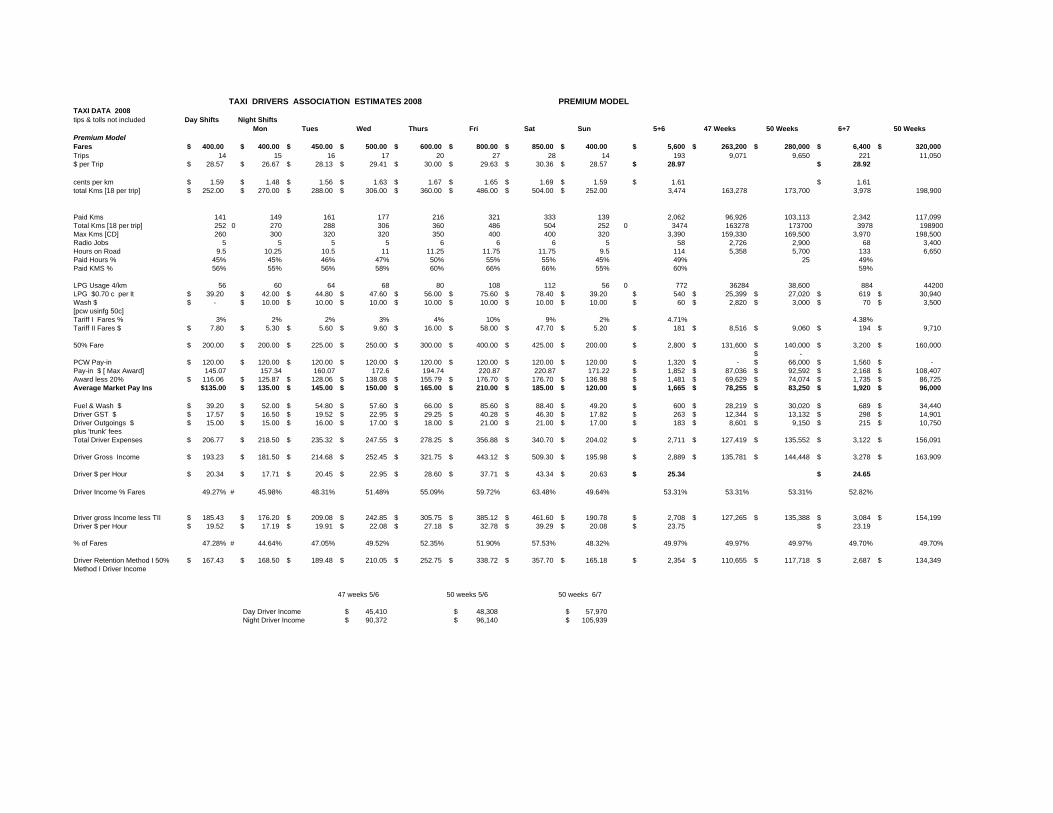
TAXI DRIVERS ASSOCIATION ESTIMATES 2008 PREMIUM MODELTAXI DATA 2008tips & tolls not included Day Shifts Night Shifts
Mon Tues Wed Thurs Fri Sat Sun 5+6 47 Weeks 50 Weeks 6+7 50 WeeksPremium ModelFares 400.00$ 400.00$ 450.00$ 500.00$ 600.00$ 800.00$ 850.00$ 400.00$ 5,600$ 263,200$ 280,000$ 6,400$ 320,000$ Trips 14 15 16 17 20 27 28 14 193 9,071 9,650 221 11,050 $ per Trip 28.57$ 26.67$ 28.13$ 29.41$ 30.00$ 29.63$ 30.36$ 28.57$ 28.97$ 28.92$
cents per km 1.59$ 1.48$ 1.56$ 1.63$ 1.67$ 1.65$ 1.69$ 1.59$ 1.61$ 1.61$ total Kms [18 per trip] 252.00$ 270.00$ 288.00$ 306.00$ 360.00$ 486.00$ 504.00$ 252.00$ 3,474 163,278 173,700 3,978 198,900
Paid Kms 141 149 161 177 216 321 333 139 2,062 96,926 103,113 2,342 117,099 Total Kms [18 per trip] 252 0 270 288 306 360 486 504 252 0 3474 163278 173700 3978 198900Max Kms [CD] 260 300 320 320 350 400 400 320 3,390 159,330 169,500 3,970 198,500 Radio Jobs 5 5 5 5 6 6 6 5 58 2,726 2,900 68 3,400 Hours on Road 9.5 10.25 10.5 11 11.25 11.75 11.75 9.5 114 5,358 5,700 133 6,650 Paid Hours % 45% 45% 46% 47% 50% 55% 55% 45% 49% 25 49%Paid KMS % 56% 55% 56% 58% 60% 66% 66% 55% 60% 59%
LPG Usage 4/km 56 60 64 68 80 108 112 56 0 772 36284 38,600 884 44200LPG $0.70 c per lt 39.20$ 42.00$ 44.80$ 47.60$ 56.00$ 75.60$ 78.40$ 39.20$ 540$ 25,399$ 27,020$ 619$ 30,940$ Wash $ -$ 10.00$ 10.00$ 10.00$ 10.00$ 10.00$ 10.00$ 10.00$ 60$ 2,820$ 3,000$ 70$ 3,500$ [pcw usinfg 50c]Tariff I Fares % 3% 2% 2% 3% 4% 10% 9% 2% 4.71% 4.38%Tariff II Fares $ 7.80$ 5.30$ 5.60$ 9.60$ 16.00$ 58.00$ 47.70$ 5.20$ 181$ 8,516$ 9,060$ 194$ 9,710$
50% Fare 200.00$ 200.00$ 225.00$ 250.00$ 300.00$ 400.00$ 425.00$ 200.00$ 2,800$ 131,600$ 140,000$ 3,200$ 160,000$ -$
PCW Pay-in 120.00$ 120.00$ 120.00$ 120.00$ 120.00$ 120.00$ 120.00$ 120.00$ 1,320$ -$ 66,000$ 1,560$ -$ Pay-in $ [ Max Award] 145.07 157.34 160.07 172.6 194.74 220.87 220.87 171.22 1,852$ 87,036$ 92,592$ 2,168$ 108,407$ Award less 20% 116.06$ 125.87$ 128.06$ 138.08$ 155.79$ 176.70$ 176.70$ 136.98$ 1,481$ 69,629$ 74,074$ 1,735$ 86,725$ Average Market Pay Ins $135.00 135.00$ 145.00$ 150.00$ 165.00$ 210.00$ 185.00$ 120.00$ 1,665$ 78,255$ 83,250$ 1,920$ 96,000$
Fuel & Wash $ 39.20$ 52.00$ 54.80$ 57.60$ 66.00$ 85.60$ 88.40$ 49.20$ 600$ 28,219$ 30,020$ 689$ 34,440$ Driver GST $ 17.57$ 16.50$ 19.52$ 22.95$ 29.25$ 40.28$ 46.30$ 17.82$ 263$ 12,344$ 13,132$ 298$ 14,901$ Driver Outgoings $ 15.00$ 15.00$ 16.00$ 17.00$ 18.00$ 21.00$ 21.00$ 17.00$ 183$ 8,601$ 9,150$ 215$ 10,750$ plus 'trunk' feesTotal Driver Expenses 206.77$ 218.50$ 235.32$ 247.55$ 278.25$ 356.88$ 340.70$ 204.02$ 2,711$ 127,419$ 135,552$ 3,122$ 156,091$
Driver Gross Income 193.23$ 181.50$ 214.68$ 252.45$ 321.75$ 443.12$ 509.30$ 195.98$ 2,889$ 135,781$ 144,448$ 3,278$ 163,909$
Driver $ per Hour 20.34$ 17.71$ 20.45$ 22.95$ 28.60$ 37.71$ 43.34$ 20.63$ 25.34$ 24.65$
Driver Income % Fares 49.27% # 45.98% 48.31% 51.48% 55.09% 59.72% 63.48% 49.64% 53.31% 53.31% 53.31% 52.82%
Driver gross Income less TII 185.43$ 176.20$ 209.08$ 242.85$ 305.75$ 385.12$ 461.60$ 190.78$ 2,708$ 127,265$ 135,388$ 3,084$ 154,199$ Driver $ per Hour 19.52$ 17.19$ 19.91$ 22.08$ 27.18$ 32.78$ 39.29$ 20.08$ 23.75$ 23.19$
% of Fares 47.28% # 44.64% 47.05% 49.52% 52.35% 51.90% 57.53% 48.32% 49.97% 49.97% 49.97% 49.70% 49.70%
Driver Retention Method I 50% 167.43$ 168.50$ 189.48$ 210.05$ 252.75$ 338.72$ 357.70$ 165.18$ 2,354$ 110,655$ 117,718$ 2,687$ 134,349$ Method I Driver Income
47 weeks 5/6 50 weeks 5/6 50 weeks 6/7
Day Driver Income 45,410$ 48,308$ 57,970$ Night Driver Income 90,372$ 96,140$ 105,939$
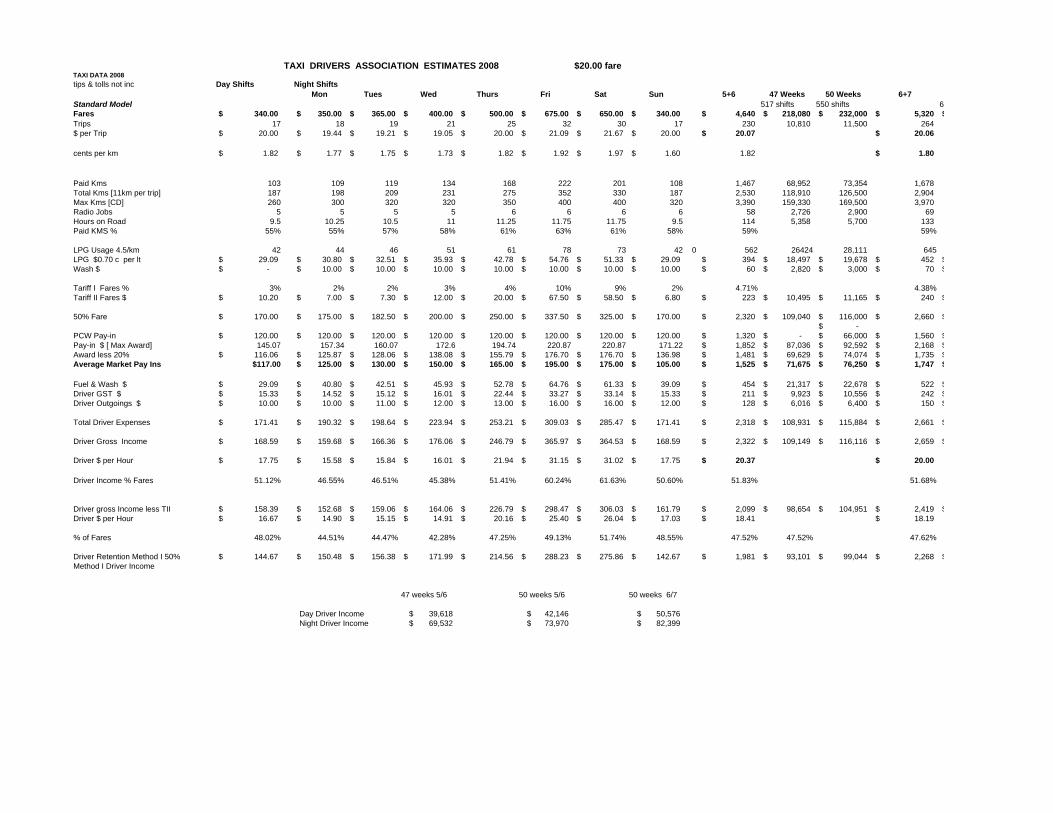
TAXI DRIVERS ASSOCIATION ESTIMATES 2008 $20.00 fareTAXI DATA 2008tips & tolls not inc Day Shifts Night Shifts
Mon Tues Wed Thurs Fri Sat Sun 5+6 47 Weeks 50 Weeks 6+7Standard Model 517 shifts 550 shifts 6Fares 340.00$ 350.00$ 365.00$ 400.00$ 500.00$ 675.00$ 650.00$ 340.00$ 4,640$ 218,080$ 232,000$ 5,320$ $Trips 17 18 19 21 25 32 30 17 230 10,810 11,500 264 $ per Trip 20.00$ 19.44$ 19.21$ 19.05$ 20.00$ 21.09$ 21.67$ 20.00$ 20.07$ 20.06$
cents per km 1.82$ 1.77$ 1.75$ 1.73$ 1.82$ 1.92$ 1.97$ 1.60$ 1.82 1.80$
Paid Kms 103 109 119 134 168 222 201 108 1,467 68,952 73,354 1,678 Total Kms [11km per trip] 187 198 209 231 275 352 330 187 2,530 118,910 126,500 2,904 Max Kms [CD] 260 300 320 320 350 400 400 320 3,390 159,330 169,500 3,970 Radio Jobs 5 5 5 5 6 6 6 6 58 2,726 2,900 69 Hours on Road 9.5 10.25 10.5 11 11.25 11.75 11.75 9.5 114 5,358 5,700 133 Paid KMS % 55% 55% 57% 58% 61% 63% 61% 58% 59% 59%
LPG Usage 4.5/km 42 44 46 51 61 78 73 42 0 562 26424 28,111 645LPG $0.70 c per lt 29.09$ 30.80$ 32.51$ 35.93$ 42.78$ 54.76$ 51.33$ 29.09$ 394$ 18,497$ 19,678$ 452$ $Wash $ -$ 10.00$ 10.00$ 10.00$ 10.00$ 10.00$ 10.00$ 10.00$ 60$ 2,820$ 3,000$ 70$ $
Tariff I Fares % 3% 2% 2% 3% 4% 10% 9% 2% 4.71% 4.38%Tariff II Fares $ 10.20$ 7.00$ 7.30$ 12.00$ 20.00$ 67.50$ 58.50$ 6.80$ 223$ 10,495$ 11,165$ 240$ $
50% Fare 170.00$ 175.00$ 182.50$ 200.00$ 250.00$ 337.50$ 325.00$ 170.00$ 2,320$ 109,040$ 116,000$ 2,660$ $-$
PCW Pay-in 120.00$ 120.00$ 120.00$ 120.00$ 120.00$ 120.00$ 120.00$ 120.00$ 1,320$ -$ 66,000$ 1,560$ $Pay-in $ [ Max Award] 145.07 157.34 160.07 172.6 194.74 220.87 220.87 171.22 1,852$ 87,036$ 92,592$ 2,168$ $Award less 20% 116.06$ 125.87$ 128.06$ 138.08$ 155.79$ 176.70$ 176.70$ 136.98$ 1,481$ 69,629$ 74,074$ 1,735$ $Average Market Pay Ins $117.00 125.00$ 130.00$ 150.00$ 165.00$ 195.00$ 175.00$ 105.00$ 1,525$ 71,675$ 76,250$ 1,747$ $
Fuel & Wash $ 29.09$ 40.80$ 42.51$ 45.93$ 52.78$ 64.76$ 61.33$ 39.09$ 454$ 21,317$ 22,678$ 522$ $Driver GST $ 15.33$ 14.52$ 15.12$ 16.01$ 22.44$ 33.27$ 33.14$ 15.33$ 211$ 9,923$ 10,556$ 242$ $Driver Outgoings $ 10.00$ 10.00$ 11.00$ 12.00$ 13.00$ 16.00$ 16.00$ 12.00$ 128$ 6,016$ 6,400$ 150$ $
Total Driver Expenses 171.41$ 190.32$ 198.64$ 223.94$ 253.21$ 309.03$ 285.47$ 171.41$ 2,318$ 108,931$ 115,884$ 2,661$ $
Driver Gross Income 168.59$ 159.68$ 166.36$ 176.06$ 246.79$ 365.97$ 364.53$ 168.59$ 2,322$ 109,149$ 116,116$ 2,659$ $
Driver $ per Hour 17.75$ 15.58$ 15.84$ 16.01$ 21.94$ 31.15$ 31.02$ 17.75$ 20.37$ 20.00$
Driver Income % Fares 51.12% 46.55% 46.51% 45.38% 51.41% 60.24% 61.63% 50.60% 51.83% 51.68%
Driver gross Income less TII 158.39$ 152.68$ 159.06$ 164.06$ 226.79$ 298.47$ 306.03$ 161.79$ 2,099$ 98,654$ 104,951$ 2,419$ $Driver $ per Hour 16.67$ 14.90$ 15.15$ 14.91$ 20.16$ 25.40$ 26.04$ 17.03$ 18.41$ 18.19$
% of Fares 48.02% 44.51% 44.47% 42.28% 47.25% 49.13% 51.74% 48.55% 47.52% 47.52% 47.62%
Driver Retention Method I 50% 144.67$ 150.48$ 156.38$ 171.99$ 214.56$ 288.23$ 275.86$ 142.67$ 1,981$ 93,101$ 99,044$ 2,268$ $Method I Driver Income
47 weeks 5/6 50 weeks 5/6 50 weeks 6/7
Day Driver Income 39,618$ 42,146$ 50,576$ Night Driver Income 69,532$ 73,970$ 82,399$
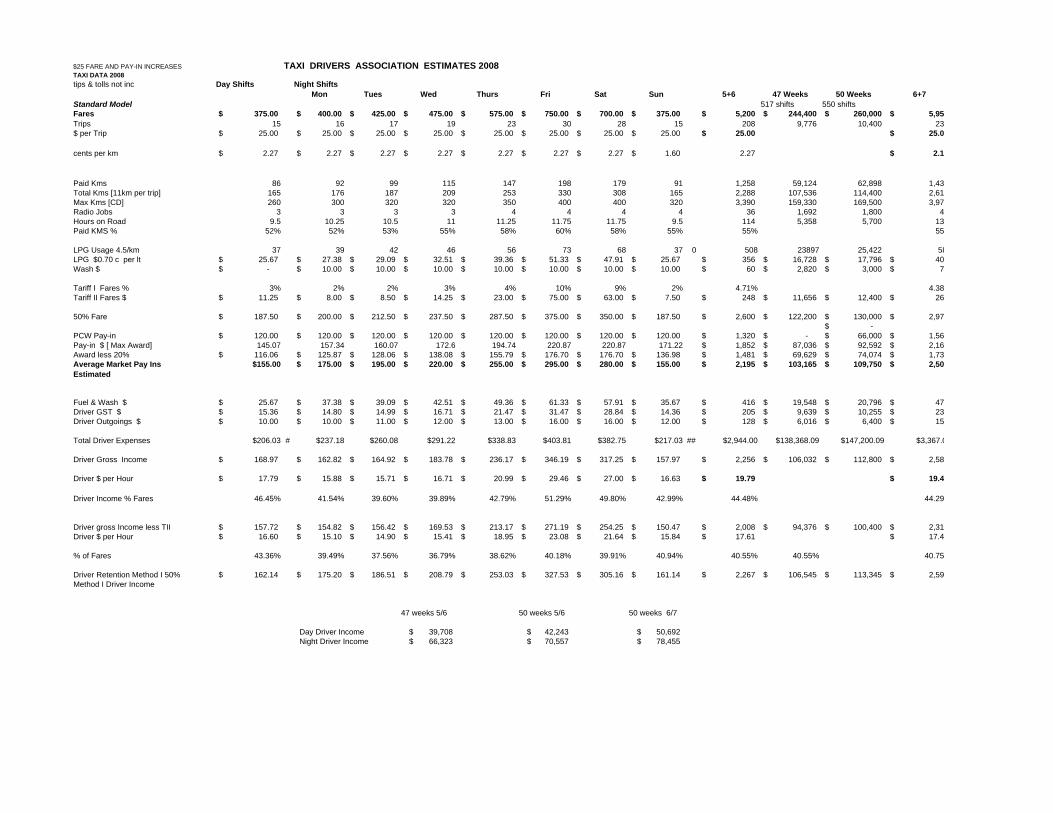
$25 FARE AND PAY-IN INCREASES TAXI DRIVERS ASSOCIATION ESTIMATES 2008TAXI DATA 2008tips & tolls not inc Day Shifts Night Shifts
Mon Tues Wed Thurs Fri Sat Sun 5+6 47 Weeks 50 Weeks 6+7Standard Model 517 shifts 550 shiftsFares 375.00$ 400.00$ 425.00$ 475.00$ 575.00$ 750.00$ 700.00$ 375.00$ 5,200$ 244,400$ 260,000$ 5,95$ Trips 15 16 17 19 23 30 28 15 208 9,776 10,400 23 $ per Trip 25.00$ 25.00$ 25.00$ 25.00$ 25.00$ 25.00$ 25.00$ 25.00$ 25.00$ 25.0$
cents per km 2.27$ 2.27$ 2.27$ 2.27$ 2.27$ 2.27$ 2.27$ 1.60$ 2.27 2.1$
Paid Kms 86 92 99 115 147 198 179 91 1,258 59,124 62,898 1,43 Total Kms [11km per trip] 165 176 187 209 253 330 308 165 2,288 107,536 114,400 2,61 Max Kms [CD] 260 300 320 320 350 400 400 320 3,390 159,330 169,500 3,97 Radio Jobs 3 3 3 3 4 4 4 4 36 1,692 1,800 4 Hours on Road 9.5 10.25 10.5 11 11.25 11.75 11.75 9.5 114 5,358 5,700 13 Paid KMS % 52% 52% 53% 55% 58% 60% 58% 55% 55% 55
LPG Usage 4.5/km 37 39 42 46 56 73 68 37 0 508 23897 25,422 58LPG $0.70 c per lt 25.67$ 27.38$ 29.09$ 32.51$ 39.36$ 51.33$ 47.91$ 25.67$ 356$ 16,728$ 17,796$ 40$ Wash $ -$ 10.00$ 10.00$ 10.00$ 10.00$ 10.00$ 10.00$ 10.00$ 60$ 2,820$ 3,000$ 7$
Tariff I Fares % 3% 2% 2% 3% 4% 10% 9% 2% 4.71% 4.38Tariff II Fares $ 11.25$ 8.00$ 8.50$ 14.25$ 23.00$ 75.00$ 63.00$ 7.50$ 248$ 11,656$ 12,400$ 26$
50% Fare 187.50$ 200.00$ 212.50$ 237.50$ 287.50$ 375.00$ 350.00$ 187.50$ 2,600$ 122,200$ 130,000$ 2,97$ -$
PCW Pay-in 120.00$ 120.00$ 120.00$ 120.00$ 120.00$ 120.00$ 120.00$ 120.00$ 1,320$ -$ 66,000$ 1,56$ Pay-in $ [ Max Award] 145.07 157.34 160.07 172.6 194.74 220.87 220.87 171.22 1,852$ 87,036$ 92,592$ 2,16$ Award less 20% 116.06$ 125.87$ 128.06$ 138.08$ 155.79$ 176.70$ 176.70$ 136.98$ 1,481$ 69,629$ 74,074$ 1,73$ Average Market Pay Ins $155.00 175.00$ 195.00$ 220.00$ 255.00$ 295.00$ 280.00$ 155.00$ 2,195$ 103,165$ 109,750$ 2,50$ Estimated
Fuel & Wash $ 25.67$ 37.38$ 39.09$ 42.51$ 49.36$ 61.33$ 57.91$ 35.67$ 416$ 19,548$ 20,796$ 47$ Driver GST $ 15.36$ 14.80$ 14.99$ 16.71$ 21.47$ 31.47$ 28.84$ 14.36$ 205$ 9,639$ 10,255$ 23$ Driver Outgoings $ 10.00$ 10.00$ 11.00$ 12.00$ 13.00$ 16.00$ 16.00$ 12.00$ 128$ 6,016$ 6,400$ 15$
Total Driver Expenses $206.03 # $237.18 $260.08 $291.22 $338.83 $403.81 $382.75 $217.03 ## $2,944.00 $138,368.09 $147,200.09 $3,367.0
Driver Gross Income 168.97$ 162.82$ 164.92$ 183.78$ 236.17$ 346.19$ 317.25$ 157.97$ 2,256$ 106,032$ 112,800$ 2,58$
Driver $ per Hour 17.79$ 15.88$ 15.71$ 16.71$ 20.99$ 29.46$ 27.00$ 16.63$ 19.79$ 19.4$
Driver Income % Fares 46.45% 41.54% 39.60% 39.89% 42.79% 51.29% 49.80% 42.99% 44.48% 44.29
Driver gross Income less TII 157.72$ 154.82$ 156.42$ 169.53$ 213.17$ 271.19$ 254.25$ 150.47$ 2,008$ 94,376$ 100,400$ 2,31$ Driver $ per Hour 16.60$ 15.10$ 14.90$ 15.41$ 18.95$ 23.08$ 21.64$ 15.84$ 17.61$ 17.4$
% of Fares 43.36% 39.49% 37.56% 36.79% 38.62% 40.18% 39.91% 40.94% 40.55% 40.55% 40.75
Driver Retention Method I 50% 162.14$ 175.20$ 186.51$ 208.79$ 253.03$ 327.53$ 305.16$ 161.14$ 2,267$ 106,545$ 113,345$ 2,59$ Method I Driver Income
47 weeks 5/6 50 weeks 5/6 50 weeks 6/7
Day Driver Income 39,708$ 42,243$ 50,692$ Night Driver Income 66,323$ 70,557$ 78,455$