australian voters views on immigration policy -...
TRANSCRIPT
The Australian Population Research Institute, Research Report, October 2017
Australian voters’ views on immigration policy
Katharine Betts and Bob Birrell
The Australian Population Research Institute <tapri.org.au> PO Box 12500 Middle Camberwell Victoria 3124 Australia

ii
Report authors
Katharine Betts (mobile 0412 214 820) is Adjunct Associate Professor, Sociology, Swinburne University of
Technology.
Bob Birrell (mobile 0413 021 126) is the Head of the Australian Population Research Institute (TAPRI), an
independent, non-profit research organisation.
Articles published by the Australian Population Research Institute may be republished provided the institute
and its writers are appropriately credited, and a link is made to our website <tapri.org.au>.
Any articles reproduced cannot be edited or any material sold separately.
iii
Australian voters’ views on immigration policy
Katharine Betts and Bob Birrell
Table of Contents
Executive summary ................................................................................................................ v
Introduction ........................................................................................................................... 1
The elite perspective .............................................................................................................. 1
The TAPRI survey.................................................................................................................... 3
Attitudes to immigration numbers ........................................................................................ 3
Attitudes to ethnic diversity .................................................................................................. 3
The TAPRI survey vs the Scanlon survey ................................................................................ 5
Are the findings an artefact of survey methodology? ........................................................... 5
Why attitudes have hardened since 2016? ........................................................................... 6
Dissent is not about the economically ‘left behinds’............................................................. 8
Political implications ............................................................................................................ 10
Fickle voters ......................................................................................................................... 11
Where will the challenge come from? ................................................................................. 12
Appendix 1: Method ............................................................................................................ 14
Appendix 2: Tables ............................................................................................................... 15
Notes .................................................................................................................................... 23

iv
v
Australian voters’ views on immigration policy Katharine Betts and Bob Birrell
The Australian Population Research Institute
Executive Summary
Australia’s population grew by a massive 384,000 in the year to March 2017, some 231,900, or 60
per cent, of which was due to net overseas migration.
Immigration is the dynamic factor in this population surge, reflecting a record high permanent
migration program and generous settings for temporary-entry visas.
The consequences are becoming obvious and are being reflected in increased public concern about
quality of life and questions concerning ethnic diversity.
The Australian Population Research Institute (TAPRI) commissioned a national survey of Australian
voters in August 2017 to assess the extent of this concern and its causes.
The survey found that 74 per cent of voters thought that Australia does not need more people, with
big majorities believing that that population growth was putting ‘a lot of pressure’ on hospitals,
roads, affordable housing and jobs (Figure 4).
Most voters were also worried about the consequences of growing ethnic diversity. Forty-eight per
cent supported a partial ban on Muslim immigration to Australia, with only 25 per cent in opposition
(Figure 3).
Despite these demographic pressures and discontents, Australia’s political and economic elites are
disdainful of them and have ignored them. They see high immigration as part of their commitment
to the globalisation of Australia’s economy and society and thus it is not to be questioned.
Elites elsewhere in the developed world hold similar values, but have had to retreat because of
public opposition. Across Europe 15 to 20 per cent of voters currently support anti-immigration
political parties.
Our review of elite opinion in Australia shows that here they think they can ignore public concerns.
This is because their main source of information about public opinion on the issue, the Scanlon
Foundation, has consistently reported that most Australians support their immigration and cultural
diversity policies.
vi
How could Australia be so different from other Western countries? It has long been argued,
including by the Scanlon Foundation, that Australians were insulated from the economic shocks of
the Global Financial Crisis in 2008-2009. This means that we have a lower share of angry ‘left
behinds’ than in Europe and the US, that is, people suffering from economic stress who can be
mobilised around an anti-immigration banner.
This is why Labor’s shadow Deputy Treasurer, Andrew Leigh, can assert that Australian attitudes to
migrants are warm and ‘becoming warmer over time’ and that ‘there is solid support for the
principle of non-discrimination’ (pages 1-2). It is also why, according to prominent writer David Marr,
‘more than almost any people on earth, we are happy for migrants to come in big numbers’ (pages
2-3).
The TAPRI survey refutes these findings. It shows that 74 per cent of voters believe that Australia
does not need more people and that, at the time of the survey, 54 per cent wanted a reduction in
the migrant intake. This includes 57 per cent of Liberal voters and 46 per cent of Labor voters (Figure
1). This result is far higher than the 34 per cent of respondents wanting a lower migrant intake
reported in the last Scanlon survey (in July-August 2016).
Australian voters’ concern about immigration levels and ethnic diversity does not derive from
economic adversity. Rather it stems from the increasingly obvious impact of population growth on
their quality of life and the rapid change in Australia’s ethnic and religious make-up.
Such is the extent of these concerns that they could readily be mobilised in an electoral context by
One Nation or any other party with a similar agenda, should such a party be able to mount a national
campaign. If this occurs, the Liberal Party is likely to be the main loser.
1
Australian voters’ views on immigration policy
Introduction
Seventy four per cent of Australian voters think that Australia does not need more people (Table 1,
Appendix 2). This is the headline result of a recent national opinion survey of Australian voters
commissioned by The Australian Population Research Institute (TAPRI). This is a similar outcome to
that reported in a Galaxy Research poll conducted in September for Dick Smith.1
Yet the Australian government is presiding over a population policy that is delivering unprecedented
population growth. In the year to March 2017, Australia’s population grew by 384,000, of which
231,900 (or 60 per cent) came from net overseas migration. This 384,000 was equivalent to an
annual rate of population growth 1.6 per cent, a rate far above that of almost all other developed
countries.
Immigration is the dynamic factor. The Australian birth rate has declined over the past few years
with the result that natural increase (167,000 in the year to March 2017), has also fallen slightly over
these years as well. (Though, contrary to popular belief, ‘below replacement fertility’ still means
continued population growth from natural increase for many years.)2
Public concerns about population growth have no impact on the stance of Australia’s elites. All
major political parties as well as their economic advisors (the Reserve Bank, Treasury and the like)
agree that Australia should continue with its high migration policy. They see immigration, along with
openness to imports, foreign enterprise, foreign capital and investments as essential if Australia is to
compete in the global market place.
As we will see, elites also think they do not need to worry about any popular discontent. This is
because of what they are being told by the Scanlon Foundation, which has become their main source
of information on public attitudes to immigration numbers and the resultant ethnic diversity.
According to the Foundation, except for a small group of racists cohering around the One Nation
party, most people are happy with high migration and its consequences.
The TAPRI survey challenges this judgement. Whereas the latest Scanlon report (based on a survey
in July-August 2016) found that just 34 per cent of Australian residents thought that immigration
levels were too high, the August 2017 TAPRI survey of Australian voters shows that 54 per cent were
now of this opinion.
The political implications, which are significant, are explored below.
The elite perspective
We start with elite perceptions of public attitudes to immigration and the sources of information on
which these perceptions are based.
Andrew Leigh, the Labor Party’s Shadow Assistant Treasurer typifies these elite perceptions. Leigh
has just published a book entitled Choosing Openness.3 In it, he spells out why he believes
immigration to be so important. Australia has chosen to open its economy to world competition.
2
There is no turning back. For Leigh, a cut in immigration would amount to a declaration of defeat; a
retreat from the openness that Australia must maintain if it is to succeed in the global economy.
Leigh is disdainful of those who do not share his vision. For Australians concerned about urban
congestion he declares the answer is not to reduce immigration but to provide ‘better public
transport, appropriate pricing of street parking and economically sensible congestion policies’.4
That’s it. No reference to the costs or time required to implement such a ‘solution’.
Leigh has no fear of political retribution on this issue. He thinks that:
Australians’ attitudes towards immigrants are warmer than in most advanced nations, and have become
warmer over time.5
The evidence for this judgement is drawn from the Scanlon Foundation’s annual Mapping Social
Cohesion report. This report, written by Andrew Markus (Monash University), is based on a large
telephone survey of a random sample of Australia residents. As noted, the 2016 survey indicates
that only 34 per cent of respondents thought that ‘the number of immigrants accepted into
Australia’ was too high.6 And yes, as Leigh asserts, according to Scanlon, the share of the population
holding this view has fallen in recent years, from 47 per cent in 2010 and 42 per cent in 2013.
This remarkable outcome, at least by comparison with the anti-immigration protests across Europe,
has prompted a special report in The Economist magazine. The report notes recent efforts, as by Dick
Smith, to sound the alarm about Australian migration levels. Yet, so the magazine judges, relatively
few Australians seem to be concerned. The authors’ main source, once again, is the Scanlon
Foundation. The Economist states that:
Regular surveys conducted by the Scanlon Foundation, which works to integrate immigrants, show that
the sense that immigration is too high has fallen substantially since the 1990s.7
As to Pauline Hanson’s efforts to stir up animosity towards Muslims, these according to The
Economist, have ‘attracted more ridicule than adulation’.
On this issue too, Australian elites think that there is no threat to their immigration policies. Andrew
Leigh writes that: ‘There is solid support for the principle of non-discrimination’ and that supporters
of Muslim migration outnumber opponents by a margin of two to one.8 He draws these judgements
from the Scanlon Foundation as well.
The most widely read of recent analyses on whether Australia has anything to fear from populist
anti-immigration protest is that by the prominent former Fairfax journalist, David Marr. His tract is
entitled The White Queen, One Nation and the Politics of Race. This concludes that there is only a
small support base among voters for Hanson’s racist attacks on Muslims. Hanson, according to Marr,
‘commands nothing like the numbers backing Trump and the Brexit leader Nigel Farage… Hanson is
bit player’. Hanson’s voting base does not derive from the impact of globalisation on jobs says Marr.
What’s driving her supporters, he thinks, is race.9
What’s the evidence base? Again it is the Scanlon reports, supplemented by interviews with Markus.
Markus tells Marr that, despite Australia’s unique acceptance of immigration and cultural diversity,
there is just a ‘core level of intolerance in Australia *that+ is close to 10 per cent of the population’.10
Marr is much taken by the Scanlon Report’s findings that Australians are optimistic about their
economic future. He, like Scanlon, thinks that this optimism helps explain the findings that most
people support multiculturalism and ethnic diversity.11
3
Marr concludes from this that: ‘More than almost any people on earth, we are happy for migrants to
come in big numbers’.12
The TAPRI survey
TAPRI commissioned a national opinion survey of Australian voters’ attitudes to population and
immigration in August 2017. The survey was designed to elicit voters’ views on these issues and to
obtain information on the factors that may be shaping their attitudes. These include their education,
position in the labour market, and their housing and financial situation. (See Appendix 1 on the
survey’s methodology which was designed to obtain a group that was representative of all voters.)
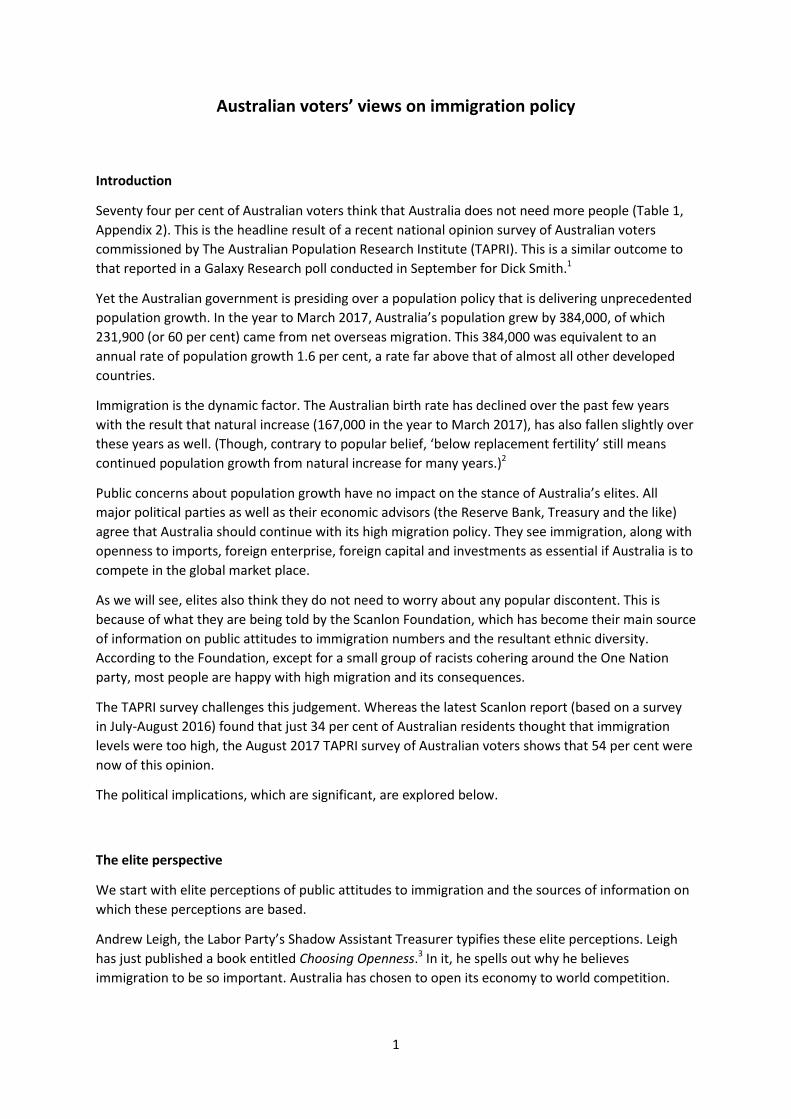
Attitudes to immigration numbers
The survey found that 54 per cent of voters wanted immigration to be reduced a little or a lot,
including 57 per cent of Liberal voters and 46 per cent of Labor voters (Figure 1).
Figure 1: ‘The number of immigrants allowed into Australia nowadays...’ by voting intention
Source: Table 2 in Appendix 2
This support for reducing immigration numbers is way above the 34 per cent level indicated in the
2016 Scanlon report.13
Attitudes to ethnic diversity
The TAPRI survey asked voters various questions about their support for Australia’s ethnic diversity.
The results again differ sharply from those reported by Scanlon.14
0
10
20
30
40
50
60
70
80
90
100
Liberals Nationals Labor Greens OneNation
Other Totalsample
%
Should be reduced a little or a lot
4
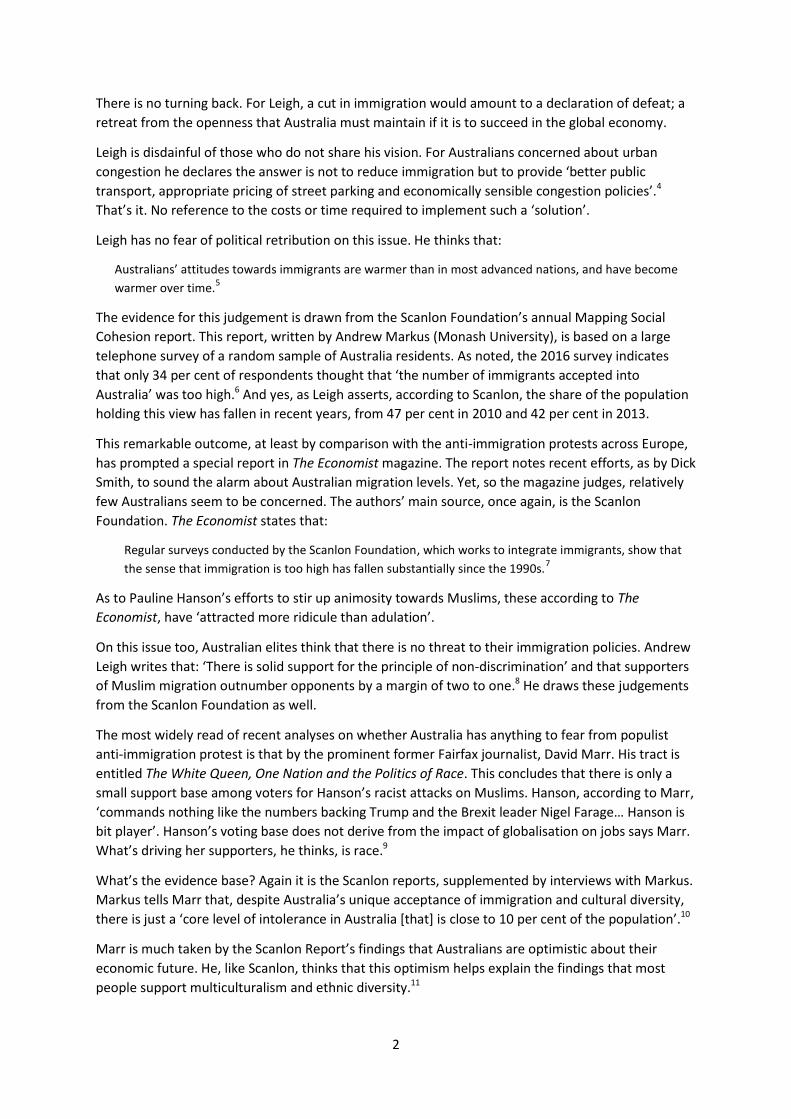
Voters were asked whether they agree with the statement that: ‘Today, Australia is in danger of
losing its culture and identity’. Fifty-five per cent agreed or strongly agreed with this statement,
including 59 per cent of Liberal voters and 47 per cent of Labor voters.
Figure 2: ‘Today Australia is in danger of losing its culture and identity’ by voting intention
Source: Table 3 in Appendix 2
TAPRI asked another question pollsters often ask to test these attitudes.15 Respondents were offered
the statement that ‘Australia has changed in recent times beyond recognition – it sometimes feels
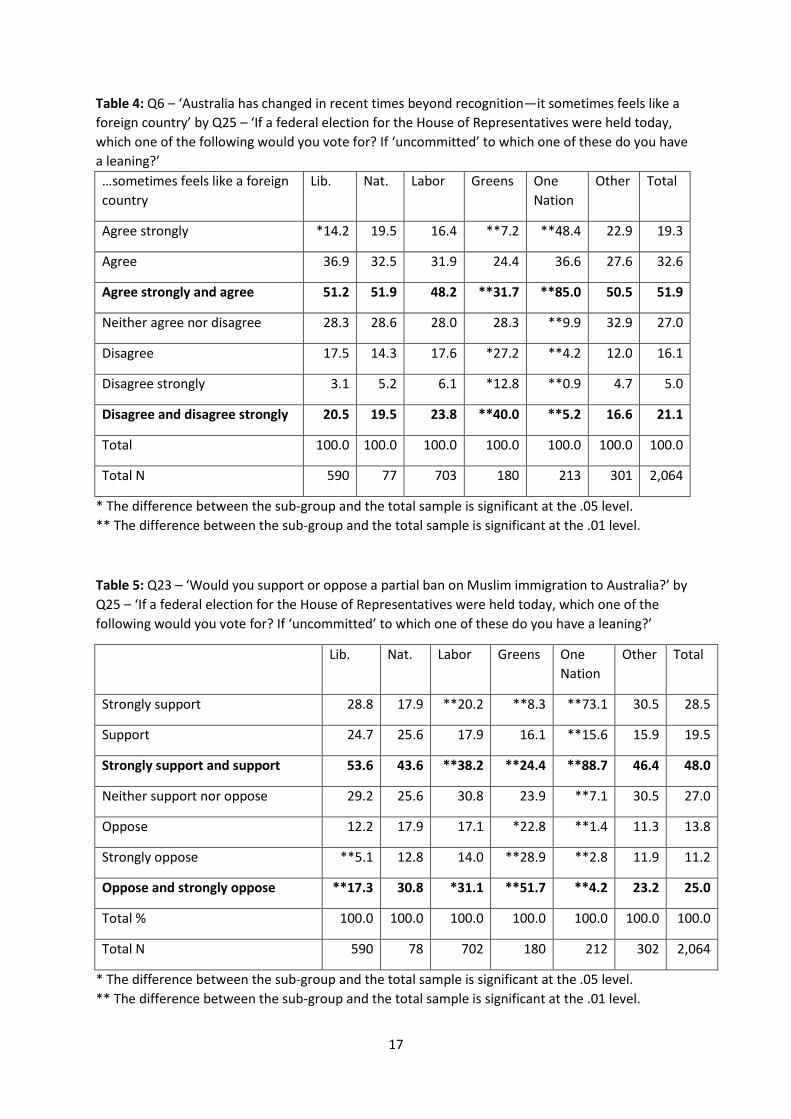
like a foreign country’. Fifty-two per cent agreed or strongly agreed including 51 per cent of Liberal
voters and 48 per cent of Labor voters (Table 4, Appendix 2).
As noted, according to Leigh: ‘There is solid support for the principle of non-discrimination’.
The TAPRI survey provides a different picture. It asked respondents whether they supported a full or
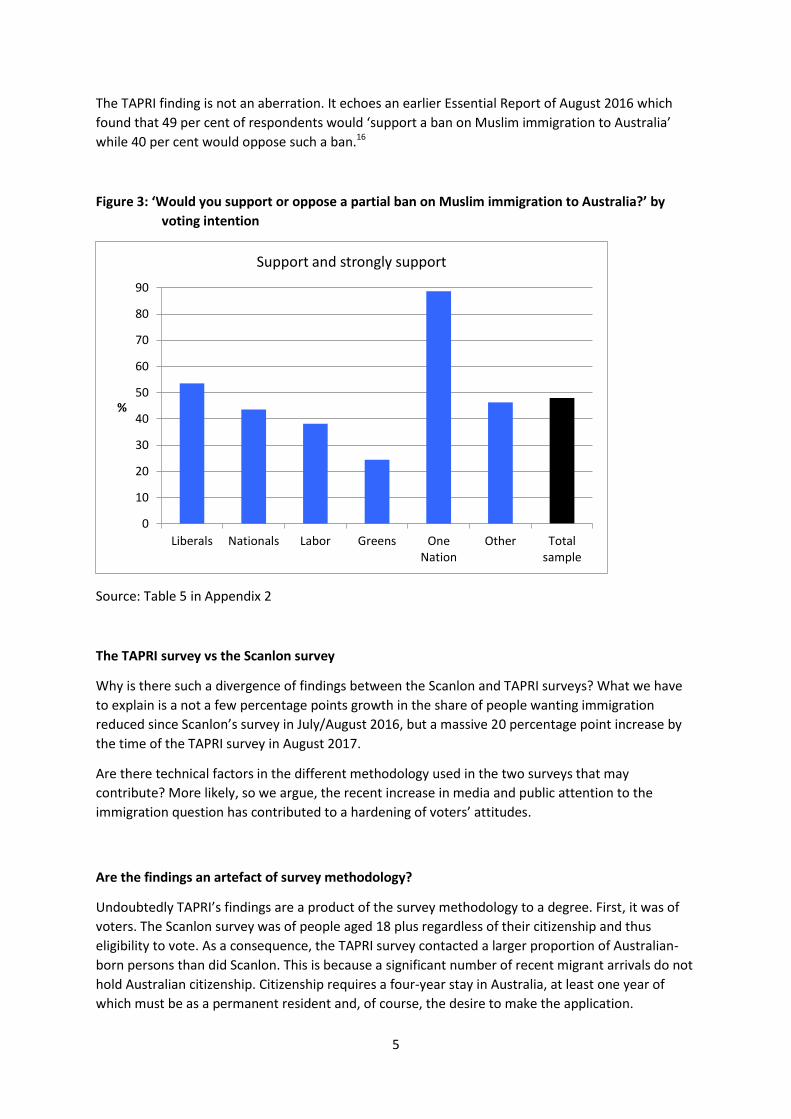
partial ban on Muslim immigration. In all, 48 per cent supported or strongly supported such a ban,
including a majority of Liberal voters (54 per cent) and a large minority of Labor voters (38 per cent).
Almost all (89 per cent) of One Nation voters were in support (Figure 3).
This outcome is quite contrary to the Scanlon findings. The willingness to take a tough,
discriminating stance on Muslim immigration is not limited to a small minority, but extends to
almost half of all voters.
Again, in sharp contrast to what might have been expected from Leigh’s confidence in Australians’
support for a non-discriminatory stance, a further 27 per cent were undecided. Only 25 per cent of
those surveyed opposed or strongly opposed a partial ban on Muslim immigration (Table 5,
Appendix 2).
0
10
20
30
40
50
60
70
80
90
100
Liberals Nationals Labor Greens One Nation Other Totalsample
%
"In danger of..." agree and agree strongly
5
The TAPRI finding is not an aberration. It echoes an earlier Essential Report of August 2016 which
found that 49 per cent of respondents would ‘support a ban on Muslim immigration to Australia’
while 40 per cent would oppose such a ban.16
Figure 3: ‘Would you support or oppose a partial ban on Muslim immigration to Australia?’ by
voting intention
Source: Table 5 in Appendix 2
The TAPRI survey vs the Scanlon survey
Why is there such a divergence of findings between the Scanlon and TAPRI surveys? What we have
to explain is a not a few percentage points growth in the share of people wanting immigration
reduced since Scanlon’s survey in July/August 2016, but a massive 20 percentage point increase by
the time of the TAPRI survey in August 2017.
Are there technical factors in the different methodology used in the two surveys that may
contribute? More likely, so we argue, the recent increase in media and public attention to the
immigration question has contributed to a hardening of voters’ attitudes.
Are the findings an artefact of survey methodology?
Undoubtedly TAPRI’s findings are a product of the survey methodology to a degree. First, it was of
voters. The Scanlon survey was of people aged 18 plus regardless of their citizenship and thus
eligibility to vote. As a consequence, the TAPRI survey contacted a larger proportion of Australian-
born persons than did Scanlon. This is because a significant number of recent migrant arrivals do not
hold Australian citizenship. Citizenship requires a four-year stay in Australia, at least one year of
which must be as a permanent resident and, of course, the desire to make the application.
0
10
20
30
40
50
60
70
80
90
Liberals Nationals Labor Greens OneNation
Other Totalsample
%
Support and strongly support
6
Australian-born persons are much more likely to take a tough line on immigration numbers and
ethnic diversity than are overseas-born persons (unless they are UK-born).
This factor may help explain why the July-August 2016 Scanlon Report estimate that 34 per cent of
people thought immigration too high17 was much lower than that reported by the Australian
Electoral Study (AES), conducted just after the November 2016 Federal election. The AES, draws
from a sample of voters registered on the Australian Electoral Roll. The 2016 AES found that the
proportion of voters supporting a reduction in the level of immigration was 42 per cent.18
It is also likely that people give more authentic answers to sensitive questions, such as those
involving attitudes to immigration and cultural diversity, in the relative anonymity of an online
survey than in answers to a telephone interviewer (see Appendix 1). In the wake of pollsters’ failure
to predict the Brexit outcome or the election of Donald Trump, Wolfgang Streeck writes:
There seems to be a steady increase in the number of people who regard social scientists as spies from a
foreign power who have to be avoided or, should that be impossible, whose disapproval one avoids by
giving them the answers one believes are expected.19
This is a view backed by some highly credible polling organisations. Pew Research suggests that
respondents may be more likely to provide socially undesirable responses in the relative anonymity
of the internet.20 For example in 2014 the Scanlon survey found a much higher proportion of
negative responses to a question on Muslim immigration among Australian-born respondents when
this was administered online (44 per cent) compared to answers elicited in telephone interviews (28
per cent).21
Finally there is the vexed issue of whether random samples of respondents drawn from Internet
panels provide as accurate a picture of the surveyed population as do random samples drawn from a
list of telephone numbers (or some other sampling frame). As detailed in Appendix 1, there are
pluses and minuses with both methods. It may reassure any readers worried about this issue that
the results from panel surveys (including TAPRI’s) are similar to those of other sample surveys on
issues such as voter support for the major parties. It is striking that Newspoll has recently quietly
shifted its methodology to Internet panel-based surveys.
We conclude that differences in sample scope and method provide part of the answer for the 20
percentage point difference we have to explain. But we think a hardening of attitudes since August
2016 is the main reason for the increase.22
Why attitudes have hardened since 2016?
Recall that a massive 74 per cent of our voter respondents think that Australia does not need more
people. It is hardly a surprise that they would have this view given the increasing media attention to
questions of congestion, housing affordability and problems of access to public services in the last
couple of years. Likewise, on the issue of job competition there has been enormous negative
publicity about migrant worker exploitation and the undermining of Australian wages and conditions
in franchise operations like 7/11 stores.
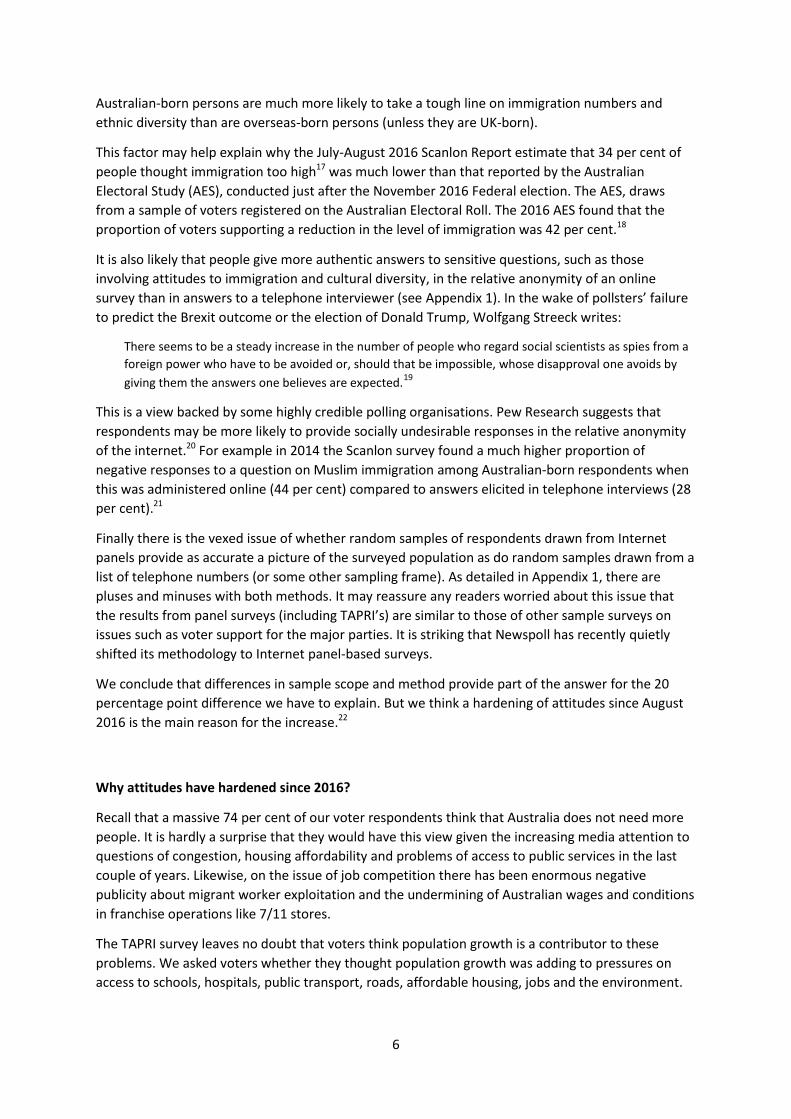
The TAPRI survey leaves no doubt that voters think population growth is a contributor to these
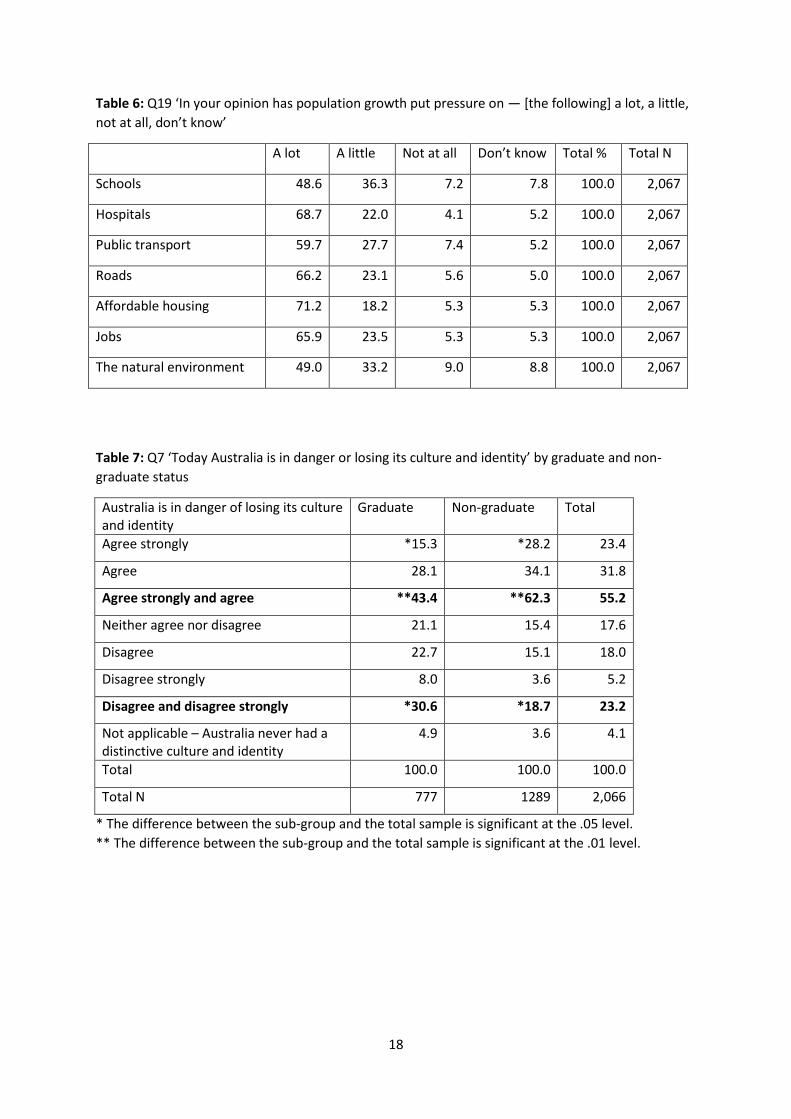
problems. We asked voters whether they thought population growth was adding to pressures on
access to schools, hospitals, public transport, roads, affordable housing, jobs and the environment.
7
As Figure 4 shows, between 60 to 70 per cent of voters thought that population growth had put ‘a
lot’ of pressure on hospitals, roads, affordable housing and jobs.
Figure 4: In your opinion has population growth put pressure on—
Source: Table 6 in Appendix 2
The TAPRI survey also found far tougher attitudes to ethnic diversity than reported by Scanlon.23
This, too, is not surprising given that there has been saturation coverage of local terrorist incidents
(actual and planned) and of Pauline Hanson’s various statements including that: ‘we are in danger of
being swamped by Muslims’.24
As publicity around population- and immigration-related issues mounts, voters are more likely to
give these issues some thought and to firm up their attitudes. There are many questions and events
that contend for voters’ attention. The more public discussion there is of a particular issue, the more
likely it is to move up the hierarchy of voters’ attention.
What may surprise, given that 74 per cent think Australia does not need more people, is that the
share of voters wanting a reduction in immigration is not higher than 54 per cent.
There are a couple of factors in play here. One is that most voters have a very limited knowledge
base concerning population numbers. For example, a 2015 survey found that only 19 per cent of
voters knew that Australia had one of the fastest rates of population growth in the developed world.
And only 37 per cent knew that the following statement was false: ‘Because of our low birth rates,
Australia’s population would be shrinking now if it were not for immigration’.25
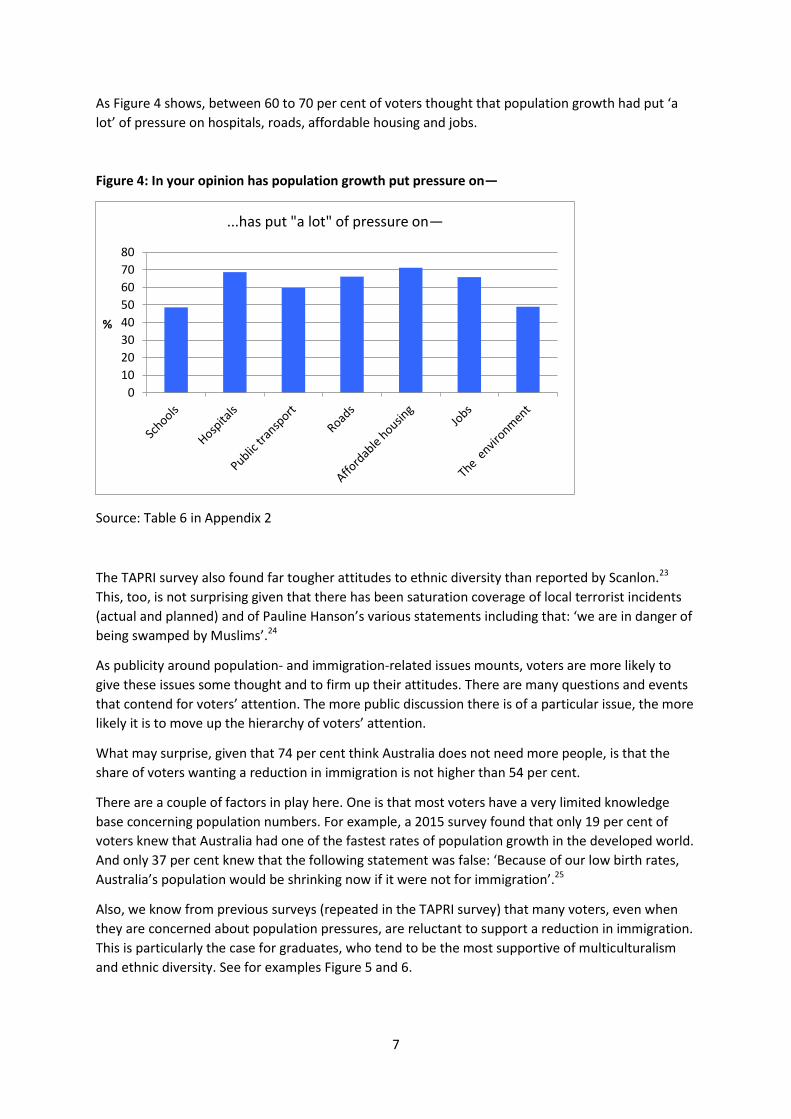
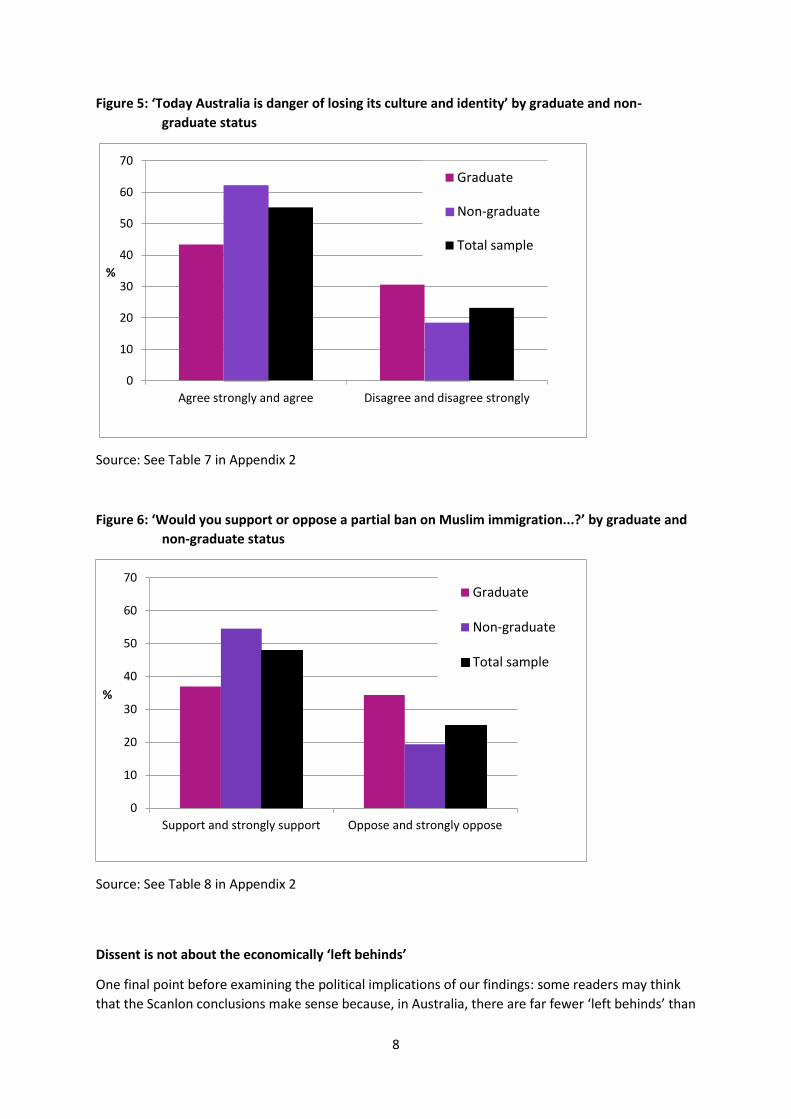
Also, we know from previous surveys (repeated in the TAPRI survey) that many voters, even when
they are concerned about population pressures, are reluctant to support a reduction in immigration.
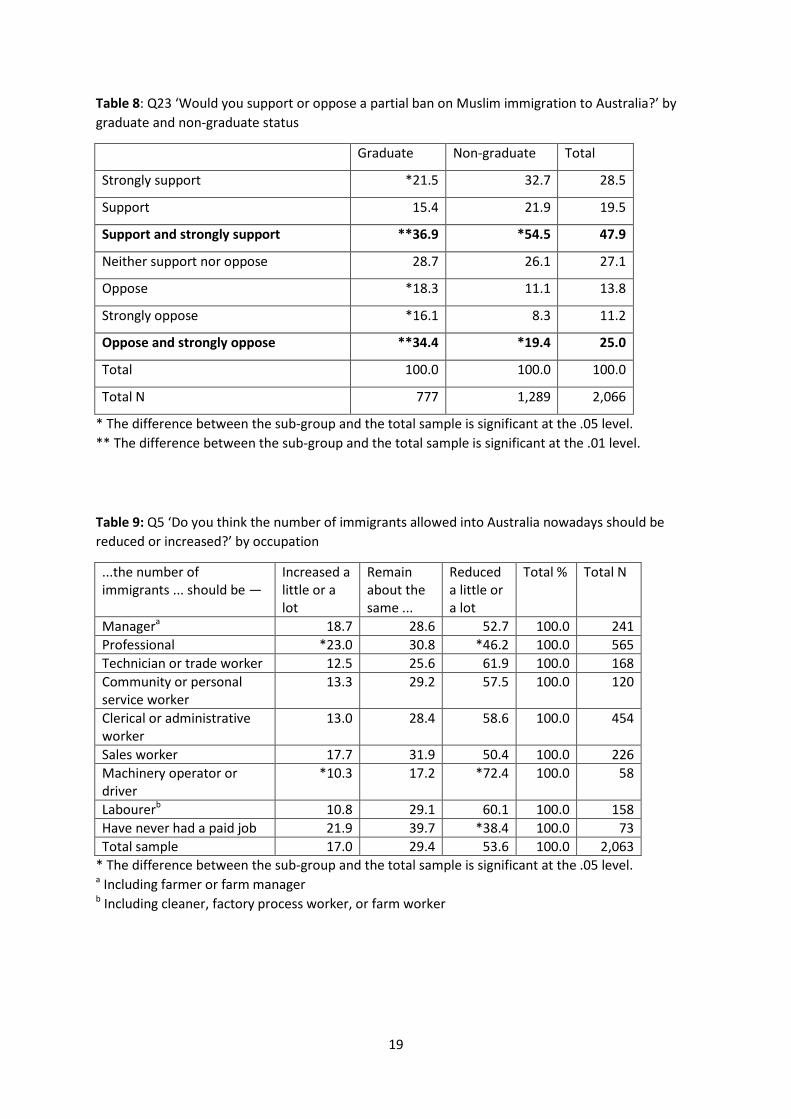
This is particularly the case for graduates, who tend to be the most supportive of multiculturalism
and ethnic diversity. See for examples Figure 5 and 6.
0
10
20
30
40
50
60
70
80
%
...has put "a lot" of pressure on—
8
Figure 5: ‘Today Australia is danger of losing its culture and identity’ by graduate and non-
graduate status
Source: See Table 7 in Appendix 2
Figure 6: ‘Would you support or oppose a partial ban on Muslim immigration...?’ by graduate and
non-graduate status
Source: See Table 8 in Appendix 2
Dissent is not about the economically ‘left behinds’
One final point before examining the political implications of our findings: some readers may think
that the Scanlon conclusions make sense because, in Australia, there are far fewer ‘left behinds’ than
0
10
20
30
40
50
60
70
Agree strongly and agree Disagree and disagree strongly
%
Graduate
Non-graduate
Total sample
0
10
20
30
40
50
60
70
Support and strongly support Oppose and strongly oppose
%
Graduate
Non-graduate
Total sample
9
in Europe and the US. This is plausible since it is often argued that these people are the main source
of voter support for anti-immigration parties in Europe and for Trump in the US as well as for Brexit
in the UK.
There is no parallel level of economically ‘left behinds’ in Australia because Australia largely evaded
the global financial crisis and the austerity policies that most European countries and the US pursued
in the aftermath of the crisis.
The Scanlon reports make much of Australians’ optimistic expectations about their economic future.
They argue that this relative security is the foundation of Australians’ support for immigration and
multiculturalism.
In one respect, the TAPRI findings are similar. Few of our respondents reported any sense of
economic insecurity. However, we disagree that these outcomes insulate Australian voters from
negative attitudes to immigration and ethnic diversity.
As we have shown, half or more of our respondents wanted immigration to be reduced and were
unhappy about the implications of Australia’s growing ethnic diversity. We found that voters with
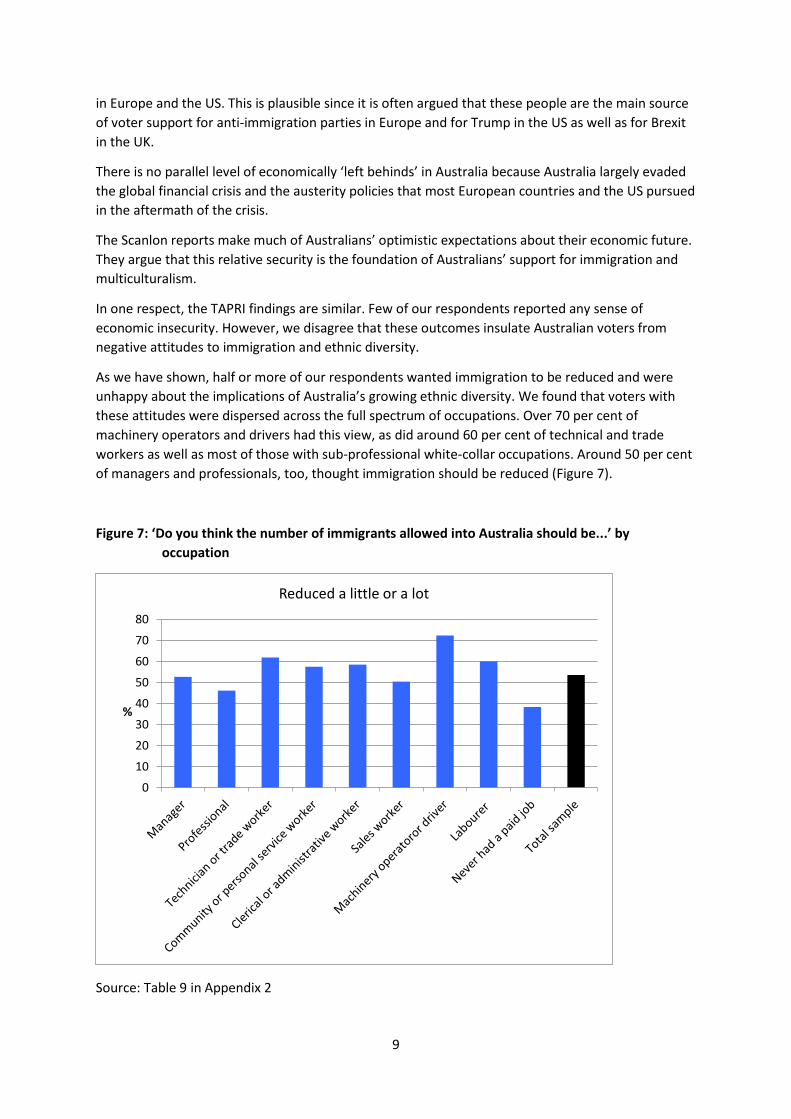
these attitudes were dispersed across the full spectrum of occupations. Over 70 per cent of
machinery operators and drivers had this view, as did around 60 per cent of technical and trade
workers as well as most of those with sub-professional white-collar occupations. Around 50 per cent
of managers and professionals, too, thought immigration should be reduced (Figure 7).
Figure 7: ‘Do you think the number of immigrants allowed into Australia should be...’ by
occupation
Source: Table 9 in Appendix 2
0
10
20
30
40
50
60
70
80
%
Reduced a little or a lot
10
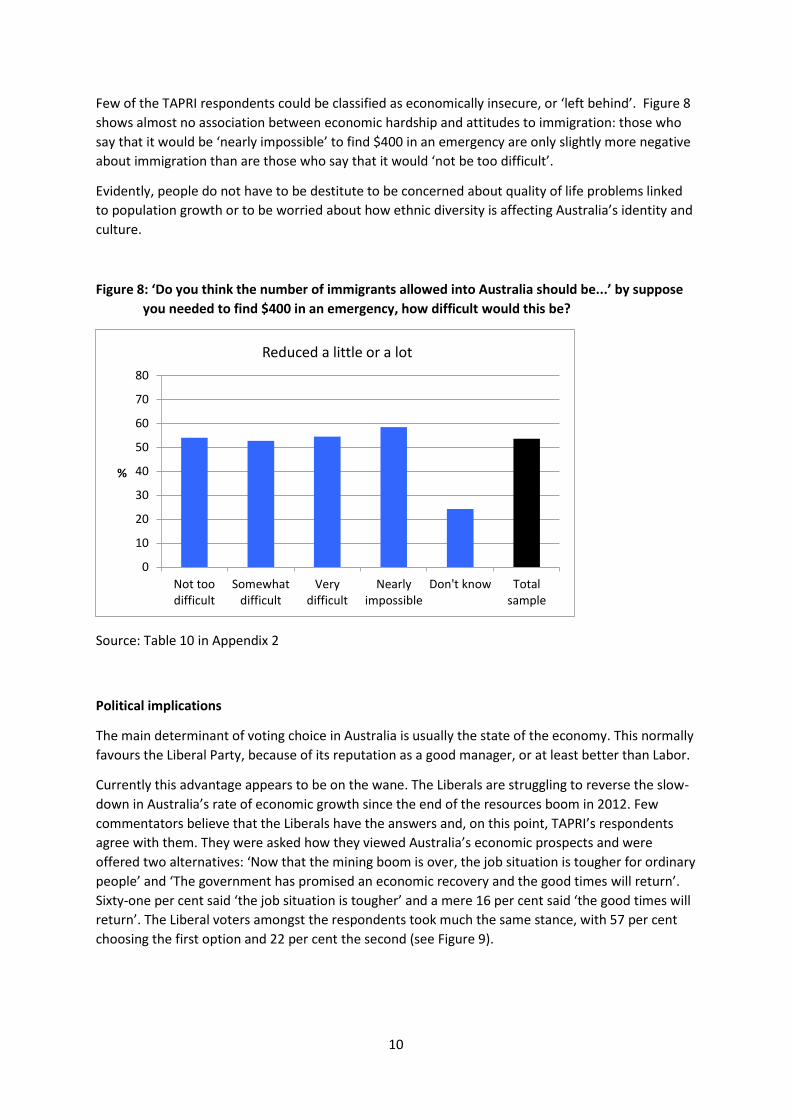
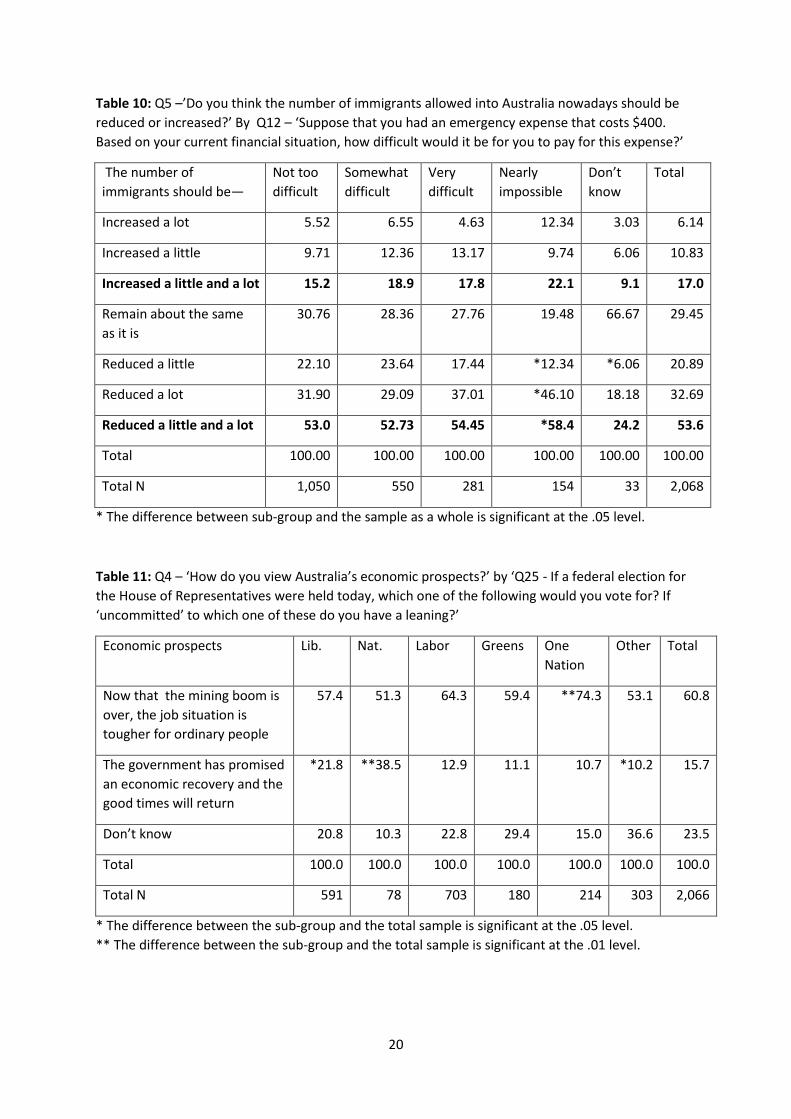
Few of the TAPRI respondents could be classified as economically insecure, or ‘left behind’. Figure 8
shows almost no association between economic hardship and attitudes to immigration: those who
say that it would be ‘nearly impossible’ to find $400 in an emergency are only slightly more negative
about immigration than are those who say that it would ‘not be too difficult’.
Evidently, people do not have to be destitute to be concerned about quality of life problems linked
to population growth or to be worried about how ethnic diversity is affecting Australia’s identity and
culture.
Figure 8: ‘Do you think the number of immigrants allowed into Australia should be...’ by suppose
you needed to find $400 in an emergency, how difficult would this be?
Source: Table 10 in Appendix 2
Political implications
The main determinant of voting choice in Australia is usually the state of the economy. This normally
favours the Liberal Party, because of its reputation as a good manager, or at least better than Labor.
Currently this advantage appears to be on the wane. The Liberals are struggling to reverse the slow-
down in Australia’s rate of economic growth since the end of the resources boom in 2012. Few
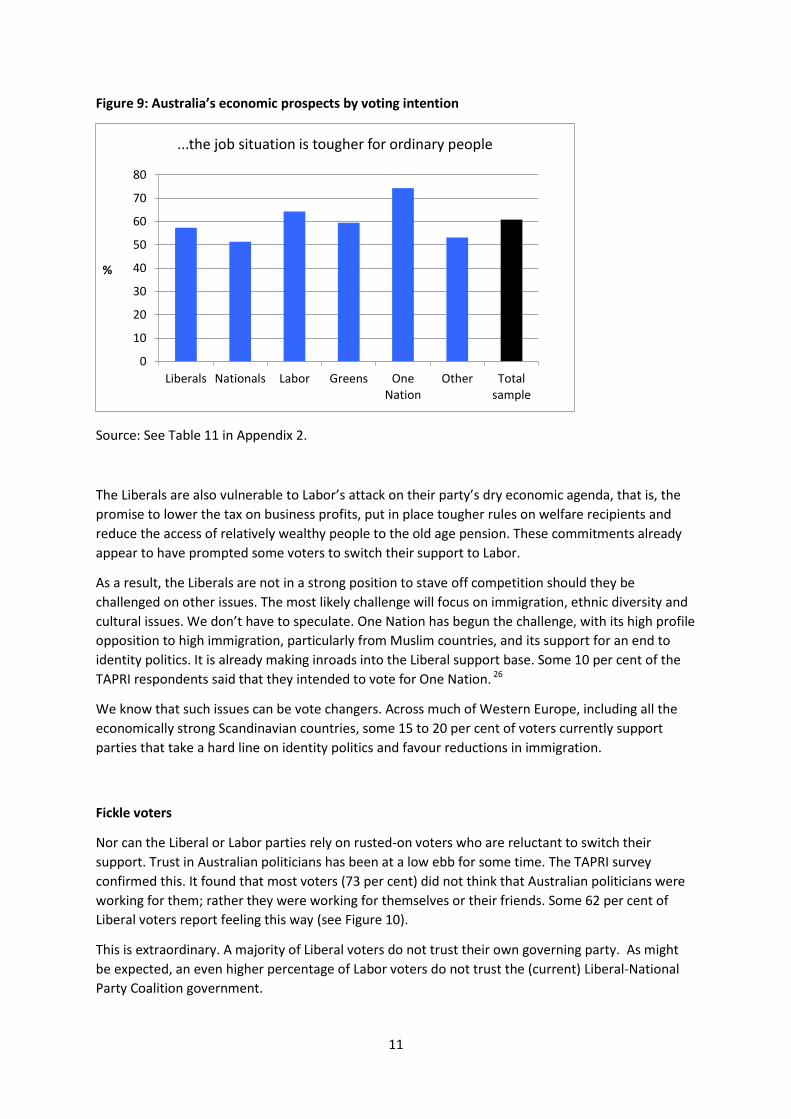
commentators believe that the Liberals have the answers and, on this point, TAPRI’s respondents
agree with them. They were asked how they viewed Australia’s economic prospects and were
offered two alternatives: ‘Now that the mining boom is over, the job situation is tougher for ordinary
people’ and ‘The government has promised an economic recovery and the good times will return’.
Sixty-one per cent said ‘the job situation is tougher’ and a mere 16 per cent said ‘the good times will
return’. The Liberal voters amongst the respondents took much the same stance, with 57 per cent
choosing the first option and 22 per cent the second (see Figure 9).
0
10
20
30
40
50
60
70
80
Not toodifficult
Somewhatdifficult
Verydifficult
Nearlyimpossible
Don't know Totalsample
%
Reduced a little or a lot
11
Figure 9: Australia’s economic prospects by voting intention
Source: See Table 11 in Appendix 2.
The Liberals are also vulnerable to Labor’s attack on their party’s dry economic agenda, that is, the
promise to lower the tax on business profits, put in place tougher rules on welfare recipients and
reduce the access of relatively wealthy people to the old age pension. These commitments already
appear to have prompted some voters to switch their support to Labor.
As a result, the Liberals are not in a strong position to stave off competition should they be
challenged on other issues. The most likely challenge will focus on immigration, ethnic diversity and
cultural issues. We don’t have to speculate. One Nation has begun the challenge, with its high profile
opposition to high immigration, particularly from Muslim countries, and its support for an end to
identity politics. It is already making inroads into the Liberal support base. Some 10 per cent of the
TAPRI respondents said that they intended to vote for One Nation. 26
We know that such issues can be vote changers. Across much of Western Europe, including all the
economically strong Scandinavian countries, some 15 to 20 per cent of voters currently support
parties that take a hard line on identity politics and favour reductions in immigration.
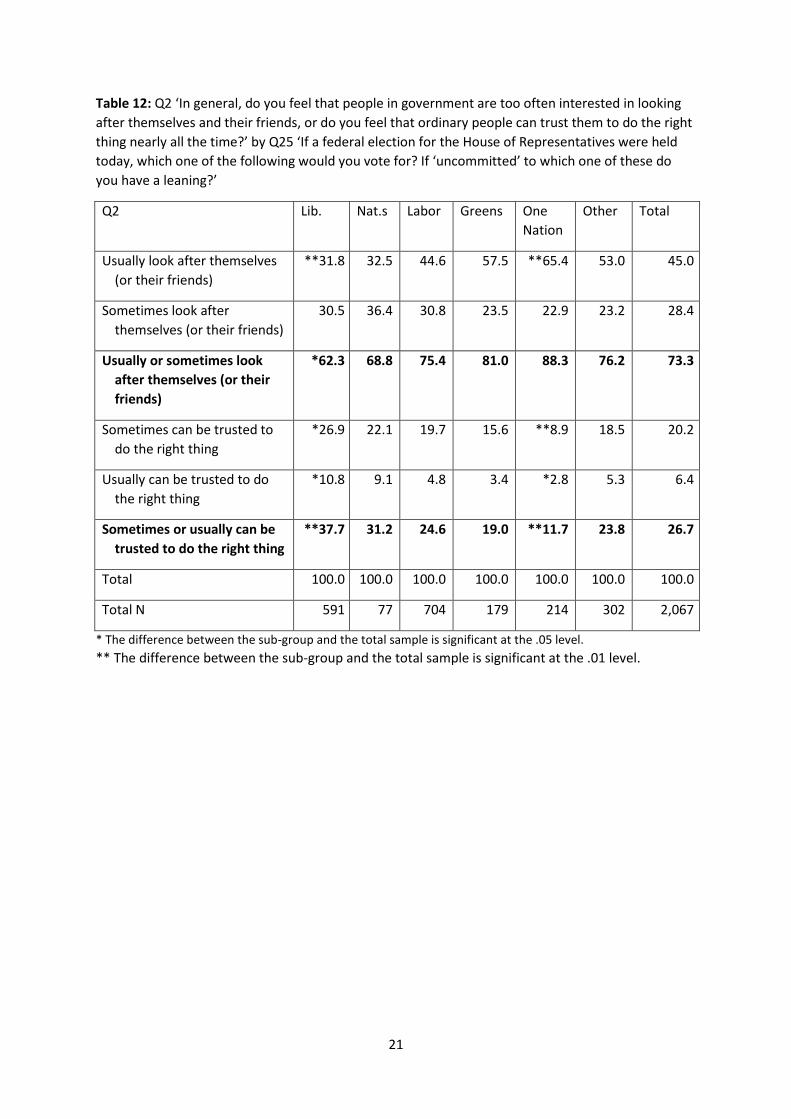
Fickle voters
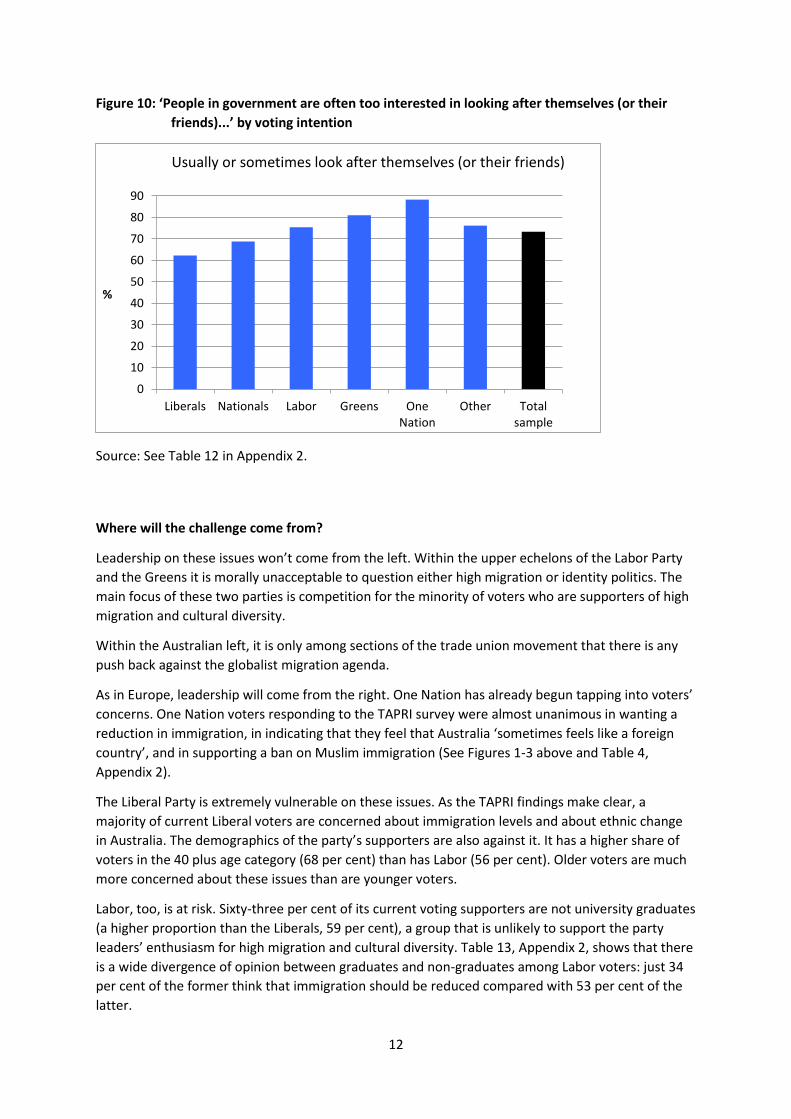
Nor can the Liberal or Labor parties rely on rusted-on voters who are reluctant to switch their
support. Trust in Australian politicians has been at a low ebb for some time. The TAPRI survey
confirmed this. It found that most voters (73 per cent) did not think that Australian politicians were
working for them; rather they were working for themselves or their friends. Some 62 per cent of
Liberal voters report feeling this way (see Figure 10).
This is extraordinary. A majority of Liberal voters do not trust their own governing party. As might
be expected, an even higher percentage of Labor voters do not trust the (current) Liberal-National
Party Coalition government.
0
10
20
30
40
50
60
70
80
Liberals Nationals Labor Greens OneNation
Other Totalsample
%
...the job situation is tougher for ordinary people
12
Figure 10: ‘People in government are often too interested in looking after themselves (or their
friends)...’ by voting intention
Source: See Table 12 in Appendix 2.
Where will the challenge come from?
Leadership on these issues won’t come from the left. Within the upper echelons of the Labor Party
and the Greens it is morally unacceptable to question either high migration or identity politics. The
main focus of these two parties is competition for the minority of voters who are supporters of high
migration and cultural diversity.
Within the Australian left, it is only among sections of the trade union movement that there is any
push back against the globalist migration agenda.
As in Europe, leadership will come from the right. One Nation has already begun tapping into voters’
concerns. One Nation voters responding to the TAPRI survey were almost unanimous in wanting a
reduction in immigration, in indicating that they feel that Australia ‘sometimes feels like a foreign
country’, and in supporting a ban on Muslim immigration (See Figures 1-3 above and Table 4,
Appendix 2).
The Liberal Party is extremely vulnerable on these issues. As the TAPRI findings make clear, a
majority of current Liberal voters are concerned about immigration levels and about ethnic change
in Australia. The demographics of the party’s supporters are also against it. It has a higher share of
voters in the 40 plus age category (68 per cent) than has Labor (56 per cent). Older voters are much
more concerned about these issues than are younger voters.
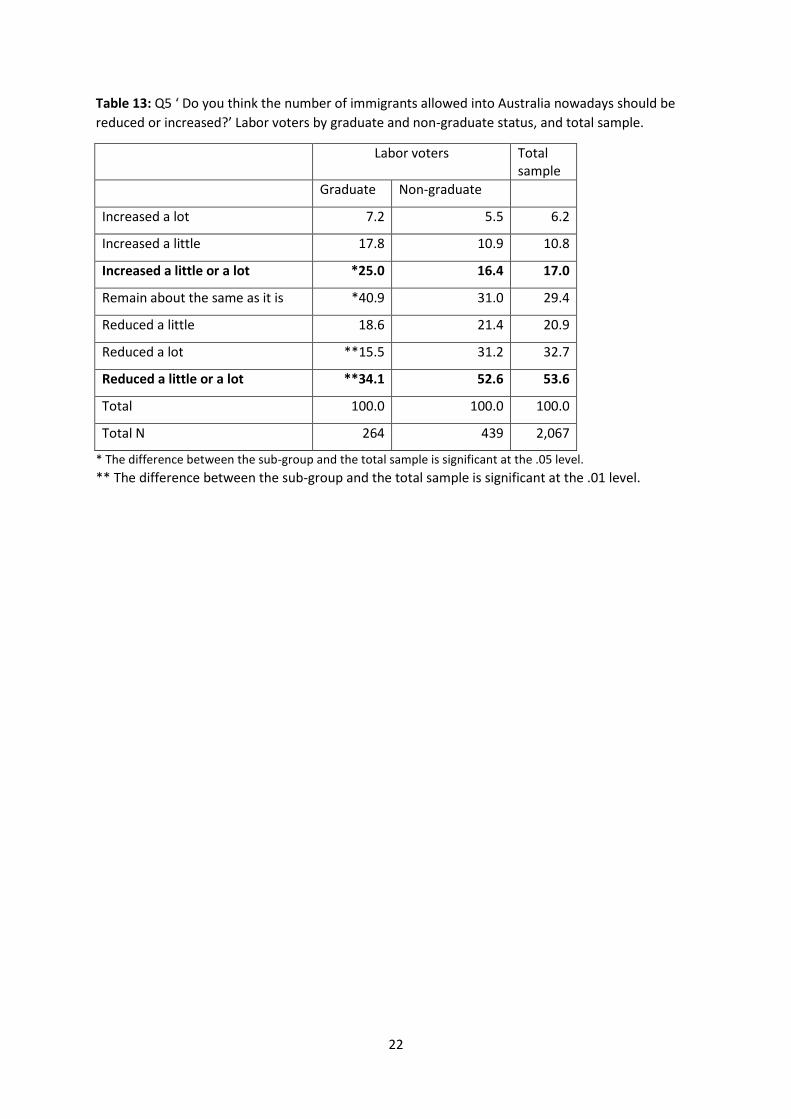
Labor, too, is at risk. Sixty-three per cent of its current voting supporters are not university graduates
(a higher proportion than the Liberals, 59 per cent), a group that is unlikely to support the party
leaders’ enthusiasm for high migration and cultural diversity. Table 13, Appendix 2, shows that there
is a wide divergence of opinion between graduates and non-graduates among Labor voters: just 34
per cent of the former think that immigration should be reduced compared with 53 per cent of the
latter.
0
10
20
30
40
50
60
70
80
90
Liberals Nationals Labor Greens OneNation
Other Totalsample
%
Usually or sometimes look after themselves (or their friends)
13
Many of these Labor voters, especially the non-graduates, could be detached should One Nation or
another conservative party like the Australian Conservatives, or perhaps the Liberal Party itself,
effectively campaign on these issues.
The Liberal Party may have little choice but to mount such a campaign because it faces electoral
oblivion in 2018 if it does not guard its voter base from challengers from the right. If the Liberals do
make such a move, Labor is likely to be a big loser, given that many of its supporters are potentially
responsive to such a move.
The ten per cent of the vote garnered so far by One Nation is well short of the 15 to 20 per cent that
right-wing anti-immigration parties are winning in Europe. The TAPRI survey shows that the share of
voters in Australia potentially open to persuasion on this issue is much greater than this ten-per-cent
figure implies.
Much will depend on whether One Nation, the Australian Conservatives, or the Liberal Party can
mobilise this potential in a national election.
No doubt, should this occur, there will much be elite despair about the state of the nation. But just
as in Europe, such outcomes are only possible because Australia’s elites have consistently ignored
voter concerns on these issues.
14
Appendix 1: Method
The survey ran from Monday 31 July 2017 to 17 August 2017. Questions were chosen, and the
analysis done, by TAPRI: the field work was done by The Online Research Unit. They collected data
from a random national sample of 2067 drawn from an online panel of 300,000 people. The survey
was restricted to voters. Quotas were set with a 10% leeway in line with the ABS distribution for age,
gender and location, including a boost of a minimum n=100 in NT, ACT and TAS. The final data were
then weighted to the actual age, gender, and location distribution according to the ABS Census.
Participants were offered points as token rewards (these could be used to gain access to a cash
raffle, or taken as a $1 payment, or donated to charity). The survey took approximately ten minutes
for them to complete.
A note on Internet panel surveys
Internet panel surveys are used increasingly today, partly because the proportion of households with
fixed line phones who are prepared to respond to phone surveys has decreased. As of December
2014, 29 per cent of Australian adults had no fixed line telephone at home;27 in contrast, as of 2014-
15, 86 per cent of households had Internet access.28 Besides, many of the households that do have
fixed line phones screen their calls. By 2017 response rates to telephone polls in the United States
had sunk to nine per cent.29 Industry sources say that in Australia phone surveys using Robo calls
have response rates as low as two or three per cent.
Today in Australia, among the major polling companies, only Ipsos and Morgan continue to rely on
telephone surveys.30 The others have switched to internet panel polling often combined with Robo
phone calls. This includes Newspoll which made the change with little fanfare in June 2015.31
Critics of Internet panel surveys say that, because they are only partly based on probability sampling,
they lack theoretical credibility. Their supporters say that some of them have proved their reliability
and validity in practice.32 For example YouGov in the UK is dependent on internet panel surveys. It is
now well established and has had success in predicting election outcomes.33 Essential Research in
Australia is fully reliant on random samples drawn from internet panels and has become an accepted
part of the political landscape. One test of external validity is the degree to which an internet panel
survey matches known characteristics of the population it claims to reflect. In the case of voter
support for major parties, the TAPRI findings on voting intentions (Coalition 32%, Labor 34%, Greens
9% and One Nation 10%) are not far off from those of current Newspolls. These of course are now
also based on internet panels, though supplemented by Robo calls, but are generally regarded as the
gold standard in Australian political polling.
15
Appendix 2: Tables
Table 1: Q15 – ‘From December 2005 to December 2016 Australia’s population grew from 20.5
million to 24.4 million; 62% of this growth was from net overseas migration. Do you think Australia
needs more people?’ by Q25 – ‘If a federal election for the House of Representatives were held
today, which one of the following would you vote for? If ‘uncommitted’ to which one of these do
you have a leaning?’
Australia needs
more people—
Lib. Nat. Labor Greens One
Nation
Other Total
Yes 26.6 *43.6 30.2 32.2 **6.1 20.5 25.9
No 73.4 *56.4 69.8 67.8 **93.9 79.5 74.1
Total % 100.0 100.0 100.0 100.0 100.0 100.0 100.0
Total N 590 78 703 180 213 302 2,066
* The difference between the sub-group and the total sample is significant at the .05 level.
** The difference between the sub-group and the total sample is significant at the .01 level.
Table 2: Q5 – ‘Do you think the number of immigrants allowed into Australia nowadays should be
reduced or increased?’ by Q25 – ‘If a federal election for the House of Representatives were held
today, which one of the following would you vote for? If ‘uncommitted’ to which one of these do
you have a leaning?’
... the number of immigrants
allowed into Australia
nowadays should be —
Lib. Nat. Labor Greens One
Nation
Other Total
Increased a lot 4.2 10.3 6.1 16.0 **1.9 6.3 6.2
Increased a little 9.5 15.4 13.5 17.7 **0.9 9.2 10.9
Increased a little or a lot 13.7 25.6 19.6 **33.7 **2.8 15.5 17.1
Remain about the same as it is 29.4 21.8 34.7 37.6 8.0 29.0 29.4
Reduced a little *27.1 29.5 20.3 14.4 **9.9 19.5 20.9
Reduced a lot 29.8 23.1 25.3 **14.4 **79.2 36.0 32.6
Reduced a little or a lot 56.9 52.6 45.7 **28.7 **89.2 55.4 53.5
Total % 100.0 100.0 100.0 100.0 100.0 100.0 100.0
Total N 591 78 703 181 212 303 2,068
* The difference between sub-group and the total sample is significant at the .05 level.
** The difference between sub-group and the total sample is significant at the .01 level.
16
Table 3: Q7 – ‘Today Australia is in danger of losing its culture and identity’ by Q25 – ‘If a federal
election for the House of Representatives were held today, which one of the following would you
vote for? If ‘uncommitted’ to which one of these do you have a leaning?’
...Australia is in danger of losing its
culture and identity—
Lib. Nat. Lab. Greens One
Nation
Other Total
Agree strongly 20.5 19.2 *18.2 **7.8 **59.3 25.4 23.3
Agree *38.6 34.6 28.8 26.3 31.8 28.1 31.8
Agree and strongly agree 59.2 53.8 *47.0 **34.1 **91.1 53.5 55.1
Neither agree nor disagree 17.3 10.3 20.1 22.3 **5.1 20.1 17.6
Disagree 17.8 28.2 21.7 21.8 **2.3 16.2 18.0
Disagree strongly 3.2 6.4 6.4 *14.5 **0.5 4.0 5.2
Disagree and strongly disagree 21.0 34.6 28.1 **36.3 **2.8 20.1 23.2
Not applicable – Australia never had
a distinctive culture and identity
2.5 1.3 4.8 7.3 0.9 6.3 4.1
Total % 100.0 100.0 100.0 100.0 100.0 100.0 100.0
Total N 590 78 702 179 214 303 2,066
* The difference between the sub-group and the total sample is significant at the .05 level.
** The difference between the sub-group and the total sample is significant at the .01 level.
17
Table 4: Q6 – ‘Australia has changed in recent times beyond recognition—it sometimes feels like a
foreign country’ by Q25 – ‘If a federal election for the House of Representatives were held today,
which one of the following would you vote for? If ‘uncommitted’ to which one of these do you have
a leaning?’
…sometimes feels like a foreign
country
Lib. Nat. Labor Greens One
Nation
Other Total
Agree strongly *14.2 19.5 16.4 **7.2 **48.4 22.9 19.3
Agree 36.9 32.5 31.9 24.4 36.6 27.6 32.6
Agree strongly and agree 51.2 51.9 48.2 **31.7 **85.0 50.5 51.9
Neither agree nor disagree 28.3 28.6 28.0 28.3 **9.9 32.9 27.0
Disagree 17.5 14.3 17.6 *27.2 **4.2 12.0 16.1
Disagree strongly 3.1 5.2 6.1 *12.8 **0.9 4.7 5.0
Disagree and disagree strongly 20.5 19.5 23.8 **40.0 **5.2 16.6 21.1
Total 100.0 100.0 100.0 100.0 100.0 100.0 100.0
Total N 590 77 703 180 213 301 2,064
* The difference between the sub-group and the total sample is significant at the .05 level.
** The difference between the sub-group and the total sample is significant at the .01 level.
Table 5: Q23 – ‘Would you support or oppose a partial ban on Muslim immigration to Australia?’ by
Q25 – ‘If a federal election for the House of Representatives were held today, which one of the
following would you vote for? If ‘uncommitted’ to which one of these do you have a leaning?’
Lib. Nat. Labor Greens One
Nation
Other Total
Strongly support 28.8 17.9 **20.2 **8.3 **73.1 30.5 28.5
Support 24.7 25.6 17.9 16.1 **15.6 15.9 19.5
Strongly support and support 53.6 43.6 **38.2 **24.4 **88.7 46.4 48.0
Neither support nor oppose 29.2 25.6 30.8 23.9 **7.1 30.5 27.0
Oppose 12.2 17.9 17.1 *22.8 **1.4 11.3 13.8
Strongly oppose **5.1 12.8 14.0 **28.9 **2.8 11.9 11.2
Oppose and strongly oppose **17.3 30.8 *31.1 **51.7 **4.2 23.2 25.0
Total % 100.0 100.0 100.0 100.0 100.0 100.0 100.0
Total N 590 78 702 180 212 302 2,064
* The difference between the sub-group and the total sample is significant at the .05 level.
** The difference between the sub-group and the total sample is significant at the .01 level.
18
Table 6: Q19 ‘In your opinion has population growth put pressure on — [the following] a lot, a little,
not at all, don’t know’
A lot A little Not at all Don’t know Total % Total N
Schools 48.6 36.3 7.2 7.8 100.0 2,067
Hospitals 68.7 22.0 4.1 5.2 100.0 2,067
Public transport 59.7 27.7 7.4 5.2 100.0 2,067
Roads 66.2 23.1 5.6 5.0 100.0 2,067
Affordable housing 71.2 18.2 5.3 5.3 100.0 2,067
Jobs 65.9 23.5 5.3 5.3 100.0 2,067
The natural environment 49.0 33.2 9.0 8.8 100.0 2,067
Table 7: Q7 ‘Today Australia is in danger or losing its culture and identity’ by graduate and non-
graduate status
Australia is in danger of losing its culture and identity
Graduate Non-graduate Total
Agree strongly *15.3 *28.2 23.4
Agree 28.1 34.1 31.8
Agree strongly and agree **43.4 **62.3 55.2
Neither agree nor disagree 21.1 15.4 17.6
Disagree 22.7 15.1 18.0
Disagree strongly 8.0 3.6 5.2
Disagree and disagree strongly *30.6 *18.7 23.2
Not applicable – Australia never had a distinctive culture and identity
4.9 3.6 4.1
Total 100.0 100.0 100.0
Total N 777 1289 2,066
* The difference between the sub-group and the total sample is significant at the .05 level.
** The difference between the sub-group and the total sample is significant at the .01 level.
19
Table 8: Q23 ‘Would you support or oppose a partial ban on Muslim immigration to Australia?’ by
graduate and non-graduate status
Graduate Non-graduate Total
Strongly support *21.5 32.7 28.5
Support 15.4 21.9 19.5
Support and strongly support **36.9 *54.5 47.9
Neither support nor oppose 28.7 26.1 27.1
Oppose *18.3 11.1 13.8
Strongly oppose *16.1 8.3 11.2
Oppose and strongly oppose **34.4 *19.4 25.0
Total 100.0 100.0 100.0
Total N 777 1,289 2,066
* The difference between the sub-group and the total sample is significant at the .05 level.
** The difference between the sub-group and the total sample is significant at the .01 level.
Table 9: Q5 ‘Do you think the number of immigrants allowed into Australia nowadays should be
reduced or increased?’ by occupation
...the number of immigrants ... should be —
Increased a little or a lot
Remain about the same ...
Reduced a little or a lot
Total % Total N
Managera 18.7 28.6 52.7 100.0 241
Professional *23.0 30.8 *46.2 100.0 565
Technician or trade worker 12.5 25.6 61.9 100.0 168
Community or personal service worker
13.3 29.2 57.5 100.0 120
Clerical or administrative worker
13.0 28.4 58.6 100.0 454
Sales worker 17.7 31.9 50.4 100.0 226
Machinery operator or driver
*10.3 17.2 *72.4 100.0 58
Labourerb 10.8 29.1 60.1 100.0 158
Have never had a paid job 21.9 39.7 *38.4 100.0 73
Total sample 17.0 29.4 53.6 100.0 2,063
* The difference between the sub-group and the total sample is significant at the .05 level. a Including farmer or farm manager b Including cleaner, factory process worker, or farm worker
20
Table 10: Q5 –’Do you think the number of immigrants allowed into Australia nowadays should be
reduced or increased?’ By Q12 – ‘Suppose that you had an emergency expense that costs $400.
Based on your current financial situation, how difficult would it be for you to pay for this expense?’
The number of
immigrants should be—
Not too
difficult
Somewhat
difficult
Very
difficult
Nearly
impossible
Don’t
know
Total
Increased a lot 5.52 6.55 4.63 12.34 3.03 6.14
Increased a little 9.71 12.36 13.17 9.74 6.06 10.83
Increased a little and a lot 15.2 18.9 17.8 22.1 9.1 17.0
Remain about the same
as it is
30.76 28.36 27.76 19.48 66.67 29.45
Reduced a little 22.10 23.64 17.44 *12.34 *6.06 20.89
Reduced a lot 31.90 29.09 37.01 *46.10 18.18 32.69
Reduced a little and a lot 53.0 52.73 54.45 *58.4 24.2 53.6
Total 100.00 100.00 100.00 100.00 100.00 100.00
Total N 1,050 550 281 154 33 2,068
* The difference between sub-group and the sample as a whole is significant at the .05 level.
Table 11: Q4 – ‘How do you view Australia’s economic prospects?’ by ‘Q25 - If a federal election for
the House of Representatives were held today, which one of the following would you vote for? If
‘uncommitted’ to which one of these do you have a leaning?’
Economic prospects Lib. Nat. Labor Greens One
Nation
Other Total
Now that the mining boom is
over, the job situation is
tougher for ordinary people
57.4 51.3 64.3 59.4 **74.3 53.1 60.8
The government has promised
an economic recovery and the
good times will return
*21.8 **38.5 12.9 11.1 10.7 *10.2 15.7
Don’t know 20.8 10.3 22.8 29.4 15.0 36.6 23.5
Total 100.0 100.0 100.0 100.0 100.0 100.0 100.0
Total N 591 78 703 180 214 303 2,066
* The difference between the sub-group and the total sample is significant at the .05 level.
** The difference between the sub-group and the total sample is significant at the .01 level.
21
Table 12: Q2 ‘In general, do you feel that people in government are too often interested in looking
after themselves and their friends, or do you feel that ordinary people can trust them to do the right
thing nearly all the time?’ by Q25 ‘If a federal election for the House of Representatives were held
today, which one of the following would you vote for? If ‘uncommitted’ to which one of these do
you have a leaning?’
Q2 Lib. Nat.s Labor Greens One
Nation
Other Total
Usually look after themselves
(or their friends)
**31.8 32.5 44.6 57.5 **65.4 53.0 45.0
Sometimes look after
themselves (or their friends)
30.5 36.4 30.8 23.5 22.9 23.2 28.4
Usually or sometimes look
after themselves (or their
friends)
*62.3 68.8 75.4 81.0 88.3 76.2 73.3
Sometimes can be trusted to
do the right thing
*26.9 22.1 19.7 15.6 **8.9 18.5 20.2
Usually can be trusted to do
the right thing
*10.8 9.1 4.8 3.4 *2.8 5.3 6.4
Sometimes or usually can be
trusted to do the right thing
**37.7 31.2 24.6 19.0 **11.7 23.8 26.7
Total 100.0 100.0 100.0 100.0 100.0 100.0 100.0
Total N 591 77 704 179 214 302 2,067
* The difference between the sub-group and the total sample is significant at the .05 level.
** The difference between the sub-group and the total sample is significant at the .01 level.
22
Table 13: Q5 ‘ Do you think the number of immigrants allowed into Australia nowadays should be
reduced or increased?’ Labor voters by graduate and non-graduate status, and total sample.
Labor voters Total sample
Graduate Non-graduate
Increased a lot 7.2 5.5 6.2
Increased a little 17.8 10.9 10.8
Increased a little or a lot *25.0 16.4 17.0
Remain about the same as it is *40.9 31.0 29.4
Reduced a little 18.6 21.4 20.9
Reduced a lot **15.5 31.2 32.7
Reduced a little or a lot **34.1 52.6 53.6
Total 100.0 100.0 100.0
Total N 264 439 2,067
* The difference between the sub-group and the total sample is significant at the .05 level.
** The difference between the sub-group and the total sample is significant at the .01 level.
23
Notes
1 Galaxy research, Community Attitudes Study – Prepared for Dick Smith (unpublished) September 2017.. This was an online poll of 1,005 persons (not voters) aged 18 plus. A key result was that 64 per cent of respondents were ‘concerned about Australia’s growing population’. Their reasons were similar to those documented below in the TAPRI survey.
2 Assuming a constant total fertility rate of 1.8 and nil net migration Australia would keep growing from natural increase alone until 2040 or 2053 (depending on the level of life expectancy assumed). See Australian Bureau of Statistics projections series 65 and 62 published online in 2013 with Population Projections, Australia, 2012 (Base) to 2101, Catalogue no. 3222.0.
3 Andrew Leigh, 2017, Choosing Openness, Penguin Special,
4 Ibid., p. 59
5 Ibid.
6 Andrew Markus, Mapping Social Cohesion, The Scanlon Foundation surveys, 2016, p. 39 (This, like most of the Scanlon Reports, is based on a large telephone survey. Since 2013 it has included mobile phones as well as landlines, and the sample is adjusted to bring it into line with Australian Bureau of Statistics demographic indicators, pp. 5, 6. Occasionally this method has been supplemented with online research. See ibid. p. 42.)
7 ‘Immigration to Australia: Almost one in three’, The Economist, October 7 2017, p. 29
8 Leigh, op cit., p. 59
9 David Marr, The White Queen, One Nation and the politics of race, Quarterly Essay, No. 65, 2017, p. 3
10 Ibid., pp. 9. 15, 16. Marr also refers to data from the 2016 Australian Election Study (AES) on One Nation voters and supporters, ibid. p. 46 ff. Tim Colebatch has criticised this usage on the grounds that their numbers in the AES were few. See Tim. Colebatch, ‘Tackling inequality: good for the economy, good for the party’, Inside Story, 26 July 2017 <http://insidestory.org.au/tackling-inequality-good-for-the-economy-good-for-the-party>.
11 Marr, op. cit., pp. 11-14
12 Ibid., p. 11
13 Markus, op. cit., Figure 20, p. 39
14 From 2013 to 2016 the Scanlon questions on diversity included ‘Multiculturalism has been good for Australia’, a statement with which an overwhelming majority has agreed and, in 2016, ‘It is best for Australia if all people forget their ethnic and cultural backgrounds as soon as possible’, (28% agreed), ‘We should do more to learn about the customs and heritage of different ethnic and cultural groups’ (66% agreed), and ‘People who come to Australia should change their behaviour to be more like Australians’ (60% agreed). See ibid., pp. 50-51.
15 See David Goodhart, The Road to Somewhere: The Populist Revolt and the Future of Politics, Hurst & Co., London, 2017, p. 2.
16 See the Essential Report, 2 August 2016 (random sample of 1000+ aged 18 plus, weighted for age and sex, using an online internet panel). This finding was challenged by research done by Roy Morgan, with a telephone poll of 656 people aged 14 plus which reported that ‘Clear majorities of Australians support Muslim immigration (58% cf. 33% oppose)’, 25 October 2016 Finding number 7017. The exact Roy Morgan question is not reported but the interviewing method, sample size and scope are different from that of the Essential Report.
17 Marcus, Mapping Social Cohesion, 2016, op. cit. p. 39
18 Australian Election Study, 2016, our analysis of the data file downloaded from http://www.australianelectionstudy.org/voter_studies.html
19 Wolfgang Streeck, ‘The return of the repressed’, New Left Review, 2017, 104, p. 13
24
20
See research conducted by the Pew Research Center, published in May 2013: ‘From Telephone to the Web: The Challenge of Mode of Interview Effects in Public Opinion Polls’ <http://www.pewresearch.org/2015/05/13/from-telephone-to-the-web-the-challenge-of-mode-of-interview-effects-in-public-opinion-polls/> accessed 14/10/2017
21 Markus, 2016, op. cit., p. 42
22 Andrew Markus also suggests this as a reason for more negative attitudes being found in a series of recent focus groups than in the July-August 2016 Scanlon survey. See Mike Seccombe, ‘Migrants targeted as refugee panic founders’, The Saturday Paper, 20 May 2017.
23 However the Scanlon questions were different. See note 14 above.
24 ‘Pauline Hanson’s 2016 maiden speech to the senate: Full transcript’, The Sydney Morning Herald, 15/9/2016
<http://www.smh.com.au/federal-politics/political-news/pauline-hansons-2016-maiden-speech-to-the-senate-full-transcript-20160914-grgjtm.html>
25 K. Betts, ‘Voters’ attitudes to population growth in Australia: Results of a survey conducted for Sustainable Population Australia’, The Australian Population Research Institute, Melbourne, December 2015, p. 16. See note 2 above for demographic data on this point.
26 Newspoll also has had One Nation on, or close to, 10% since February 2017. See <http://www.theaustralian.com.au/national-affairs/Newspoll> accessed 30/9/2017.
27 ‘Australians get mobile’, by research and analysis section, ACMA, 9 June 2015 <http://www.acma.gov.au/theACMA/engage-blogs/engage-blogs/Research-snapshots/Australians-get-mobile>
28 Household Use of Information Technology, Australia, 2014-15, ABS, Catalogue no. 8146.0
29 Scott Keeter, Nick Hatley, Courtney Kennedy and Arnold Lau, ‘What Low Response Rates Mean for Telephone Surveys’ Pew Research Center, 15 May 2017 <http://www.pewresearch.org/2017/05/15/what-low-response-rates-mean-for-telephone-surveys/> accessed 16/10/2017
30 Adrian Beaumont, ‘Election explainer: what are the opinion polls and how accurate are they?’, The Conversation, 12 May 2016
31 John Stirton, ‘End of the polling “gold standard” may have silver lining’, The Sydney Morning Herald, 9 May 2015, p. 30
32 Peter Kellner, ‘Can online polls produce accurate findings?’ International Journal of Market Research, vol. 46, no. 1, 2004; Humphrey Taylor, ‘The Case For Publishing (Some) Online Polls’, PollingReport.com, vol. no. 2007, January 15 <http://www.pollingreport.com/ht_online.htm> accessed 31 August 2010
33 Kellner, op. cit.