australiaâ€s health system needs re-balancing: a report on the
TRANSCRIPT

ABN: 68 480 848 412
National Rural Health Conference PO Box 280 Deakin West ACT 2600 Australian Journal of Rural Health Phone: (02) 6285 4660 Fax: (02) 6285 4670
Web: www.ruralhealth.org.au Email: [email protected]
Australia‟s health system needs re-balancing:
a report on the shortage of primary care services
in rural and remote areas
January 2011

2
Contents
Executive summary ..................................................................................................................................... 3
Australian health expenditure by remoteness (AIHW 2011) .................................................................. 7 What is and isn‘t reported ......................................................................................................................... 7 Levels of service for primary, diagnostic and specialist care ................................................................. 17 PBS scripts .............................................................................................................................................. 18 Hospital expenditure ............................................................................................................................... 18 Changes over time .................................................................................................................................. 23
The Alliance‟s comments and interpretations ........................................................................................ 25 Why is per capita hospital expenditure higher for people from regional and remote Australia? ........... 25 Areas of health service not able to be addressed in AIHW report. ......................................................... 33
The geographical basis of the AIHW and NRHA reports ..................................................................... 37
References .................................................................................................................................................. 40
3
Australia‟s health system needs re-balancing: a report on the shortage
of primary care services in rural and remote areas
Executive summary
This document has been prepared by the NRHA (the Alliance) to complement the AIHW report,
Australian health expenditure by remoteness, which was commissioned by the Alliance and
published by the AIHW in January 2011.1
The AIHW report relates to the 56 per cent of Australia‘s recurrent expenditure on health
services (ie not including capital costs) that is currently capable of being allocated to the
remoteness area of the patient. Results in the AIHW report have been age standardised so as to
account for the differences in the age and sex profiles of people in the five geographic areas.
Analysis of that 56 per cent shows that in 2006-07 the residents of rural, regional and remote
areas experienced major deficits in per capita expenditure through Medicare, the Pharmaceutical
Benefits Scheme (PBS) and admitted patient services in private hospitals.
In this Alliance report we summarise the AIHW‘s findings, re-interpret some of its conclusions
(particularly those relating to access to PBS and to aged care services), and make estimates of the
geographical distribution of the 44 per cent of recurrent costs not included in the AIHW report.
The conclusions the Alliance reaches are therefore based on both its own work and that
published in the AIHW report. It is to be hoped that in the near future Australia‘s data
collections and systems of analysis will permit the AIHW to publish comprehensive evidence on
the total situation regarding the geographical distribution of health and aged care expenditures
within Australia.
Table 1 summarises the best estimates for 2006-07 of what the Alliance calls the rural and
remote health and aged care deficit. In that year there was a total Medicare deficit of $811
million. This translates to a total of 12.6 million fewer services that year for the people of
regional and remote areas. To this may be added a pharmacy deficit of $850 million and an
‗other primary care‘ deficit of at least $800 million – this last largely attributable to less access
for people from regional and remote areas to allied health and oral and dental care. The
pharmacy deficit means that rural Australians had around 11 million fewer scripts that year than
would have been the case if the Major Cities rate had applied.2
1 For the purposes of the AIHW‘s report, and throughout the discussion in this complementary document,
remoteness is defined according to the Australian Standard Geographical Classification (Remoteness Areas)
(ASGC-RA) system. That system sees all places in Australia allocated to one of five categories: Major Cities (MC),
Inner Regional (IR), Outer Regional (OR), Remote (R) or Very Remote (VR) areas. Sometimes results are reported
by just the two categories: regional areas (ASGC 2 and 3) and remote areas (ASGC 4 and 5). 2 In relation to PBS, adjustments made by the Alliance to account for the much greater proportion of concession
card holders in regional areas (45 per cent compared with 30 per cent in Major Cities) indicate that per capita
expenditure by the Government on PBS is very substantially lower for concession card holders in regional and
remote areas.

4
Adding the Medicare, PBS and ‗other primary care‘ deficits results in a conservative estimate of
$2.46 billion for the rural primary care deficit for the year 2006-07.. The lower levels of
Medicare and PBS expenditure can be largely attributed to poorer access to health professionals.
Table 1: Summary of overall rural health deficit 2006-07
Item $ million Total
MBS – primary and related care deficit 1 661
MBS – in-hospital deficit 2 150
Total Medicare deficit 811
PBS deficit 3 500
Other pharmaceuticals deficit 4 350
Total pharmacy deficit 850
Oral/dental care deficit 5 340-500
Allied health services deficit 6 260-345
Aids and appliances deficit 7 200
Total other primary care deficit 800-1045
Total primary care and related deficit 2,461-2,707
Aged care deficit 8 500 500
Public hospital ‗overspend‘ 9 1,381
Private hospital ‗underspend‘ 10
552
Net hospital ‗overspend‘ 829
Estimated total „rural health deficit‟ 2,132-2,378 1
AIHW figure: includes services from GPs and specialists, diagnostic tests, pathology and radiology. 2 AIHW figure: Medicare rebates for in-hospital services to private patients.
3 Alliance estimate based on higher proportion of concessional cardholders outside Major cities.
4 Alliance estimate of lower usage of scripts not eligible for PBS rebate.
5 Alliance estimate based on total national cost (from AIHW) and mal-distribution of oral health workforce.
6 Alliance estimate based on total national cost (from AIHW) and mal-distribution of allied health
workforce. 7 Alliance estimate assuming 20 per cent lower access to primary care and rehabilitation than in Major
Cities. 8 Alliance estimate, adjusted for aged care needs of Aboriginal and Torres Strait Islander people aged 50-69.
9 AIHW figure: Note that this relates to services for people from rural and remote Australia, not necessarily
in hospitals in rural and remote areas. 10 AIHW figure. Attributable to lower rates of private health insurance and fewer private hospitals in rural
and remote Australia.
The Alliance also estimates a rural and remote aged care deficit of some $500 million. For this,
one of the key assumptions is that Aboriginal and Torres Strait Islander people over the age of 50
need equivalent ‗ageing and aged care‘ services as non-Indigenous people over the age of 70.
The total rural primary and aged care deficit is therefore likely to be around $3.0 billion.

5
This results in a hospital overspend on people from rural and remote areas of some $829 million.
The Alliance‘s case is that extra investment in primary care and aged care for rural areas would
be offset by savings in expenditures on acute care episodes in hospital. Many of these extra
acute care episodes and the longer hospital stays that characterise rural people would be
avoidable with an improved focus in the rural health care system on primary, diagnostic and
early intervention services. Ironically, it is for acute care services that rural people are most
likely to have to travel to Inner Regional base hospitals or Major Cities, which adds to the burden
of their acute care needs.
To put it simply, hospitals are providing rural people with the primary and aged care that is often
not available in many of their home areas. The Alliance estimates that, overall, country people
experienced an extra 60,000 episodes of acute care in 2006-2007 and about 190,000 more
episodes of overnight hospital stay than would have been the case at Major Cities rates.3
Critically, the AIHW report shows that, for the 56 per cent of total health expenditure it
analysed, between 2001-02 and 2006-07 the relative disadvantage of residents of regional and
remote areas worsened by about 10 per cent.4 Despite recent investments in rural health, the lack
of overall improvement in the distribution of health care professionals and in the incidence of
health risk factors in rural and remote areas suggests that this rural health deficit would now be at
least as large in dollar terms today, particularly given the increased population and the change in
prices.
Based on these findings, the NRHA concludes:
1. that Governments and their agencies should move to augment data collections on health
services and costs to enable the complete picture of health and aged care provision in
regional and remote Australia to be assessed;
2. that there is a very strong case for Federal and State governments to boost both proportionate
and total expenditure on primary care, diagnostics, specialist care and access to PBS for
residents of regional and remote areas5;
3. that such an increased focus on rural and remote heath would provide strong support for
governments‘ progress towards national health goals.6 (The Government‘s COAG goals are
very unlikely to be met without improvements in rural and remote areas, with the current
status in those areas pulling down national figures. The stronger focus would require both
better access in country areas to primary care as well as development of healthy economic,
educational and physical environments.);
3 In addition to the poorer access to primary and aged care, higher hospital costs for rural and remote Australians
can be linked to the greater proportion there of Indigenous people, greater exposure to risk factors such as poor
socio-economic status, and higher prevalence of personal risk factors such as smoking and overweight. 4 The AIHW report refers to the period 2001-02 to 2006-07. It is unclear what changes have occurred in the 4 year
period since. 5 Poorer health outcomes in regional and remote areas would suggest that expenditure on primary care should be
higher for residents of these areas compared with Major Cities, not lower. Under the current model of providing
primary care, a substantial number of additional doctors are required in regional and remote areas (especially, but
not limited to, GPs). A broad range of measures is needed, including improving access to nurse practitioners and
telemedicine. 6 Rural Australians constitute 32 per cent of the national population and their poor health, coupled with poor
progress in regional areas towards goals such as lower smoking rates, hold back progress towards these targets.

6
4. that the public hospital ‗overspend‘ on people from regional and remote areas be further
investigated7;
5. that it is important to properly assess the magnitude of aged care under-servicing, especially
taking into account the needs of Aboriginal peoples and the consequent need for regional and
remote hospitals to fill the gap8;
6. that there should be further investigation of the means by which people from regional and
remote areas can be given better access to same-day acute care services9;
7. that a better understanding of the geographic distribution of private hospitals be developed
and how they can be made more accessible to residents of regional and remote areas;
8. that a more equitable distribution of all health professionals should be a key health policy
objective of all governments;
9. that there should be a better understanding of the contribution of the health sector to the
economic activity and sustainability of regional and remote communities; and
10. that, reflecting the importance of the broad determinants of health, a comprehensive analysis
by region of government expenditures related to health would include expenditure on vital
areas such as secondary and tertiary education, housing, employment support and
infrastructure.
7 For instance, what is the true extent of lower levels of access to aged care in these areas, and what are the other
functions of regional and remote hospitals not addressed by Major Cities hospitals? 8 There are fewer non-hospital services to care for the elderly in regional and especially remote areas. Further
investigation is required of these needs and their impact on regional hospitals. 9 Overnight separations are more expensive than same day separations. If rural people are not able to access day
surgery, this places them at both a financial and health disadvantage.

7
Australian health expenditure by remoteness (AIHW 2011)
The key findings of the AIHW report include the following.
Per capita expenditure on Medicare services is lower for residents of regional and remote
areas than for those in Major Cities, and decreases by remoteness.
Per capita public hospital expenditure is higher for residents of rural and remote areas
than for those in Major Cities, and increases by remoteness.
Per capita private hospital expenditure is lower for residents of rural and remote areas
than for those in Major Cities, and decreases by remoteness.
Per capita PBS expenditure per person is lower for residents of rural and remote areas
than for those in Major Cities, and decreases by remoteness.
The relatively small per capita expenditure on optometry is lower for residents of
regional and remote areas than for those in Major Cities;
What is and isn‟t reported
The make-up of the 56 per cent of total health expenditure covered in the AIHW report is
summarised in Figure 1 and falls into one of six categories:
1. admitted patient services in public hospitals;
2. admitted patient services in private hospitals;
3. the cost of in-hospital medical services for private patients attracting MBS rebates;
4. out-of-hospital medical services attracting MBS rebates;
5. 53 per cent of the cost of medications (being the PBS and section100 components of total
pharmaceutical expenditure); and
6. what the AIHW Report describes as limited data on expenditure on Aboriginal
Community Controlled Health Services, totalling some $296 million in 2006-2007.

8
Figure 1: Expenditure reported by remoteness 2006–07
Source: NRHA derived from AIHW 2011
The AIHW report describes only recurrent expenditure on health services, and does not describe
expenditure on infrastructure (capital expenditure).
Results have been age standardised so as to account for the differences in the age and sex
profiles of each of the five populations.

9
Figure 2: Expenditure not reported by remoteness 2006–07
Source: NRHA derived from AIHW 2011
Those areas for which reporting was not possible (Figure 2) include:
1. non-admitted patient services (ie all of A&E and outpatients);
2. non-PBS medication (ie 47% of all medications);
3. community health services;
4. aids and appliances;
5. the cost of other health practitioners (eg allied health);
6. administration and research;
7. public health expenditure;
8. patient transport services;
9. non-Medicare medical services (eg DVA); and
10. the cost of government outlays (especially by the Commonwealth Government) on
support for the rural health workforce, such as the cost of GP attraction and retention
grants, support to visiting specialists, workforce education and training programs)10
.
In addition, expenditure on aged care services was not included in the AIHW‘s report. Given the
close interrelationships of some health services, especially hospital services, and aged care
needs, future analyses of health expenditures by remoteness should include those on aged care.
The AIHW report notes that fifty seven per cent of people in Major Cities have private health
insurance, compared with 48 per cent in Inner Regional and 41 per cent in Outer Regional areas.
However it does not take this analysis further in terms of levels of government subsidy or the
services accessed under these insurance arrangements.
Using the data in Table 2, Figure 3 shows the relatively high proportion of total measured health
expenditure on admitted public hospital services, and its increase with increasing remoteness. Per
10
Some of the impact of government programs of support for rural health workforce is taken into account indirectly,
as they result in higher levels of access to health services than would otherwise be the case.

10
capita expenditure on all other categories declines with remoteness. Total per capita measured
health expenditure was very slightly lower for residents of regional areas than for residents of
Major Cities, but considerably higher for residents of remote areas.
$-
$500
$1,000
$1,500
$2,000
$2,500
$3,000
$3,500
$4,000
MC IR OR R VR
Pe
r ca
pit
a e
xpe
nd
itu
re p
er
ann
um
ACCHOs
PBS
Out of pocket (after Medicare)
Medicare
Private hospitals
Public hospitals
Figure 3: Per capita, hospital, Medicare, PBS and Aboriginal Community Controlled Health
Organisation (ACCHO) expenditure 2006-07
Notes: Age standardised. Excludes non-admitted patients. ‗Out of pocket‘ relates to out of pocket
expenditure for occasions of Medicare service.
Source: Derived by NRHA from AIHW 2011
Figure 4 shows the relative overspends and underspends, assuming expenditure per capita had
been the same for people from regional and remote areas as it was for those from Major Cities.

11
-$2,500
-$2,000
-$1,500
-$1,000
-$500
$-
$500
$1,000
$1,500
$2,000
MC IR OR R VR
Rura
l &
Rem
ote
Mill
ions
of d
olla
rs p
er a
nnum
ACCHOsPBSOut of pocket (after Medicare)MedicarePrivate hospitalsPublic hospitals
Figure 4: Overspend and underspend on hospital and Medicare, PBS and ACCHO expenditure,
compared with Major Cities residents 2006-07
Notes: Age standardised. Excludes non-admitted patients. ‗Out of pocket‘ relates to out of pocket
expenditure for occasions of Medicare service.
Source: Derived by NRHA from AIHW 2011
Table 2: Average age standardised annual per capita recurrent expenditure on Medicare, PBS,
public and private hospitals, out of pocket and ACCHOs, 2006-07
Expenditure area MC IR OR R VR Australia
Per capital expenditure, Australian dollars, 2006-07
Medicare 591 493 442 382 320 552
PBS 321 317 305 301 301 318
Public hospitals 970 1,066 1,240 1,628 2,432 1,043
Private hospitals 351 295 233 182 140 325
Out of pocket 158 132 115 91 61 147
ACCHOs11
3 9 35 238 211 13
Total 2,394 2,313 2,369 2,822 3,465 2,399
Source: Derived by NRHA from AIHW 2011.
Notes: Age standardised. Excludes non-admitted patients. ‗Out of pocket‘ relates to out of pocket expenditure
for occasions of Medicare service. Data in this table for the PBS are derived by NRHA from the AIHW
report, estimated using the different prevalence of card holders and non card holders in regional areas
compared with Major Cities.
11
Note that this is expenditure on ACCHOs per total head of population in each area, not per head of the Indigenous
population in each area.

12
Table 3: Total overspend/underspend in each area, millions of Australian dollars, 2006-07
Expenditure area Total overspend/underspend in each region, millions of
Australian dollars, 2006-07
MC IR OR R VR
Overall
Rural
Shortfall
Medicare (primary,
specialists, diagnostics ) 0 -337 -238 -52 -35 -661
Medicare (in-hospital) 0 -68 -57 -14 -10 -150
Medicare Total 0 -405 -295 -66 -45 -811
PBS (inc. patient co-
payments) 0 -288 -202 -32 -17 -539
PBS (Government
outlays) -505
Public hospitals 0 396 533 208 243 1,381
Private hospitals 0 -229 -234 -53 -35 -552
Hospitals (total) 137 299 155 208 829
Total 0 -606 -221 109 164 -553 Source: Derived by NRHA from AIHW 2011.
Notes: Age standardised. Excludes non-admitted patients. ‗Out of pocket‘ relates to out of pocket expenditure
for occasions of Medicare service. Data in this table for the PBS are derived by NRHA from the AIHW
report, estimated using the different prevalence of card holders and non card holders in regional areas
compared with Major Cities. The total spend for residents of each area includes these reworked figures.
Medicare expenditure
Per capita Medicare expenditure declined sharply with remoteness, being respectively $603,
$504, $453, $392, $276 per capita in MC, IR, OR, R and VR areas (Figure 5).
$-
$100
$200
$300
$400
$500
$600
$700
MC IR OR R VR
Allied health
Dental
Radiation
Operations
Obstetrics
Specialists
Imaging
Pathology
GP & primary care
Figure 5: Per capita age standardised Medicare expenditure, by specialty, 2006-07
Source: Derived by NRHA from AIHW 2011.

13
Per capita expenditure declined not only for total Medicare expenditure, but for all of the
individual specialties (Figure 6). Those specialties for which the decline was steepest included
obstetrics and specialists. The decline in per capita Medicare expenditure was also steep for
allied health and dental, but these Medicare expenditures are only a small part of total
expenditure on these items.
Falls were least steep for pathology, and moderately steep for GPs and primary care, operations,
radiation and imaging.
0
0.2
0.4
0.6
0.8
1
1.2
MC IR OR R VR
Rat
e R
atio
(co
mp
are
d w
ith
pe
r ca
pit
a M
C
exp
en
dit
ure
)
GP & primary care
Pathology
Imaging
Specialists
Obstetrics
Operations
Radiation
Dental
Allied health
Figure 6: Rate ratio showing the decline with remoteness of per capita Medicare expenditure on each
of the specialties considered in the AIHW report
Source: Derived by NRHA from AIHW 2011.
Lower levels of Medicare expenditure outside Major Cities represents an annual per capita
underspend of $98, $149, $209 and $271 for IR, OR, R and VR residents respectively (Figure 7),
with the largest per capita underspends relating to GPs and primary care, specialists, imaging and
pathology.

14
Figure 7: Per capita, age standardised, Medicare underspend, by specialty, 2006-07
Source: Derived by NRHA from AIHW 2011.
The total Medicare underspend in 2006-07 in regional and remote areas was $811 million: $405M,
$295M, $66M and $45M in IR, OR, R and VR areas respectively (Figure 8 and Table 2).
-$450
-$400
-$350
-$300
-$250
-$200
-$150
-$100
-$50
$-
MC IR OR R VR
Mill
ion
s o
f d
olla
rs
Allied health
Dental
Radiation
Operations
Obstetrics
Specialists
Imaging
Pathology
GP & primary care
Figure 8: Total age standardised Medicare underspend, by specialty, 2006-07
Source: Derived by NRHA from AIHW 2011.

15
Table 4: Medicare underspend for residents of regional and remote areas, by specialty, 2006–07
MC IR OR R VR Australia
Millions of dollars
GP & primary
care 0 -152 -95 -18 -13 -278
Pathology 0 -40 -30 -7 -4 -80
Imaging 0 -48 -41 -11 -8 -108
Specialists 0 -96 -69 -15 -9 -188
Obstetrics 0 -16 -9 -2 -1 -28
Operations 0 -27 -25 -7 -5 -64
Radiation 0 -20 -20 -5 -4 -49
Dental 0 -0 -0 -0 -0 -1
Allied health 0 -7 -7 -1 -1 -16
Total 0 -405 -295 -66 -45 -811 Source: Derived by NRHA from AIHW 2011.
PBS expenditure
The Pharmaceutical Benefits Scheme (PBS) provides subsidised medicines to all Australians.
Comparison between regions is complicated because of the difference in funding between
concession card holders and non-card holders (the general population), coupled with the fact that
there are proportionally more concession card holders in regional and (presumably) remote areas
than in Major Cities. The AIHW expenditure report details these numbers: in 2007-08 44-45
per cent of those in regional areas were concession card holders compared with 30 per cent in
Major Cities)12
. Rates in remote areas are not available from the National Health Survey because
of sampling difficulties for small and sparsely distributed populations.
While the AIHW report details these regional differences, the calculations for PBS expenditure
in the report do not allow for them. In the AIHW report, the denominator used in the calculation
of the concessional and general rate of PBS prescription and expenditure is the total population.
Ideally the population of concession card holders should be used as the denominator in the
calculation of rates of PBS prescription for concession card holders, and the population of people
who are not concession card holders as the denominator in the calculation of rates of prescription
for people who do not have a concession card.
As it stands, the AIHW report describes a rate of PBS prescription for non-card holders (the
general population) that is lower (0.85 and 0.80 times) for residents of regional and remote areas
compared with residents of Major Cities, while the rate of prescription for concession card
holders in regional areas was slightly higher, but for remote area residents was lower than for
Major Cities residents.
12
This assumes that all of the 8.8 percent for whom concession card status is 'not known' do not have a concession
card - ie if they don't know, or have not recorded the details, then they probably are not card holders. Proportionally
distributing the ‗not knowns‘ between card holders and non-card holders would slightly reduce the size of the ‗PBS
underspend‘ for regional and remote populations.

16
Calculating these rates separately for non-card holders and for the general population would
require access to age and sex specific population data for card and non-card holders in each of
the remoteness areas. This information is not available from the AIHW report. However,
recalculation of an indicative rate using the total (as opposed to age specific) card holding and
general population data indicates that:
for the general population (ie non-card holders) of regional areas, PBS prescription
rates are likely to be roughly 1.15 (rather than 0.85) times those for their counterparts in
Major Cities;
for the concession card carrying population of regional areas, PBS prescription rates are
likely to be roughly 0.75-0.8 (rather than 1.05) times those for their counterparts in Major
Cities.
Recalculation of rates of expenditure indicates that:
for the general population of regional areas, rates of PBS expenditure are likely to be
roughly 1.05-1.10 (rather than 0.80) times those for their counterparts in Major Cities;
for the card carrying population of regional areas, rates of PBS expenditure are likely to
be roughly 0.75-0.8 (rather than up to 1.05) times those for their counterparts in Major
Cities.
These calculations show that, in 2006–07, while the non-card holding population in regional
areas were overspent roughly $10 per capita, the concession card holders in regional areas (45
per cent of that population) experienced an underspend of between $140 and $190 per capita.
This is a particularly disturbing finding given that concession card holders are those most likely
to be in need of medication, being more likely to suffer poor health than those who are better off.
This underspend is partially offset by the injection of $26.4 million in 2006–07 on Section 100
medicines for Aboriginal Health Services.
This means that the total annual PBS underspend for residents of regional areas (compared with
that spent for residents of Major Cities) in 2006–07 was approximately $490 million. The size of
the underspend for remote area residents is unclear because of the lack of sampling for the NHS
in those areas, but may approximate $50 million.
In total, PBS expenditure for residents of regional and remote areas is therefore underspent by
some $539 million per annum compared with what would be expected if expenditure was the
same as for residents of Major Cities13
. Net of consumer out-of-pocket costs, government PBS
outlays for people in the regions are approximately $500 million less than if Major cities rates
applied.
13 This finding applies only to the 53 per cent of national expenditure on pharmaceuticals relating to the PBS;
geographic distribution of the other 47 per cent of expenditure on pharmaceuticals (being out of pocket expenses
unassociated with PBS co-payments) can only be estimated.
17
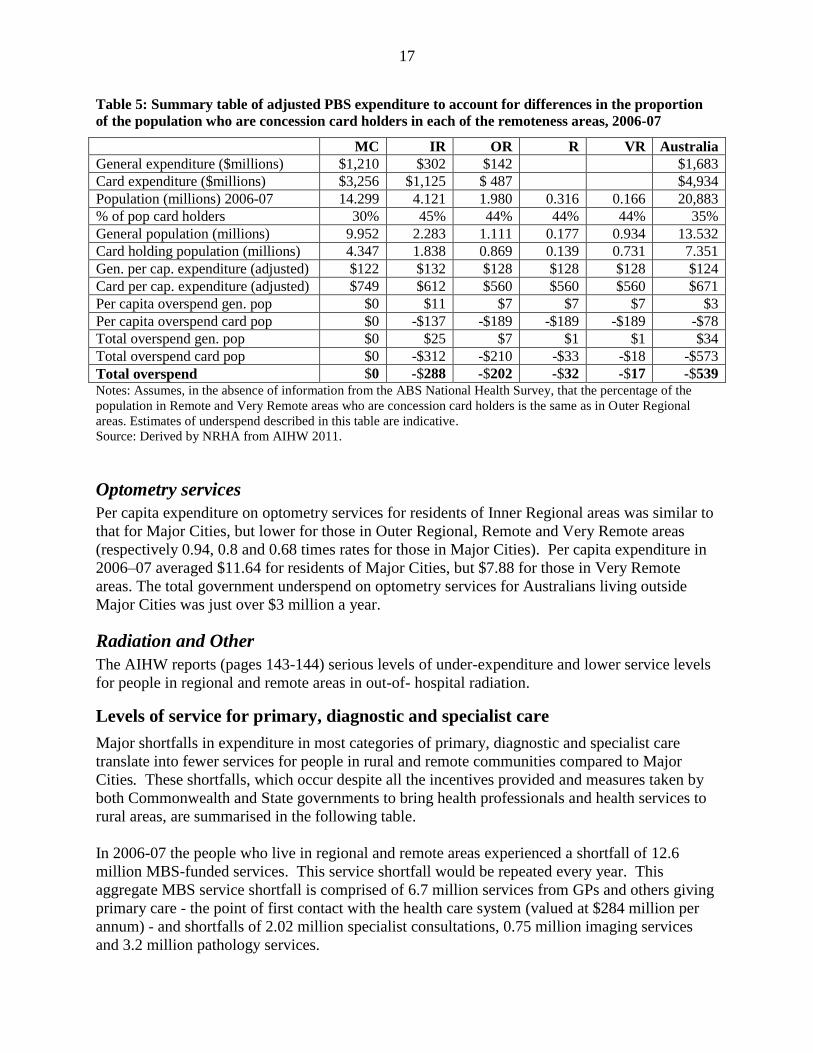
Table 5: Summary table of adjusted PBS expenditure to account for differences in the proportion
of the population who are concession card holders in each of the remoteness areas, 2006-07
MC IR OR R VR Australia
General expenditure ($millions) $1,210 $302 $142 $1,683
Card expenditure ($millions) $3,256 $1,125 $ 487 $4,934
Population (millions) 2006-07 14.299 4.121 1.980 0.316 0.166 20,883
% of pop card holders 30% 45% 44% 44% 44% 35%
General population (millions) 9.952 2.283 1.111 0.177 0.934 13.532
Card holding population (millions) 4.347 1.838 0.869 0.139 0.731 7.351
Gen. per cap. expenditure (adjusted) $122 $132 $128 $128 $128 $124
Card per cap. expenditure (adjusted) $749 $612 $560 $560 $560 $671
Per capita overspend gen. pop $0 $11 $7 $7 $7 $3
Per capita overspend card pop $0 -$137 -$189 -$189 -$189 -$78
Total overspend gen. pop $0 $25 $7 $1 $1 $34
Total overspend card pop $0 -$312 -$210 -$33 -$18 -$573
Total overspend $0 -$288 -$202 -$32 -$17 -$539 Notes: Assumes, in the absence of information from the ABS National Health Survey, that the percentage of the
population in Remote and Very Remote areas who are concession card holders is the same as in Outer Regional
areas. Estimates of underspend described in this table are indicative.
Source: Derived by NRHA from AIHW 2011.
Optometry services
Per capita expenditure on optometry services for residents of Inner Regional areas was similar to
that for Major Cities, but lower for those in Outer Regional, Remote and Very Remote areas
(respectively 0.94, 0.8 and 0.68 times rates for those in Major Cities). Per capita expenditure in
2006–07 averaged $11.64 for residents of Major Cities, but $7.88 for those in Very Remote
areas. The total government underspend on optometry services for Australians living outside
Major Cities was just over $3 million a year.
Radiation and Other
The AIHW reports (pages 143-144) serious levels of under-expenditure and lower service levels
for people in regional and remote areas in out-of- hospital radiation.
Levels of service for primary, diagnostic and specialist care
Major shortfalls in expenditure in most categories of primary, diagnostic and specialist care
translate into fewer services for people in rural and remote communities compared to Major
Cities. These shortfalls, which occur despite all the incentives provided and measures taken by
both Commonwealth and State governments to bring health professionals and health services to
rural areas, are summarised in the following table.
In 2006-07 the people who live in regional and remote areas experienced a shortfall of 12.6
million MBS-funded services. This service shortfall would be repeated every year. This
aggregate MBS service shortfall is comprised of 6.7 million services from GPs and others giving
primary care - the point of first contact with the health care system (valued at $284 million per
annum) - and shortfalls of 2.02 million specialist consultations, 0.75 million imaging services
and 3.2 million pathology services.

18
PBS scripts
The estimated annual shortfall in Government-funded PBS benefits of the order of $500 million
translates to around 11 million scripts a year. This means that the total shortfall in the health
care that helps keep people out of hospital is 3.6 MBS/PBS services for each country person
every year.
Table 6: Deficits by service number for various types of service
MBS services Inner
Regional
Outer
Regional
Remote Very
Remote
Total
„rural‟
GPs, other primary
care
% shortfall cf MC
rate
Specialist services
% shortfall
Pathology services
% shortfall
Imaging services
% shortfall
TOTAL
% shortfall
3,568,895
16%
992,779
26%
1,592,816
10%
341,641
11%
6,496,131
14%
2,187,338
20%
747,330
41%
1,195,848
15%
266,734
18%
4,397,250
21%
509,639
30%
179,072
62%
284,833
23%
81,946
35%
1,055,490
31%
392,834
44%
106,618
70%
136,625
21%
64,027
53%
700,104
41%
6,658,706
2,025,800
3,210,123
754,348
12,648,975
PBS Scripts*
5,220,000 3,810,000 1,400,000 740,000 11,000,000
*Estimated, having adjusted for substantially higher levels of concession cardholders in rural Australia.
Hospital expenditure
Hospital expenditure for admitted patients (ie excluding the costs of services provided to patients
not admitted, such as those who attend an Accident and Emergency department) increases with
remoteness. An assessment of the overall level of access to health services and the balance
between primary and acute care services for Major Cities and regional/remote people requires
close examination.
Summary of AIHW findings regarding hospital services
The AIHW report provides information by remoteness on levels of service for patients admitted
to hospitals (about 90 per cent of government hospital expenditures), but was not able to do so
for hospital-based non admitted services.
Table 3 above shows that overall expenditures on hospital services for people in rural and remote
Australia was about $829 million more than if major city rates applied ($1,381 million in public
hospitals, offset partially by $552 million lower expenditures in private hospitals).

19
The rate of public hospital admission/separation increased with remoteness to twice the Major
Cities rate in remote areas. The rate of separation from private hospitals decreased to 0.35 times
the MC rate in VR areas. The net effect was for lower overall rates in inner regional areas but 2
per cent higher in outer regional areas, 12 per cent in remote, and 56 per cent in very remote.
Total expenditure on public hospital admissions was 10 per cent and 30 per cent higher for
residents of Inner Regional and Outer Regional areas, and roughly twice as high for residents of
remote areas.
Private hospital expenditure tailed off rapidly with remoteness
Total expenditure in hospitals was 5-10 per cent higher per head for regional residents, and 1.35
to 1.95 times higher in remote areas; ie the pattern for per capita expenditure largely followed
that for the rate of separation.
A public hospital separation cost about the same for people in all areas, whereas a private
hospital separation cost roughly 10 per cent more for residents outside MCs.
Length of stay
Overall, there were 7.6 million hospital separations in 2006–07. Of these more than half (4.2
million) were same-day separations, while 3.4 million involved staying in hospital one or more
nights.
Same-day separations (3 million) were more common for Major Cities residents than overnight
separations (2.2 million), whereas for people from regional and remote areas the numbers were
about the same (1.3 million same-day separations and 1.2 million overnight separations).
Rates of overnight separation increased with remoteness to almost double the MC rate for
residents of VR areas. As a result, rates of expenditure on overnight separation increased with
remoteness - expenditure per VR person being double that of a MC resident. Overall, on the
basis of the AIHW report, the Alliance estimates that people outside the Major Cities had about
190,000 more overnight services than if Major cities rates had applied.
Rates of same-day separation were lower for regional (0.86) and Remote (0.92) residents than for
people in the Major Cities, whereas same-day separation rates for VR residents were 1.35 times
higher than for MC residents. Expenditure followed the same pattern: it was similar in all areas
except for VR residents for whom it was 30 per cent higher.
The average cost of an overnight stay in an Australian hospital was $8,043, while a same-day
separation cost $1,311 – less than one-sixth the cost. These costs vary with location, with
overnight separations being up to 15 per cent less expensive for regional and remote residents
than for residents of the Major Cities. In contrast to this, same-day separations for the residents
of regional and Remote (ASGC 4) areas were five to 10 per cent more expensive, but 15 per cent
less expensive for the residents of Very Remote areas (ASGC 5).

20
Acuteness of separations
Of the 7.6 million hospital separations in 2006–07, 7.3 million were acute, while 0.3 million
were not-acute.
Compared to Major city residents, rates of acute separation were lower for Inner Regional but
higher for Outer Regional (4 per cent), rising to 60 per cent higher in remote areas.
Rates of not-acute separation for regional and remote residents were 0.65 times those for MC
residents, but 25 per cent higher for VR residents.
Average per capita expenditure was $1,369 per person, of which $1,238 was for acute separation
and $131 was for not-acute separation.
Rates of expenditure on acute separation increased with remoteness, with expenditure per Very
Remote person being double that of a MC resident. Expenditure per person on not-acute
separations was lower in regional areas, and 15-45 per cent higher for VR residents.
An average acute separation cost $4,332 compared with an average not-acute separation at
$13,313 – three times the cost of an acute separation. Not-acute separations include
rehabilitation, palliative care, geriatric assessment, and maintenance services. Their greater cost
per admission/separation results from the longer hospital stay required. For example the AIHW
Australian Hospital Statistics 2000-2001 reported that not acute services comprised 2.6% of
separations but 11.6% of patient days14
.
An average acute separation costs about the same for residents of each area whereas, on average,
not-acute separations cost 15-30 per cent more for the residents of regional and remote areas than
for those in the Major Cities.
Case studies in hospital experience
Urban, Reg and Remy are three siblings who live, respectively, in (Major Cities) Sydney,
(regional) Dubbo and (Very Remote) Bourke, all in NSW. Note that the terms ‗separation‘ and
‗admission‘ are synonymous.
Reg is just as likely to have a spell in hospital as his brother Urban, but in Reg‘s case it is more
likely to be in a public than a private hospital. Reg‘s admissions are evenly split between
overnight and same-day admissions, while Urban is more likely to experience same-day
separations. Reg is less likely than Urban to have a not-acute separation, but they are equally
likely to experience an acute separation.
The cost of Reg‘s hospitalisation each year is 5-10 per cent higher than for Urban, even though
their rate of hospitalisation is similar. This is because Reg is more likely than Urban to be
admitted overnight, and more likely to be admitted to a public rather than private hospital.
Overnight stays in hospital cost 6 times as much as same-day separations, and public hospital
separations are up to twice as expensive as private hospital separations15
.
14
www.aihw.gov.au/publications/hse/ahs00-01/ahs00-01-x04.pdf - 15
The seriousness of the condition and the complexity of care are likely to be greater in public hospitals.

21
Their brother Remy from Bourke will have a quite different experience. He is about one and a
half times as likely to separate from hospital compared with brothers Urban and Reg, and over
twice as likely to separate from a public hospital but about a third as likely to separate from a
private hospital as Urban. Remy is almost twice as likely as Urban to separate from hospital
after one or more nights in hospital, and only about 30 per cent as likely to separate from hospital
on the same day. Compared with Urban, Remy is 1.2 times as likely to have a non-acute
separation and 1.6 times as likely to have an acute separation
The annual cost of Remy‘s hospitalisations is twice as high as it is for Urban. This is because
Remy separates from hospital about one and half times as frequently as Urban, and the bulk of
these are from a public hospital, where the cost of separation is up to double that of private
hospitals. Also, the cost of overnight separation is 6 times that of a same-day separation.
Admitted and non-admitted patient services in context
Australian hospitals provide both admitted patient services and non-admitted patient services.
In 2008/09, there were a total of 4.9 million admissions/separations from public hospitals and
3.25 million admissions/separations from private hospitals AIHW 2010. In 2006/07, expenditure
on admitted patients was $21.8 billion in public hospitals and $6.8 billion in private hospitals
(AIHW 2011). While not stated in the AIHW report, hospital revenues (ie income in addition to
government funding (eg from health insurance companies)) in 2008/09 were $3 billion for public
hospitals and $9 billion for private hospitals (AIHW 2010).
In 2008/09, there were 49.2 million non-admitted occasions of service provided by public
hospitals and 2.0 million non-admitted occasions of service provided by private hospitals (AIHW
2011 page 12).
Non-admitted patient care
Expenditure on non-admitted patients ($6.6 billion nationally in 2006/07) has been excluded
from the AIHW Rural Expenditure report. In an analysis of data from 2007/08, the Productivity
Commission (Productivity Commission 2009, chapter 2, page 37) reports that of 48.8 million
non-admitted occasions of service, there were:
7.1 million A&E services;
16.4 million occasions of outpatient care16
;
24.9 million other occasions of individual patient care; and
0.4 million group sessions.
It is clear that the bulk of hospital expenditure is on admitted patients, but the majority of
services are for non-admitted patients.
In 2001-02, ratios of Accident and Emergency attendance to population were 236, 359, 413, 853,
and 933 per 1000, in MCs, IR, OR, R and VR areas respectively (AIHW 2003 page 22).
Hospitals in rural and remote areas
In 2008–09, there were 1,317 hospitals in Australia. Of these:
16
Outpatient-related care includes Allied health, Dental, Dialysis, Endoscopy and related procedures, and Other
medical/surgical/obstetric occasions of service.

22
285 (22 per cent) were private free-standing day hospital facilities;
276 (21 per cent) were other private hospitals;
737 (56 per cent) were public acute hospitals; and
19 (1 per cent) were public psychiatric hospitals..
Of the 737 public acute hospitals,
23 principal referral hospitals were in regional areas and 1 was in a remote area.
17 large hospitals were in regional areas and 1 was in remote areas.
70 medium hospitals were in regional areas and none were in remote areas.
110 small acute hospitals were in regional areas and 40 were in remote areas.
2 rehabilitation hospitals were in regional areas.
62 small non-acute hospitals were in regional areas and 11 were in remote areas.
47 multipurpose services were in regional areas and 32 were in remote areas.
78 ‗other‘ hospitals were in regional areas and 77 were in remote areas.
Table 7: Public hospitals in Major Cities, regional and remote areas, by type
Hospital
type MC Regional Remote Total
Average
beds
Separations
(average)
ALOS
(days)
Non-
acute
care
(patient
days
%)
Principal
referral 50 23 1 74 411.8 42,058 3.4 8.1
Specialist
women‘s and
children‘s 11 0 0 11 200.8 20,634 3.1 0.5
Large acute 23 17 1 41 143.5 15,419 3 13.1
Medium
acute 22 70 0 92 64.1 5,770 3.2 21.3
Small acute 0 110 40 151 21.6 1,205 3.2 10.6
Psychiatric 10 9 0 19 110.7 554 54.7 51.6
Rehabilitation 6 2 0 8 70.5 1,104 20.8 91.2
Mothercraft 8 0 0 8 26.5 1,683 3.6 0
Small non-
acute 13 62 11 86 28.4 883 8.5 67.9
Multi-
purpose
services 0 47 32 79 12 345 4.3 29
Other 32 78 77 187 13.1 233 15 85.8
Total 175 418 162 756 74.7 6,434 3.7 17.1 Source: AIHW 2010 page 65
Nationally, there were 56,478 beds in public hospitals and 27,466 in private hospitals, and while
it is possible to describe how many beds are available in public hospitals in each remoteness
area, we have been unable to locate the same for the 561 private hospitals.

23
Table 7 suggests smaller numbers of beds in regional and remote hospitals because of the greater
prevalence in those areas of smaller hospitals. The average number of beds in each hospital in
MC, IR, OR, R and VR areas is 190, 55, 30, 18 and 13.
Two other pieces of information from the AIHW report (AIHW 2011) may be useful in
interpreting health expenditure in regional and remote areas:
fifty seven per cent of people in Major Cities have private health insurance, compared with
48 per cent in IR areas and 41 per cent in OR areas; and
approximately 30 per cent of the residents of Major Cities have a government concessional
health card, compared with almost 45 per cent in regional areas.
Changes over time
The rural and remote health deficit appears to be increasing.
The new AIHW report also indicates slower growth in expenditure in regional and remote areas
for all of the areas of expenditure for which time series were investigated (Figure 9).
-30
-20
-10
0
10
20
30
40
50
MC IR OR R VR
Remoteness of residence
Perc
en
t ch
an
ge
Hospitals
GPs
Pathology
Imaging
Specialists
Figure 9: Percentage change in age standardised expenditure per person, adjusted to 2006-07 prices,
2001-02 to 2006-07
Source: AIHW 2011

24
Table 8: Percentage change in age standardised expenditure per person, adjusted to 2006-07 prices,
2001-02 to 2006-07
MC IR OR R VR Australia
Percent change 2001-02 to 2006-07
Hospitals 19.5 9.8 7.5 8.2 5.2 15.3
GPs 4.9 -4.1 -3.8 -0.3 13.5 2.5
Pathology 2.8 -6.3 -6.7 -2.8 40.4 0.2
Imaging 4.1 -5.8 -6.2 -11.5 0.7 1.1
Specialists -6.6 -13.9 -17.3 -20.6 -9.3 -8.6 Source: AIHW 2011
Notes: This table describes the data illustrated in Figure 9 above.
While per capita hospital expenditure increased over time at a lower rate for residents of regional
and remote areas than for residents of Major Cities, Medicare benefits paid per capita on the four
categories of Medicare expenditure examined in the report decreased for regional and Remote
residents (but increased for Very Remote residents). Per capita Medicare benefits paid for
residents of Major Cities increased (except for specialists).

25
The Alliance’s comments and interpretations
Hospital expenditure for people from regional and remote Australia
Total admitted public hospital patient expenditure was $1.381 billion higher for the 7 million
people living in regional and remote areas than would be expected if the per capita Major Cities
rates applied. Net of lower levels of private patient services ($552 million less) the additional
expenditures in admitted hospital services was an estimated $829 million.
These costs are explained by the proportionately higher levels of acute care and by the
proportionately greater number of hospital overnight stays for people in regional, rural and
remote Australia compared to rates of service applying in Major cities.
Based on AIHW data the Alliance calculates that people outside the major cities have about
60,000 additional episodes of acute care, costing an additional $890 million and about 190,000
more episodes of overnight care (this figure including probably the vast bulk of the acute care
services) costing an additional $851 million. (These figures probably largely overlap because
many of the additional acute care episodes would also result in overnight stays.)
People outside of major cities have about 30,000 fewer episodes of non-acute care, but the same
levels of expenditure per head because of the greater cost of these non acute services for people
outside the major cities.
Higher levels of acute care
The reasons for higher levels of acute care include the facts that:
rates of separation for potentially preventable diseases are higher in regional and
remote areas than in Major Cities, indicating lower access to primary care; and
the population in regional and remote areas has lower socio-economic status and
greater need for treatment.
The health needs of remote and very remote populations including the much higher proportion of
Aboriginal people in those areas is especially crucial, as these regions constitute about 7.3 per
cent of the population outside major cities, but over 40 per cent of additional acute care costs.
Higher hospital expenditure related to potentially preventable hospital
admissions
Potentially preventable hospitalisations are those that are assessed as having been avoidable if
timely and adequate non-hospital care had been provided.
Rates of separation for potentially preventable diseases are higher in regional and especially
remote areas (AIHW 2008b). In Australian Hospitals 2006–07 (AIHW 2008b), AIHW reports
that the rates of potentially preventable hospital separations17
are 15 per cent to 35 per cent more
likely for residents of regional areas, and over twice as likely for residents of remote areas.
17
Eg vaccine preventable diseases, cellulitis, ear nose and throat infections, dehydration and gastro, angina,
complications of diabetes, asthma, COPD etc.

26
Reducing the likelihood of these admissions for regional and remote areas residents to the rate
found amongst residents of Major Cities reduces the crude separation rate from 370 to 330 per
1000 regional residents, 370 to 310 per 1000 Remote residents, and from 460 to 390 per 1000
Very Remote residents. These adjustments result in hospitalisation rates that are broadly similar
for residents of MC, IR, OR and Remote areas, but still slightly higher for the residents of Very
Remote areas.
Table 9: Potentially preventable hospitalisations, 2006-2007
MC IR OR R VR
Sep rate per 1000 pop 30.18 34.42 40.35 65.08 70.54
Population 14,298,739 4,121,127 1,980,209 316,271 166,434
Total avoidable separations 431,536 141,849 79,901
20,583
11,740
Avoidable separations as a
percentage of all
separations 8% 9% 11% 18% 15% Source: row 1 from page 71 Aus hosp stats 2006-07, row 2 from page 134 of AIHW health expenditure by
remoteness report, row 3 calculated by NRHA
Note: this calculation of total avoidable separations is an estimate; the rate in the first row is age standardised.
Figure 10: Comparison with hospital admission rates in Major Cities if “all” potentially preventable
admissions were prevented, 2006-07
Source: row 1 from page 71 Australian Hospital Statistics 2006-07, row 2 from page 134 of AIHW health
expenditure by remoteness report, row 3 calculated by NRHA.
Notes: derived by NRHA from Table A5.2 in Australia‘s Hospitals 2006–07 (AIHW 2008b).
Potentially preventable hospital admissions are defined as ―...those conditions where hospitalisation is thought to
be avoidable if timely and adequate non-hospital care had been provided.‖ However, ―...the list of PPHs is not
comprehensive - there are other hospital admissions which may be preventable.‖
By way of example, rates of separation for diabetes complications potentially preventable
through primary care were up to 1.5 times higher for residents of regional areas and between 3
and 4 times higher for residents of remote areas than for residents of Major Cities.

27
From Figure 10, it is clear that potentially preventable admissions are responsible for much of
the difference in admission rates. Addressing primary care, illness prevention and health
promotion would do much to reduce admissions to hospital by residents of Regional and Remote
areas. Note that the admission rate in VR areas is still higher than in MCs, but appreciably
lower than it would otherwise have been.
―The selected potentially preventable hospitalisations (PPHs) are those conditions where
hospitalisation is thought to be avoidable if timely and adequate non-hospital care had
been provided. Separation rates for PPHs therefore have potential as indicators of the
quality or effectiveness of non-hospital care. A high rate of potentially preventable
hospitalisation may indicate an increased prevalence of the conditions in the community
or poorer functioning of the non-hospital care system.
The definition does not include those admissions that could have been prevented by lifestyle
modification (eg quitting smoking, better diet, active lifestyle) or by modification of the
environment or society (eg safer roads and vehicles, cleaner air, more control over environment,
better education, better access to reliable and high quality work, supportive and predictable
climate, good governance, control of disease vectors, etc).
In other words, while better access to primary care would result in lower hospitalisation rates,
and in more similar rates of admission in each of the areas, focus on true (broad) primary health
care would deliver still further benefits in health and reduced need for high cost acute care. It is
very likely that with good access to primary health care, and to a physical, social and built
environment in regional and remote areas designed to promote health, hospital admissions in
regional and remote areas would be no more than in Major Cities.
Poorer health of the population and greater need for treatment
Higher levels of hospital admission may also indicate an appropriate use of the hospital system
to respond to greater need. People living in regional and remote Australia have, on average,
poorer health and worse health outcomes than people in Major Cities. Rural people experience:
less access to education and to higher level jobs;
lower average incomes;
lesser access to primary care;
cultural issues (eg related to higher rates of smoking and drinking; less physical activity;
overweight);
occupational and environmental hazards (eg agricultural jobs and higher risk of high
speed road accident); and
poorer access to fresh and healthy food.

28
Examples of poorer health in regional and remote areas
In regional and remote areas, and compared with Major Cities:
Death rates are 1.05–1.15, and 1.2–1.7 times as high;
Asthma, bronchitis and arthritis are about 20 per cent more prevalent;
Rates of infectious disease (for example Ross river virus, Salmonella, several
STIs) are frequently several times higher;
The prevalence of disability in males is at least 20 per cent higher;
Death rates due to injury are 1.3–1.5, and 1.8–3.2 times higher. (Phillips 2009)
―In 2008–09, there were 869.8 separations per 1,000 population for Indigenous
Australians, 2.5 times the separation rate for Other Australians. About four-fifths of the
difference between these rates was due to higher separation rates for Indigenous
Australians admitted for maintenance renal dialysis.‖ (AIHW 2010 p 137).
Bearing in mind that Indigenous people make up 44 per cent of the population in Very Remote
areas, it is likely that a substantial proportion of the inter-regional difference in the rate of
separation is likely to be a consequence of higher rates of admission for dialysis. It is unclear to
what extent the need to travel would require these admissions to be overnight and to what extent
this adds to expenditure in remote hospitals.
One would expect higher rates of hospital admission so as to address poorer health. However,
there would appear to be a range of options which could reduce this level of poor health, through
greater access to primary care, better access to education and to higher socio-economic status
work, better access to housing and healthy foods , and so on, which would be expected to result
in lower rates of hospital admission.
Once again, a focus on both better access to primary care and on broad primary health care
would assist to reduce rates of these diseases and the need for hospital admission.
Compounding their prospects, people from regional and remote areas have lower levels of access
to many hospital procedures which have the capacity to reduce the odds of future poor health.
Australian Hospital Statistics 2006–07 (AIHW 2008b) reports lower rates of separation for a
range of procedures for residents of remote areas, and in some cases residents of regional areas.
It is highly probable that other procedures are also less common for residents of regional and
remote areas – but a comparison for the complete range of procedures, by remoteness area of the
patient, has not been published.

29
Table 10: Standardised separation rate ratios for selected hospital procedures, by area of
residence, 2006–07
MC IR OR R VR
Cholecystectomy 0.98 1.09 1.01 0.83 0.73
Coronary angioplasty 1.06 0.92 0.84 0.81 0.62
Coronary artery bypass graft 1.00 0.99 1.05 0.88 0.88
Hip replacement 0.95 1.12 1.07 0.89 0.55
Knee replacement 0.94 1.15 1.08 0.83 0.70
Myringotomy 1.03 1.01 0.89 0.70 0.54
Prostatectomy 1.00 1.04 0.96 0.73 0.56
Tonsillectomy 0.96 1.19 1.01 0.86 0.43 Source: AIHW 2008b.
Higher levels of overnight stay
There are many likely causes of higher levels of overnight stay for people from rural and remote
areas, including the higher levels of acute care described above.
In addition to this, presentation at hospital of someone from a Regional or Remote area is more
likely to lead to their admission for reasons broadly associated with precaution. Where (as in the
bulk of occasions) their presentation is to a hospital in their home area (ie in a regional or remote
area), the lesser availability of specialists and advanced diagnostic equipment means there is a
lower probability of a definitive diagnosis. This means there is more likely to be an overnight
admission as a precautionary measure. Secondly, longer return travel distances for some patients
may make precautionary admission more likely – given also local understanding of logistical
challenges with returning home.
In addition to these precautionary admissions, hospitals in regional and remote areas cover for
the lack of access to access to residential aged care, rehabilitation services and domiciliary
support for patients who no longer require acute inpatient care.
It also appears likely that there are regional differences in the patterns of care because of the
level of availability of specialist staff and infrastructure. For example, in rural regions where
geriatric, rehabilitation and palliative care specialists are not as readily available as in
metropolitan regions, patients may be more likely to be assigned to less ‗specific‘ rehabilitation
categories.
Higher hospital expenditure related to lower supply of aged care
One of the likely significant reasons for higher levels of longer stay hospital expenditure for
people in regional and remote areas is the need for hospitals to accommodate frail aged people
because of the lower supply of residential aged care places and aged care packages in those
areas. It seems likely that older people often move to larger and less remote centres (eg regional
hubs) to access aged care and hospital services, thereby reducing the apparent magnitude of the
undersupply of aged care services in those (especially remote) places.
The under-supply of aged care places in regional and remote areas is likely to be more serious
than is often assumed. Indigenous people over the age of 50 years and non-Indigenous people
over 70 years are considered, on average, to have a similar need for aged care. While the

30
proportion of the population in Major Cities who are Indigenous is only 1 per cent, it rises in IR,
OR, R and VR areas to 2, 5, 13 and 44 per cent respectively.
If the denominator for the calculation of rates is altered from the total population in each area
older than 70 years, to the number of Indigenous people older than 50 years plus the number of
non-Indigenous people older than 70 years, the rates of aged care provision are much poorer, as
shown in Table 11.
Table 11: Actual residential aged care places, CACP and EACH packages available, per 1000
persons aged 70+ years (scenario a) and per thousand non-Indigenous 70+ and Indigenous 50+
years (scenario b), by ASGC Remoteness area, 30 June 2006
MC IR OR R VR
Rate per 1000 population
Total aged care places per 1000, based
on population aged 70 and over (a) 108 115.1 104.2 112.2 219.1
Total aged care places per 1000, inc.
Aboriginal people aged 50-69 (b) 107 111 98 90 111 Source: Derived by NRHA from AIHW 2008.
Note: Rates reported have been recalculated using a modified denominator - the non-Indigenous population
in each area aged 70+ plus the Indigenous population in each area aged 50+ based on 2001 figures (the
most recent available).
An AIHW report on aged care 2008-2009 shows that country regions other than very remote
have at least a 2 per cent shortfall in the provision of aged care, compared to Major Cities. It also
notes that, if adjusted for Aboriginal aged care needs for people age 50-69, the provision of aged
care services falls short nationally by an additional 2.9 per cent. Given that 70 per cent of
Aboriginal people reside in rural and remote Australia, it can be concluded that most of this
additional shortfall would also be in rural areas. With government aged care outlays of $10
billion in 2008-2009, the Alliance considers that aged care provision could be short by close to
$500 million, even before considering the likely higher costs of providing aged care services in
rural and remote areas.
Equitable provision of aged care services is crucial now, and will become increasingly so as the
population ages and as the share of older people in regional areas (especially Inner Regional)
increases. Information on the adequacy of aged care services is therefore vital to assess the
adequacy of the health care system in rural areas.
Nursing home care units are more common in regional and remote hospitals than in Major Cities
hospitals. For example, of the 261 nursing home care units in Australian hospitals, 13 are in
Major Cities hospitals, while 191 are in regional hospitals and 57 are in Remote area hospitals
(AIHW 2010 page 71). This equates to 7 per cent of Major Cities hospitals, 46 per cent of
regional hospitals and 35 per cent of remote area hospitals.
Seventy nine regional and remote hospitals are classified as Multi-purpose Services (MPSs).
These hospitals were generally combined with services for residential aged care, and mainly
provide non-acute admitted patient care. The Alliance regards these as good models for service
delivery in regional and remote areas, where the combination of a number of services provides
some economies of scope and maintains essential services in these communities, including aged

31
care. It is unclear whether the aged care provided in these 79 MPSs is additional to that described
for those hospitals in regional and remote areas which contain nursing home care units discussed
in the point above.
Rates of separation for patients receiving maintenance and psychogeriatric care in regional areas
were 1.05 to 1.35 times those in Major Cities, and in remote areas were twice those in Major
Cities. Even more significant, per capita consumption of patient days in IR and OR areas were
1.9 to 4.4 times those in MCs, while in R and VR areas average per capita consumption was 9
and 5.8 times that in Major Cities (AIHW 2008 p 19).
This higher hospital admission rate can be explained by different patterns of separation from
hospital into residential aged care with lower levels of admission and lower levels of permanent
admission to residential aged care. Karmel et al (AIHW 2008. Karmel, Lloyd and Anderson p
72) note that:
‘The most striking difference was the decreasing relative use of permanent admissions as
the remoteness of the RAC facility increased: for facilities in Major Cities 75 per cent of
people admitted from hospital went into permanent care compared with under 50 per
cent for those in remote and very remote regions.... The models on discharge..., show..
that people from more remote regions were less likely than others to be discharged into
RAC, and that the resulting admission into care was even less likely to be for permanent
RAC as remoteness increased. This pattern could result from a number of factors,
including the availability of residential care in a person’s local region, the availability of
community care and the need to ensure that a person can cope once they return to a
home that may be a long way from emergency services.’
Elderly rural and remote people in need of residential aged care also have to wait longer in
hospital before they are transferred to Residential Aged Care (RAC).
Nationally in 2008–09, there were 1.065 million patient days used for maintenance and
psychogeriatric care (AIHW 2010 p 287). There were 25.782 million patient days provided by
combined public and private hospitals in Australia in 2008–09 (AIHW 2010 p 153).Therefore,
nationally, about 1 in 25 (4 per cent) of patient days were used for maintenance and
psychogeriatric care. From the previous paragraphs, it is clear that the rate of usage in Major
Cities is lower than this, possibly around 2 per cent (or less) of bed days. On this basis, the
percentage of patient days consumed by maintenance and psychogeriatric care would be
approximately 4 per cent and 9 per cent in IR and OR areas, and closer to 18 and 12 per cent in
remote and very remote areas respectively.
It appears likely that if the rate at which people were hospitalised and were accommodated in
regional and remote hospitals was the same as in Major Cities, , the expenditure on not acute
services would be between 2 and 7 per cent lower for people in regional areas, and between 10
and 16 per cent lower in remote areas. This would contribute substantially to removing the
expenditure differential between MCs and the other areas.
Table 12 below shows that aged residents of IR, OR, R and VR areas have to stay in hospital 15,
40, 50 and 30 per cent longer than their MC counterparts before they enter RAC.

32
Table 12: Mean and 90th
percentile of length of hospital stay in days, for patients 65+ moving to
permanent residential aged care, 2001-2002
MC IR OR R VR Australia
Mean 35.8 41.0 51.1 54.3 46.7 38.2
90th
percentile 69 79 97 104 n.p. 73
Bed day rate /1000
pop
1162 1173 1290 1464 2068
Source: AIHW 2008. Karmel, Lloyd and Anderson.
Note: the difference in very remote areas described in this table does not factor in the influence of the large
number of Indigenous people with earlier onset of aged care needs. An unknown percentage of the patient days
described in this table are also described in the previous section on maintenance and psychogeriatric admissions
(ie there is likely to be some overlap).
Elderly rural and remote people in need of residential aged care also wait longer in hospital
before they die. Aged residents of IR, OR, R and VR areas stay in hospital 1.4, 2.2, 2.6 and 3.7
times longer than their MC counterparts before dying (Table 13).
Table 13: Mean and 90
th percentile of length of stay in days, for patients 65+ who died in hospital,
2001-2002
MC IR OR R VR Australia
Mean 13.6 18.4 30.5 49.2 50.1 17.3
90th percentile 30 30 38 43 76 31
Bed day rate /1000
pop
1,162 1,173 1,290 1,464 2,068
Waiting bed days
as a percentage of
total bed days
2.9% 4.8% 7.2% 7.1% 3.2% 3.8%
Source: AIHW 2008 Karmel, Lloyd and Anderson
Note: the difference in very remote areas described in this table does not factor in the influence of the large
number of Indigenous people with earlier onset of aged care needs. It is significant that the 90th percentile for
remote areas is lower than the mean; the median for most areas (including remote) is 8 days, which means that
extreme outliers play a major part in determining the mean in remote areas (ie at least one person stayed in at
least one remote hospital for a very long time before dying). An unknown percentage of the patient days
described in this table are also described in the previous section on maintenance and psychogeriatric admissions
(ie there is likely to be some overlap, but it is unclear how much).
The preponderance of smaller hospitals and lower economies of scale
This report does not address relative costs of similar services provided by regional and rural
hospitals compared to like services provided by hospitals in major cities, as it focuses on services
provided to rural people from all sources including major cities; further it is not able to break
down services by complexity of care needs.
There are more than three times as many hospitals in regional and remote areas as in Major
Cities, however, these tend to be substantially smaller than MC hospitals. Table 7 illustrates the
substantially smaller size of regional and especially remote area hospitals. Some of these
hospitals may be more efficient, while it is certain that many will cost more for equivalent types
of service, because of their lack of economies of both scale and scope. Higher costs of staff with
greater use of locums and temporary staff, and the need for some attraction costs such as
provision of accommodation would also add to the costs of some rural hospitals.

33
Many rural hospitals also need to provide capacity for service provision eg for accident and
emergency.
Even though these hospitals are smaller, the average cost per separation from public hospitals for
patients in regional and remote areas is very similar, and 10 per cent higher for private hospitals,
compared with costs for Major Cities residents.
Overall, in the view of the Alliance, the key issue for people in rural and remote Australia is to
preserve their access to local hospitals as far as practicable, and to ensure that the range of
hospital services is best designed to meet the needs of the local community. The continued
development of multi-purpose services providing a combination of aged care, hospital and some
community and primary care services acute represents the appropriate pathway.
Areas of health service not able to be addressed in AIHW report.
Table 1 and Table 14 (below) describe the Alliance‘s estimates of the regional and remote
deficits for the 44 per cent of total health expenditure not reported by AIHW.
For these estimates, the total amounts spent nationally on each category for which information
on remoteness of the recipient is unknown are taken from AIHW 2011. The deficits are gauged
by comparing 32 per cent of those national amounts (32 per cent of Australians live in regional
and remote areas) with estimates of the likely percentage underspend.
For the estimation of these percentage underspends, it was assumed that people in regional and
remote areas:
use non-admitted patient services at about the same rate as those in Major Cities (use of
A&E rates are likely to be higher, but outpatient and other service rates may be lower)
(ASEC 2001)18
;
have about the same levels of access to the community health services that are provided
by state governments;
spend (out of pocket) 20 per cent less on medication than their Major Cities counterparts
for the 47 per cent of expenditure on medication that was not reported by AIHW;
based on the distribution of health professionals and other evidence, spend 40 per cent
less on allied health and 30 per cent less on dentists and other oral health care;
taking account of lesser access to many health care professionals and hospital services,
have about 20 per cent less access to aids and appliances.
18 The health section of the State of the Environment report 2001 - written by the AIHW - suggests that rates of non-
admitted patient services outside metropolitan areas averaged about the same as in metropolitan areas. We have not
been able to locate more recent data.

34
Table 14: Estimates of expenditure on residents of regional and remote areas for the 44 per cent of
health expenditure not reported on by the AIHW, 2006–07
Item not reported Underspend,
overspend or unsure?
Potential underspend?
All non-admitted patient
services (eg A&E,
outpatients)
Similar None
Community health services Assume similar Assume none
Non-PBS medication (i.e.
47% of all medications)
Underspend Perhaps $0.35 billion
(20% shortfall)
Aids and appliances
Underspend Perhaps $0.20 billion (20%)
Other health practitioners (eg
allied health)
Underspend Perhaps $0.26-$0.345 billion
(30-40%)
Oral/dental care
Underspend Perhaps $0.34 -$0.5 billion
(20-30%)
Overall
Underspend At least $1 billion up to $1.4
billion
Aged care costs (residential
aged care, CACP, EACH.
Underspend Perhaps $500 m
Source: Derived by NRHA.
Notes: The middle column describes the NRHA‘s best estimate as to whether regional and remote residents
experience an underspend or an overspend on these particular items.
Table 14 suggests an underspend in those areas against which AIHW reporting was not possible
of $1.15-1.4 billion (not including aged care).
In previous reports the AIHW has estimated a shortfall in aged care expenditure in rural and
remote areas, compared to the rates in Major cities, in the order of 2 per cent. The Alliance
estimates that, if adjusted for the greater proportion of Aboriginal people in rural and remote
Australia and their aged care needs between the ages of 50 and 69, the underspend in regional
and remote areas would approximate $500 million per annum.
The AIHW Report does not deal with outlays across several categories of expenditure. The
Alliance believes that for this 44 per cent of total expenditure there is sufficient evidence to
indicate that – here too – there is a substantial net deficit in both services and outlays for country
people compared to those in Major Cities.
Oral health
If rural residents had proportionate access to oral health care, rural expenditure on such care
would be of the order of $1,750 million per annum.
However, the AIHW study, Geographic Distribution of the Australian Dental Labour Force,
2003iv, reported the distribution of practising dentists as 56.2 in Major Cities , falling away to
33.6 in Inner Regional, 26.6 in Outer Regional and 22.9 in Remote/Very remote areas while in
Outer Regional there were only 1.1 dental hygienists, compared to 3.8 per 100,000 in Major
Cities.

35
On that basis, and assuming 20 to 30% lesser access, the NHRA estimates that the shortfall in
expenditures on oral health care, albeit largely consumer-funded, was of the order of $340-525
million per annum in 2006-2007.
Allied health
Providing rural residents with proportionate access as for major cities to allied health services
would require rural expenditure in the order of $863 million per annum.
The allied health professions comprise about 18 per cent of the health workforce in Australia and
are vital contributors to multidisciplinary health care. There is a dearth of information on access
to allied health services and on the nature and the distribution of the allied health workforce in
rural and remote Australia. The National Allied Health Workforce Report (2003) showed that
only 20.5 per cent of practising psychologists were reported as working in rural and remote
regions. This equates to 0.83 psychologists per 10,000 head of population in very remote areas
and 3.44 in Inner Regional centres, compared to 5.92 per 10,000 head of population in major
capital cities. Where MBS funding is available for those with chronic conditions and with mental
health conditions, ratios of expenditure in regional and remote areas were only 70, 40, 19 and 8
per cent respectively of the Major Cities rate.
Overall, a service deficit for access to allied health services of 30-40 per cent is likely, with an
annual expenditure deficit of $260-$345 million - again largely consumer-funded.
Non PBS-medicines
Proportionate use of non-PBS medicines in rural areas would result in expenditure in the order of
$1,700 million per annum. The relatively poor access by rural people to PBS medicines is likely
to mirror under access to non-PBS medicines and a 20 per cent shortfall would be valued at
around $350 million.
Aids and appliances
Proportionate access to aids and appliances in rural areas would result in expenditure in the order
of $1,000 million per annum. The poorer access to primary care, including to GPs other primary
care professionals and to allied health is likely to be mirrored in lower access to aids and
appliances and a 20 per cent shortfall would be valued at around $200 million.
Thus for these four vital categories of health services, rural Australia would face a further deficit
in services costing an estimated $1.1 billion to $1.4 billion ( much of which would be costs
covered out-of-pocket by consumers although some such costs also coming from public sources
(aids and appliances) and some from private health insurance. Conservatively, the alliance is
confident of at least a billion dollar annual shortfall in rural access to these services.
Other
The report also noted expenditures on community health, public health and non-Medicare
medical services such as those purchased by the Department of Veterans Affairs, as well as on
and hospital non-admitted care.

36
The overall picture of access to health services by rural people - including in the new AIHW
report - gives no reason to believe country people would fare any better in relation to these
unallocated outlays. Additional information on these matters would be very useful.

37
The geographical basis of the AIHW and NRHA reports
Both reports compare health expenditure for the residents of five regions of Australia: Major
Cities, Inner Regional areas, Outer Regional areas, Remote areas and Very Remote areas. These
five regions are defined in the Remoteness structure of the Australian Standard Geographical
Classification, sometimes known as ASGC-Remoteness Area, and sometimes (incorrectly) as
ARIA+19
.
The report does not describe expenditure in the regions where the services were provided (e.g.
where the doctor or the hospital was located). Rather, it provides a picture of the expenditure on
or by people who live in these regions, irrespective of where the service was provided.
Remoteness areas are an index of the average road distance to the closest urban areas of five
distinct types (ranging from small towns, to large metropolitan centres). However, this (average
distance) is all that the index measures.
The following example illustrates why Remoteness areas should be used with caution. Urana is a
small town in southern NSW roughly an hour and a half from Wagga and Albury, two hours
from Griffith and four hours from Canberra. It is classified as an Outer Regional area, as is
Darwin in the Northern Territory and Townsville in Queensland.
Figure 11: Urana, population 1,500, NSW, Outer Regional
19
ARIA+ is the continuous variable (with a value between 0 and 15) upon which ASGC Remoteness areas are
defined.
Photo courtesy Urana Shire Council with permission.

38
Figure 12: Townsville, population 181,743, Queensland, Outer Regional
Urana is very different from Townsville and Darwin, including in relation to access to work,
doctors, hospitals, education and even medical schools. They therefore have quite distinct levels
of attractiveness for health professionals, for example.
Figure 13 below maps the five remoteness areas.
Figure 13: Remoteness areas of Australia
Source: ABS 2007

39
About one third of Australia‘s total population lives in regional and remote areas, with the vast
majority of these in regional rather than remote areas. The proportion of people who are
Indigenous increases with remoteness to almost 50 per cent in Very Remote areas. Primary
production employs between 5 per cent and 20 per cent of the adult population, people are less
likely to be wealthy and more likely to be poor, and young people are less likely to commence
tertiary study.
Table 15: Selected population characteristics within Remoteness Areas, 2001
Factor MC IR OR R VR Australia
Percentage of: Per cent
the national population living in each
area 66 21 10 2 1 100
the Indigenous population in each area 30 20 23 9 18 100
the population in each area who are
Indigenous 1 2 5 12 45 2
adults employed in primary production
and mining <1 4 11 20 16 3
adults employed in other industry
sectors 58 50 46 45 44 55
adults not employed in the workforce or
unemployed 41 46 43 35 39 42
People living in areas classified as being
in
- least disadvantaged national SEIFA
quartile (a) – 1996 34 14 8 10 2 26
- most disadvantaged national SEIFA
quartile (a) – 1996 20 28 33 26 53 24
youth starting tertiary study 39 26 23 12 10 33
non-Indigenous youth starting tertiary
study 39 27 24 13 21 34
reticulated water supplies adequately
fluoridated 81 39 34 30 20 49
Costs (average) Dollars
Monthly mortgage 985 813 775 786 605 926
Weekly rent 206 155 154 148 122 189 Source: Phillips 2009.
Notes: Primary production includes agriculture, forestry and fishing. Costs are in 2001 dollars. The percentages
for SEIFA (Socioeconomic Indexes for Areas) relate to the percentage of the population in each area who lived
in Census collectors‘ districts that were among the 25 per cent least and the 25 per cent most disadvantaged in
Australia, in 1996. The percentage commencing tertiary (university and TAFE) study is the apparent
percentage of 17-20 year olds from each area that commenced tertiary study in 2001. Limited accuracy of the
Indigenous Australian identifier cautions against regional reporting for Indigenous Australians. Nationally, 10
per cent of Indigenous Australians of this age commenced tertiary study. Fluoride data relate to a rolling
survey. Some of the data may be up to 10 years old and do not relate specifically to 2001.

40
References
1. AIHW 2011. Australian health expenditure by remoteness: a comparison of remote,
regional and city health expenditure. Health and welfare expenditure series no. 50.
Cat. no. HWE 50. Canberra: AIHW.
2. Australian State of the Environment Committee, 2001. Australia State of the
Environment 2001, Independent Report to the Commonwealth Minister for the
Environment and Heritage, CSIRO Publishing on behalf of the Department of the
Environment and Heritage, Canberra.
http://www.environment.gov.au/soe/2001/publications/theme-
reports/settlements/settlements03-4d.html cited 6/01/2011.
3. AIHW 2005. Rural, regional and remote health—Indicators of health. AIHW Cat. No.
PHE 59. Canberra: AIHW (Rural Health Series no. 5).
http://www.aihw.gov.au/publications/phe/rrrh05/rrrh05.pdf cited 6/01/2011.
4. AIHW 2004. Rural, regional and remote health: a guide to remoteness classifications.
AIHW cat. no. PHE 53. Canberra: AIHW.
http://www.aihw.gov.au/publications/phe/rrrh-gtrc/rrrh-gtrc.pdf cited 6/01/2011.
5. Australian Institute of Health and Welfare 2008. Rural, regional and remote health:
indicators of health system performance. Rural Health Series no. 10. Cat. no. PHE
103. Canberra: AIHW. http://www.aihw.gov.au/publications/phe/rrrh-ihsp/rrrh-
ihsp.pdf cited 6/01/2011
6. AIHW 2010. Australian hospital statistics 2008–09. Health services series no. 17.
Cat. no. HSE 84. Canberra: AIHW.
http://www.aihw.gov.au/publications/hse/84/11173.pdf cited 6/01/2011.
7. Productivity Commission 2009, Public and Private Hospitals, Research Report,
Canberra. http://www.pc.gov.au/projects/study/hospitals/report. cited 6/01/2011.
8. AIHW 2003. Australian hospital statistics 2001–02. AIHW cat. no. HSE 25.
Canberra: AIHW (Health Services Series no. 20).
http://www.aihw.gov.au/publications/hse/ahs01-02/ahs01-02.pdf cited 6/01/2011
cited 6/01/2011.
9. AIHW 2008b. Australian hospital statistics 2006–07. Health services series no. 31.
Cat. no. HSE 55. Canberra: AIHW.
10. AIHW: Karmel R, Lloyd J, Anderson P 2008. Movement from hospital to residential
aged care. Data linkage series no. 6. Cat. no. CSI 6. Canberra: AIHW.
http://www.aihw.gov.au/publications/csi/mfhtrac/mfhtrac.pdf cited 6/01/2011.
11. Phillips A. 2009. Health status differentials across rural and remote Australia
Australian Journal of Rural Health Volume 17, Issue 1, pages 2–9, February 2009.