australia’s wood and wood products industry situation … tas... · australia’s wood and wood...
TRANSCRIPT

Australia’s Wood and Wood Products Industry
Situation and Outlook Working Paper
Dr Judith Ajani
Fenner School of Environment and Society The Australian National University
February 2011
Australia’s native forests and wood based industries are at a crossroad. Which path they travel is entirely dependent on government policy concerning, in particular, how the land use sector is brought into the climate change challenge; whether native forest energy and other biomass feedstocks are engineered into profitability; the policy priority given to plantation processing; and whether unprofitable state native forest agencies are retired. Tackling these contemporary policy issues requires an understanding of Australia’s wood and wood products industry: its situation and outlook. The aim of this working paper is to present such background information to those engaged in the policy process and to place it in the context of contemporary policy challenges.

1 | A j a n i : A u s t r a l i a ’ s W o o d a n d W o o d P r o d u c t s I n d u s t r y
Summary
Low consumption growth and surging plantation resources characterises Australia’s wood
products industry. Australia’s wood consumption (to make all the sawn timber, wood panels
and paper we consume whether domestically produced or imported) increased by only 0.8%
pa over 1990 to 2009. Domestic plantation wood supply grew by 6.3% pa over the same
period (Figure 1).
Plantations now supply 82% of the wood for solid wood products manufacturing (sawn
timber and wood panels) in Australia (Figure 7). Production of native forest solid wood
products has contracted by an average 2% pa over the past two decades. In this intense period
of industry structural change, buyers have not shifted to hardwood-based imports, including
from tropical regions. Instead, consumption of hardwood solid wood products, domestically
produced and imported, contracted (Figure 10). Imports of solid wood products from tropical
countries accounted for only 2% of our consumption in 2008/09 (Figure 24).
Hardwood plantation chips are decimating native forest chip exports, the single biggest
market for native forest wood. On current trends, we can expect a near complete
displacement of Australian native forest chip exports within the next few years (Figure 20).
We can also expect increasing plantation-based production, even without any expansion to
Australia’s plantation estate, as softwood saw and veneer log supply is maintained (Figure 9)
and work to increase plantation productivity is set in train; as the projected supply of
hardwood plantation saw/veneer logs increases steadily over 2010 to 2030 (Figure 10); and,
in particular, as supplies of hardwood pulp logs soar (Figure 20).
Virtually all native forest markets are vulnerable to plantation competition, including within
the small high appearance sawn timber and veneer market. Australia’s two million hectare
softwood and hardwood plantation estate can immediately meet virtually all Australia’s wood
needs (Figure 1). For too long the false argument, that native forest logging is sawlog-driven
and that most sawn timber would survive the plantation competition because of its successful
shift to high appearance products, has held sway in state and federal policymaking circles. It
is estimated that high appearance sawn timber, less vulnerable to the plantation competition,
accounted for 3% of native forest wood production in 2009 (Section 3.1.6). It is a sad
reflection on Australian wood and wood products industry policy that a minor product devoid
of reliable quantification has stymied coherent forest and wood industry policy for so long.
No doubt calls will be made for more publicly funded hardwood and softwood sawlog
plantations. On the softwood front: productivity improvements to lift the existing mediocre
performance are waiting for uptake and offer substantial land cost savings compared to the
alternative of plantation estate expansion. On the hardwood front: government projections
indicate substantial hardwood plantation saw/veneer logs coming on stream over the next 20
years relative to the declining high appearance hardwood sawn timber market (Figure 10). An
incorrect interpretation of market failure has been used to support calls for government
funding to do the job the private sector apparently is not interested in – investing in long lead-
time plantations. Long lead times are not in themselves a market failure. Rather, investors in
long rotation plantations require higher returns to compensate for the increased risk.
Hardwood sawmillers, however, appear unwilling to pay the higher wood prices to attract the
plantation investment and expect the public to keep subsidising their wood costs.

2 | A j a n i : A u s t r a l i a ’ s W o o d a n d W o o d P r o d u c t s I n d u s t r y
Missed opportunities abound as the benefits of new industry players, products and
technologies and biodiversity conservation/carbon store opportunities for native forests lie
unrealised. Realising these missed industry opportunities requires government developing a
coherent wood and wood products industry policy focussed around plantation processing.
Such a policy would completely free the market of state-subsidised native forest competition
and stop unending plantation expansion via tax-based subsidies devoid of rigorous market
analysis. Instead, it would set the prime objective to encouraging commercially viable
domestic plantation processing. The package would include research and development
programs, worker and management skill development and transport strategies with a focus
around regional hubs with a critical plantation mass for scale economy processing.
Wood products industry and forest policy making today is like being back in the 1970s.
Native forest logging interests calling for approval to enter the vast energy and other biomass
feedstock markets are the new woodchippers. Their successful lobbying on carbon
accounting details and classifying native forests as renewable and therefore eligible for
renewable energy certificates works to propel these commercially marginal new opportunities
for native forests across the profitability line. The behaviour is akin to the 1970s chip export
proposals that depended on low priced native forests logs for profitability. Even the calming
sounds of ‘sawlog-driven’ or additional to ‘high value’ processes are familiar, as is the
argument that only ‘waste’ will be used. Also familiar are plans for state forest agencies to
manage areas of native forests for carbon stores. It was called ‘multiple-use management’ in
the 1970s.
The 1970s was the era of government subsidies for softwood plantations followed, a few
decades later, by tax minimisation plantation managed investment schemes. These schemes
remain in place and tax minimisers keep subscribing despite the predicted and now realised
widespread collapse within the sector. Forestry lobbyists have carbon sink plantings, either
separate or tacked onto wood producing plantations, on the agenda. With the public purse
open, it seems there is no end for plantation expansion in Australia.
There is one difference: we can choose to learn from past policy mistakes.
Public interest outcomes are compromised when policy is dominated by the interests of
economically and environmentally inferior incumbents. Engineering commercial viability
into wood based energy suits the native forest sector: but it is not an efficient energy
production system. Planting carbon sinks, especially with single or limited species, suits the
plantation lobby: but such plantings are not efficient carbon stores. Tasking state forest
agencies with managing native forests as carbon stores suits the incumbent state forestry
agencies: but they not skilled in biodiversity conservation which is the key to maintaining and
restoring native forest carbon stocks.
Quite possibly, government will not resist the lobbying that prevents Australia having a
coherent wood products industry and forest policy where each land sector is allocated to the
job it does best: plantations for wood products and native forests for biodiversity
conservation/carbon stores/water. If government facilitates native forests into the energy and
other biomass feedstock markets, Australia’s forest conflict will continue raging. The public
can wish to avoid this outcome, but only governments can make that happen.

3 | A j a n i : A u s t r a l i a ’ s W o o d a n d W o o d P r o d u c t s I n d u s t r y
1. Introduction
Australia’s native forests and wood based industries are at a crossroad. Which path they
travel is entirely dependent on government policy concerning, in particular, how the land use
sector is brought into the climate change challenge; whether native forest energy and other
biomass feedstocks are engineered into profitability; the policy priority given to plantation
processing; and whether unprofitable state native forest agencies are retired. Tackling these
contemporary policy issues requires an understanding of Australia’s wood and wood products
industry: its situation and outlook. The aim of this working paper is to present such
background information for those engaged in the policy process and to place this information
in the context of contemporary policy challenges. The paper was stimulated by environment
movement requests for such background information and analysis.
The data sets used in the analysis are close to entirely sourced from ABARES (the merged
Australian Bureau of Agricultural and Resource Economics and the Bureau of Rural
Sciences) and the Australian Bureau of Statistics (ABS). This includes actual production,
import, export and consumption data and projected plantation wood supply. The main
challenge was to disaggregate those data sets not already split into their plantation-native
forest components. Where this was necessary, the methods are detailed under the relevant
figure or table. There may be different views about the methods, for example the proportion
of pulp made using fillers and additives or sawn timber recovery rates. However, amending
the figures presented in this working paper will not change any of the conclusions arising
from the analysis. Australia’s plantation resources, relative to the native forest based sector
are simply too big.
2. Australia’s plantation wood supply and wood needs
Australia’s two million hectare plantation estate can supply more than enough wood to make
virtually all the sawn timber, wood panels and paper Australia consumes. This includes the
wood embodied in imported wood products (Figure 1).
The Bureau of Rural Sciences, now the Australian Bureau of Agricultural and Resources
Economics and Sciences (ABARES), generated the plantation wood supply projections
(Bureau of Rural Sciences 2007) presented in Figure 1. The projection work was undertaken
when Australia’s plantation estate covered 1.8 million hectares, which means that the average
productivity of the estate is around 16 to 17 m3/ha/yr. For a processing industry wishing to
establish and maintain international competitiveness, this mediocre plantation productivity
demands attention. A modest 1% pa productivity improvement over the next 20 years
(reaching 20 m3/ha/yr by 2030) would increase plantation wood supply to around 37 million
m3 pa by 2030. If achieved, growers would benefit from higher yields/revenues and cost
savings by avoiding the purchase of around 350k ha of land) and processors would enjoy
scale economy benefits. Preferencing productivity improvements over on-going land
acquisition is a cost attractive strategy for long term wood supply growth over and above that
from maturing plantations.

4 | A j a n i : A u s t r a l i a ’ s W o o d a n d W o o d P r o d u c t s I n d u s t r y
Figure 1 Australia’s wood consumption and projected plantation wood supply
Source/methods: ABARE Australian Commodity Statistics for wood consumption (includes wood
embodied in imported sawn timber, paper and wood panels) and wood production which was amended
using ABARE Australian Forest and Wood Products Statistics to identify hardwood plantation sawlog
production and cypress sawn timber converted to sawlog production (using a 0.4 recovery factor) to
enable the plantation – native forest disaggregation.
Other important information from Figure 1:
Australia’s wood consumption (to make all the sawn timber, wood panels and paper we
consume whether domestically produced or imported) increased by only 0.8% pa over
1990 to 2009.1
Australia’s plantation wood production increased by 6.3% pa over 1990 to 2009 and
accounted for two thirds of Australia’s wood production in 2009.
Australia’s production of native forest wood decreased by 0.7% pa over 1990 to 2009 and
accounted for one third of Australia’s wood production in 2009.
1 This (and all other) long term growth rate was calculated using ordinary least squares regression including all
annual data over the period specified, to avoid the distortions of compound growth rate calculations based only
on end point data.
0
5
10
15
20
25
30
35
19
90
19
92
19
94
19
96
19
98
20
00
20
02
20
04
20
06
20
08
20
10
20
12
20
14
20
16
20
18
20
20
20
22
20
24
Wo
od
(m
illi
on
m
3)
year ending June
Projected plantation pulplog supply
Projected plantation sawlog supply
Plantation wood production (actual)
Native forest wood production (actual)
Wood used for Australian wood products consumption (actual)

5 | A j a n i : A u s t r a l i a ’ s W o o d a n d W o o d P r o d u c t s I n d u s t r y
3. Processed wood products
In this section we investigate, in as much product detail as government statistics enable,
trends in consumption, production, imports and exports of processed wood products. The
capacity for existing plantations to meet, in both quantity and quality terms, Australia’s
consumption of individual wood products is examined.
3.1 Solid wood products (sawn timber and wood panels)
3.1.1 Sawn timber data reliability
Australia does not have reliable sawn timber production time series data. This compromises
sawn timber consumption data which ABARES estimates by adding imports to and deducting
exports from domestic production (export and import data are reported by the Australian
Bureau of Statistics (ABS)). ABARES report that since the cancellation of a number of state-
based surveys by the ABS and state government forestry agencies in 2004, there have been
no consistent estimates of sawn timber production available for Australia (Burns et al. 2009).
ABARES conducted a sawmill survey in 2007 to improve sawn timber data quality (Burns et
al. 2009) however sawn timber production and consumption data should be viewed
cautiously because of the absence of ongoing rigorous data collection.
Figure 2 Australian sawn timber production data reliability
Source: ABARE Australian Commodity Production for ABARES sawn timber data; ABS
Manufacturing Production, Australia June 2010 Cat. No. 8301.0.55.001 (series now ceased) for ABS
sawn timber production; ABS Dwelling Unit Commencements Australia Cat. No. 8750.0 for total
dwelling commencements.
0
20
40
60
80
100
120
140
160
180
200
0
1
2
3
4
5
6
19
90
19
91
19
92
19
93
19
94
19
95
19
96
19
97
19
98
19
99
20
00
20
01
20
02
20
03
20
04
20
05
20
06
20
07
20
08
20
09
20
10
Dw
elli
ng
com
me
nce
me
nts
(0
00
un
its)
Saw
n t
imb
er
pro
du
ctio
n
(mill
ion
m3 )
year ending June
Sawn timber production (ABARES data)
Sawn timber production (ABS data)
Dwelling commencements
Linear (Sawn timber production (ABARES data))
Linear (Dwelling commencements )

6 | A j a n i : A u s t r a l i a ’ s W o o d a n d W o o d P r o d u c t s I n d u s t r y
Evidence suggests the ABARES data may overstate sawn timber production (Figure 2):
Over the concluding four years of ABS sawn timber reporting (2001 to 2003) based
on relatively high quality manufacturing industry surveys, ABS reported increasingly
lower sawn timber production relative to ABARES.
Most sawn timber is used in dwelling construction, yet Australian consumption of
sawn timber (calculated using ABARES production data) is reported to be increasing
at rates significantly higher than trend growth in dwelling commencements.
ABARES sawn timber production and consumption data are used in the following analysis
with the understanding that both data sets may be overestimates.
3.1.2 Solid wood products – consumption
In this analysis, solid wood products cover sawn timber and wood panels with the latter
comprising those reported by ABARES namely plywood, particleboard, medium density
fibreboard and hardboard. Intra industry product substitution is high within the solid wood
products sector.
Solid wood products consumption has increased by an average 2.2% pa over the past two
decades, but with no growth since 2004 (Figure 3). From a low base, wood panels
consumption has grown at nearly double the rate of that for sawn timber (average 4% pa c.w.
average 1.7% pa) over 1990 to 2009.
Figure 3 Australian consumption of solid wood products
Source: Consumption data from ABARES Australian Forest and Wood Products Statistics and
Australian Commodity Statistics. Wood panels consumption includes plywood, particleboard, medium
density fibreboard and hardboard (production set at 50 000 m3 pa since 1993).
0.00
1.00
2.00
3.00
4.00
5.00
6.00
7.00
8.00
9.00
19
90
19
91
19
92
19
93
19
94
19
95
19
96
19
97
19
98
19
99
20
00
20
01
20
02
20
03
20
04
20
05
20
06
20
07
20
08
20
09
Solid
wo
od
pro
du
cts
con
sum
pti
on
(m
illio
n m
3 )
year ending June
Sawn timber Wood panels Total solid wood products

7 | A j a n i : A u s t r a l i a ’ s W o o d a n d W o o d P r o d u c t s I n d u s t r y
Wood panels’ Australian market share is low, relative to its market position globally, and has
been stagnant since the mid 1990s (Figure 4). One explanation is that if official Australian
sawn timber statistics are overestimates (see section 3.1.1), wood panels’ market share is
actually higher than that depicted in Figure 4. Another explanation is that official statistics
are accurate but for some reason Australian producers and importers of wood panels have
failed to build market share over the past 15 years. We will return to this matter in the
analysis of wood panel imports.
Figure 4 Wood panels market share – Australia and global
Source: Australian data as for Figure 3; global data from FAO FAOSTAT.
Particleboard accounts for half of Australia’s wood panels consumption, followed by medium
density fibreboard and plywood (Figure 5). Since 2003, consumption across all products has
been flat, with the exception of medium density fibreboard in 2008.
0.0
5.0
10.0
15.0
20.0
25.0
30.0
35.0
40.0
45.0
19
90
19
91
19
92
19
93
19
94
19
95
19
96
19
97
19
98
19
99
20
00
20
01
20
02
20
03
20
04
20
05
20
06
20
07
20
08
20
09
Wo
od
pan
els
as
a %
of
solid
wo
od
pro
du
cts
con
sum
pti
on
Australia Global

8 | A j a n i : A u s t r a l i a ’ s W o o d a n d W o o d P r o d u c t s I n d u s t r y
Figure 5 Australian wood panels consumption – product disaggregation
Source: Consumption data from ABARES Australian Forest and Wood Products Statistics and
Australian Commodity Statistics. Wood panels consumption includes plywood, particleboard, medium
density fibreboard and hardboard (production set at 50 000 m3 pa since 1993).
3.1.3 Solid wood products – imports
Figure 6 Australian imports of solid wood products – product disaggregation
Source: ABS International Trade, Australia Cat. No. 5465.0 as reported in ABARES Australian
Forest and Wood Products Statistics and Australian Commodity Statistics.
0
0.5
1
1.5
2
2.5
19
90
19
91
19
92
19
93
19
94
19
95
19
96
19
97
19
98
19
99
20
00
20
01
20
02
20
03
20
04
20
05
20
06
20
07
20
08
20
09
Wo
od
pan
els
co
nsu
mp
tio
n (
mill
ion
m3 )
year ending June
Plywood Particleboard Medium density fibreboard Hardboard Total
0
0.2
0.4
0.6
0.8
1
1.2
1.4
1.6
1.8
19
90
19
91
19
92
19
93
19
94
19
95
19
96
19
97
19
98
19
99
20
00
20
01
20
02
20
03
20
04
20
05
20
06
20
07
20
08
20
09
20
10
Solid
wo
od
pro
du
cts
imp
ort
s (m
illio
n m
3 )
year ending June
Softwood sawn timber Hardwood sawntimber Wood panels Total solid wood products

9 | A j a n i : A u s t r a l i a ’ s W o o d a n d W o o d P r o d u c t s I n d u s t r y
Australia’s imports of solid wood products have remained unchanged over the past decade
with declining softwood sawn timber imports offsetting increasing imports of wood panels
particularly plywood. Imports of hardwood sawn timber are minor and continue to trend
down.
3.1.4 Solid wood products – Australian production
Australia’s production of solid wood products has grown strongly over the past two decades
(average 3.6% pa 1990 to 2009) on the back of strong plantation based growth (average 5.9%
pa). The sector is now heavily plantation dependent (82% in 2009): the actual market share
for plantation based solid wood products may be understated if ABARES’ native forest sawn
timber production statistics are overestimates. Production of native forest based products
contracted by an average 1.9% pa over 1990 to 2009 (Figure 7).
Figure 7 Australian production of solid wood products – wood source disaggregation
Source/methods: Production data from ABARES Australian Forest and Wood Products Statistics and
Australian Commodity Statistics. Native forest sawn timber includes cypress production. Hardwood
plantation sawn timber was estimated using a 0.38 recovery factor applied to hardwood plantation
sawlog data reported in ABARES Australian Forest and Wood Products Statistics. Wood panels
production includes veneer (exported), plywood, particleboard, medium density fibreboard and
hardboard (production set at 50 000 m3 pa since 1993). Wood panels production was disaggregated
into wood source using the following plantation/native forest proportions: exported veneer 0.0:1.0;
plywood 0.95:0.05; particleboard 1.0:0.0; medium density fibreboard 0.98:0.02; hardboard 0.0:1.0.
Softwood plantation sawn timber dominates Australia’s production of solid wood products
(Figure 8). Of concern should be Australia’s declining production of plantation-based wood
panels since 2003, despite increasing consumption which is being met via imports (Figure 6).
0.00
1.00
2.00
3.00
4.00
5.00
6.00
7.00
8.00
19
90
19
91
19
92
19
93
19
94
19
95
19
96
19
97
19
98
19
99
20
00
20
01
20
02
20
03
20
04
20
05
20
06
20
07
20
08
20
09
Solid
wo
od
pro
du
cts
pro
du
ctio
n (
mill
ion
m3 )
year ending June
Native forest solid wood products Plantation solid wood products Total solid wood products

10 | A j a n i : A u s t r a l i a ’ s W o o d a n d W o o d P r o d u c t s I n d u s t r y
Native forest sawn timber production is expected to continue contracting and all native
forest-based wood panels production to remain nationally insignificant. Although not
discernable in Figure 8, native forest veneer production rose strongly in 2008 with the
commissioning of the Ta Ann Group’s rotary veneer mill in Tasmania. Also not discernible
in Figure 8 is the emergence of an upward trend in hardwood plantation sawmilling: a matter
for more detailed analysis of native forest sawn timber (Section 3.1.6).
Figure 8 Australian production of solid wood products – wood product and
wood source disaggregation
Source/methods: Production data from ABARES Australian Forest and Wood Products Statistics and
Australian Commodity Statistics. Native forest sawn timber includes cypress production. Hardwood
plantation sawn timber was estimated using a 0.38 recovery factor applied to hardwood plantation
sawlog data reported in ABARES Australian Forest and Wood Products Statistics. Wood panels
production includes veneer (exported), plywood, particleboard, medium density fibreboard and
hardboard (production set at 50 000 m3 pa since 1993). Wood panels production was disaggregated
into wood source using the following plantation/native forest proportions: exported veneer 1.0:0.0;
plywood 0.95:0.05; particleboard 1.0:0.0; medium density fibreboard 0.98:0.02; hardboard 0.0:1.0.
3.1.5 Solid wood products – plantation supply capability
In aggregate wood volume terms, Australia’s existing plantations can supply more than
enough wood to make all the sawn timber, wood panels and paper Australia consumes
(Figure 1). The question this section investigates is whether existing plantations can do the
job for each product group in the solid wood products market?
Saw and veneer logs, as distinct from wood particles, are crucial for meeting Australia’s solid
wood products consumption. Sawn timber will continue to dominate the market for the
foreseeable future and the residues from its manufacture are able to meet all Australian wood-
0
0.5
1
1.5
2
2.5
3
3.5
4
4.5
19
90
19
91
19
92
19
93
19
94
19
95
19
96
19
97
19
98
19
99
20
00
20
01
20
02
20
03
20
04
20
05
20
06
20
07
20
08
20
09
Pro
du
ctio
n s
olid
wo
od
pro
du
cts
(mill
ion
m3 )
year ending June
Softwood plantation sawn timber Hardwood plantation sawn timber
Plantation wood panels Native forest hardwood sawn timber
Native forest softwood sawn timber Native forest wood panels

11 | A j a n i : A u s t r a l i a ’ s W o o d a n d W o o d P r o d u c t s I n d u s t r y
based panels2 consumption with resources to spare: a matter we will pick up after bringing
the paper market into the analysis.
Based on existing softwood plantations, Australia is currently close to fully self sufficient in
the softwood component of its solid wood products sector (Figure 9).
Figure 9 Softwood saw/veneer logs – Australian consumption, production
and projected plantation supply
Source/methods: Consumption data from ABARES Australian Forest and Wood Products Statistics
and Australian Commodity Statistics with sawn timber and plywood converted to log equivalent using
a recovery factor of 0.4 and 0.63 respectively and 95% of plywood consumption assumed to be
softwood based. Production data from ABARES Australian Forest and Wood Products Statistics and
Australian Commodity Statistics. Native forest sawn timber comprises cypress sawn timber production
reported in ABARES Australian Forest and Wood Products Statistics converted to log equivalent
using a 0.4 recovery factor. Plantation wood supply projections from Bureau of Rural Sciences (2007).
Whether self sufficiency in maintained depends on the demand and wood supply outlook.
Growth in the demand for saw/veneer logs will flatten if the consumption mix shifts more to
reconstituted wood-based panels – in line with global trends. On the supply side, if realised,
plantation productivity improvements will increase future saw/veneer log supply. Processing
competitiveness, exchange rate trends and individual corporate strategies will influence the
level of imports and exports. These factors will all determine whether or not Australia’s
softwood plantation estate should be expanded. The private sector is the best placed to make
2 Wood-based panels are a subset of wood panels and are made using particles of wood, usually residues from
sawmilling and veneer production. Examples include medium density fibreboard, particleboard and hardboard.
0
2
4
6
8
10
12
14
19
90
19
92
19
94
19
96
19
98
20
00
20
02
20
04
20
06
20
08
20
10
20
12
20
14
20
16
20
18
20
20
20
22
20
24
20
26
20
28
20
30
20
32
20
34
Wo
od
(m
illio
n m
3 )
Softwood saw/veneer log consumption (includes logs to make imported sawn timber and plywood)
Softwood plantation saw/veneer log production
Native forest softwood saw/veneer log production
Projected softwood plantation saw/veneer log supply

12 | A j a n i : A u s t r a l i a ’ s W o o d a n d W o o d P r o d u c t s I n d u s t r y
such decisions, take the investment risk and enjoy the rewards. This matter is addressed in the
policy discussion (Section 5).
Hardwood is the minor raw material in Australia’s consumption of solid wood products;
accounting for only 20% of wood used in 2009. Australia’s consumption and production of
hardwood-based solid wood products declined by an average 2.1% pa over 1990 to 2009
(Figure 10). This trend is expected to continue in the immediate term with the ongoing
displacement of less competitive Australian native forest hardwood sawn timber by softwood
solid wood products, both domestically produced and imported. ABARES projects steadily
increasing supplies of hardwood plantation saw/veneer logs (Bureau of Rural Sciences 2007)
which offer significant processing opportunities over the long term relative to current
production (Figure 10). One possibility may be the substitution of native forest logs with
hardwood plantation logs at the Tasmanian-based Ta Ann plywood mill. The mill, with its
265 000 m3 pa hardwood log supply contract through to 2027 (current production is scaling
up to this level), is Australia’s largest native forest solid wood products enterprise. ABARES
projects strong growth in Tasmanian hardwood plantation saw/veneer log supply: 193 000 m3
pa over 2010 – 14; 446 000 m3 pa over 2015-19: 746 000 m
3 pa over 2010-20 (Bureau of
Rural Sciences 2007, p. 43).
Figure 10 Hardwood saw/veneer logs – Australian consumption, production
and projected plantation supply
Source/methods: Consumption data from ABARES Australian Forest and Wood Products Statistics
and Australian Commodity Statistics with sawn timber and plywood converted to log equivalent using
a recovery factor of 0.4 and 0.63 respectively and 5% of plywood consumption assumed to be
hardwood based. Production data from ABARES Australian Forest and Wood Products Statistics and
Australian Commodity Statistics. Plantation wood supply projections from Bureau of Rural Sciences
(2007).
0
1
2
3
4
5
6
19
90
19
92
19
94
19
96
19
98
20
00
20
02
20
04
20
06
20
08
20
10
20
12
20
14
20
16
20
18
20
20
20
22
20
24
20
26
20
28
20
30
20
32
20
34
Wo
od
(m
illio
n m
3 )
Hardwood saw/veneer log consumption (includes logs to make imported sawn timber and plywood)
Hardwood plantation saw/veneer log production
Native forest hardwood saw/veneer log production
Projected hardwood plantation saw/veneer log supply

13 | A j a n i : A u s t r a l i a ’ s W o o d a n d W o o d P r o d u c t s I n d u s t r y
3.1.6 Native forest sawn timber
So far, the quality of Australia’s sawn timber time series data (see section 3.1.1) does not
unduly compromise the analysis of Australia’s solid wood products sector for policy
purposes. Reliability becomes an issue when investigating the markets for Australia’s native
forest sawn timber. Invariably, at this first level of disaggregation, sawn timber product data
are expressed as percentages, not actual estimates. This is a wholly undesirable practice for
official (including State Government) statistical reporting.
ABARES’ 2007 sawmill survey covering 26% of native forest sawmills in Australia sought
not percentage figures but actual mill production in total, and disaggregated into green
structural, green appearance, green other, dry structural, dry appearance and dry other (Burns
et al. 2009). ABARES however reported only percentage figures for the product
disaggregation. I applied ABARES’ product mix to estimated native forest hardwood sawn
timber production in 2009 to establish the degree of exposure of native forest sawn timber to
plantation solid wood product competition in the immediate term (Table 1).
Under the least intense Scenario 2, where all native forest appearance sawn timber is assumed
to be completely isolated from plantation competition, well over half the native forest sawn
timber currently produced in Australia is threatened by plantation competition: namely
structural sawn timber, pallets, fencing & wooden stakes. The threat increases significantly
under Scenario 1 where half the appearance production is assumed to be vulnerable to
plantation competition. Combined with structural sawn timber, pallets, fencing & wooden
stakes, under this scenario, 80% of current native forest sawn timber production is estimated
to be vulnerable to plantation-based competition (Table 1).
Table 1 Estimating Australian native forest sawn timber product composition 2009 –
approach 1 Category % total native
forest sawn
timber production
Estimated production
heavily exposed to
plantation-based
competition
Scenario 1
(000 m3)
Estimated production
heavily exposed to
plantation-based
competition
Scenario 2
(000 m3)
Total sawn timber
production
913 913
Green structural 32% 292 292
Green other (pallets, fencing
& wooden stakes)
16% 146 146
Green appearance 13% 59 0
Dry structural 15% 137 137
Dry appearance 23% 105 0
Dry other 1% 9 9
Total exposed to plantation
competition
748 584
% of estimated native forest
sawn timber production
82% 64%
Source/methods: Burns et al. 2009 for product shares. Sawn timber production in 2009 from ABARES
Australian Forest and Wood Products Statistics with hardwood plantation sawn timber netted out using a 0.38
recovery factor. Scenario 1: 50% of appearance (green and dry) and 100% of all other products heavily exposed
to plantation based competition in the immediate term. Scenario 2: No appearance sawn timber but 100% of all
other products heavily exposed to plantation-based competition in the immediate term.

14 | A j a n i : A u s t r a l i a ’ s W o o d a n d W o o d P r o d u c t s I n d u s t r y
The National Carbon Accounting System (NCAS) presents data that enables an alternative
approach to investigating native forest sawn timber’s immediate prospects. Using
(undocumented) Victorian Association of Forest Industries information, Jaakko Poyry
Consulting (1999, p. 38) develop the following profile for hardwood (native forest)
sawmilling:
45% of the sawlog is converted to green sawn timber of which:
30% is used for green framing
15% is used for pallets and palings
55% goes onto drying & dressing, of which:
32% is shavings and waste
68% is used for dried and dressed products, of which:
50% is used for framing
10% is used for furniture
40% is used for flooring and boards.
Applying these percentages to ABARES’ estimated native forest sawlog production in 2009
of 2 283 000 m3 generates a product profile as presented in Table 2.
Table 2 Estimating Australian native forest sawn timber product composition – approach 2 Category Estimated sawn timber
production 2009
(000 m3)
%
Framing (green and dry) 500 59
Pallets and palings 154 18
Furniture 38 5
Flooring and boards 154 18
Total sawn timber 846 100
On the basis of this data set, 77% of current native forest sawn timber is used for framing,
pallets and palings and therefore highly vulnerable to plantation competition in the immediate
future. A proportion of flooring and board products are also vulnerable.
Final note on native forest sawn timber data reliability
The total sawn timber production figure presented in Table 2 that was estimated using Jaakko
Poyry Consulting (1999) recovery factors and product shares applied to ABARES reported
native forest sawlog production in 2009 is 7% lower than ABARES’ estimated native forest
hardwood sawn timber production of 913 000 m3 (ABARES Australian Forest and Wood
Products Statistics, with estimated hardwood plantation sawn timber netted out). This adds
more weight to the concern that ABARES’ native forest sawn timber production statistics are
over-estimates and provides a plausible explanation.
3.2.1 Paper
3.2.1 Paper – consumption
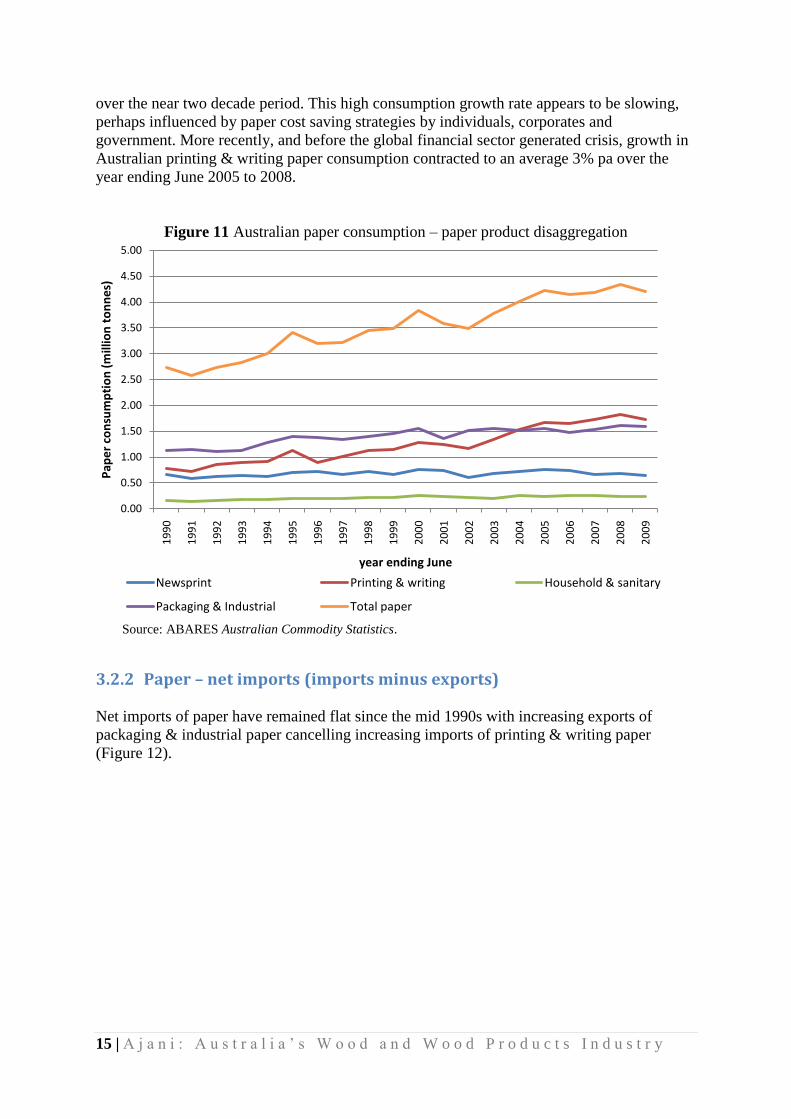
Over the near two decades ending June 2009, Australian paper consumption has increased by
an average 2.7% pa (Figure 11). Consumption is heavily concentrated on printing & writing
papers and packaging & industrial papers (79% of total paper consumption in 2009). Of
significance is the strong growth in printing & writing paper consumption, averaging 4.9% pa
15 | A j a n i : A u s t r a l i a ’ s W o o d a n d W o o d P r o d u c t s I n d u s t r y
over the near two decade period. This high consumption growth rate appears to be slowing,
perhaps influenced by paper cost saving strategies by individuals, corporates and
government. More recently, and before the global financial sector generated crisis, growth in
Australian printing & writing paper consumption contracted to an average 3% pa over the
year ending June 2005 to 2008.
Figure 11 Australian paper consumption – paper product disaggregation
Source: ABARES Australian Commodity Statistics.
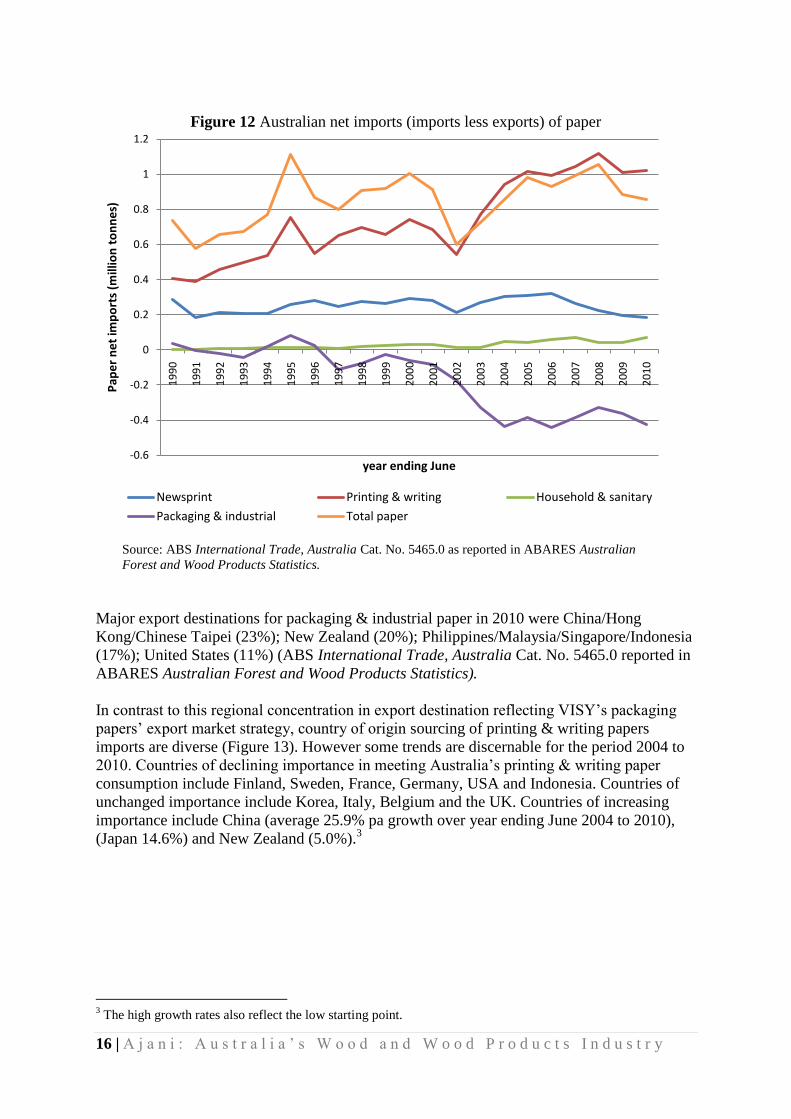
3.2.2 Paper – net imports (imports minus exports)
Net imports of paper have remained flat since the mid 1990s with increasing exports of
packaging & industrial paper cancelling increasing imports of printing & writing paper
(Figure 12).
0.00
0.50
1.00
1.50
2.00
2.50
3.00
3.50
4.00
4.50
5.00
19
90
19
91
19
92
19
93
19
94
19
95
19
96
19
97
19
98
19
99
20
00
20
01
20
02
20
03
20
04
20
05
20
06
20
07
20
08
20
09
Pap
er
con
sum
pti
on
(m
illio
n t
on
ne
s)
year ending June
Newsprint Printing & writing Household & sanitary
Packaging & Industrial Total paper
16 | A j a n i : A u s t r a l i a ’ s W o o d a n d W o o d P r o d u c t s I n d u s t r y
Figure 12 Australian net imports (imports less exports) of paper
Source: ABS International Trade, Australia Cat. No. 5465.0 as reported in ABARES Australian
Forest and Wood Products Statistics.
Major export destinations for packaging & industrial paper in 2010 were China/Hong
Kong/Chinese Taipei (23%); New Zealand (20%); Philippines/Malaysia/Singapore/Indonesia
(17%); United States (11%) (ABS International Trade, Australia Cat. No. 5465.0 reported in
ABARES Australian Forest and Wood Products Statistics).
In contrast to this regional concentration in export destination reflecting VISY’s packaging
papers’ export market strategy, country of origin sourcing of printing & writing papers
imports are diverse (Figure 13). However some trends are discernable for the period 2004 to
2010. Countries of declining importance in meeting Australia’s printing & writing paper
consumption include Finland, Sweden, France, Germany, USA and Indonesia. Countries of
unchanged importance include Korea, Italy, Belgium and the UK. Countries of increasing
importance include China (average 25.9% pa growth over year ending June 2004 to 2010),
(Japan 14.6%) and New Zealand (5.0%).3
3 The high growth rates also reflect the low starting point.
-0.6
-0.4
-0.2
0
0.2
0.4
0.6
0.8
1
1.2
19
90
19
91
19
92
19
93
19
94
19
95
19
96
19
97
19
98
19
99
20
00
20
01
20
02
20
03
20
04
20
05
20
06
20
07
20
08
20
09
20
10
Pap
er
ne
t im
po
rts
(mill
ion
to
nn
es)
year ending June
Newsprint Printing & writing Household & sanitary
Packaging & industrial Total paper

17 | A j a n i : A u s t r a l i a ’ s W o o d a n d W o o d P r o d u c t s I n d u s t r y
Figure 13 Australian imports of printing & writing paper by country of origin – 2009/10
Source: ABS International Trade, Australia Cat. No. 5465.0 as reported in ABARES Australian
Forest and Wood Products Statistics.
3.2.3 Paper – production
Figure 14 Australian paper production – product disaggregation
Source: ABARES Australian Commodity Statistics.
Finland11%
Korea, Rep. of10%
United States9%
Japan8%
China8%
Sweden5%
Indonesia5%
Germany4%
Italy4%New Zealand
3%
Belgium 1%
United Kingdom 1%
France1%
Other, includes imports from which
country of origin data is confidential
30%
0.00
0.50
1.00
1.50
2.00
2.50
3.00
3.50
19
90
19
91
19
92
19
93
19
94
19
95
19
96
19
97
19
98
19
99
20
00
20
01
20
02
20
03
20
04
20
05
20
06
20
07
20
08
20
09
Pap
er
pro
du
ctio
n (
mill
ion
to
nn
es)
year ending June
Newsprint Printing & writing Household & sanitary Packaging & industrial Total paper

18 | A j a n i : A u s t r a l i a ’ s W o o d a n d W o o d P r o d u c t s I n d u s t r y
Australian paper production grew by an average 3.0% pa over the near two decade period
since 1990 (Figure 14). Packaging & industrial grades dominate Australia’s paper
manufacturing (60% in 2009) with production trending up at an average 3.5% pa over 1990
to 2009. Considerably further down in the product mix are printing & writing papers (22% in
1990), however production of these papers also grew strongly: average 4.4% pa over 1990 to
2009. Newsprint and tissue papers are relatively small components of Australia’s paper
product mix (19% combined in 2009).
3.2.4 Material inputs for Australian paper consumption
Australia’s paper consumption is met through a combination of domestically produced and
imported pulp with varying raw material mixes, recycled paper and imported paper.
Comprehensive statistics on the material inputs underpinning Australia’s paper consumption,
not surprisingly, do not exist. Table 3 presents an approximation of the material composition
of Australian paper consumption using Australian paper industry input mixes and
conversion factors, informed by the Australian Plantation Products and Paper Industry
Council (AP3), Australian Paper Industry Statistics 2005-06 and Resource Assessment
Commission (1992, p. L99). The material inputs required to meet Australia’s current paper
consumption were estimated by applying these ratios to Australian paper consumption (Table
4 & 5).
Table 3 Australian paper consumption – estimated material inputs Recycled
paper
(%)
Softwood
pulp
(%)
Hardwood
pulp
(%)
Non
wood
input,
fillers &
additives
(%)
Softwood
input/tonne
softwood
pulp
(m3 wood
per tonne
pulp)
Hardwood
input/tonne
hardwood pulp
(m3 wood per
tonne pulp)
Newsprint 35 65 0 0 2.5
Printing &
writing
5 15 65 15 3.7 3.7
Household
& sanitary
20 60 20 0 3.7 3.7
Packaging
&
industrial
65 35 0 0 3.5
Table 4 Estimated material inputs required to meet Australian paper consumption – 2009 Consumption
(000 tonnes)
Recycled
paper input
(000 tonnes)
Non wood
input, fillers
& additives
(000 tonnes)
Softwood
pulp
(000 tonnes)
Hardwood
pulp
(000 tonnes)
Newsprint 639 224 0 415 0
Printing &
writing
1734 87 260 260 1127
Household &
sanitary
240 48 0 144 48
Packaging 1586 1031 0 555 0
Total 4199 1390 260 1374 1175

19 | A j a n i : A u s t r a l i a ’ s W o o d a n d W o o d P r o d u c t s I n d u s t r y
Table 5 Estimated wood required to meet Australian paper consumption – 2009
Softwood
(000 m3)
Hardwood
(000 m3)
Total wood
(000 m3)
Newsprint 1038 0 1038
Printing & writing 962 4170 5132
Household & sanitary 533 178 711
Packaging & industrial 1943 0 1943
Total 4476 4348 8824
Based on the specified input mixes and conversion factors (Table 3), the 4.2 million tonnes of
paper consumed in Australia in 2009 was estimated to have been made using recycled paper
(33%), softwood and hardwood pulp (61%) and fillers and additives (6%) in domestic or
overseas pulp and paper production. Producing the wood pulp required an estimated 8.8
million m3 of wood, approximately in equal proportions of hardwood and softwood.
Opportunities for wood saving are substantial in the paper industry (for China’s leadership,
see Ajani 2011), especially because of Australia’s very low levels of recycled paper input for
printing and writing paper (Table 3). For example, a boost to the share of recycled paper in
printing and writing papers from 5% to 20% and corresponding cut in the hardwood pulp
share from 65% to 50% would generate 1 million m3 pa in hardwood resource savings, or a
23% cut in the volume of hardwood currently required to meet Australia’s printing and
writing paper consumption.
3.3 Plantation supply capability for wood-based panels and paper
Australia’s maturing hardwood plantation estate presents major opportunities for wood-based
panels, pulp and paper production (Figure 15). Over and above the current use of hardwood
from native forests and plantations for wood-based panels and paper production (estimated
1.2 million m3 pa), an additional 14 million m
3 pa of hardwood plantation pulp logs and
sawmill residues is projected to be now available for new processing investments in wood
based-panels and pulp/ paper production. Effectively, there is no hardwood plantation
resource constraint in these sectors. The challenge for new processing investment lies in
establishing competitiveness, undertaking rigorous market analysis and regaining public trust.
Potential new investors in printing and writing pulp/paper face additional challenges, namely
breaking through Australia’s heavily concentrated printing and writing paper industry (As
discussed in Section 5.1.1, this concerns Nippon’s production monopoly and substantial
interests in copy and light weight coated paper distribution in Australia).

20 | A j a n i : A u s t r a l i a ’ s W o o d a n d W o o d P r o d u c t s I n d u s t r y
Figure 15 Projected Australian plantation wood supply for paper and wood-based panels
Source/methods: Wood used for wood-based panels production in Australia in 2009 estimated using
ABARES Australian Commodity Statistics and applying a 0.67 recovery factor for particleboard (all
softwood based); 0.57 for MDF (all softwood based); 0.56 for hardboard (all hardwood based). Wood
used for paper production in Australia in 2009 estimated using ABARES Australian Commodity
Statistics and assuming 65% of newsprint was made using softwood pulp with a wood/pulp ratio of
2.5; printing & writing paper 15% and 3.7; household & sanitary 60% and 3.7; packaging & industrial
35% and 3.5. Australian Plantation Products and Paper Industry Council, Australian Paper Industry
Statistics 2005-06 for hardwood native forest and plantation wood used to made paper. Bureau of
Rural Sciences 2007 for plantation pulp log supply projections with sawmill residues estimated using
a 0.35 chip recovery factor, and a 0.17 sawdust recovery factor with 50% use rate.
4. Unprocessed wood products for export
4.1 Chip and log exports
Over the year ending June 2009, 40% of Australia’s wood production from plantations and
native forests was exported unprocessed as chips and logs. Most was exported as chips: 95%
of unprocessed wood exports from native forests in 2009; 100% of hardwood plantation
exports; and 74% of softwood plantation exports.
0
5
10
15
20
25
30
20
09
act
ual
20
10
20
11
20
12
20
13
20
14
20
15
20
16
20
17
20
18
20
19
20
20
20
21
20
22
20
23
20
24
Wo
od
(m
illio
n m
3 )
Projected plantation supply
Projected softwood plantation pulp log and sawmill residue supply
Projected hardwood plantation pulp log and sawmill residue supply
Estimated softwood used to make wood-based panels and paper in Australia in 2009
Estimated plantation and native forest hardwood used to make wood-based panels and paper in Australia in 2009

21 | A j a n i : A u s t r a l i a ’ s W o o d a n d W o o d P r o d u c t s I n d u s t r y
The year ending June 2009 was a historically significant year for Australian forestry:
hardwood plantation chips became the single biggest source of unprocessed wood exports
(Figure 16).
Figure 16 Australian exports of unprocessed wood (chips and logs)
Source/methods: Chip exports from ABS International Trade Australia Cat. No. 5465.0 reported in
ABARES Australian Commodity Statistics. Bone dry tonnes converted to m3 using basic density for
softwood of 415 kg/m3 and hardwood 630 kg/m
3 (Jaakko Poyry Consulting 1999, p. 70). Hardwood
plantation chip exports separated from hardwood total using ABARES Australian Forest and Wood
Products Statistics and assuming for years (YEJ) 1999 to 2001 that 200 000 m3 of logs were for
domestic paper making. Log exports from ABS International Trade Australia Cat. No. 5465.0 reported
in ABARES Australian Commodity Statistics. In the wood source disaggregation, softwood and other
(minor) log exports were allocated to plantations and hardwood log exports were allocated to native
forest.
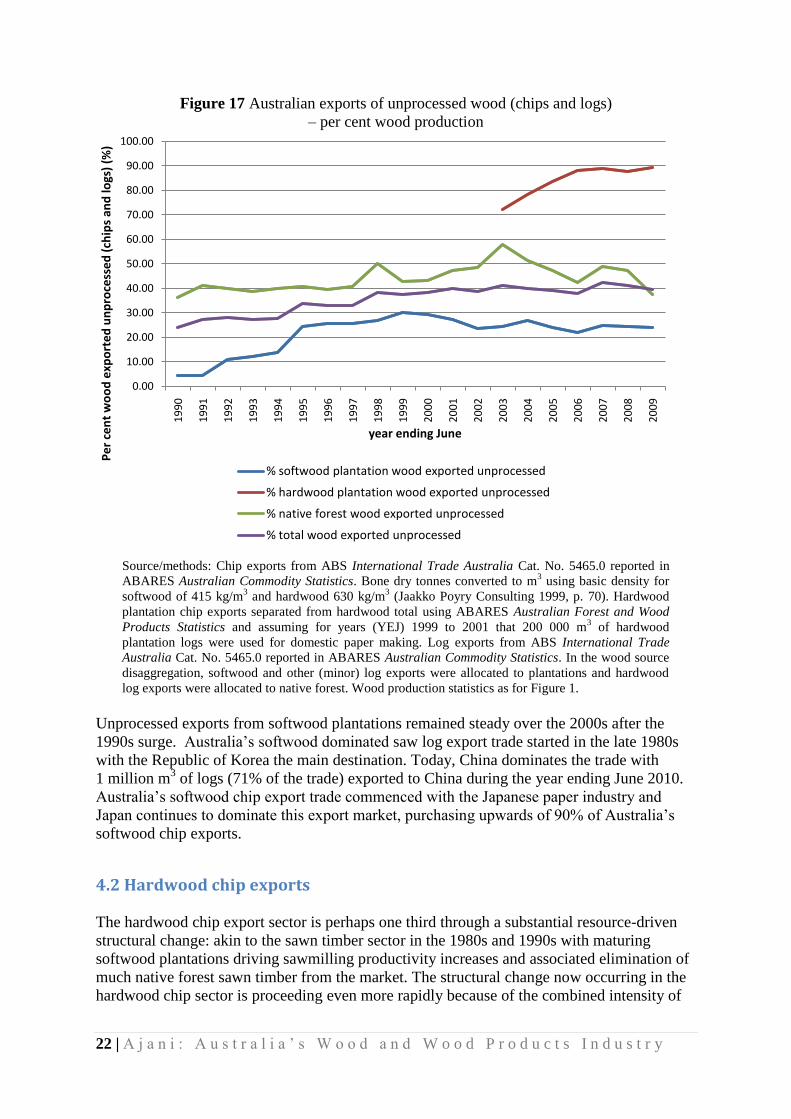
A staggering 90% of the hardwood plantation cut is now exported unprocessed. This
compares to 25% for the softwood plantation sector (Figure 17). Whilst hardwood plantations
are eliminating native forest chip exports, the lost opportunities for wealth and employment
through plantation processing are substantial.
0
2
4
6
8
10
12
14
19
90
19
91
19
92
19
93
19
94
19
95
19
96
19
97
19
98
19
99
20
00
20
01
20
02
20
03
20
04
20
05
20
06
20
07
20
08
20
09
Un
pro
cess
ed
wo
od
-ch
ips
and
logs
(m
illio
n m
3 )
year ending June
Softwood plantation unprocessed wood exportsHardwood plantation unprocessed wood exportsNative forest unprocessed wood exportsTotal unprocessed wood exports
22 | A j a n i : A u s t r a l i a ’ s W o o d a n d W o o d P r o d u c t s I n d u s t r y
Figure 17 Australian exports of unprocessed wood (chips and logs)
– per cent wood production
Source/methods: Chip exports from ABS International Trade Australia Cat. No. 5465.0 reported in
ABARES Australian Commodity Statistics. Bone dry tonnes converted to m3 using basic density for
softwood of 415 kg/m3 and hardwood 630 kg/m
3 (Jaakko Poyry Consulting 1999, p. 70). Hardwood
plantation chip exports separated from hardwood total using ABARES Australian Forest and Wood
Products Statistics and assuming for years (YEJ) 1999 to 2001 that 200 000 m3 of hardwood
plantation logs were used for domestic paper making. Log exports from ABS International Trade
Australia Cat. No. 5465.0 reported in ABARES Australian Commodity Statistics. In the wood source
disaggregation, softwood and other (minor) log exports were allocated to plantations and hardwood
log exports were allocated to native forest. Wood production statistics as for Figure 1.
Unprocessed exports from softwood plantations remained steady over the 2000s after the
1990s surge. Australia’s softwood dominated saw log export trade started in the late 1980s
with the Republic of Korea the main destination. Today, China dominates the trade with
1 million m3 of logs (71% of the trade) exported to China during the year ending June 2010.
Australia’s softwood chip export trade commenced with the Japanese paper industry and
Japan continues to dominate this export market, purchasing upwards of 90% of Australia’s
softwood chip exports.
4.2 Hardwood chip exports
The hardwood chip export sector is perhaps one third through a substantial resource-driven
structural change: akin to the sawn timber sector in the 1980s and 1990s with maturing
softwood plantations driving sawmilling productivity increases and associated elimination of
much native forest sawn timber from the market. The structural change now occurring in the
hardwood chip sector is proceeding even more rapidly because of the combined intensity of
0.00
10.00
20.00
30.00
40.00
50.00
60.00
70.00
80.00
90.00
100.00
19
90
19
91
19
92
19
93
19
94
19
95
19
96
19
97
19
98
19
99
20
00
20
01
20
02
20
03
20
04
20
05
20
06
20
07
20
08
20
09
Pe
r ce
nt
wo
od
exp
ort
ed
un
pro
cess
ed
(ch
ips
and
logs
) (%
)
year ending June
% softwood plantation wood exported unprocessed
% hardwood plantation wood exported unprocessed
% native forest wood exported unprocessed
% total wood exported unprocessed

23 | A j a n i : A u s t r a l i a ’ s W o o d a n d W o o d P r o d u c t s I n d u s t r y
the managed investment scheme (MIS) tax-driven (not wood market-driven) hardwood
planting and the collapse of the Japanese market. Environmentalists have leveraged this
market reality and campaigned strongly for Japanese chip importers to source from
plantations, not native forests.
In Australia, hardwood plantation chip exporting effectively commenced in the late 1990s
with exports increasing by an average 32% pa over the following decade: year ending June
1999 to 2009. Native forest chip exports over this period declined by an average 4.2% pa
(Figure 18). Despite the strong contraction in native forest chip exports, Australia’s hardwood
chip exports from all sources reached an unprecedented high in 2008.
Figure 18 Australian exports of hardwood chips – plantations and native forests
Source/methods: Chip exports from ABS International Trade Australia Cat. No. 5465.0 reported in
ABARES Australian Commodity Statistics. Bone dry tonnes converted to m3 using basic density for
softwood of 415 kg/m3 and hardwood 630 kg/m
3 (Jaakko Poyry Consulting 1999, p. 70). Hardwood
plantation chip exports separated from hardwood total using ABARES Australian Forest and Wood
Products Statistics and assuming for years (YEJ) 1999 to 2001 that 200 000 m3 of hardwood plantation
logs were used for domestic paper making.
Japan remains the prime market for plantation and native forest hardwood chip exports
(Figure 19).
Australia’s one million hectare hardwood plantation estate is now coming on stream fully.
ABARES’ projections of hardwood chiplog supply indicate a potential immediate tripling in
annul plantation chip supply from 2010 levels (Figure 20). The inevitable continuing
contraction in native forest chip exports is expected to intensify over the next few years.
0
1
2
3
4
5
6
7
8
9
19
90
19
91
19
92
19
93
19
94
19
95
19
96
19
97
19
98
19
99
20
00
20
01
20
02
20
03
20
04
20
05
20
06
20
07
20
08
20
09
Har
dw
oo
d c
hip
exp
ort
s (m
illio
n m
3)
year ending June
Hardwood plantation chip exports Native forest chip exports Total hardwood chip exports

24 | A j a n i : A u s t r a l i a ’ s W o o d a n d W o o d P r o d u c t s I n d u s t r y
Figure 19 Australian hardwood chip exports (plantation and native forest)
– country of destination
Source: ABARES Australian Forest and Wood Products Statistics. Country of destination data before
2006 is not reported.
Figure 20 Australian hardwood chip exports and projected plantation supply
Source/methods: Chip exports from ABS International Trade Australia Cat. No. 5465.0 reported in
ABARES Australian Commodity Statistics. Bone dry tonnes converted to m3 using basic density for
hardwood of 630 kg/m3 (Jaakko Poyry Consulting 1999, p. 70). Hardwood plantation chip exports
separated from hardwood total using ABARES Australian Forest and Wood Products Statistics and
assuming for years (YEJ) 1999 to 2001 that 200 000 m3 of hardwood plantation logs were used for
domestic paper making. Bureau of Rural Sciences 2007 for projected supply with 7% reduction for chip
losses and fines.
0
1
2
3
4
5
6
2006 2007 2008 2009 2010
Ch
ip e
xpo
rts
(mill
ion
bo
ne
dry
to
nn
es)
year ending June
Other
Korea Rep
Japan
Chinese Taipei
China
0
2
4
6
8
10
12
14
16
19
90
19
91
19
92
19
93
19
94
19
95
19
96
19
97
19
98
19
99
20
00
20
01
20
02
20
03
20
04
20
05
20
06
20
07
20
08
20
09
20
10
20
11
20
12
20
13
20
14
20
15
20
16
20
17
20
18
20
19
20
20
20
21
20
22
20
23
20
24
Ch
ip e
xpo
rts
(mill
ion
m3 )
Hardwood plantation chip exports (actual) Native forest chip exports (actual)
Total hardwood chip exports (actual) Projected hardwod plantation chip supply

25 | A j a n i : A u s t r a l i a ’ s W o o d a n d W o o d P r o d u c t s I n d u s t r y
The hardwood plantation resource presents near unlimited processing opportunities.
Figure 21 presents just one example and should be read as an opportunity passing just the
first hurdle, namely plantation wood availability. It incorporates two world scale wood-based
panels plants for immediate construction and reaching full production by 2015 and one
4 million m3 pa wood input pulp/paper processing facility with mill start up in 2015 and fully
commissioned by 2021. According to government projections (Bureau of Rural Sciences
2007), hardwood plantation resources for such a pulp/paper mill are available in sufficient
volumes in this time frame in three regions: Western Australia, Tasmania and the Green
Triangle.
Figure 21 Australia’s hardwood plantation chip resource and processing opportunities
Source/methods: Chip exports from ABS International Trade Australia Cat. No. 5465.0 reported in
ABARES Australian Commodity Statistics. Bone dry tonnes converted to m3 using basic density for
hardwood of 630 kg/m3 (Jaakko Poyry Consulting 1999, p. 70). Hardwood plantation chip exports
separated from hardwood total using ABARES Australian Forest and Wood Products Statistics and
assuming for years (YEJ) 1999 to 2001 that 200 000 m3 of hardwood plantation logs were used for
domestic paper making. Bureau of Rural Sciences 2007 for projected supply with 7% reduction for chip
losses and fines. Processing scenario comprises 2 wood-based panels plants each processing 0.4 million
m3 pa of wood coming on stream in 2012 and reaching full production in 2015 and one 4 million m
3 pa
wood input pulp/ paper facility with mill start up in 2015 and fully commissioned by 2021.
0
2
4
6
8
10
12
14
19
90
19
91
19
92
19
93
19
94
19
95
19
96
19
97
19
98
19
99
20
00
20
01
20
02
20
03
20
04
20
05
20
06
20
07
20
08
20
09
20
10
20
11
20
12
20
13
20
14
20
15
20
16
20
17
20
18
20
19
20
20
20
21
20
22
20
23
20
24
Har
dw
oo
d c
hip
s (m
illio
n m
3)
Chips for two wood-based panels plants Chips for new pulp/paper mill
Hardwood plantation chip exports (actual) Native forest chip exports (actual)
Total hardwood chip exports (actual) Chips remaining for export
26 | A j a n i : A u s t r a l i a ’ s W o o d a n d W o o d P r o d u c t s I n d u s t r y
5. Policy
5.1 Industry trends – summary
Describing Australia’s wood and wood products industry as a ‘forestry’ industry is a
misnomer. Forests – widely understood in Australia to mean native forests – are self-
regenerating ecosystems dominated by native species. Native forests are fundamentally
different to plantations (an agricultural cropping regime) and now provide relatively small
volumes of wood for Australian sawn timber, pulp/paper and wood panels production. Today,
plantations supply 82% of the wood for solid wood products manufacturing (sawn timber and
wood panels) in Australia. Production of native forest solid wood products has contracted by
an average 2% pa over the past two decades (Figure 7). In this intense period of industry
structural change, buyers have not shifted to hardwood-based imports, including from
tropical regions. Instead, consumption of hardwood solid wood products, domestically
produced and imported, has continued to contract (Figure 10).
We can expect increasing plantation-based production, even without any expansion to
Australia’s plantation estate (Figure 1), as softwood saw and veneer log supply is maintained
(Figure 9) and work to increase plantation productivity is set in train; as the projected supply
of hardwood plantation saw/veneer logs increases steadily over 2010 to 2030 (Figure 10);
and, in particular, as supplies of hardwood and softwood plantation pulp logs and saw/veneer
mill residues soar above the volumes required for new wood-based panels and pulp/paper
mills even beyond industry dreams (Figure 15).
These past and continuing trends are the outcome of increasing plantation wood supply and
wood manufacturers’ strong preference for an agriculturally grown resource, with its scale
economy and other cost reduction attractions relative to native forest wood. The structural
change has and continues to occur through the market with plantation made products out-
competing the incumbent native forest competition. This is despite state government
subsidies on native forest logs (state forestry agencies are marginally profitable at best with
most running losses in the more recent past) which have frustrated and delayed, but not
prevented, the transition to plantations.
The plantation-native forest displacement now taking place in the hardwood chip export
market is unprecedented in its intensity. The widespread contraction in native forest
sawmilling over the 1980s and 1990s drew more native forest resources into the chip export
market. Now, hardwood plantation chips are decimating native forest chip exports, the single
biggest market for native forest wood. The competition effectively commenced in the late
1990s as hardwood plantations in Western Australia matured. Within a decade, hardwood
plantation chip exports broke through the 50% market share and ABARES’ plantation wood
supply projections indicate an immediate tripling in hardwood plantation pulp log supply
(Figure 20). On current trends, we can expect a near complete displacement of Australian
native forest chip exports within the next few years.
For too long the false argument, that native forest logging is sawlog-driven and that most
sawn timber would survive the plantation competition because of its successful shift to high
appearance products, has held sway in state and federal policymaking circles. Reliable sawn
timber production data capable of verifying, or otherwise, this view has been lacking. Using
data compiled for the National Carbon Accounting System that tracks native forest biomass
from saw log to finished sawn timber suggests that nearly 80% of current native forest sawn

27 | A j a n i : A u s t r a l i a ’ s W o o d a n d W o o d P r o d u c t s I n d u s t r y
timber is used for framing, pallets and palings (Table 2) and therefore highly vulnerable to
plantation competition. A proportion of the remaining 20%, namely flooring and board
products, is also vulnerable. If 50% of flooring and board production is vulnerable to
plantation competition (or non-wood products competition), the market for hardwood
sawlogs from native forests for high appearance products may be near 260 000 m3 pa. This is
equal to 3.3% of native forest wood production in 2009. It is a sad reflection on Australian
wood and wood products industry policy that a minor product devoid of reliable
quantification has stymied coherent forest and wood industry policy for so long.
No doubt calls will be made for more publicly funded hardwood sawlog plantations
accompanied by two supporting but weak arguments. Firstly, such plantings are a necessary
condition for retiring native forests from wood production. The depth and breadth of
competing softwood solid wood products is often ignored when presenting this argument. If
the 3% grey area currently requiring an estimated 260 000 m3 pa of hardwood saw/veneer
logs for high appearance products is to be maintained (without addressing why), policy
makers can look to the supply potential and timing from the hardwood plantation estate
(Table 6). In volume terms, it appears Australia’s existing hardwood plantations can more
than accommodate the appearance market and that Tasmania is well placed in this regard. At
a very minimum, the volume and quality of the plantation resource demands further
investigation before any consideration of additional publicly funded plantations.
Table 6 Projected hardwood plantation saw/veneer log supply (000 m3 pa)
Australia (000 m
3 pa)
Tasmania (000 m
3 pa)
2005-09 224 21 2010-14 358 193 2015-19 582 446 2020-24 1110 746 2025-29 1238 904
Source: Bureau of Rural Sciences 2007.
The second argument uses an incorrect interpretation of market failure to call for government
funding to do the job the private sector apparently is not interested in – investing in long lead-
time plantations. Long lead times are not in themselves a market failure. Rather, investors in
long rotation plantations require higher returns to compensate for the increased risk.
Hardwood sawmillers, however, appear unwilling to pay the higher wood prices to attract the
plantation investment and expect the public to keep subsidising their wood costs. The well-
established trend decline in Australia’s consumption of hardwood solid wood products,
comprising mainly sawn timber, (Figure 10) turns-off private investors but does nothing to
temper the calls for government subsidies to plant trees for a market in decline.
In summary, Australia’s wood products industry is now heavily plantation based and
economically more robust as a result. The rapid exit of native forests from the chip export
market, as more hardwood plantations come on stream, will continue over the next few years
and bring to a close a highly contentious era in Australian forestry. Virtually all native forest
markets are vulnerable to plantation competition, including within the relatively small high
appearance sawn timber and veneer market. Australia’s two million hectare softwood and
hardwood plantation estate can immediately meet virtually all Australia’s wood needs. In the

28 | A j a n i : A u s t r a l i a ’ s W o o d a n d W o o d P r o d u c t s I n d u s t r y
wood-based panels and pulp/paper sector, plantation resources are now running well in
excess of industries’ dreams for processing capacity expansion.
5.1.1 The ‘forest products’ trade deficit
Australia’s ‘forest products’ trade deficit has received considerable attention, although
product trade deficits are necessary for countries wishing to export. Given that this is
understood, an economically rational concern about Australia’s ‘forest products’ trade deficit
can only lie in a belief that Australia has unrealised comparative advantage opportunities in
the sector. Unrealised either because of insufficient raw materials (for example, native forests
allocated to conservation, inadequate plantation establishment, low plantation productivity
and wasted recycled paper resources) or market failure factors undermining processing
competitiveness or preventing investment.
Australia’s quoted ‘forest products’ trade deficit has hovered around $2 billion pa over the
more recent past (Figure 22), meaning that in real (inflation adjusted) terms, it has trended
down slightly. The $2 billion is the difference between annual imports (valued with freight
and insurance costs and customs and other duties included) and annual exports (valued with
freight and insurance costs and any customs and other duties imposed by the importing
country excluded). These measurement units work to negatively bias the wood and wood
products trade situation.
The primary data source for the $2 billion trade deficit figure is The ABS’ international trade
statistics. (The ABS presents disaggregated data and does not report product trade
deficits/surpluses.) ABARES extracts the import and export data for each of the products it
considers to be ‘forest products’ trade. ABARES does not actually report the ‘forest products’
product deficit but presents import data in one table followed by export data and notes in a
footnote the measurement units. It is the users of ABARES’ statistical publications that
incorrectly compare imports with exports.
The product groups ABARES’ includes in its statistics relating to the ‘forest products’ trade
deficit are presented in Figure 22. Most product groups are insignificant, even before
allowing for the export and import measurement differences. There are only three notable
items: further processed wood products, printing & writing papers and unprocessed wood.
Further processed wood products include such items as wooden doors, mouldings, packing
cases, parquetry flooring, builders carpentry, cork, gums, resins, eucalyptus oils, boxes, bags,
account books, note books, letter pads and other paper stationery and other miscellaneous
wood articles and exclude wooden furniture. Individually, they are insignificant but in
aggregate accounted for 52% of Australia’s ‘forest products’ trade deficit in the year ending
June 2010 (Figure 22). The trade deficit using the traditional classification of wood and wood
products (sawn timber, wood panels, pulp and paper) was only $0.9 billion in the year ending
June 2010 (leaving the import-export measurement bias aside).
The only significant item in Australia’s wood and wood products trade deficit is printing &
writing paper: $1.2 billion in the year ending June 2010. All other paper groups (newsprint,
packaging, tissues) are close to in balance. Whilst VISY’s Tumut softwood plantation
pulp/recycled paper/paper facility establishes that new pulp/paper mill investments are
possible, a new hardwood pulp mill remains unrealised in Tasmania and the ‘forest products’
trade deficit is frequently employed in arguing the case for government facilitation. The
Tasmanian pulpmill debate is polarised on environment grounds, however lying in the

29 | A j a n i : A u s t r a l i a ’ s W o o d a n d W o o d P r o d u c t s I n d u s t r y
background is an important industry concentration problem that pulpmill advocates have not
confronted. In 1993, Amcor became Australia’s monopoly producer of printing and writing
papers with substantial merchanting interests after the ACCC approved its APPM acquisition.
Today, Nippon owns those paper assets including substantial merchanting interests in copy
and light weight coated papers. This industry concentration forces new hardwood pulp and
paper mill proposals into the highly risky export market, rather than the domestic market with
growth based on substantial opportunities for import replacement. Tackling printing &
writing paper industry concentration should be the highest priority for people and
organisations wishing for a hardwood pulpmill and reduction in the ‘forest products’ trade
deficit.
Figure 22 Australia’s ‘forest products’ trade deficit (imports minus exports)
* Further processed wood products include such items as wooden doors, mouldings, packing cases,
parquetry flooring, builders carpentry, cork, gums, resins, eucalyptus oils, boxes, bags, account books,
note books, letter pads and other paper stationery and other miscellaneous wood articles and excludes
wooden furniture.
** Duty or customs values for imports and fob from Australian ports for exports.
Source: ABS International Trade, Australia, Cat. No. 5465.0 as presented in ABARES Australian
Commodity Statistics.
Australia’s ‘forest products’ trade deficit is not due to a wood shortage. Figure 23 presents
the trade deficit/surplus in volume units rather than monetary units. The blue line is
ABARES’ estimate of the amount of wood (estimated log equivalent) in all our exports of
unprocessed wood, sawn timber, wood panels, pulp and paper minus the amount of wood in
all our imports of these products. The difference between the two is the wood and wood
products trade deficit/surplus in volume terms. Since the mid 1990s, Australia had recorded
wood surpluses: in volume terms, we export more wood than we consume. This is largely due
to increasing exports of softwood plantation logs over the 1990s followed in the 2000s by
-1500
-1000
-500
0
500
1000
1500
2000
2500
20
04
20
05
20
06
20
07
20
08
20
09
20
10
Ne
t im
po
rts
(im
po
rts
min
us
exp
ort
s) (
A$
mill
ion
**)
year ending June
Softwood sawn timber Hardwood sawn timber Railway sleepersVeneer Plywood ParticleboardHardboard Medium density fibreboard Softboard and other fibreboardNewsprint Printing and writing Household and sanitaryPackaging and industrial Pulp
Total
Printing & writing paper
Further processed wood products *
Waste paper
Unprocessed wood (logs & chips)
Products with trade deficit less than $0.5 billion

30 | A j a n i : A u s t r a l i a ’ s W o o d a n d W o o d P r o d u c t s I n d u s t r y
increasing hardwood plantation chip exports. We can expect monetary expressions of
Australia’s ‘forest products’ net trade (exports minus imports) to remain negative while we
export low value plantation wood (unprocessed logs and chips) and import higher value
processed wood products. This is an industry policy matter concerning plantation processing,
separate to the native forest–conservation debate.
Figure 23 Australia’s wood surplus*
* Exports minus imports of estimated log equivalent of processed wood products (sawn timber, wood
panels, pulp and paper) and unprocessed wood products (chips and logs).
Source/methods: ABARES Australian Commodity Statistics for wood deficit/surplus. Softwood chip
exports from ABS International Trade Australia Cat. No. 5465.0 reported in ABARES Australian
Commodity Statistics. Bone dry tonnes converted to m3 using basic density for softwood of 415 kg/m
3
(Jaakko Poyry Consulting 1999, p. 70). Hardwood plantation chip exports from ABARES Australian
Forest and Wood Products Statistics and assuming for years (YEJ) 1999 to 2001 that 200 000 m3 of
logs were for domestic paper making. Log exports from ABS International Trade Australia Cat. No.
5465.0 reported in ABARES Australian Commodity Statistics. In the wood source disaggregation,
softwood and other (minor) log exports were allocated to plantations and no hardwood log exports were
allocated to plantations.
5.1.2 Tropical timber imports
Like the ‘forest products’ trade deficit and the importance of high appearance native forest
sawn timber, tropical timber imports are engulfed in misrepresentation. Australia’s imports of
sawn timber and wood panels from tropical countries accounted for an estimated 2.3% of
Australia’s consumption of solid wood products in 2008/09 (Figure 24). Insignificant levels
of consumption do not mean Australia should do nothing about ending tropical timber
imports. Rather it means we as a nation can do so with little effort. And even with an
immediate retirement of native forests from wood production, we can expect softwood
products, not hardwood products, to fill the vacancy as they have for the past two decades.
-6
-4
-2
0
2
4
6
8
10
19
65
19
67
19
69
19
71
19
73
19
75
19
77
19
79
19
81
19
83
19
85
19
87
19
89
19
91
19
93
19
95
19
97
19
99
20
01
20
03
20
05
20
07
20
09
Wo
od
eq
uiv
ale
nt
un
its
(mill
ion
m3)
year ending June
Hardwood plantation unprocessed wood exports
Softwood plantation unprocessed wood exports
Wood deficit/surplus*

31 | A j a n i : A u s t r a l i a ’ s W o o d a n d W o o d P r o d u c t s I n d u s t r y
Figure 24 Country of origin source of Australian consumption of solid wood products
(sawn timber and wood panels) 2008/09
Source/methods: Import data from ABS International Trade Australia Cat. No. 5465.0 reported in
ABARES Australia Forest and Wood Products Statistics. Wood panels includes veneer, plywood,
particleboard, medium density fibreboard, hardboard and other softboard and other boards. Australian
sawn timber production data from ABARES Australian Commodity Statistics and Australian Forest
and Wood Products Statistics with cypress sawn timber production allocated to native forests and
hardwood plantation sawn timber production estimated with a 0.38 recovery factor. Sawn timber
exports ABS International Trade Australia Cat. No. 5465.0 reported in ABARES Australia Forest and
Wood Products Statistics with all softwood exports allocated to plantations and all hardwood to native
forests. Wood panels production from ABARES Australian Commodity Statistics and export data from
ABS International Trade Australia Cat. No. 5465.0 reported in ABARES Australia Forest and Wood
Products Statistics. Production and exports were disaggregated into plantations and native forests as
follows: veneer (0.0:1.0); plywood (0.5:0.5); particleboard (1.0:0.0); medium density fibreboard
(1.0:0.0); hardboard (0.0:1.0); other (1.0:0.0).
5.2 Forest and wood and wood products industry policy
Pandering to economically and environmentally inferior incumbents characterises Australia’s
forest policy. Missed opportunities abound as the benefits of biodiversity conservation/carbon
store opportunities for native forests (Keith et al. 2009 & 2010), new industry players,
products and technologies lie unrealised. The softwood plantation sawmillers’ decades-long
struggle for market share against the heavily subsidised native forest sawmillers is largely
over, but not before substantially weakening the plantation processing corporates engaged in
the battle. Many exited the industry, selling softwood sawmilling and wood panel assets often
to overseas buyers with a branch office mentality. Similarly, in the printing and writing paper
sector, where Nippon, Australia’s monopoly producer of printing and writing papers, has
substantial merchanting interests in copy and light weight coated papers produced in its
New Zealand5.8% Canada
1.08%
Czech Republic
0.83%
Chile0.77%
Germany0.74%
Austria0.65%
China0.64%
Estonia0.32%Other
2.02%
Australian plantation production consumed
domestically70.2%
Malaysia1.27%Indonesia
0.74%
Papua New Guinea0.14%
Solomon Islands0.05%
Philipines0.03% Cameroon
0.02%
Ecuador0.02%
Fiji0.01%
Australian native forest production consumed
domestically14.7%

32 | A j a n i : A u s t r a l i a ’ s W o o d a n d W o o d P r o d u c t s I n d u s t r y
overseas and Australian mills. Its Australian production strategies play second fiddle to
Nippon Group interests.
Maybe the time for a coherent wood and wood products industry policy focussed around
plantation processing has passed. Such a policy would completely free the market of state-
subsidised native forest competition and also refocus policy away from unending plantation
expansion via tax-based subsidies devoid of rigorous market analysis. Instead, it would set
the prime objective to encouraging commercially viable domestic plantation processing. The
package would include research and development programs, worker and management skill
development and transport strategies with a focus around regional hubs with a critical
plantation mass for scale economy processing.
Forest and wood products industry policy making today is like being back in the 1970s. The
native forest logging interests calling for approval to enter the vast energy and other biomass
feedstock markets are the new woodchippers. Their successful lobbying on carbon
accounting details and classifying native forests as renewable and therefore eligible for
renewable energy certificates works to propel these commercially marginal new opportunities
for native forests across the profitability line. The behaviour is akin to the 1970s chip export
proposals that depended on low priced native forest logs for profitability. Even the calming
sounds of ‘sawlog-driven’ or additional to ‘high value’ processes are familiar, as is the
argument that only ‘waste’ will be used.
The 1970s was also the era of government subsidies (Commonwealth grants and low interest
loans) for softwood plantations followed, a few decades later, by tax minimisation plantation
managed investment schemes. The plantation managed investment arrangements remain in
place and tax minimisers keep subscribing despite the predicted and subsequently realised
widespread collapse within the sector. Forestry lobbyists have carbon sink plantings, either
separate or tacked onto wood producing plantations, on the agenda. With the public purse
open, it seems there is no end for plantation expansion in Australia. Even the plans for state
forest agencies to manage areas of native forests for carbon stores are familiar. It was called
‘multiple-use management’ in the 1970s.
There is one difference: we can choose to learn from past policy mistakes.
Public interest outcomes are compromised when policy is dominated by the interests of
economically and environmentally inferior incumbents. Engineering commercial viability
into wood based energy suits the native forest sector: but it is not an efficient energy
production system. Planting carbon sinks, especially with single or limited species, suits the
plantation lobby: but such plantings are not efficient carbon stores. Tasking state forest
agencies with managing native forests as carbon stores suits the incumbent state forestry
agencies: but they are not skilled in biodiversity conservation which is critical for
maintaining and restoring native forest carbon stocks.
Quite possibly, government will not resist the lobbying that prevents Australia having a
coherent forest and wood products industry policy where each land sector is allocated to the
job it does best: plantations for wood products and native forests for biodiversity
conservation/carbon stores/water. If government facilitates native forests into the energy and
other biomass feedstock markets, Australia’s forest conflict will continue raging. The public
can wish to avoid this outcome, but only governments can make that happen.

33 | A j a n i : A u s t r a l i a ’ s W o o d a n d W o o d P r o d u c t s I n d u s t r y
References ABARE (various issues) Australian Commodity Statistics
ABARE (various issues) Australian Forest and Wood Products Statistics
Ajani J. 2007, The Forest Wars, Melbourne University Press.
Ajani J. 2010, Climate change policy distortions in the wood and food market, Contributed paper to
the Australian Agricultural and Resource Economics Society National Conference 2010,
Adelaide Convention Centre, February 8 - 12.
Ajani J. 2011, The global wood market, wood resource productivity and price trends: an examination
with special attention to China, Environmental Conservation.
doi:10.1017/S0376892910000895
<http://journals.cambridge.org/action/displayJournal?jid=ENC>
Australian Plantation Products and Paper Industry Council, Australian Paper Industry Statistics 2005-
06 http://www.a3p.asn.au/facts/proposed%20new%20index.html
Bureau of Rural Sciences 2007, Australia’s Plantation Log Supply 2005-2049 <
http://adl.brs.gov.au/brsShop/data/log_supply_final.pdf>
Burns K., Sledge P. and Wicks S. 2009, ABARE 2007 Sawmill Survey Report, ABARE report to the
Australian Government Department of Agriculture, Fisheries and Forestry and Forest and
Wood Products Australia <
http://www.abare.gov.au/publications_html/forestry/forestry_09/09_Sawmill.pdf>
Jaakko Poyry Consulting 1999, Usage and Lifecycle of Wood Products, Technical Report No 8,
National Carbon Accounting System, Australian Greenhouse Office.
Keith H., Mackey B.D. & Lindenmayer D.B. 2009, Re-evaluation of forest biomass carbon stocks and
lessons for the world’s most carbon dense forests, Proceedings of the National Academy of
Sciences of the United States of America, published online before print 24 June. [WWW
document] URL http://www.pnas.org/content/106/28/11635.short
Keith H., Mackey B., Berry S., Lindenmayer D. & Gibbons P. 2010, Estimating carbon carrying
capacity in natural forest ecosystems across heterogeneous landscapes: addressing sources of
error, Global Change Biology. [WWW document] URL
http://www3.interscience.wiley.com/journal/123215818/abstract?CRETRY=1&SRETRY=0
NAFI 2011, NAFI welcomes new inquiry into forestry industry, media release, 10 February.
Resource Assessment Commission 1992, Forest and Timber Inquiry Final Report, Volume 2A,
AGPS.
Gavran M. and Parsons M. 2009, Australia’s Plantations Inventory Update 2009, National Plantation
Inventory, Bureau of Rural Sciences, Canberra.
Plantations 2009 Inventory Update, National Forest Inventory, Bureau of Rural Sciences, Canberra.