austrian tourism sector badly hit by covid-19 pandemic1
TRANSCRIPT

MONETARY POLICY & THE ECONOMY Q4/20 – Q1/21 41
Austrian tourism sector badly hit by COVID-19 pandemic1
Gerhard Fenz, Helmut Stix, Klaus Vondra2
Referee: Oliver Fritz, WIFO
Contributing 7.3% to Austrian value added, tourism is an important pillar of the Austrian economy. It has been hit particularly hard by the COVID-19 crisis. We analyze the impact of the crisis using high-frequency real-time data on payment card spending and monthly data on overnight stays. During the lockdown in spring 2020, overnight stays in Austria dropped by almost 100%. Over the summer, tourism activity recovered strongly, backed by domestic and German tourists. Nevertheless, it remained clearly below 2019 levels. In October 2020, the renewed increase in the number of COVID-19 infections led to another severe downturn in Austrian tourism, as several neighboring countries posted travel warnings. On November 2, 2020, a second lockdown started in Austria – accommodation establishments and restaurants were closed. Hence, we expect overnight stays to drop again by around 95% in November. As the Austrian government announced on December 2, 2020, Austrian accommodation establish-ments will not open before January 2021; on top of that, travel warnings by major countries of origin (especially Germany) will remain in place. Based on these assumptions, we estimate total overnight stays to decrease by 36% in 2020. This will be mainly attributable to a strong decline in overnight stays by foreign tourists (–41%), while overnight stays by domestic tourists will go down by only 23%. The overall decline in overnight stays could have been far stronger if the lockdown in spring 2020 and the recent shutdown had not fallen into the off-season but into the high season in winter or summer.
JEL classification: E23, L83Keywords: tourism, COVID-19 pandemic, Austria
Tourism is an important pillar of the Austrian economy. According to data provided by the tourism satellite account (TSA), its direct and indirect value-added effects account for almost 7½% of GDP. By European standards, the Austrian tourism sector thus makes an above-average contribution to overall economic output. Almost 6% of total employment in Austria are directly attributable to main tourism activities like “accommodation and restaurants,” “transport” and “culture, sports and entertainment.”
Tourism was particularly strongly affected by the COVID-19 crisis. The first lockdown Austria imposed as of March 16, 2020, led to a sudden drop in revenues by almost 100% in many tourist areas – an economic downturn of unprecedented size and speed. Over the summer months of 2020, tourism in Austria recovered strongly. Therefore, the decline in overnight stays in Austria until fall 2020 was comparatively less pronounced than in Southern European countries like Greece, Spain or Portugal. However, containment measures to fight the COVID-19 pandemic, travel restrictions and travel warnings as well as fears and the perceived risk of COVID-19 infections continue to burden the tourism industry. Since
1 Cutoff date for data: December 2, 2020.2 Oesterreichische Nationalbank, Economic Analysis Division, [email protected], [email protected] and
Economic Studies Division, [email protected]. We thank the referee for very helpful comments as well as several payment card service providers for their willingness to support us with information on aggregate payment card transactions.
Austrian tourism sector badly hit by COVID-19 pandemic
42 OESTERREICHISCHE NATIONALBANK
mid-September 2020, these problems have intensified, and since November 2, 2020, the tourism industry has been suffering the consequences of a second lock-down.
Against this background, it is particularly important to closely monitor devel-opments in tourism and to provide timely information about the COVID-19 pandemic’s effects. In the past, statistics on overnight stays were the main data source for tourism analysis. Data on overnight stays are available for several accom-modation categories, at a detailed regional level and for all countries of origin of foreign tourists in Austria. This information is highly relevant but has two weak-nesses. First, data are published with a time lag of one month. Second, data are only available at a monthly frequency. We therefore supplement our analysis with information gained from payment card service providers. The latter data are available almost in real time and on a weekly basis, thus enabling, on the one hand, a timely assessment of the latest developments and, on the other hand, a very precise chronological representation of containment measures and their impact on Austrian tourism.
This study is structured as follows: Section 1 presents stylized facts on the economic weight of tourism in Austria and its provinces, comparing Austria with other European countries. In section 2, we analyze the economic consequences of the COVID-19 crisis for Austrian tourism between March and November 2020, using two data sources: the number of overnight stays and data on payment card expenditure collected from payment card service providers. In section 3, we provide projections of the path of overnight stays in Austria until end-2020. We give an overview of the 2020 summer tourist season and predict developments in Austrian tourism for the full year 2020. We summarize our results in section 4, outlining potential risks for Austria’s winter tourist season 2020–2021.
1 Tourism is a key sector in the Austrian economy
1.1 The tourism industry generates 7½% of total value added in Austria
In Austria, the tertiary sector plays a dominant role in total economic activity, accounting for more than 70% of total value added (services: 70.2%; agriculture: 1.2%, manufacturing: 28.6%). Under the System of National Accounts (SNA), the tourism sector cannot be precisely separated from other sectors, but it can be approximated by the sum of NACE services sectors I (accommodation and food services) and R (arts, entertainment and recreation). In both sectors, however, it is impossible to distinguish activities of local residents from those of tourists, no matter whether they come from Austria or from abroad. Especially NACE sectors I56 (food and beverage service activities) and R (arts, entertainment and recre-ation) contain high shares of consumption by domestic nontourists. Nevertheless, the sum of the value added generated by these two sectors provides a first rough estimate of the significance of the tourism sector in Austria: Together, they accounted for 6.6% of total value added in Austria in 2019 (sector I: 5.4%; sector R:1.3%, see table 1). Given the statistical difficulties, the share of 6.6% over-estimates the economic weight of the tourism sector. Then again, we might add other NACE sectors – like H50 (water transport), H51 (air transport) and N79 (travel agencies) – to the calculation, which would, in turn, increase the share.

Austrian tourism sector badly hit by COVID-19 pandemic
MONETARY POLICY & THE ECONOMY Q4/20 – Q1/21 43
Given the important role tourism plays in the Austrian economy and its inadequate representation in the SNA, Statistics Austria has been calculating a tourism satellite account (TSA) for Austria since 1999 – based on recom-mendations by Eurostat, the OECD and the World Tourism Organization (UNWTO). The TSA uses both supply- and demand-side information, combin-ing it with input-output tables, which makes it possible to more accurately quantify the direct and indirect value- added effects of the tourism sector. In a narrow sense (i.e. considering only direct effects and excluding business trips), tourism in Austria contributed 5.6% to total GDP in 2019. In a broader sense (i.e. including indirect effects and business trips), its share was 7.3%. This proportion has remained almost un-changed since 2000.3
Based on the TSA, Statistics Austria calculates tourism consumption expen-diture by category on an annual basis. In 2018, accommodation accounted for just over one-third of total tourist spending, followed by expenses for food service activities, which accounted for just under one-fourth. The share of transport was not negligible, either – around 10% of total tourist expendi-ture was used for air travel and 7% for ground travel (by boat, rail or road). In contrast, tourist expenditure for culture, entertainment and other services made up less than 10% of the total4 (see Fritz and Ehn-Fragner, 2020, for an in-depth analysis).
Moreover, tourism consumption expenditure can be broken down further into expenditure by foreign tourists and expenditure by domestic tourists. According to this breakdown, foreign tourists account for 54% and domestic tourists for 46% of total tourist expenses in Austria. Matching these figures with the tourism
3 If we consider the leisure industry as a whole, it has a share of almost 15% in GDP (Federal Ministry for Sustainability and Tourism, 2019). This figure includes all leisure and recreation activities of residents in or near their home environment.
4 Expenses for other consumer goods include expenses for tourism-related and non-tourism specific goods and services (e.g. retail trade; services such as massages, hairdressing, etc.).
Table 1
Tourism plays vital role in the Austrian economy
2019
National account data – value added EUR million Share in value added in %
Accommodation and food service activities (NACE I) 19,141 5.4 Arts, entertainment and recreation (NACE R) 4,468 1.3 Sectors I and R 23,608 6.6
Tourism satellite accounts (TSA) – GDP EUR million Share in GDP in %
Direct value added excluding business trips 22,135 5.6 Direct value added including business trips 23,545 5.9 Direct and indirect value added 29,171 7.3
Source: Statistics Austria, Eurostat.
% of total tourism consumption
Tourism consumption categories in 2018
Chart 1
Source: Statistics Austria.
AccommodationFood service activitiesAir transportOther personal transportCulture, entertainment and other servicesOther consumption goods
35.5
22.5
10.5
7.0
8.1
15.7
Austrian tourism sector badly hit by COVID-19 pandemic
44 OESTERREICHISCHE NATIONALBANK
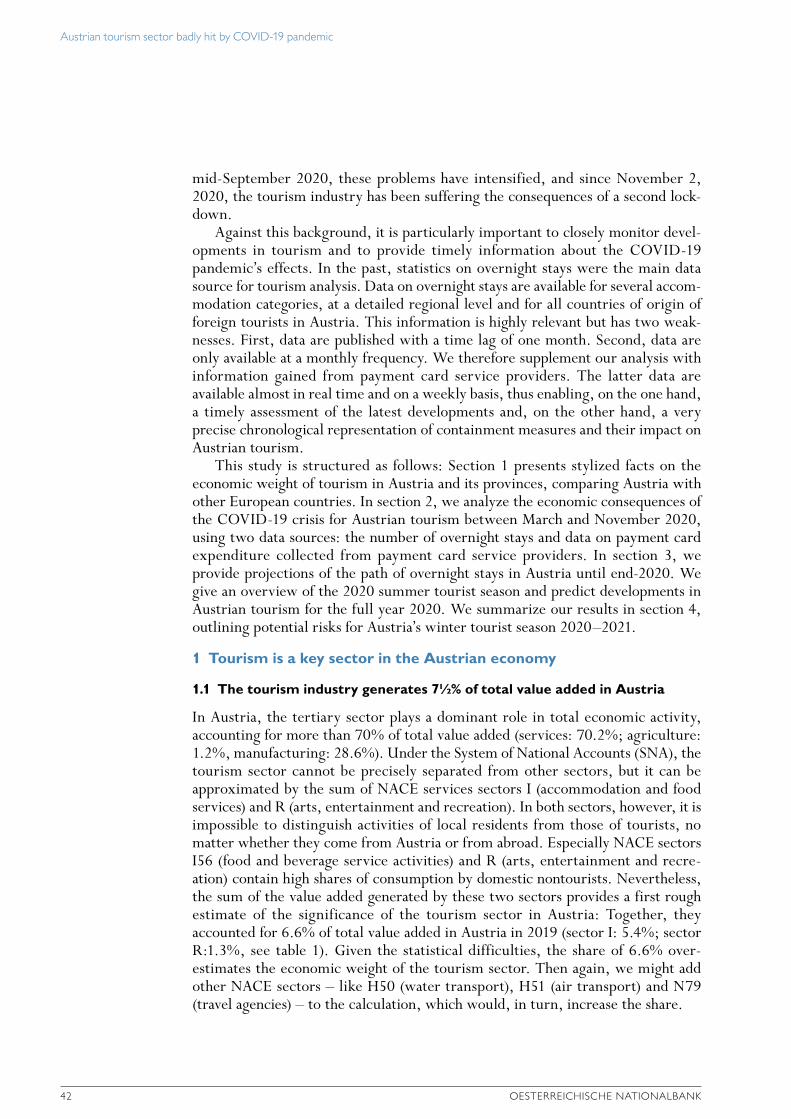
activities) – despite the above-mentioned drawbacks of this data source. The left-hand panels of chart 2 show the shares the individual provinces have in total Austrian tourism (top row: share in value added; bottom row: share in employment). The right-hand panel of chart 2 shows the relative importance tourism has in each province (top row: relative importance for total value added per province; bottom row: relative importance for employment).
The largest contributions to Austria’s tourism come from Tyrol and Vienna. Measured by their share in value-added generated by NACE sector I in Austria, Tyrol ranks first, followed by Vienna. This ranking is reversed when we look at employment shares. The employment share of tourism is higher than the value- added share in Vienna, which reflects the fact that food service activities, which are more employment intensive, are of higher economic importance in Vienna than in Tyrol.
What is more useful in measuring the economic importance of tourism in Austrian regions is its share in value added or in employment (see chart 2, right-hand panel). According to both criteria, Tyrol has the largest tourism sector, with tourism accounting for a share of 15% in value added and of 13% in employment. Salzburg, Vorarlberg, Carinthia and Burgenland follow. Vienna, Styria, Lower Austria and Upper Austria are all below the Austrian average. In addition to the mere size of the tourism sector, other factors are also significant for assessing its vulnerability in the current crisis. For instance, the COVID-19 crisis affected cities and regions with a high proportion of tourists from distant countries with particular strength, as we show in section 2. Vienna’s tourism, in particular, is additionally affected by the COVID-19 crisis as several major international confer-ences had to be canceled.
1.3 Economic importance of Austrian tourism industry above EU average
The economic importance of the tourism sector varies substantially across Euro-pean countries. A comprehensive comparison is difficult as comparable data for all European countries are not available. Chart 3 shows the results of the available TSAs, more specifically internal tourism consumption (sum of domestic and inbound (foreign) tourist expenditure) as a proportion of domestic supply (as measured in gross production value). Overall, the results have to be interpreted with caution as, on the one hand, survey years differ significantly across countries, ranging from 2010 (Malta) to 2018 (Netherlands), and, on the other hand, different methods or definitions were used in the calculations (see Eurostat, 2019). Bearing this in mind, we find that the economic importance of the tourism industry in Austria is above the EU average (see chart 3).
% %
Share in value added Share in value added per province
16
14
12
10
8
6
4
2
0
16
14
12
10
8
6
4
2
0
Economic importance of accommodation and food service activities (NACE I) for Austria’s provinces, 2018
Chart 2
Source: Statistics Austria.
Note: T: Tyrol; V: Vienna; Sz: Salzburg; St: Styria; LA: Lower Austria; UA: Upper Austria; K: Carinthia; Vb: Vorarlberg; B: Burgenland; AT: Austria.
Tyrol
Vienna
Sz
St
LA
UA
K
VbB
T Sz Vb K B AT St V LA UA
% %
Share in employment Share in employment per province
Vienna
Tyrol
LASt
Sz
UA
KVb
B
T Sz K Vb B AT V St LA UA
sector’s share of 7.3% in Austrian GDP implies that foreign tourist expenses account for about 4% of Austrian GDP, while domestic tourist expenses account for just above 3%. By comparison, foreign tourists have a 74% share in total overnight stays in Austria, while domestic tourists account for 26% (see table A1 in the annex). This, in turn, implies that day trips play a major role in domestic tourism.
1.2 Significance of tourism in Austria differs widely across regions
The tourism sector’s share in economic activity varies across Austria’s provinces. The first best method to evaluate these differences would be based on regional TSAs. By mid-2021, Statistics Austria will, for the first time, produce consistent regional TSAs for all Austrian provinces (except Vorarlberg). For the time being, we compare the role of tourism in Austria’s provinces on the basis of the share in value added and employment of NACE sector I (accommodation and food service
Austrian tourism sector badly hit by COVID-19 pandemic
MONETARY POLICY & THE ECONOMY Q4/20 – Q1/21 45
activities) – despite the above-mentioned drawbacks of this data source. The left-hand panels of chart 2 show the shares the individual provinces have in total Austrian tourism (top row: share in value added; bottom row: share in employment). The right-hand panel of chart 2 shows the relative importance tourism has in each province (top row: relative importance for total value added per province; bottom row: relative importance for employment).
The largest contributions to Austria’s tourism come from Tyrol and Vienna. Measured by their share in value-added generated by NACE sector I in Austria, Tyrol ranks first, followed by Vienna. This ranking is reversed when we look at employment shares. The employment share of tourism is higher than the value- added share in Vienna, which reflects the fact that food service activities, which are more employment intensive, are of higher economic importance in Vienna than in Tyrol.
What is more useful in measuring the economic importance of tourism in Austrian regions is its share in value added or in employment (see chart 2, right-hand panel). According to both criteria, Tyrol has the largest tourism sector, with tourism accounting for a share of 15% in value added and of 13% in employment. Salzburg, Vorarlberg, Carinthia and Burgenland follow. Vienna, Styria, Lower Austria and Upper Austria are all below the Austrian average. In addition to the mere size of the tourism sector, other factors are also significant for assessing its vulnerability in the current crisis. For instance, the COVID-19 crisis affected cities and regions with a high proportion of tourists from distant countries with particular strength, as we show in section 2. Vienna’s tourism, in particular, is additionally affected by the COVID-19 crisis as several major international confer-ences had to be canceled.
1.3 Economic importance of Austrian tourism industry above EU average
The economic importance of the tourism sector varies substantially across Euro-pean countries. A comprehensive comparison is difficult as comparable data for all European countries are not available. Chart 3 shows the results of the available TSAs, more specifically internal tourism consumption (sum of domestic and inbound (foreign) tourist expenditure) as a proportion of domestic supply (as measured in gross production value). Overall, the results have to be interpreted with caution as, on the one hand, survey years differ significantly across countries, ranging from 2010 (Malta) to 2018 (Netherlands), and, on the other hand, different methods or definitions were used in the calculations (see Eurostat, 2019). Bearing this in mind, we find that the economic importance of the tourism industry in Austria is above the EU average (see chart 3).
% %
Share in value added Share in value added per province
16
14
12
10
8
6
4
2
0
16
14
12
10
8
6
4
2
0
Economic importance of accommodation and food service activities (NACE I) for Austria’s provinces, 2018
Chart 2
Source: Statistics Austria.
Note: T: Tyrol; V: Vienna; Sz: Salzburg; St: Styria; LA: Lower Austria; UA: Upper Austria; K: Carinthia; Vb: Vorarlberg; B: Burgenland; AT: Austria.
Tyrol
Vienna
Sz
St
LA
UA
K
VbB
T Sz Vb K B AT St V LA UA
% %
Share in employment Share in employment per province
Vienna
Tyrol
LASt
Sz
UA
KVb
B
T Sz K Vb B AT V St LA UA

Austrian tourism sector badly hit by COVID-19 pandemic
46 OESTERREICHISCHE NATIONALBANK
In addition, chart A1 in the annex illustrates the economic importance of NACE sector I (accommodation and food service activities) for value added, employ-ment and hours worked in a comparison of European countries. The corresponding data are available for all EU countries, confirming the above assessment and in particular the fact that, by international standards, the tourism sector makes an above-average contribution to economic activity in Austria.
2 COVID-19 lockdown severely affected Austrian tourismThe measures taken to contain the COVID-19 pandemic have hit the tourism industry, like many other sectors of the economy, on both the supply and the demand side. Border controls and strict entry rules, quarantine regulations and the closing of accommodation establishments and restaurants are among the major supply-side shocks. The reduced demand for holiday travel given the risk of infec-tion as well as the severe economic downturn are the most important demand-side shocks.
Our analysis of the economic impact of the COVID-19 crisis on Austrian tourism rests upon two data sources: first, the number of overnight stays as reported by Statistics Austria and second, data collected from payment card service providers on expenditure on accommodation and other tourism-related goods and services. Data on the number of overnight stays are available on a monthly basis up to and including September 2020; advance information for some (sub)categories is already available for October 2020. These data comprise information on overnight stays broken down by Austrian provinces and by accommodation categories. In both cases, a cross-classification according to tourists’ countries of origin is avail-able as well. In contrast, data collected from payment card service providers are
%
10
9
8
7
6
5
4
3
2
1
0HR MT PT ES AT NL IT EE UK SI DE BGEU-28 SWLV FI RO CH NO DK LT HU SK CZ BE PO
Tourism satellite account: internal tourism consumption (at purchasers’ prices) as a proportion of domestic supply
Chart 3
Source: Eurostat.
Note: Internal tourism consumption combines domestic and inbound (foreign) tourist expenditure. Both internal tourism consumption and domestic supply are recorded as gross production values and hence deviate from figures in table 1, which are in value-added terms.

Austrian tourism sector badly hit by COVID-19 pandemic
MONETARY POLICY & THE ECONOMY Q4/20 – Q1/21 47
available on a weekly basis up to and including end-November 2020 and include information on expenditure by Austrian residents and nonresidents for several consumption categories. In our analysis, we focus on payment card expenditure on accommodation (including hotels, holiday homes, private rooms, campsites, recreation facilities and other accommodation) to ensure comparability with infor-mation about overnight stays. The payment card data considered here cover almost the entire turnover of card transactions in Austria. Moreover, one provider with a substantial market share provides detailed information on the country of origin of cards used in Austria. The prompt availability of these data enables us to analyze changes in the tourism sector almost in real time.5
As shown in table 2 and chart A2 in the annex, overnight stays and payment card expenditure on accommodation have followed a very similar course during the COVID-19 crisis. In April 2020, during the first lockdown in Austria, both indicators dropped by almost 100%. For the weeks and months after the lock-down, payment card data show a stronger recovery than overnight stays, especially with regard to domestic tourists. The shift in consumer preferences toward cash-less means of payment (Fenz and Stix, 2020) seems to be the main reason for these differences.6 In the following sections, we will use both data sources to describe in detail the developments in Austrian tourism during the COVID-19 crisis and to give an outlook for the remaining months of 2020.
5 Expenditure by foreign tourists in Austria includes all expenditure made using payment cards issued abroad. Card holders may also be resident in Austria, however. Moreover, we analyze only payment card transactions and cash withdrawals that are physically made in Austria (i.e. face-to-face transactions). Our analysis does not cover bank transfers, e-commerce payments and the import of currencies.
6 Two more reasons may help explain the different growth rates of overnight stays and payment card expenditure. First, overnight stays are a real-term variable while payment card expenditure is measured in nominal terms. The inflation rate for accommodation services remained surprisingly high during the COVID-19 crisis. Second, an “av-erage expenditure effect” might come into play in the sense that tourist in 2020 spent more than tourist in 2019, on average. The size and even the sign of this effect, however, is ambiguous.
Table 2
Overnight stays and payment card expenditure for hotels in Austria
Overnight stays Payment card expenditure for accommodation establishments
Total Foreign tourists Domestic tourists Total Foreign tourists Domestic tourists
Annual change in %
January 2020 5.8 6.2 4.3 8.8 9.9 7.6 February 2020 10.5 13.3 –0.0 20.6 27.2 8.7 March 2020 –58.6 –59.4 –55.5 –59.0 –57.9 –54.5 April 2020 –97.0 –98.3 –93.8 –100.0 –100.0 –97.4 May 2020 –89.7 –95.9 –80.1 –93.4 –98.0 –83.0 June 2020 –58.4 –73.7 –23.4 –52.3 –70.5 5.7 July 2020 –17.0 –28.4 15.9 –8.2 –20.2 50.0 August 2020 –10.9 –23.3 23.2 –4.4 –16.2 47.0 September 2020 –13.4 –25.7 14.8 –3.3 –14.8 48.9 October 2020 –49.3 –66.8 –13.7 –47.5 –67.4 2.9 November 2020 x x x –85.8 –93.2 –72.3
Source: Statistics Austria, payment card service providers, OeNB.
Note: x = data not available yet.

Austrian tourism sector badly hit by COVID-19 pandemic
48 OESTERREICHISCHE NATIONALBANK
2.1 First COVID-19-induced lockdown hits Austrian tourism in the off-season
As payment card data on travel expenses are available on a weekly basis, they allow for a very precise chronological representation of the containment measures and their impact on the tourism sector in Austria. Following the lockdown imposed on March 16, 2020 (calendar week 12), card payments by foreign tourists fell by 100%, those by Austrian residents by almost 100%. With the reopening of accom-modation establishments on May 29, 2020, payment card spending by residents recovered quickly and soon exceeded 2019 levels. This trend was supported by people’s strong preference for spending their vacation in Austria and not abroad and by a shift toward cashless means of payment. From June 4, 2020, onward, borders were gradually reopened, but expenses by foreign tourists in Austria recovered only slowly and did not start to rise significantly before the second half of June 2020. The sharp declines observed during the lockdown fell into the off-season: Together, the months of April and May account for only 10% of the annual number of overnight stays (see table A2 in the annex).
In the summer months of 2020, spending by foreign tourists in Austria leveled off at around 25% below the 2019 value – very much in line with the path of overnight stays. Tourist spending by residents in Austria continued to rise until mid-August and stabilized thereafter. On average, domestic tourist expenditure exceeded previous-year levels by almost 50% during the summer months of 2020 – a significantly stronger increase than that recorded for overnight stays (+20%). The travel warnings that were issued gradually for Croatia, the Balearic Islands and other countries in the first half of August 2020 had no immediate effects on tourism in Austria. From September 2020 onward, an increasing number of countries started to impose travel warnings for Austria, notably the major countries of origin, i.e. Germany, the Netherlands and Switzerland (see table 2). The signifi-cant and sudden decline, against 2019, of expenditure by foreign tourists by 60%
Annual change in %
Calendar week
75
50
25
0
–25
–50
–75
–100
Tourists’ payment card expenditure in Austria
Chart 4
Source: Payment card service providers, authors’ calculations.
Expenditure by foreign tourists in Austria: accommodation and restaurantsExpenditure by Austrian residents: accommodation
4 8 12 16 20 24 28 32 36 40 44 48
1 2 3 4 5 6 7
Note: 1: lockdown in Austria (March 16, 2020), 2: reopening of hotels (May 29, 2020), 3: gradual reopnening of international borders (June 4, 2020), 4: travel warning (Croatia, Balearic Islands gradually from August 8, 2020), 5: travel warnings for Austria (starting September 16, 2020), 6: lockdown light in Austria (November 2, 2020), 7: lockdown in Austria (November 17, 2020).

Austrian tourism sector badly hit by COVID-19 pandemic
MONETARY POLICY & THE ECONOMY Q4/20 – Q1/21 49
in early October 2020 is a direct result of these travel warnings. Moreover, also domestic tourist spending declined to 2019 levels as a result of the renewed increase in the number of COVID-19 infections. The Austrian government imposed a second lockdown from November 2, 2020, onward. Until November 16, 2020, a “lockdown light” was in place, and after that, restrictions similar to those seen in March 2020 have applied and will remain in force until December 7, 2020. Accommodation establishments and restaurants were already closed in early November and will remain closed at least until early January 2021.
Consequently, the related expenditure by both domestic and foreign tourists dropped by around 90%, again, in the second week of November 2020. Like the months of the first lockdown in spring 2020, October, November and the weeks of December until Christmas are off-season months in Austrian tourism, with a common share of around 10% in the annual number of overnight stays (see table A2 in the annex). However, the peak winter season starts with the Christmas holidays. The seven weeks with the highest turnover in domestic tourism in terms of payment card expenditure fell into the first three months of 2019; the week with the highest tourism turnover in the entire year 2019 was the first week of January. This leads us to expect high risks to winter tourism developments in the next few weeks and months and, hence, to Austria’s entire winter tourist season in 2021.
2.2 German tourist expenditure limited losses in Austrian tourism during the summer
In the summer months of July and August 2020, expenses and overnight stays by foreign tourists in Austria recovered from the massive losses recorded during the lockdown in spring. From an economic point of view, this was clearly good news; from a medical perspective however, several experts had been warning, as early as in summer, of the increasing probability of a second wave of COVID-19 infections in the fall. To limit inappropriate behavior, local restrictions were imposed in some tourist hotspots; nevertheless, as the rising numbers of COVID-19 infections have shown, these measures did not prove sufficient to effectively prevent a second wave and a second lockdown in the fall.
Focusing on the economic aspects of the pandemic we continue to analyze the effects on the tourism industry. As payment data are not only available at a weekly frequency but also according to a detailed list of countries of origin, we use these data to analyze which countries triggered the recovery over the summer of 2020. Moreover, the real-time nature of our payment card data also allows for a first assessment of the drivers of the second slump in Austrian tourism, which started in October 2020, as well as of the effects of the November lockdown.
The recovery observed after the lockdown in spring was mainly related to tourists from Germany. Payment card expenditure by German tourists in Austria during the summer months of July and August 2020 even exceeded that recorded in 2019 by almost 20%, while overnight stays by German tourists in Austrian accommodation facilities reached 2019 levels. Again, the shift to cashless means of payment and a change in the spending behavior of tourists (see footnote 6) are likely to be the main reasons for this difference. The Austrian tourism sector benefited from the country’s geographical proximity to Germany, which is by far the most important country of origin of incoming foreign tourists. Nevertheless,

Austrian tourism sector badly hit by COVID-19 pandemic
50 OESTERREICHISCHE NATIONALBANK
the positive trend observed in expenses by incoming German tourists could not compensate for the losses recorded in expenses by incoming tourists from most other countries. In October, again, the decline in expenses by German tourists was found to be mainly responsible for the overall steep decline in tourist spending.
Other than that, an increase in payment card expenditure was only recorded for Dutch and Swiss tourists in Austria in some weeks between July and September, and it was smaller than the figure recorded for German tourists. Expenses by tourists from other European countries, by contrast, declined by between 13% to 55%, and expenses by tourists from overseas destinations like the USA or Asia, who can only travel to Austria by air, went down by more than 90%. These changes are rather similar to what we observe in monthly overnight stays (see chart A3 in the annex).
Since the summer, the Austrian tourism sector has seen a second slump, which happened in two steps, the first one materializing at the end of September and the beginning of October and the second one in early November 2020. For a more detailed analysis of the latest developments, see section 3.
2.3 Tourism activity in the Austrian provinces and breakdown by accommodation categories
To analyze tourism sector activity at the regional level and in a breakdown by accommodation categories, we use data on overnight stays published by Statistics Austria, as such detailed information is not available on payment card expenditure. According to these data, after rising by 10½% in February 2020, the number of overnight stays in Austria fell by almost 60% in March, by 97% in April and by 90% in May. In June 2020, the situation started to improve, supported in particular by overnight stays by domestic and German tourists, and it continued to improve in July and August 2020. Chart 6 and chart 7 show the growth rates of overnight
Growth contributions of countries in percentage points; annual change in %
Calendar week
40
20
0
–20
–40
–60
–80
–100
–120
Foreign tourists’ payment card expenditure in Austrian accommodation establishments in 2020, by country of orgin
Chart 5
Source: Payment card service providers, authors’ caluclations.
Belgium Switzerland China Czech RepublicNetherlands Poland U.S.A. Other
Germany United Kingdom Hungary ItalyTotal
4 8 12 16 20 24 28 32 36 40 44 48

Austrian tourism sector badly hit by COVID-19 pandemic
MONETARY POLICY & THE ECONOMY Q4/20 – Q1/21 51
stays in Austria from January to October 2020 and the contributions to these growth rates stemming from both the Austrian provinces and the different accom-modation categories.
As accommodation establishments were, in fact, closed from mid-March to end-May 2020, overnight stays declined by almost 100% in this period. The contributions to this decline both by the Austrian provinces and by accommodation categories just reflect their relative importance for the tourism sector. Around 50% of the Austria-wide decline was attributable to the decline in overnight stays observed in Tyrol and Vienna in March and April 2020; in May, Vienna’s negative growth contribution exceeded that of Tyrol. Negative contributions from Salzburg were the third-largest at more than 10 percentage points on average. The sector started to recover in the course of June but recovery was uneven across Austria’s provinces. As cities continued to suffer in particular, the province of Vienna made the biggest contribution to the drop in overnight stays in Austria in July and August 2020. In September, overnight stays and their contributions were almost unchanged from August; Burgenland, Carinthia and Styria even posted small gains compared to September 2019. Recording growth contributions of –18 percentage points and –16 percentage points, respectively, Tyrol and Vienna accounted for as much as two-thirds of the overall decline in overnight stays recorded in October 2020 as a result of the travel warnings.
With regard to hotel categories, the comparatively high importance of three-, four- and five-star hotels is evident. On average, these categories account for almost two-thirds of the overall decline in overnight stays in the months from March to August 2020. Our breakdown also shows that all hotel categories recorded above-average declines, while holiday homes and campsites even posted a slight increase in overnight stays in August and September 2020 compared to 2019 levels. Almost half of the setback observed in October 2020 (–49% compared to October 2019) is attributable to five-and/or four-star accommodation establishments (23 percentage points).

Austrian tourism sector badly hit by COVID-19 pandemic
52 OESTERREICHISCHE NATIONALBANK
Following a global trend, city tourism – in Vienna in particular – has been strongly affected by the COVID-19 crisis for several reasons: First, many tourists used to come to Vienna by airplane, and so far, most tourists have avoided traveling by air. Second, tourism in Vienna is characterized by a high share of overseas tourists. Active travel restrictions from several overseas regions thus exert additional pressure on Viennese tourism. Third, the COVID-19 pandemic put a halt to international conference tourism, and this branch had gained great importance in Vienna over the past years. Finally, because of the COVID-19 pandemic, demand for city trips has gone down when compared to that for other travel destinations. Naturally, the focus of city trips is rather on indoor activities such as visiting museums and cultural events or shopping, which all have become less attractive in times when (strict) containment measures are in place, being perceived as entailing a higher risk of infection. These factors are also reflected in the change in over-night stays in Vienna, as compared to the rest of Austria, since the start of the COVID-19 crisis. While in Austria as a whole, the number of overnight stays by domestic tourists increased in July and August 2020, numbers remained below 2019 levels in Vienna. Vienna saw an above-average number of overseas tourists in 2019 when compared to the rest of Austria; overseas tourists are still almost completely absent this year. In contrast, the proportion of German tourists who visited Vienna in 2019 was below the Austrian average. Consequently, Vienna could not benefit from the rise in the number of German tourists during the 2020 summer tourist season as other regions in Austria did. Overall, this led overnight stays in Vienna to decline by just over 70% in the summer months – by substan-
Annual growth in %; growth contribution in percentage points
20
10
0
–10
–20
–30
–40
–50
–60
–70
–80
–90
–100Nov. 19 Dec. 19 Jan. 20 Feb. 20 Mar. 20 Apr. 20 May 20 June 20 July 20 Aug. 20 Sep. 20 Oct. 20
Number of overnight stays in Austria by accommodation category
Chart 7
Source: Statistics Austria.
Five-/Four-star accommodation establishments Three-star accommodation establishmentsTwo-/One-star accommodation establishments Holiday homes (commercial)Holiday homes (private) Private roomsCampsites Recreation facilitiesOther accommodation establishments Total
Annual change in %; growth contributions in percentage points
20
10
0
–10
–20
–30
–40
–50
–60
–70
–80
–90
–100Nov. 19 Jan. 20 Mar. 20 July 20May 20 Sep. 20
Number of overnight stays in Austria
Chart 6
Source: Statistics Austria.
Burgenland Vienna Lower AustriaUpper Austria Styria Salzburg
Carinthia Vorarlberg TyrolAustria

Austrian tourism sector badly hit by COVID-19 pandemic
MONETARY POLICY & THE ECONOMY Q4/20 – Q1/21 53
tially more than in Austria a whole (–14%). Another factor is the composition of accommodation establishments in Vienna, which features an above-average share of hotels, and hotels have an even bigger share in the overall loss than other accom-modation facilities, which are more common in the other provinces. Between March and September 2020, 79% of the decline observed in overnight stays in Vienna, on average, were attributable to three-, four- and five-star hotels; in October 2020, this accommodation category accounted for as much as 93 percent-age points of the overall 85% loss in overnight stays in Vienna.
2.4 Central European countries such as Germany, Slovenia and Austria recorded smaller decline in overnight stays than Southern European countries in summer 2020
Tourism has been strongly affected by the COVID-19 pandemic in almost all European countries. Many Southern European countries, in particular, strongly rely on tourism and suffered huge drops in overnight stays, as shown in chart 8 for July and August 2020. Travel restrictions and the respective tourism sector’s dependence on international flights had a stronger negative effect in countries on Europe’s southern periphery. Moreover, some Southern European countries, like Spain and Italy, were among those with the highest numbers of COVID-19 infec-tions.
Following a global trend, city tourism – in Vienna in particular – has been strongly affected by the COVID-19 crisis for several reasons: First, many tourists used to come to Vienna by airplane, and so far, most tourists have avoided traveling by air. Second, tourism in Vienna is characterized by a high share of overseas tourists. Active travel restrictions from several overseas regions thus exert additional pressure on Viennese tourism. Third, the COVID-19 pandemic put a halt to international conference tourism, and this branch had gained great importance in Vienna over the past years. Finally, because of the COVID-19 pandemic, demand for city trips has gone down when compared to that for other travel destinations. Naturally, the focus of city trips is rather on indoor activities such as visiting museums and cultural events or shopping, which all have become less attractive in times when (strict) containment measures are in place, being perceived as entailing a higher risk of infection. These factors are also reflected in the change in over-night stays in Vienna, as compared to the rest of Austria, since the start of the COVID-19 crisis. While in Austria as a whole, the number of overnight stays by domestic tourists increased in July and August 2020, numbers remained below 2019 levels in Vienna. Vienna saw an above-average number of overseas tourists in 2019 when compared to the rest of Austria; overseas tourists are still almost completely absent this year. In contrast, the proportion of German tourists who visited Vienna in 2019 was below the Austrian average. Consequently, Vienna could not benefit from the rise in the number of German tourists during the 2020 summer tourist season as other regions in Austria did. Overall, this led overnight stays in Vienna to decline by just over 70% in the summer months – by substan-
Annual growth in %; growth contribution in percentage points
20
10
0
–10
–20
–30
–40
–50
–60
–70
–80
–90
–100Nov. 19 Dec. 19 Jan. 20 Feb. 20 Mar. 20 Apr. 20 May 20 June 20 July 20 Aug. 20 Sep. 20 Oct. 20
Number of overnight stays in Austria by accommodation category
Chart 7
Source: Statistics Austria.
Five-/Four-star accommodation establishments Three-star accommodation establishmentsTwo-/One-star accommodation establishments Holiday homes (commercial)Holiday homes (private) Private roomsCampsites Recreation facilitiesOther accommodation establishments Total

Austrian tourism sector badly hit by COVID-19 pandemic
54 OESTERREICHISCHE NATIONALBANK
Given Austria’s central position in Europe, which enables many European tourists to travel to Austria by car, and the low number of COVID-19 infections registered during the summer, Austria’s tourism recovered comparatively well over the summer months, although it still recorded a decline in overnight stays. The Netherlands are the only EU country that, overall, recorded a small increase in overnights stays in July and August 2020, compared to July and August 2019.
3 Travel warnings caused a second steep decline in overnight staysThe number of COVID-19 infections in Europe fell to low levels after the first wave of the pandemic was contained in spring 2020 and remained low during the summer. However, the number of positive COVID-19 cases started to rise already back in June 2020, but initially at such a low pace that it was not recognized accordingly. In October 2020, the rise in positive cases accelerated significantly in most European countries (see chart 9). A second wave of COVID-19 infections was also recorded in Austria. The number of new COVID-19 infections had also been increasing since the early summer but again, at a very low initial pace. While in the first week of October 2020, the seven-day incidence in Austria stood at 43 newly infected persons per 100,000 inhabitants, it reached the 100 person threshold on October 18, 2020, and stood at 278 by end-October. In the first two weeks of November, it sharply increased again, peaking at 592 on November 14, 2020.7 This rise went hand in hand with a growing number of hospitalizations, stronger need for intensive care and, lately, also with higher numbers of people dying while infected with COVID-19. In Belgium, the Czech Republic, Switzerland or France, even steeper rises and higher numbers were recorded. Germany, by contrast, has so far managed to prevent a similarly steep increase, with the seven-day incidence coming to 155 at end-November.
7 Source: European Centre for Disease Prevention and Control (ECDC).
Annual change in July and August 2020 in %
10
0
–10
–20
–30
–40
–50
–60
–70
–80EL MT ES PT BG HR RO HU IT LU EE SW LV FI BE SK DE SI CZAT DK NL
Overnight stays in EU countries
Chart 8
Source: Eurostat.
Number of persons
1,000
900
800
700
600
500
400
300
200
100
0Mar. 20 Apr. 20 May 20 June 20 July 20 Aug. 20 Sep. 20 Oct. 20 Nov. 20 Dec. 20
New COVID-19 infections per 100,000 inhabitants – seven-day incidence
Chart 9
Source: European Centre for Disease Prevention and Control.
Note: Red: Austria; blue: Belgium, Croatia, the Czech Republic, Denmark, Finland, France, Germany, Greece, Hungary, Italy, Netherlands, Portugal, Serbia, Slovakia, Slovenia, Spain, Sweden, Switzerland, UK; grey: Brazil, China, India, Israel, Japan, USA.

Austrian tourism sector badly hit by COVID-19 pandemic
MONETARY POLICY & THE ECONOMY Q4/20 – Q1/21 55
In reaction to the renewed rise in the number of COVID-19 infections, all European countries have implemented new containment measures. These measures often started out at the regional level, and part of the respective containment strategies was the issuance of travel warnings (see table 2 for travel warnings for Austria). When travel warnings are in place, travelers would typically have to present either a negative COVID-19 test (which should not be older than 48 hours) and/or would have to observe self-quarantine for several days upon their return. Thus, the situation for tourism turned difficult again, even though only a very small number of COVID-19 clusters in Austria were traceable to the areas of travel, accommodation and the restaurant and catering business in early October 2020.8 As described in section 2, the recent travel warnings in place for Austria, especially those issued by Germany, already led to a second slump in Austrian tourism in the first half of October 2020.
8 See https://www.ages.at/themen/krankheitserreger/coronavirus/epidemiologische-abklaerung-covid-19/ .
Given Austria’s central position in Europe, which enables many European tourists to travel to Austria by car, and the low number of COVID-19 infections registered during the summer, Austria’s tourism recovered comparatively well over the summer months, although it still recorded a decline in overnight stays. The Netherlands are the only EU country that, overall, recorded a small increase in overnights stays in July and August 2020, compared to July and August 2019.
3 Travel warnings caused a second steep decline in overnight staysThe number of COVID-19 infections in Europe fell to low levels after the first wave of the pandemic was contained in spring 2020 and remained low during the summer. However, the number of positive COVID-19 cases started to rise already back in June 2020, but initially at such a low pace that it was not recognized accordingly. In October 2020, the rise in positive cases accelerated significantly in most European countries (see chart 9). A second wave of COVID-19 infections was also recorded in Austria. The number of new COVID-19 infections had also been increasing since the early summer but again, at a very low initial pace. While in the first week of October 2020, the seven-day incidence in Austria stood at 43 newly infected persons per 100,000 inhabitants, it reached the 100 person threshold on October 18, 2020, and stood at 278 by end-October. In the first two weeks of November, it sharply increased again, peaking at 592 on November 14, 2020.7 This rise went hand in hand with a growing number of hospitalizations, stronger need for intensive care and, lately, also with higher numbers of people dying while infected with COVID-19. In Belgium, the Czech Republic, Switzerland or France, even steeper rises and higher numbers were recorded. Germany, by contrast, has so far managed to prevent a similarly steep increase, with the seven-day incidence coming to 155 at end-November.
7 Source: European Centre for Disease Prevention and Control (ECDC).
Annual change in July and August 2020 in %
10
0
–10
–20
–30
–40
–50
–60
–70
–80EL MT ES PT BG HR RO HU IT LU EE SW LV FI BE SK DE SI CZAT DK NL
Overnight stays in EU countries
Chart 8
Source: Eurostat.
Number of persons
1,000
900
800
700
600
500
400
300
200
100
0Mar. 20 Apr. 20 May 20 June 20 July 20 Aug. 20 Sep. 20 Oct. 20 Nov. 20 Dec. 20
New COVID-19 infections per 100,000 inhabitants – seven-day incidence
Chart 9
Source: European Centre for Disease Prevention and Control.
Note: Red: Austria; blue: Belgium, Croatia, the Czech Republic, Denmark, Finland, France, Germany, Greece, Hungary, Italy, Netherlands, Portugal, Serbia, Slovakia, Slovenia, Spain, Sweden, Switzerland, UK; grey: Brazil, China, India, Israel, Japan, USA.

Austrian tourism sector badly hit by COVID-19 pandemic
56 OESTERREICHISCHE NATIONALBANK
To break the steep rise in new COVID-19 infections in Austria, the Austrian government imposed a second lockdown. In a first step, starting on November 2, 2020, hotels and restau-rants were closed and all events were canceled. As Austria’s seven-day inci-dence figures went up further, the gov-ernment intensified the lockdown rules from November 17, 2020, onward by additionally closing the retail sector and schools. For the tourism industry, this further tightening did not impose any additional changes.
These intensified measures kept the number of new COVID-19 infections from rising further; at the end of No-vember 2020, the seven-day incidence in Austria stood at 362 persons (as on November 30, 2020). The payment card expenditure data for November 2020 already mirror the effects of the second lockdown. While in the first week of November, results were biased reflecting the fall holidays in Austria and Germany, from the second week of
November onward, expenditure by domestic tourists declined by almost 90% compared to the level seen last year, and expenditure by foreign tourists dropped by a little more than 95%. Unlike during the first lockdown, business trips were not prohibited during the second lockdown. This may also explain the difference in expenditure by domestic and foreign tourists. We expect that the decline will continue at the rate recorded since mid-November until the end of the second lockdown. As the Austrian government announced on December 2, 2020, accom-modation establishments in Austria will not open before January 2021; on top of that, travel warnings (including compulsory self-quarantine of at least five days for tourists returning to Germany) will remain in place at least until end-2020.
Against this background, we assess the further path of tourism in Austria up to the end of 2020. Our forecast of the course of overnight stays in Austria for November and December 2020 is based on official statistics on overnight stays up to October, on information provided by payment card service providers up to
Table 3
Travel warnings for Austria
Date Country issuing travel warning
Travel warning issued for
July 15, 2020 Norway Austria September 1, 2020 Hungary Austria September 14, 2020 Switzerland Vienna September 16, 2020 Germany Vienna September 18, 2020 Belgium Vienna September 18, 2020 Denmark Austria September 22, 2020 Netherlands Vienna, Innsbruck September 24, 2020 Germany Vorarlberg, Tyrol September 25, 2020 Belgium Vienna, Vorarlberg, Tyrol September 25, 2020 Switzerland Vienna, Lower Austria, Upper Austria,
Burgenland, Salzburg September 29, 2020 Slovenia Vienna, Vorarlberg, Tyrol October 7, 2020 Belgium Vienna, Tyrol October 7, 2020 Romania Austria October 12, 2020 Slovenia Vienna October 14, 2020 Belgium Austria, except Carinthia and Styria October 16, 2020 Netherlands Vienna, Lower Austria, Tyrol, Vorarlberg October 22, 2020 Netherlands Austria, except Burgenland, Carinthia and
Styria October 24, 2020 Germany Austria, except Carinthia October 30, 2020 Switzerland No more warnings November 1, 2020 Germany Austria November 3, 2020 Belgium Austria November 10, 2020 Slovakia Austria
Source: Authors’ compilation.

Austrian tourism sector badly hit by COVID-19 pandemic
MONETARY POLICY & THE ECONOMY Q4/20 – Q1/21 57
November 20209 and on our assump-tions regarding the loosening of lock-down measures and remaining travel warnings.10
Chart 10 shows the results of our assessment for the individual months of 2020. Additionally, table 3 shows the growth rate of overnight stays for the period from January to October and for the 2020 summer tourist season (May to October) and our estimates for November and December and for the full year 2020. Overall, we expect a decrease in overnight stays by 36.5%, compared to 2019, for the full year 2020. Overnight stays by foreign tourists will be much more strongly affected (–41.2%) than overnight stays by Austrian residents (–23.2%).
These negative results could have been even more pronounced if the two lock-downs had not fallen into the off-season. This is also true for the second lockdown – given the current outlook. November and December (until Christmas) play a
9 Given the shift in consumer preferences toward cashless means of payment, the year-on-year growth rate of payment card expenditure in October 2020 exceeded the growth of overnight stays by 17 percentage points (see table 2). Correcting for this factor, and inducing some additional judgment as the present data overestimate developments in the first week of November ( fall holidays), we expect overnight stays to decline by 90% for domestic tourists and by 95% for foreign tourists.
10 Based on the rules announced by the Austrian government on December 2, 2020, Austrian accommodation establishments will not open before January 2021. Therefore, we expect overnight stays by domestic and foreign tourists to decline by 95% in December 2020 compared to December 2019. We assume that the number of over-night stays will not decline by 100% as business trips continue to be allowed. We also expect a certain number of overnight stays by professional athletes and their support teams.
Annual change in % Million overnight stays
40
20
0
–20
–40
–60
–80
–100
21
18
15
12
9
6
3
0Jan. Feb. Mar. Apr. May June July Aug. Sep. Oct. Dec.Nov.
Forecast of overnight stays in Austria in 2020
Chart 10
Source: Statistics Austria, payment card service providers, OeNB.
Overnight stays including forecast for November to December Total Domestic tourists Foreign tourists
Note: Until October: Data on overnight stays as published by Statistics Austria, November to December: OeNB forecast based on data collected from payment card providers.
Table 4
Forecast of overnight stays in Austria in 2020
Total Domestic tourists
Foreign tourists
German tourists
Annual change in %
January to October –29.2 –12.7 –35.0 –25.9 Summer tourist season –32.3 –3.2 –44.5 –28.1 Forecast forNovember –92.8 –90.0 –95.0 –95.0 December –95.0 –95.0 –95.0 –95.0
Full-year 2020 –36.5 –23.2 –41.2 –31.8
Source: Statistics Austria, payment card service providers, OeNB.
Note: Until October: Statistics Austria; from November: forecast based on data collected from payment card providers.

Austrian tourism sector badly hit by COVID-19 pandemic
58 OESTERREICHISCHE NATIONALBANK
comparatively smaller role in Austrian tourism. November accounts for only 3,5% of overnight stays in a typical year (see table A2 in the annex). Given recent developments, our results are more pessimistic than the estimates by Fritz (2020), who, in a preliminary assessment of the 2020 summer tourist season, expected a 15% decline in domestic and a 30% decline in foreign demand.
4 ConclusionsTourism contributes around 7½% to the Austria’s total value added; for the entire leisure industry, this value doubles. By European standards, tourism makes an above-average contribution to Austria’s economic output.
Tourism is among the economic sectors hit hardest by the COVID-19 contain-ment measures. The number of overnight stays by domestic and foreign tourists in Austria fell by almost 100% in spring 2020, when accommodation establishments were completely closed. Over the summer, tourism activity in Austria recovered, backed by domestic and German tourists. Nevertheless, overnight stays remained clearly below 2019 levels. In October 2020, the renewed increase in the number of COVID-19 infections led to new containment measures in many European countries, including travel warnings for high-risk regions. Austria was considered a high-risk country by several important countries of origin of foreign tourists, most notably Germany, the Netherlands and Switzerland. This triggered another severe downturn in Austrian tourism. With the second lockdown in place as of November 2020, overnight stays by both domestic and foreign tourists again fell by more than 90%. According to the Austrian government’s announcements of December 2, 2020, Austrian accommodation establishments will not open before January 2021. Therefore, the decline expected for November – on the basis of weekly data on payment card expenditure – can be expected to continue until year-end. Hence, for the year 2020 as a whole, we expect a drop in total overnight stays by 36.5%.
The decline in overnight stays would have been substantially stronger if the two Austrian lockdowns had not fallen into the off-season. The first lockdown was from mid-March until the end of May 2020. With the exception of the week around Easter, this period is, from a tourism perspective, mainly off peak. The second lockdown started in November 2020 and will be in place at least until early January 2021. November and early December are preseason months in Austrian tourism. The main winter tourist season starts in the week around Christmas and ends around Easter. The seven weeks with the highest turnover in domestic tourism in terms of payment card expenditure fell into this period in 2019; the week recording the highest tourism turnover in the entire year 2019 was the first week of January.
From early-January 2021 onward, supply-side constraints should slowly begin to disappear, if we assume that accommodation establishments will be allowed to reopen. Demand-side constraints, however, will persist as long as travel warnings remain in effect. From today’s perspective, the further development of the COVID-19 pandemic cannot be accurately assessed. What we can say, however, is that the drop in overnight stays by foreign tourists will be substantial in Austria. Unlike during the summer tourist season, domestic tourists will not be able to compensate for the expected decline in winter tourism. In the past winter tourist season, they accounted for only 20% of overnight stays in Austria. As for Austria,

Austrian tourism sector badly hit by COVID-19 pandemic
MONETARY POLICY & THE ECONOMY Q4/20 – Q1/21 59
the winter tourist season is more important – in terms of the number of overnight stays and tourist’s average expenditure – than the summer season in regular years. Hence, the current situation poses a key downside risk to tourism sector develop-ments in Austria.
ReferencesEurostat. 2019. Tourism Satellite Accounts in Europe. 2019 edition. November.Federal Ministry for Sustainability and Tourism. 2019. Tourismus und Freizeitwirtschaft
2018. Vienna.Fenz, G. and H. Stix. 2020. Monitoring the economy in real time with the new OeNB weekly
GDP indicator: background, experiences and outlook. Forthcoming in Monetary Policy & the Economy Q4/20–Q1/21. Oesterreichische Nationalbank.
Fritz, O. and S. Ehn-Fragner. 2020. Bericht über die Bedeutung, Entwicklung und Struktur der österreichischen Tourismuswirtschaft im Jahr 2019. WIFO. April.
Fritz, O. 2020. Tourismusanalyse Mai bis Juli 2020. Nachfrage in den ersten drei Monaten der Sommersaison auf fast die Hälfte geschrumpft. WIFO press release. September 4. https://www.wifo.ac.at/news/tourismusanalyse_mai_bis_juli_2020.

Austrian tourism sector badly hit by COVID-19 pandemic
60 OESTERREICHISCHE NATIONALBANK
Annex
%
Share of value added generated by NACE I sector in total value added1
8
6
4
2
0
%
Share of employment in NACE I sector in total employment2
12
10
8
6
4
2
0
%
Share of hours worked in NACE I sector in total hours worked3
12
10
8
6
4
2
0
Economic importance of accommodation and food service activities (NACE I), 2019
Chart A1
Souce: Eurostat.1 BE, EA-19, EU-28, LT, SE, UK: 2018; HR: 2017.2 BE, BG, EA-19, EU-28, SE: 2018.3 BE, BG, EA-19, EU-28, SE: 2018.
EL CY ES PT MT IE AT HR IT UK EA EU FR LU BG NL CZ SK EE SI DE FI SE BE HU DK LV RO LT PL
EL CY IE ES PT MT HR UK AT IT EA EU DK NL LU FR BG EE DE SK SI HU SE CZ FI LV BE LT RO PL
EL CY HR ES PT MT AT IT EA EU FR UK RO BG SI LV NL BE IE HU CZ FI SE EE LT DE LU SK DK PL

Austrian tourism sector badly hit by COVID-19 pandemic
MONETARY POLICY & THE ECONOMY Q4/20 – Q1/21 61
Annual change in %
Total
40
20
0
–20
–40
–60
–80
–100
–120
Annual change in %
Germany
40
20
0
–20
–40
–60
–80
–100
–120Jan. 20 Apr. 20 July 20 Oct. 20 Jan. 20 Apr. 20 July 20 Oct. 20
Jan. 20 Apr. 20 July 20 Oct. 20 Jan. 20 Apr. 20 July 20 Oct. 20
Jan. 20 Apr. 20 July 20 Oct. 20 Jan. 20 Apr. 20 July 20 Oct. 20
Annual change in %
Netherlands
60
40
20
0
–20
–40
–60
–80
–100
–120
Annual change in %
Switzerland
60
40
20
0
–20
–40
–60
–80
–100
–120
Annual change in %
China
60
40
20
0
–20
–40
–60
–80
–100
–120
Annual change in %
USA
20
0
–20
–40
–60
–80
–100
–120
Comparison of tourists’ payment card expenditure on accommodation and overnight stays in Austria for selected countries of origin
Chart A2
Source: Statistics Austria, payment card service providers, OeNB.
Payment card expenditure Overnight stays

Austrian tourism sector badly hit by COVID-19 pandemic
62 OESTERREICHISCHE NATIONALBANK
Annual change in %
Hungary
20
0
–20
–40
–60
–80
–100
–120
Annual change in %
UK
60
40
20
0
–20
–40
–60
–80
–100
–120Jan. 20 Apr. 20 July 20 Oct. 20 Jan. 20 Apr. 20 July 20 Oct. 20
Jan. 20 Apr. 20 July 20 Oct. 20 Jan. 20 Apr. 20 July 20 Oct. 20
Jan. 20 Apr. 20 July 20 Oct. 20 Jan. 20 Apr. 20 July 20 Oct. 20
Annual change in %
Italy
20
0
–20
–40
–60
–80
–100
–120
Annual change in %
Poland
20
0
–20
–40
–60
–80
–100
–120
Annual change in %
Czech Republic
40
20
0
–20
–40
–60
–80
–100
–120
Annual change in %
Belgium
200
150
100
50
0
–50
–100
–150
Comparison of tourists’ payment card expenditure on accommodation and overnight stays in Austria for selected countries of origin
Chart A2 continued
Source: Statistics Austria, payment card service providers, OeNB.
Payment card expenditure Overnight stays

Austrian tourism sector badly hit by COVID-19 pandemic
MONETARY POLICY & THE ECONOMY Q4/20 – Q1/21 63
Annual change in %; growth contributions in percentage points
20
0
–20
–40
–60
–80
–100Nov. 19 Dec. 19 Jan. 20 Feb. 20 Mar. 20 Apr. 20 May 20 June 20 July 20 Aug. 20 Sep. 20 Oct. 20
Overnight stays in Austria
Chart A3
Source: Statistics Austria.
Germany Netherlands France ItalyBelgium USA SwitzerlandChina Saudi Arabia Japan UKCzech Republic Poland HungarySlovakia Slovenia Rest Foreign tourists
Table A1
Monthly pattern of overnight stays in Austria in 2019
Total Domestic tourists
Foreign tourists
Total Domestic tourists
Foreign tourists
Domestic tourists
Foreign tourists
1,000 Share in figures for full-year 2019 in % Share in total in %
2019 152,709 39,944 112,765 100.0 100.0 100.0 26.2 73.8 January 2019 15,156 2,803 12,354 9.9 7.0 11.0 18.5 81.5 February 2019 17,863 3,769 14,094 11.7 9.4 12.5 21.1 78.9 March 2019 14,979 2,875 12,105 9.8 7.2 10.7 19.2 80.8 April 2019 8,277 2,393 5,883 5.4 6.0 5.2 28.9 71.1 May 2019 7,465 2,936 4,529 4.9 7.4 4.0 39.3 60.7 June 2019 12,611 3,839 8,771 8.3 9.6 7.8 30.4 69.6 July 2019 18,754 4,834 13,920 12.3 12.1 12.3 25.8 74.2 August 2019 20,195 5,402 14,793 13.2 13.5 13.1 26.7 73.3 September 2019 11,428 3,469 7,959 7.5 8.7 7.1 30.4 69.6 October 2019 8,522 2,815 5,707 5.6 7.0 5.1 33.0 67.0 November 2019 5,301 2,301 3,000 3.5 5.8 2.7 43.4 56.6 December 2019 12,158 2,508 9,650 8.0 6.3 8.6 20.6 79.4
Source: Statistics Austria, OeNB.