author: kira. yang - perkinelmer · 2017-10-03 · solvent delay 0 min function type sifi gc...
TRANSCRIPT
Introduction There has been an increase in public concern about the safety of artificial runway used to pave school playgrounds, sports stadiums and so on in China since the raw materials of artificial runway are mainly recycled tire
crumb rubber. Recycled tires may contain several substances of high concern, and the associated adhesives may also contain various volatiles, so the environmental and health compatibility of plastic track should be satisfied when it is to be used1,2. The EPA and the CDC/ATSDR are conducting a characterization of the components in tire crumb rubber including volatile organic chemicals (VOCs), semi-volatile organic chemicals (SVOCs) and heavy metal species, which is critical to quality control and understanding the potential for exposure3. Chamber testing as a method included by the EPA and the CDC/ATSDR is a qualitative method to assess the emissions of VOC in tire crumb rubber3. But the quantitation of VOC in samples can’t be determined. The determination method of VOC in raw materials of plastic and rubber sports surface is by solvent extraction-GC in many local standards in China4. This method measures the amount of VOC but it is complicated and consumes significant quantities of organic solvent.
Determination of VOC in Artificial Runway by Multiple Headspace Extraction-GC/MS
A P P L I C A T I O N N O T E
Author:
Kira. Yang
PerkinElmer, Inc. Shanghai, China
Gas Chromatography/ Mass Spectrometry
2
This application note discusses the alternative technique of, multiple headspace extraction (MHE), which is a procedure to quantify target compounds in solid or difficult matrices independent of matrix effects. The theory of MHE has been described by Kolb5-8 et al. and McAuliffe9. Using MHE, the analytes in samples and standard are extracted exhaustively. The total amount in the sample is calculated using a report template by inputting the peak area of each MHE injection, concentration and volume of standard and the sample weight in the vial. Presented in this paper is a quantitative determination of VOCs like toluene, xylene, naphthalene and some non-target compounds in artificial runway.
Experimental
A Fritsch (p-14) Mill with liquid nitrogen refrigeration was used to grind the runway sample from which approximately 0.06 g of sample powder was placed into a 20-ml headspace vial. The vial was then immediately sealed with the PTFE side of the septum facing toward the sample and placed into the PerkinElmer TurboMatrix™ HS-40 Headspace Sampler (HS). Five target compounds including toluene, o-xylene, m-xylene, p-xylene and naphthalene are discussed in this application note. Therefore, 3 µL DMF solution was added into a vial as an external standard containing 34.64 µg/mL of toluene, 1.76 µg/mL of o-xylene, 8.68 µg/mL of m-xylene, 1.03 µg/mL of p-xylene and 430 µg/mL of naphthalene. The system precision was investigated by running six identical calibration standards.
The conditions used for the PerkinElmer Clarus® SQ 8 GC/MS operating in electron ionization mode with PerkinElmer TurboMatrix HS-40 Headspace Sampler are presented in Table 1. SIFI MS mode was used which combines SIM with a full scan over a desired mass range. Table 2 shows the SIM quantitation and qualifier ions.
Results and Discussion
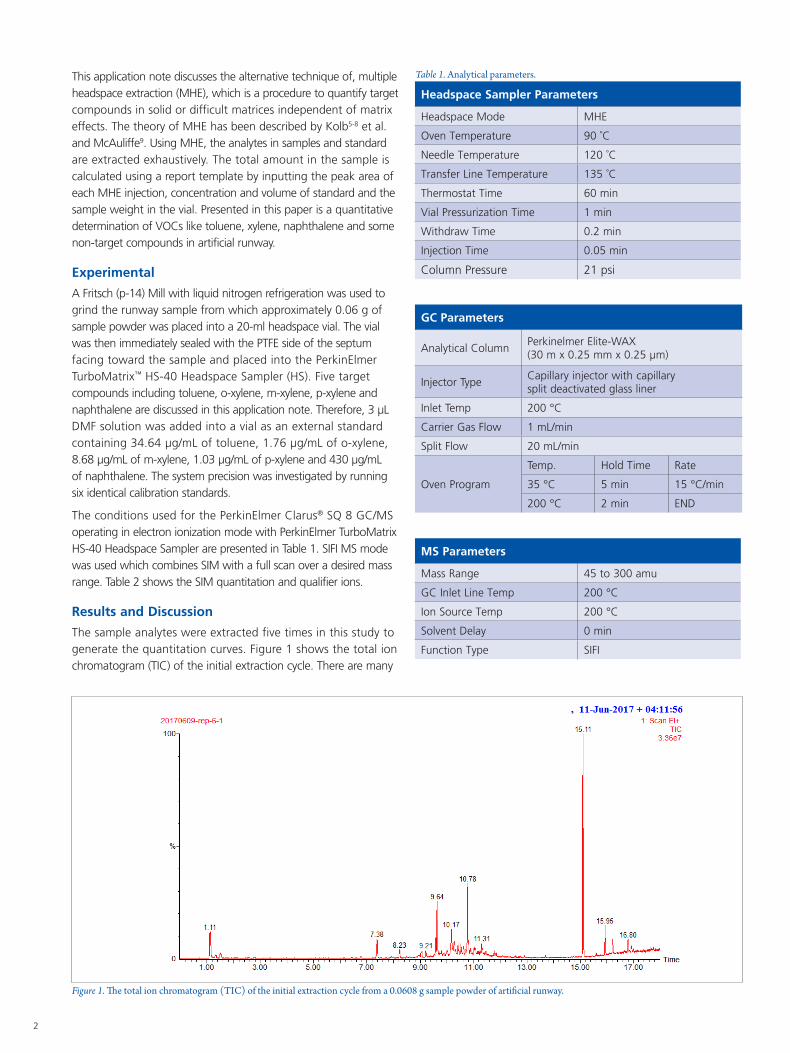
The sample analytes were extracted five times in this study to generate the quantitation curves. Figure 1 shows the total ion chromatogram (TIC) of the initial extraction cycle. There are many
Headspace Sampler Parameters
Headspace Mode MHE
Oven Temperature 90 ˚C
Needle Temperature 120 ˚C
Transfer Line Temperature 135 ˚C
Thermostat Time 60 min
Vial Pressurization Time 1 min
Withdraw Time 0.2 min
Injection Time 0.05 min
Column Pressure 21 psi
MS Parameters
Mass Range 45 to 300 amu
GC Inlet Line Temp 200 °C
Ion Source Temp 200 °C
Solvent Delay 0 min
Function Type SIFI
GC Parameters
Analytical Column Perkinelmer Elite-WAX (30 m x 0.25 mm x 0.25 μm)
Injector Type Capillary injector with capillary split deactivated glass liner
Inlet Temp 200 °C
Carrier Gas Flow 1 mL/min
Split Flow 20 mL/min
Oven Program
Temp. Hold Time Rate
35 °C 5 min 15 °C/min
200 °C 2 min END
Table 1. Analytical parameters.
Figure 1. The total ion chromatogram (TIC) of the initial extraction cycle from a 0.0608 g sample powder of artificial runway.
3
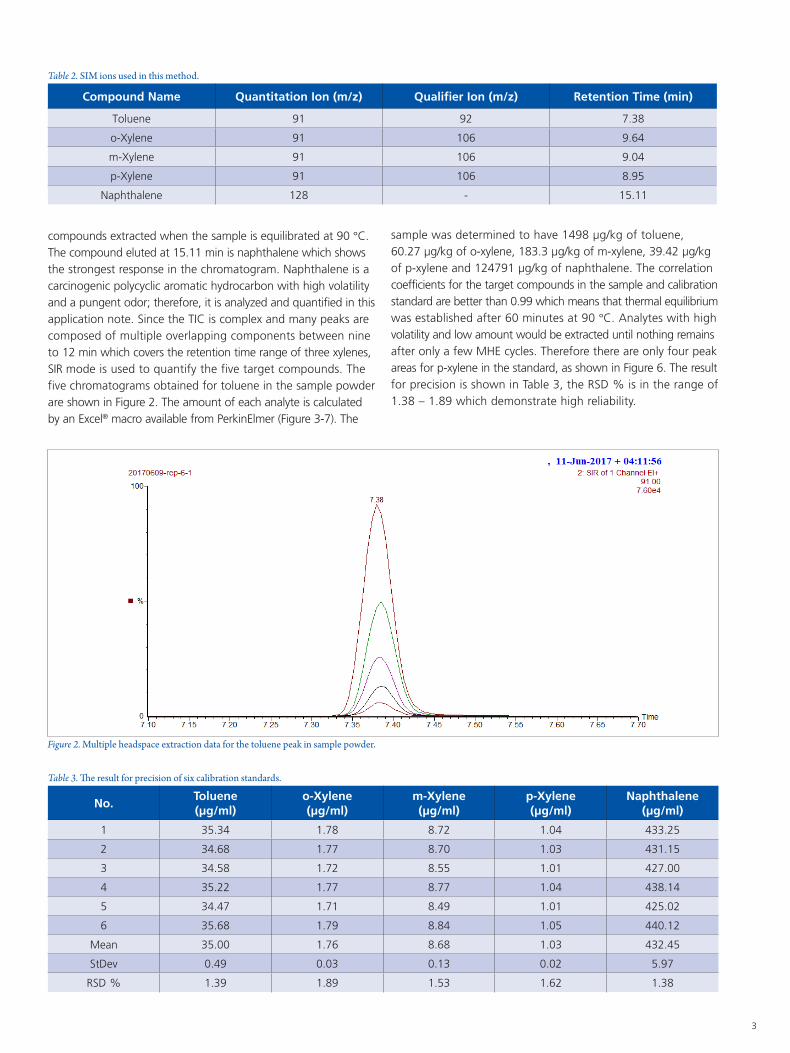
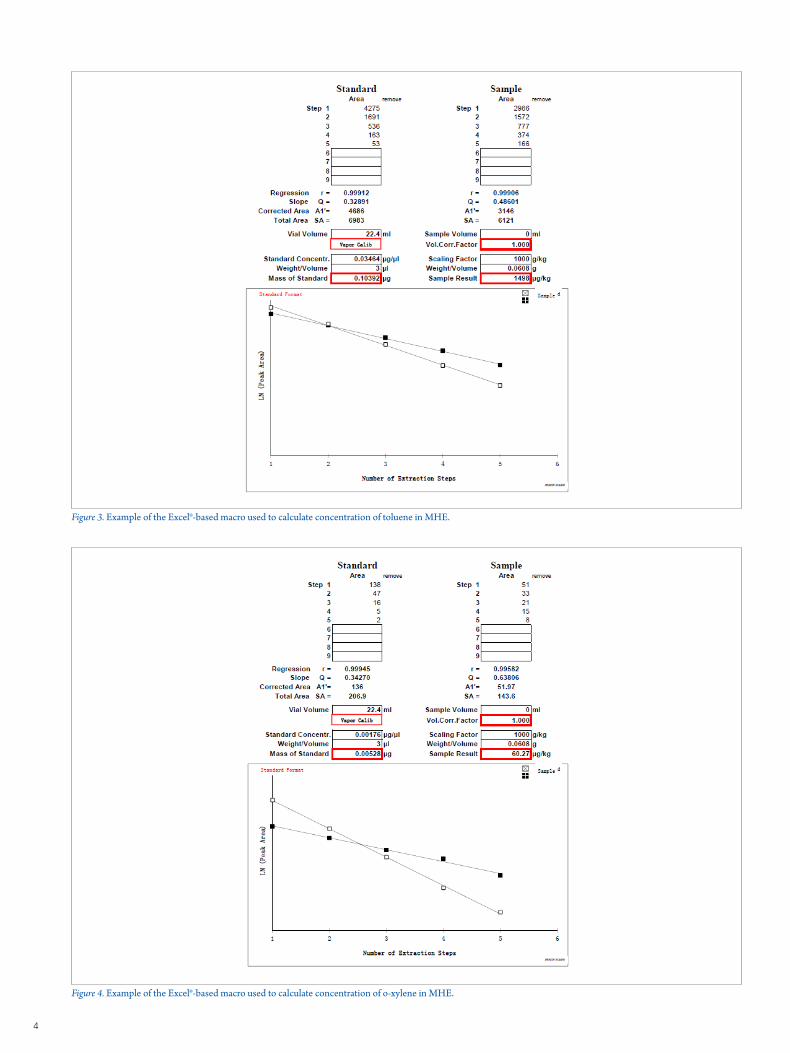
compounds extracted when the sample is equilibrated at 90 °C. The compound eluted at 15.11 min is naphthalene which shows the strongest response in the chromatogram. Naphthalene is a carcinogenic polycyclic aromatic hydrocarbon with high volatility and a pungent odor; therefore, it is analyzed and quantified in this application note. Since the TIC is complex and many peaks are composed of multiple overlapping components between nine to 12 min which covers the retention time range of three xylenes, SIR mode is used to quantify the five target compounds. The five chromatograms obtained for toluene in the sample powder are shown in Figure 2. The amount of each analyte is calculated by an Excel® macro available from PerkinElmer (Figure 3-7). The
Figure 2. Multiple headspace extraction data for the toluene peak in sample powder.
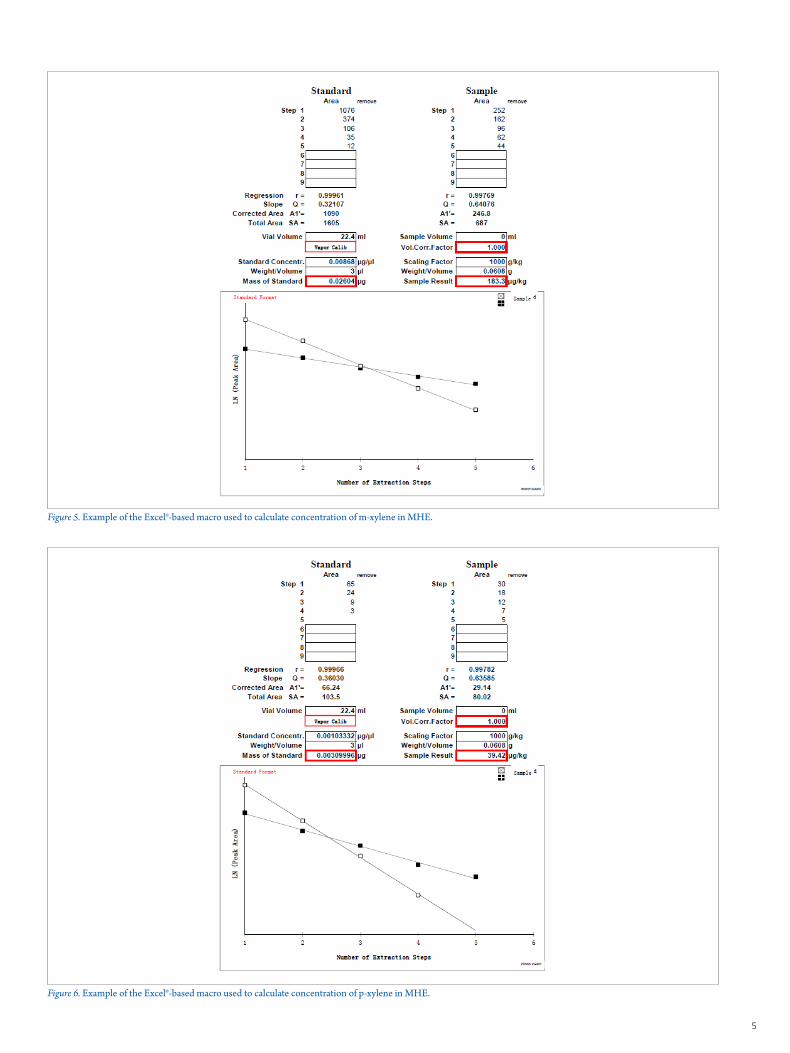
sample was determined to have 1498 µg/kg of toluene, 60.27 µg/kg of o-xylene, 183.3 µg/kg of m-xylene, 39.42 µg/kg of p-xylene and 124791 µg/kg of naphthalene. The correlation coefficients for the target compounds in the sample and calibration standard are better than 0.99 which means that thermal equilibrium was established after 60 minutes at 90 °C. Analytes with high volatility and low amount would be extracted until nothing remains after only a few MHE cycles. Therefore there are only four peak areas for p-xylene in the standard, as shown in Figure 6. The result for precision is shown in Table 3, the RSD % is in the range of 1.38 – 1.89 which demonstrate high reliability.
Compound Name Quantitation Ion (m/z) Qualifier Ion (m/z) Retention Time (min)
Toluene 91 92 7.38
o-Xylene 91 106 9.64
m-Xylene 91 106 9.04
p-Xylene 91 106 8.95
Naphthalene 128 - 15.11
Table 2. SIM ions used in this method.
No.Toluene (μg/ml)
o-Xylene (μg/ml)
m-Xylene (μg/ml)
p-Xylene (μg/ml)
Naphthalene (μg/ml)
1 35.34 1.78 8.72 1.04 433.25
2 34.68 1.77 8.70 1.03 431.15
3 34.58 1.72 8.55 1.01 427.00
4 35.22 1.77 8.77 1.04 438.14
5 34.47 1.71 8.49 1.01 425.02
6 35.68 1.79 8.84 1.05 440.12
Mean 35.00 1.76 8.68 1.03 432.45
StDev 0.49 0.03 0.13 0.02 5.97
RSD % 1.39 1.89 1.53 1.62 1.38
Table 3. The result for precision of six calibration standards.
4
Figure 3. Example of the Excel®-based macro used to calculate concentration of toluene in MHE.
Figure 4. Example of the Excel®-based macro used to calculate concentration of o-xylene in MHE.
5
Figure 5. Example of the Excel®-based macro used to calculate concentration of m-xylene in MHE.
Figure 6. Example of the Excel®-based macro used to calculate concentration of p-xylene in MHE.
6
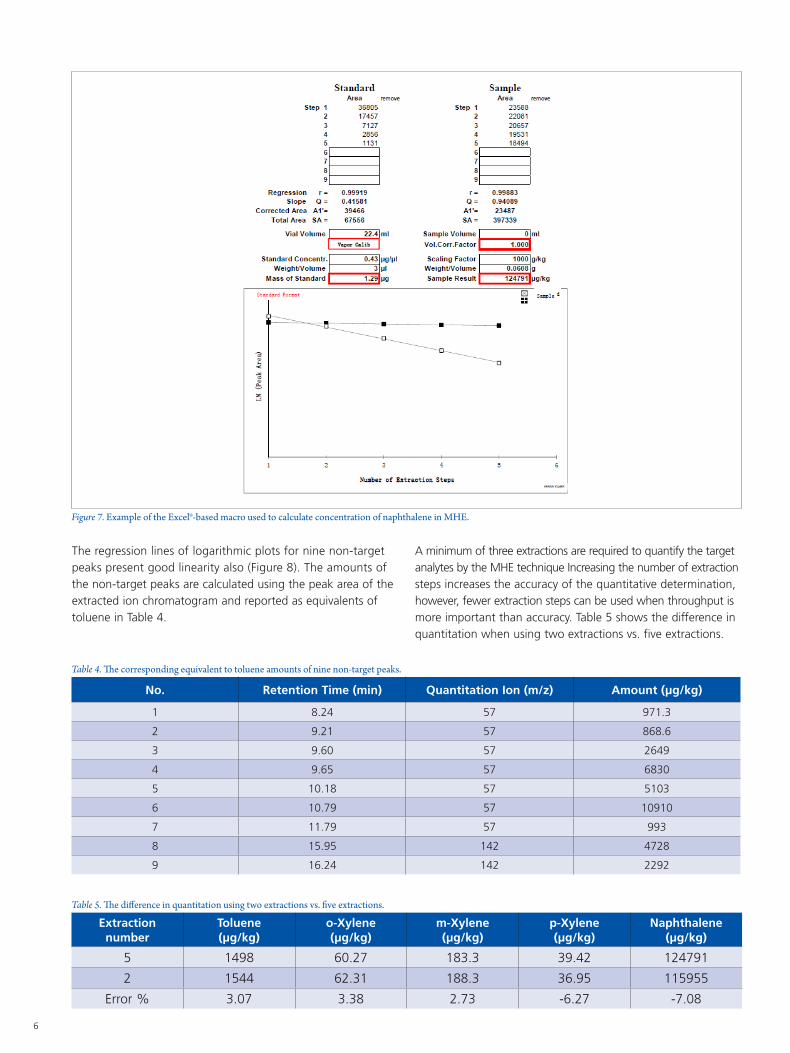
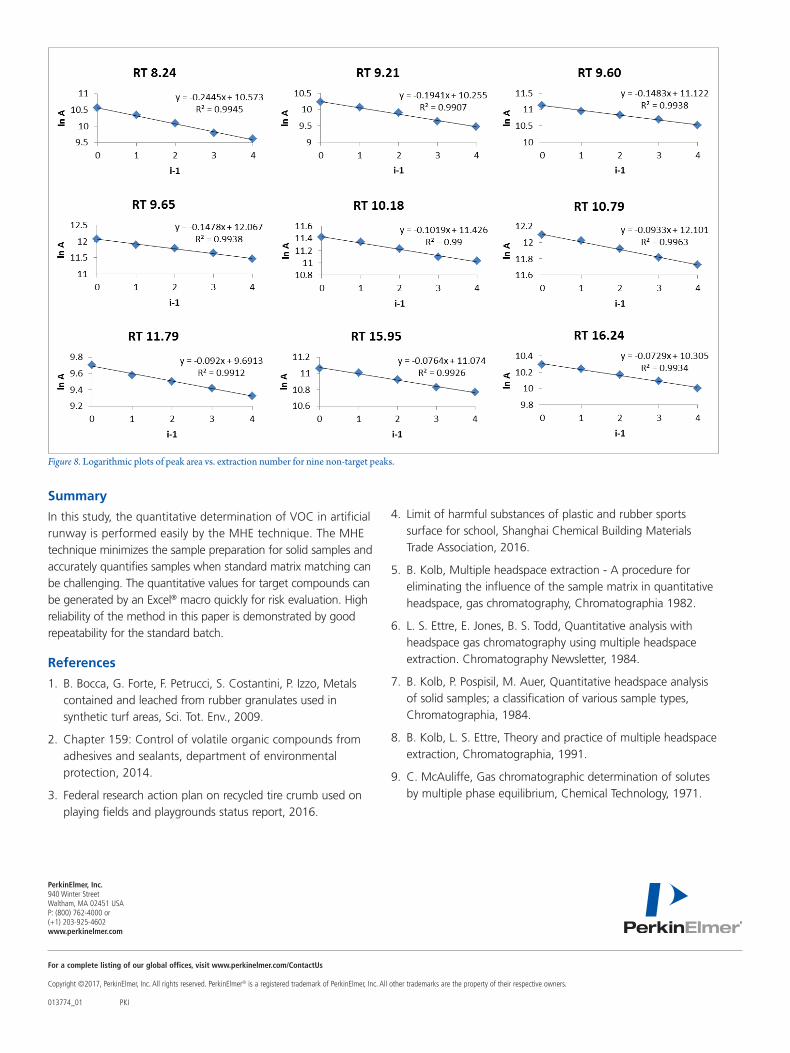
The regression lines of logarithmic plots for nine non-target peaks present good linearity also (Figure 8). The amounts of the non-target peaks are calculated using the peak area of the extracted ion chromatogram and reported as equivalents of toluene in Table 4.
Figure 7. Example of the Excel®-based macro used to calculate concentration of naphthalene in MHE.
A minimum of three extractions are required to quantify the target analytes by the MHE technique Increasing the number of extraction steps increases the accuracy of the quantitative determination, however, fewer extraction steps can be used when throughput is more important than accuracy. Table 5 shows the difference in quantitation when using two extractions vs. five extractions.
No. Retention Time (min) Quantitation Ion (m/z) Amount (μg/kg)
1 8.24 57 971.3
2 9.21 57 868.6
3 9.60 57 2649
4 9.65 57 6830
5 10.18 57 5103
6 10.79 57 10910
7 11.79 57 993
8 15.95 142 4728
9 16.24 142 2292
Table 4. The corresponding equivalent to toluene amounts of nine non-target peaks.
Extraction number
Toluene (μg/kg)
o-Xylene (μg/kg)
m-Xylene(μg/kg)
p-Xylene(μg/kg)
Naphthalene(μg/kg)
5 1498 60.27 183.3 39.42 124791
2 1544 62.31 188.3 36.95 115955
Error % 3.07 3.38 2.73 -6.27 -7.08
Table 5. The difference in quantitation using two extractions vs. five extractions.
For a complete listing of our global offices, visit www.perkinelmer.com/ContactUs
Copyright ©2017, PerkinElmer, Inc. All rights reserved. PerkinElmer® is a registered trademark of PerkinElmer, Inc. All other trademarks are the property of their respective owners. 013774_01 PKI
PerkinElmer, Inc. 940 Winter Street Waltham, MA 02451 USA P: (800) 762-4000 or (+1) 203-925-4602www.perkinelmer.com
Figure 8. Logarithmic plots of peak area vs. extraction number for nine non-target peaks.
Summary
In this study, the quantitative determination of VOC in artificial runway is performed easily by the MHE technique. The MHE technique minimizes the sample preparation for solid samples and accurately quantifies samples when standard matrix matching can be challenging. The quantitative values for target compounds can be generated by an Excel® macro quickly for risk evaluation. High reliability of the method in this paper is demonstrated by good repeatability for the standard batch.
References
1. B. Bocca, G. Forte, F. Petrucci, S. Costantini, P. Izzo, Metals contained and leached from rubber granulates used in synthetic turf areas, Sci. Tot. Env., 2009.
2. Chapter 159: Control of volatile organic compounds from adhesives and sealants, department of environmental protection, 2014.
3. Federal research action plan on recycled tire crumb used on playing fields and playgrounds status report, 2016.
4. Limit of harmful substances of plastic and rubber sports surface for school, Shanghai Chemical Building Materials Trade Association, 2016.
5. B. Kolb, Multiple headspace extraction - A procedure for eliminating the influence of the sample matrix in quantitative headspace, gas chromatography, Chromatographia 1982.
6. L. S. Ettre, E. Jones, B. S. Todd, Quantitative analysis with headspace gas chromatography using multiple headspace extraction. Chromatography Newsletter, 1984.
7. B. Kolb, P. Pospisil, M. Auer, Quantitative headspace analysis of solid samples; a classification of various sample types, Chromatographia, 1984.
8. B. Kolb, L. S. Ettre, Theory and practice of multiple headspace extraction, Chromatographia, 1991.
9. C. McAuliffe, Gas chromatographic determination of solutes by multiple phase equilibrium, Chemical Technology, 1971.