author : lidya ( 26406077 ) under the guidance of: yulia, m. kom. tanti octavia, m. eng. designing...
TRANSCRIPT

AUTHOR :
LIDYA ( 26406077 )
UNDER THE GUIDANCE OF:YULIA, M. KOM.TANTI OCTAVIA, M. ENG.
Designing and Making forecast Application to determine rate of
Purchase In "X" construction store with ARIMA Method

Background
Out of stock for particular item.

Main Goal
Make application sales forecasting with ARIMA method.
Help owner to determine the purchase item quantity.

Problem Statement
How to make a system with ARIMA method.How to determine purchase items from
forecast result

ARIMA
ARIMA models are, in theory, the most general class of models for forecasting a time series which can be stationarized by differencing.
Step forecasting with ARIMA Identification temporary model using past data to
obtain the ARIMA model. Estimation parameters of ARIMA models using past
data. Diagnostic check to examine feasibility of the model. Implementation.
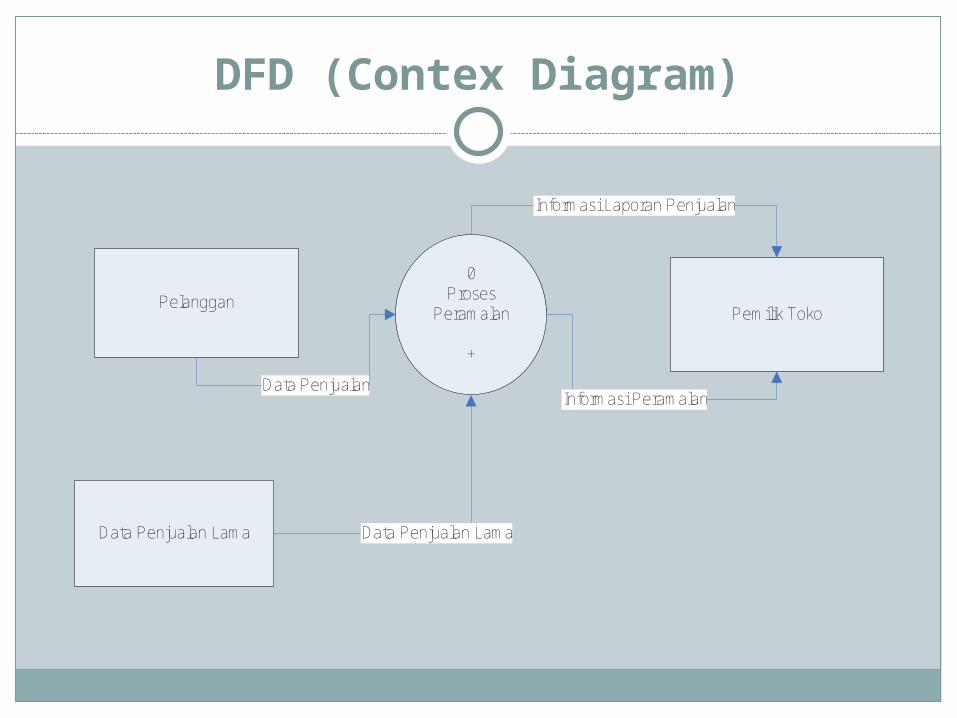
DFD (Contex Diagram)
0Proses
Peramalan
+
Pelanggan
Informasi PeramalanData Penjualan
Pemilik Toko
Informasi Laporan Penjualan
Data Penjualan Lama Data Penjualan Lama
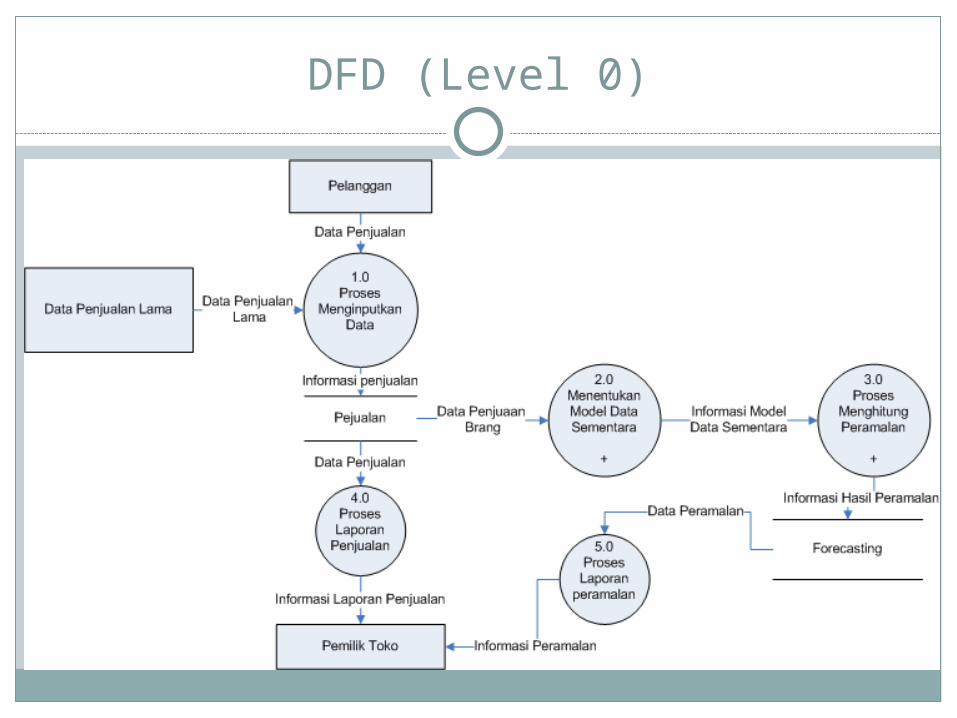
DFD (Level 0)

Flowchart Forecasting

Flowchart Forecasting(cont.)
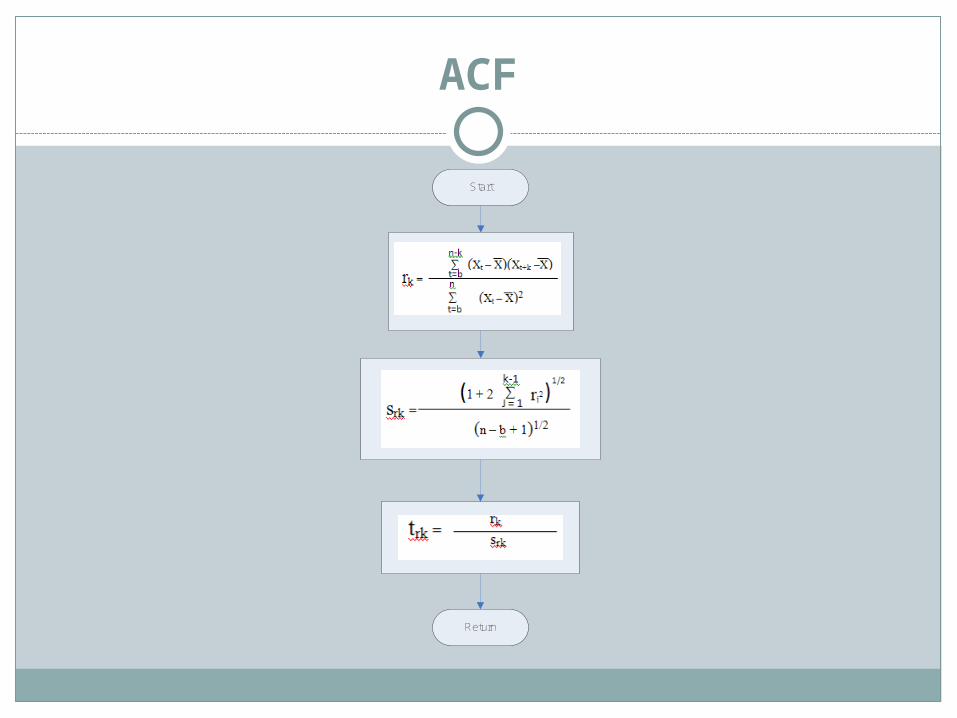
ACF
Start
Return
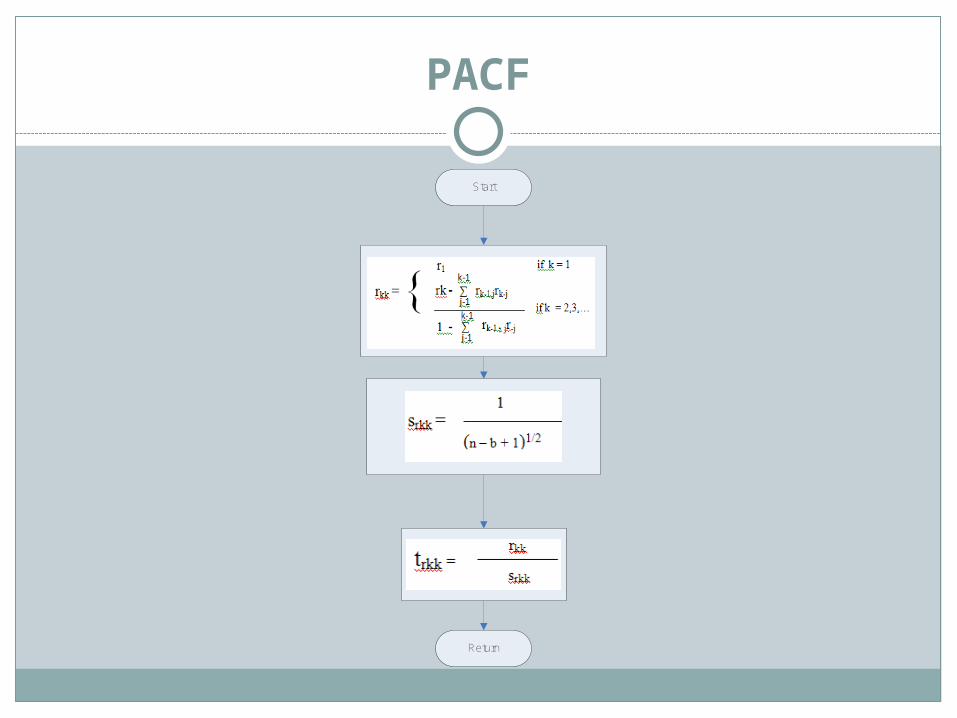
PACF
Start
Return

AR
Start
Menghitung Parameter Menggunakan Metode
Carmer
ni e
nMSE i1
1 2
Return
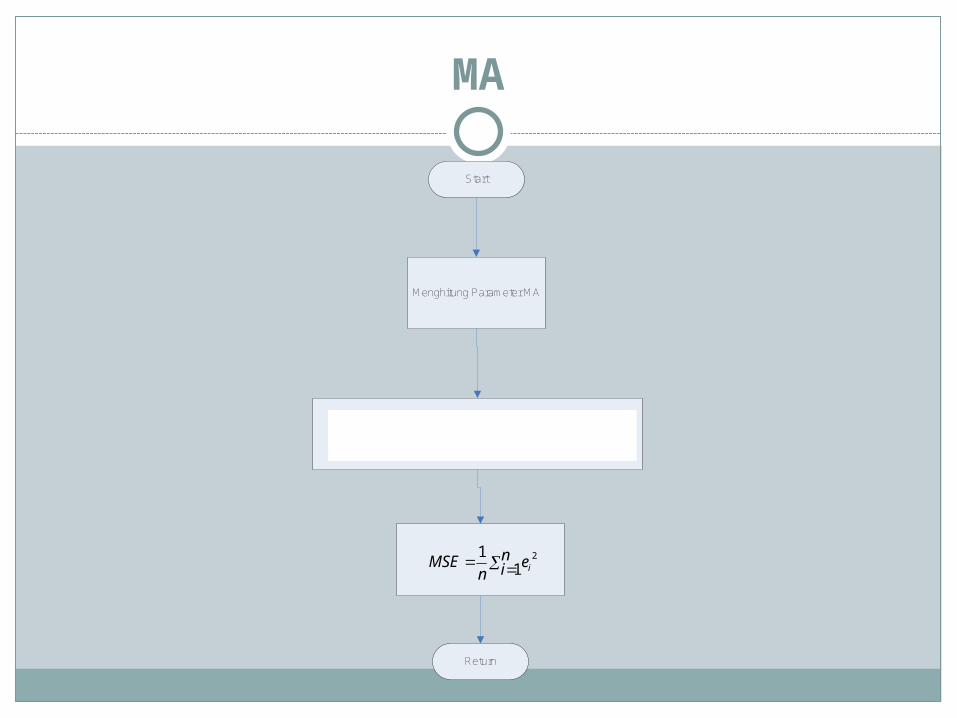
MA
Start
Menghitung Parameter MA
ni e
nMSE i1
1 2
Return
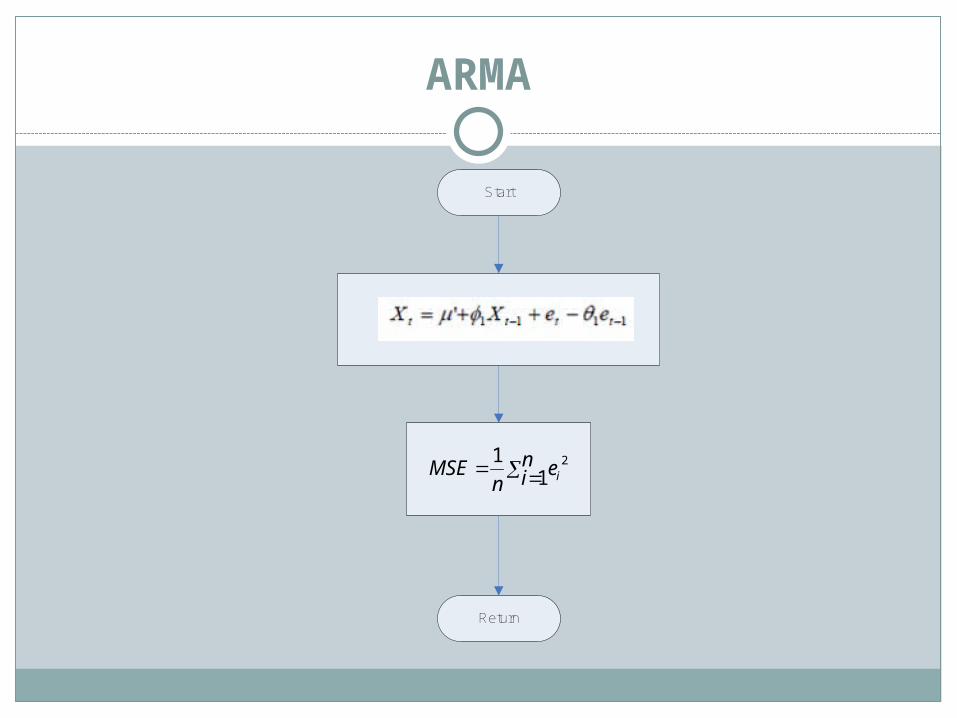
ARMA
Start
ni e
nMSE i1
1 2
Return

ARIMA
Start
Menghitung Parameter AR
ni e
nMSE i1
1 2
End
Menghitung Parameter MA
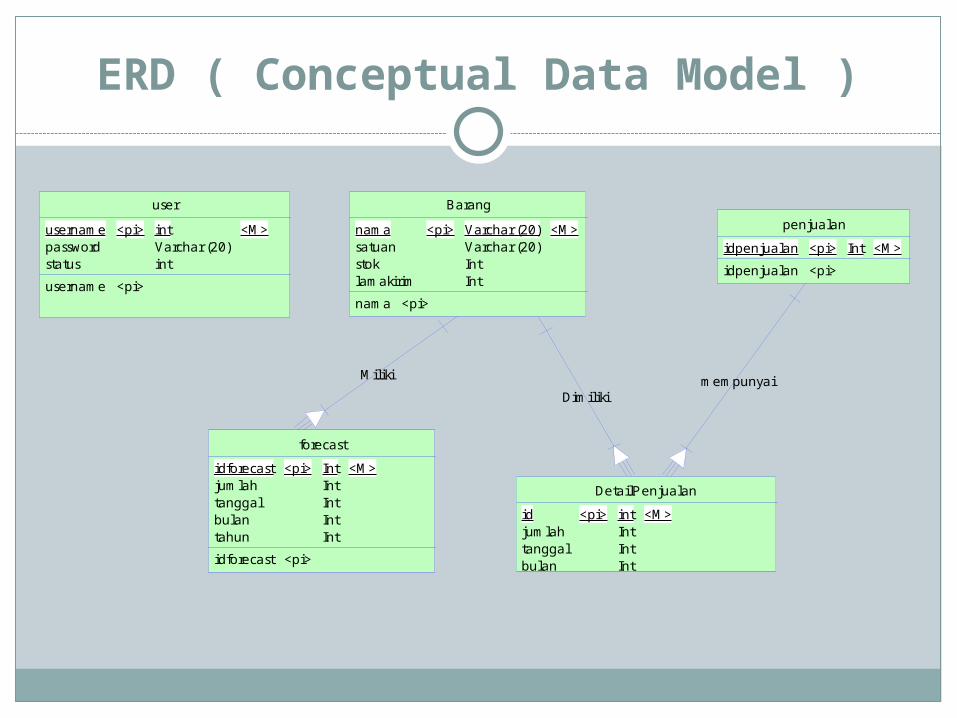
ERD ( Conceptual Data Model )
DimilikimempunyaiMiliki
user
usernamepasswordstatus
<pi> intVarchar (20)int
<M>
username <pi>
Barang
namasatuanstoklamakirim
<pi> Varchar (20)Varchar (20)IntInt
<M>
nama <pi>
penjualan
idpenjualan <pi> Int <M>
idpenjualan <pi>
forecast
idforecastjumlahtanggalbulantahun
<pi> IntIntIntIntInt
<M>
idforecast <pi>
DetailPenjualan
idjumlahtanggalbulan
<pi> intIntIntInt
<M>

ERD ( Physical Data Model )
FK_FORECAST_REFERENCE_BARANGFK_DETAILPE_REFERENCE_BARANG
FK_DETAILPE_REFERENCE_PENJUALA
users
usernamepasswordstatus
varchar(20)varchar(20)int
<pk>
barang
idbarangnamasatuanstoklamakirim
intvarchar(20)varchar(10)intint
<pk>
penjualan
idpenjualan int <pk>
forecast
idforecastidbarangjumlahtanggalbulantahun
intintintintintint
<pk><fk>
DetailPenjualan
ididbarangidpenjualanjumlahtanggalbulantahun
intintintintintintint
<pk><fk1><fk2>

EXPERIMENTAL RESULT
Program ValidationData used to test program validation is:
Periode Jumlah Penjualan
1 2
2 2
3 3
4 2
5 3
6 5
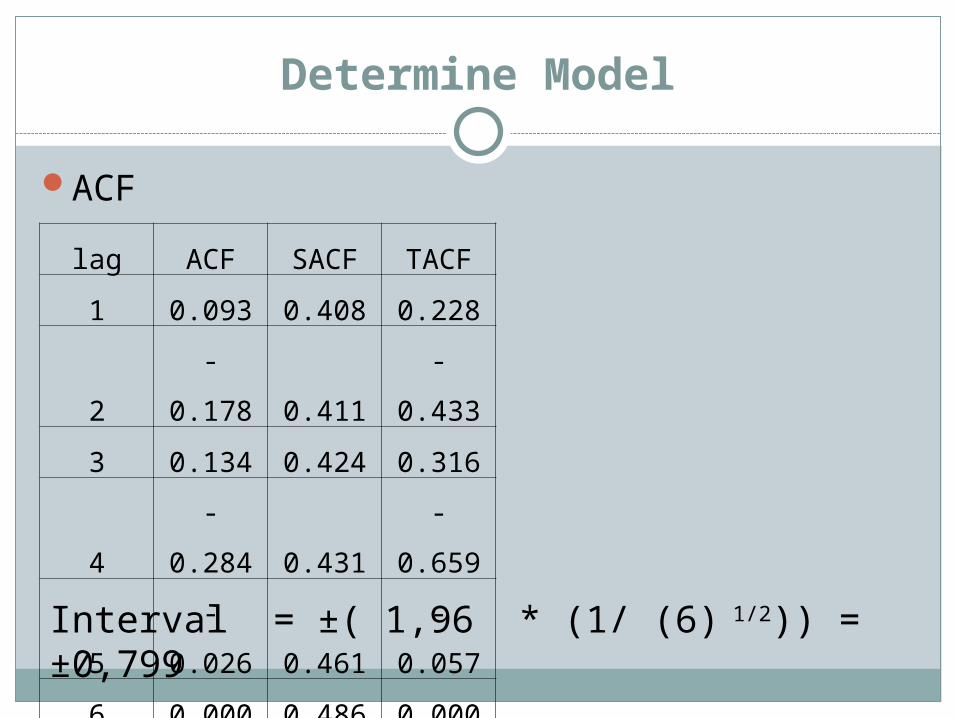
Determine Model
ACF
Interval = ±( 1,96 * (1/ (6) 1/2)) = ±0,799
lag ACF SACF TACF
1 0.093 0.408 0.228
2 -0.178 0.411 -0.433
3 0.134 0.424 0.316
4 -0.284 0.431 -0.659
5 -0.026 0.461 -0.057
6 0.000 0.486 0.000

Determine Model
PACF
ordo PACF SPACF TPACF
1 0.093 0.408 0.228
2 -0.189 0.408 -0.463
3 -0.179 0.408 -0.439
4 -0.363 0.408 -0.890
5 -0.150 0.408 -0.368
6 -0.174 0.408 -0.426
P =1, d =0, q =1

Forecasting
ARXt = 1 + εt +0,833* Xt-1
data
Forcas
t error
2 1 1
2 3 -1
3 3 0
2 4 -2
3 3 0
5 4 1
MSE = 1,167

Forecasting
MAXt = 2,423+ εt - -0,961* εt-1
data Forcast error
2 3 -1
2 2 0
3 3 0
2 3 -1
3 2 1
5 4 1 MSE = 0,667

Forecasting
ARMAXt = 1 + εt +0,833* Xt-1 -0,961* εt-1
data Forcast error
2 1 1
2 4 -2
3 1 2
2 6 -4
3 -1 4
5 8 -3 MSE = 8,33

Diagnostic Check
data error ACF(error)
2 -1 0.024
2 0 0.069
3 0 0.146
2 -1 -0.082
3 1 0.033
5 1 -0.318
Q = 0,658
χ2(0.5,4) = 9.48773
Q< χ2(0.5,4)
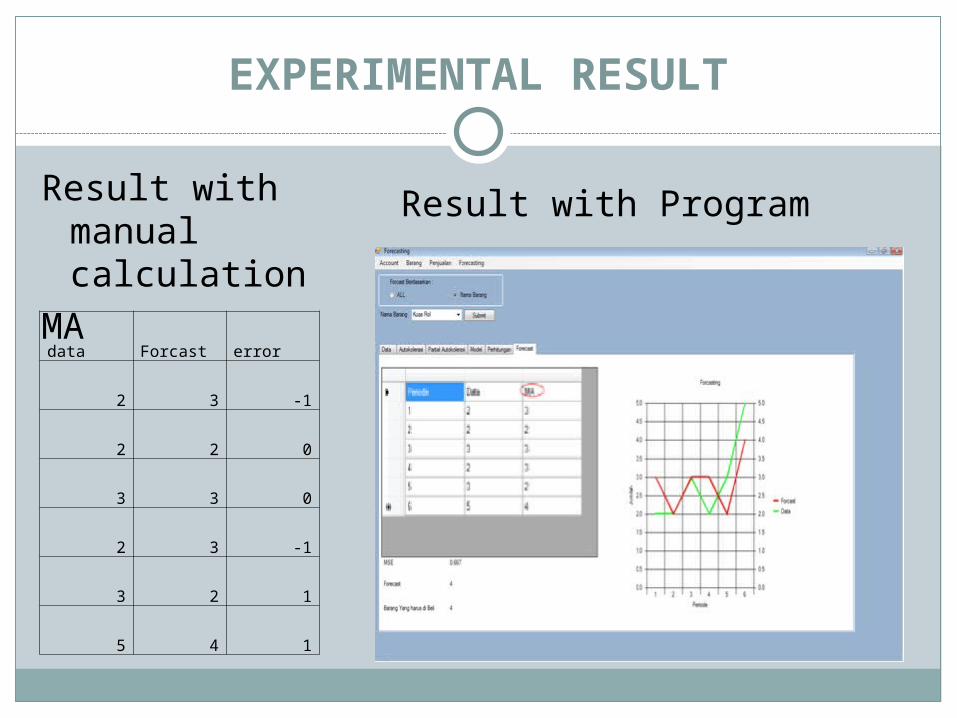
EXPERIMENTAL RESULT
Result with manual calculation
MAdata Forcast error
2 3 -1
2 2 0
3 3 0
2 3 -1
3 2 1
5 4 1
Result with Program

EXPERIMENTAL RESULT
Experimental for kind of DataThis Experimental use 2 type data. First is roller brush and secondary is paint brush.
Data of paint brush. Data of roller brush.
Periode Jumlah
Penjualan
1 2
2 2
3 3
4 2
5 3
6 5
Periode Jumlah
Penjualan
1 5
2 7
3 4
4 9
5 7
6 12

EXPERIMENTAL RESULT
Result from Data of roller brush.
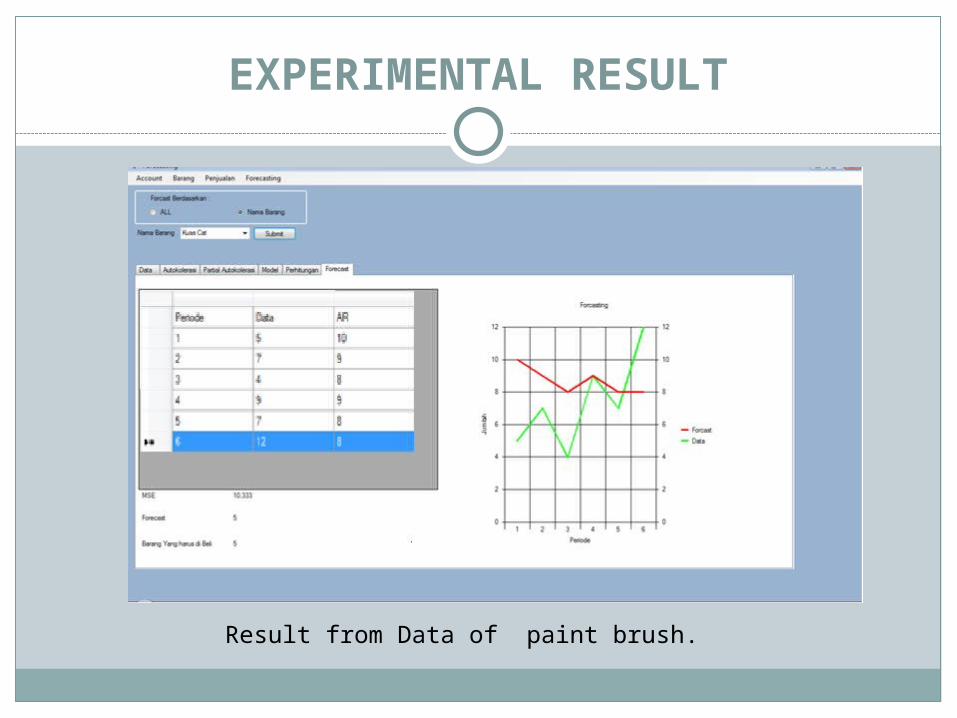
EXPERIMENTAL RESULT
Result from Data of paint brush.

Conclusion
Applications tested on users in design, completeness of features, ease of use of the application, the accuracy of forecasting, and the overall program.
Aspects of the application design, 50% user answered fairly, 33.3% said both, and 16.7% said less.
Aspects of the completeness of features, 50% user said good, and 50% said enough.
Aspect easy to use program, users answered 50% moderate, and 50% say unfavorable.
Aspect of program correctness, the user answered 73.3% moderate and 16.7% unfavorable.
Overall assessment of the program, users answered 73.3% moderate, and 16.7% is good.

Sugestion
Need a development with Hybrid method

THANKS FOR YOUR ATTENTION

EXPERIMENTAL RESULT
Experimental for DataPeriode Data Penjualan Periode Data Penjualan
1 120 20 140
2 137 21 220
3 188 22 240
4 116 23 253
5 180 24 130
6 120 25 260
7 100 26 97
8 290 27 78
9 450 28 75
10 450 29 126
11 485 30 100
12 350 31 100
13 630 32 120
14 176 33 220
15 150 34 100
16 130 35 340
17 100 36 200
18 320 37 100
19 84
This experimental using data of Metrolite 3lt
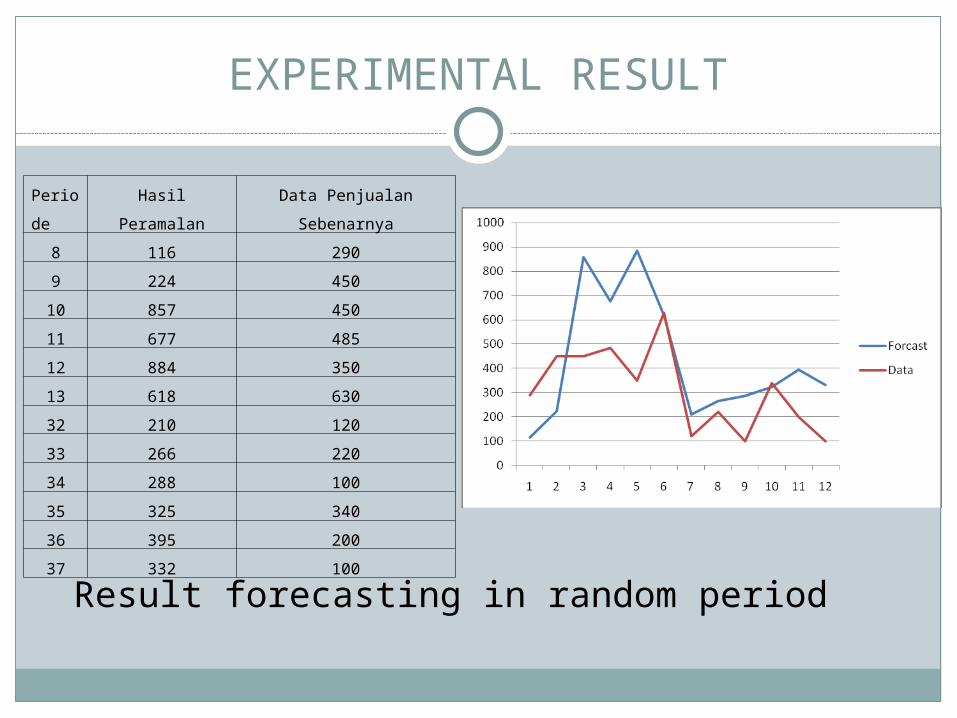
EXPERIMENTAL RESULT
Result forecasting in random period
Periode Hasil Peramalan Data Penjualan Sebenarnya
8 116 290
9 224 450
10 857 450
11 677 485
12 884 350
13 618 630
32 210 120
33 266 220
34 288 100
35 325 340
36 395 200
37 332 100