author manuscripts have been peer reviewed and accepted
TRANSCRIPT

1
Meat, fish, poultry, and egg intake at diagnosis and risk of prostate cancer progression
Kathryn M. Wilson1,2, Lorelei A. Mucci1,2, Bettina F. Drake3, Mark A. Preston4, Meir J. Stampfer1,2,5, Edward Giovannucci1,2,5, Adam S. Kibel4
1 Department of Epidemiology, Harvard T.H. Chan School of Public Health, Boston, MA (KMW, LAM, MJS, EG) 2 Channing Division of Network Medicine, Harvard Medical School and Brigham & Women’s Hospital, Boston, MA (KMW, LAM, MJS, EG) 3 Division of Public Health Sciences, Department of Surgery, School of Medicine, Washington University in St Louis, St. Louis, MO (BFD) 4 Division of Urologic Surgery, Brigham and Women's Hospital, Boston, MA (MAP, ASK) 5 Department of Nutrition, Harvard T.H. Chan School of Public Health, Boston, MA (MJS, EG) Running title: Meat and prostate cancer progression
Keywords: Diet, nutrition, prostate cancer, prostate cancer recurrence, risk factors
Financial support: This project was supported, in part, by funds from the St. Louis Men’s Group Against Cancer. Washington University School of Medicine, the Barnes-Jewish Hospital Foundation, and Siteman Cancer Center supported this research. K. Wilson and L. Mucci are supported by Prostate Cancer Foundation Young Investigator Awards. A. Kibel was supported in part by the Anthony DeNovi Fund.
Corresponding author: Kathryn Wilson, Harvard T.H. Chan School of Public Health, Department of Epidemiology, 677 Huntington Ave, Boston, MA 02115. Phone: 617-432-2305. Fax: 617-566-7805. [email protected]
Conflicts of interest: None
Abstract word count: 249
Words: 3,259
Total number of figures and tables: 5
Cancer Research. on October 25, 2016. © 2016 American Association forcancerpreventionresearch.aacrjournals.org Downloaded from
Author manuscripts have been peer reviewed and accepted for publication but have not yet been edited. Author Manuscript Published OnlineFirst on September 20, 2016; DOI: 10.1158/1940-6207.CAPR-16-0070

2
ABSTRACT
Little information exists on diet and prostate cancer progression. We examined the association between
intakes of total red meat, processed and unprocessed red meat, poultry, fish, and eggs and prostate cancer
recurrence. We conducted a prospective study of 971 men treated with radical prostatectomy for prostate
cancer between 2003-2010. Men completed a food frequency questionnaire at diagnosis. We used logistic
regression to study the association between diet and high grade or advanced stage disease. We used Cox
models to study the risk of progression (N=94 events, mainly PSA recurrence). Total red meat intake was
marginally associated with risk of high grade disease (Gleason ≥4+3; Adjusted odds ratio [OR] top vs. bottom
quartile: 1.66, 95% confidence interval [CI]: 0.93-2.97, p-trend=0.05), as was very high intake of eggs (OR top
decile vs. bottom quartile: 1.98, 95% CI: 1.08-3.63, p-trend=0.08). Well-done red meat was associated with
advanced disease (≥pT3; OR top vs. bottom quartile: 1.74, 95% CI: 1.05-2.90, p-trend=0.01). Intakes of red
meat, fish, and eggs were not associated with progression. Very high poultry intake was inversely associated
with progression (HR top decile vs. bottom quartile: 0.19, 95% CI: 0.06-0.63, p=trend=0.02). Substituting 30
g/day of poultry or fish for total or unprocessed red meat was associated with significantly lower risk of
recurrence. Lower intakes of red meat and well-done red meat and higher intakes of poultry and fish are
associated with lower risk of high grade and advanced prostate cancer and reduced recurrence risk,
independent of stage and grade.
Cancer Research. on October 25, 2016. © 2016 American Association forcancerpreventionresearch.aacrjournals.org Downloaded from
Author manuscripts have been peer reviewed and accepted for publication but have not yet been edited. Author Manuscript Published OnlineFirst on September 20, 2016; DOI: 10.1158/1940-6207.CAPR-16-0070
3
INTRODUCTION
Prostate cancer patients wonder whether lifestyle factors may alter their clinical course, yet there is little
evidence to guide patients on the association between diet and the risk of prostate cancer progression after
prostate cancer treatment. This is a critical question given that more than 2.7 million men currently live with
prostate cancer in the United States, and approximately 181,000 new cases are expected to be diagnosed in
2016.(1, 2)
Studies of diet and risk of prostate cancer have been mixed, with few consistently identified risk factors.
However, pre-diagnosis intake of processed or cured meat and lower intake of fish have both been associated
with the incidence of more aggressive prostate cancer, suggesting that meat intake may play a role in the
disease.(3-10) Intake of these dietary factors and the risk of progression after cancer treatment have been
examined in only a few studies. In a cohort of 1294 men with localized prostate cancer, higher intakes at
diagnosis of eggs and poultry with skin were associated with an increased risk of cancer progression, primarily
defined as PSA recurrence.(11) A study in the Health Professionals Follow-up Study found greater fish intake
after diagnosis was associated with lower risk of PSA recurrence.(12) A later study in the same population
found suggestive but not statistically significant associations between higher post-diagnosis intakes of poultry
and processed red meat and cancer-specific survival.(13)
Because of these suggestive but inconclusive results, we examined the association between intake of
total red meat, processed (cured) and unprocessed (uncured) red meat, poultry, fish, and eggs with prostate
cancer recurrence in a cohort of nearly 1,000 men with treated with radical prostatectomy for localized prostate
cancer between 2003 and 2010.
Cancer Research. on October 25, 2016. © 2016 American Association forcancerpreventionresearch.aacrjournals.org Downloaded from
Author manuscripts have been peer reviewed and accepted for publication but have not yet been edited. Author Manuscript Published OnlineFirst on September 20, 2016; DOI: 10.1158/1940-6207.CAPR-16-0070

4
MATERIALS AND METHODS
Study population. Men in this study were participants in the Washington University Genetics Study, a cohort
of men with biopsy-diagnosed prostate cancer treated at the Washington University School of Medicine in St.
Louis between 2003 and 2010.(14) Men were invited to participate in the study at the time of prostate cancer
diagnosis. Clinical details on diagnosis, initial treatment, and follow-up visits were collected from medical
records. Upon enrollment in the study, after diagnosis and prior to treatment, men completed a questionnaire
with demographic, smoking, and health information along with a food frequency questionnaire (FFQ) initially
developed for the National Cancer Institute-Prostate, Lung, Colorectal and Ovarian (PLCO) Cancer Screening
Trial. This FFQ was modeled on three commonly used, validated FFQs: the Block FFQ, the Willett FFQ, and
the National Cancer Institute Diet History Questionnaire; however, the PLCO FFQ was not itself validated in
the PLCO study.(15-17)
Of 1208 men enrolled in the study, 977 were treated with prostatectomy for clinical stage T1 or T2
disease and adequately completed the FFQ. Among these, we excluded 3 men missing pathological stage, 2
men missing Gleason score, and 1 man with no follow-up after surgery, resulting in a population of 971 men for
analysis of tumor stage and grade. For the survival analysis, we further focused the analysis on men with
pathologic stage T3N0M0 or lower disease, resulting in a population of 940 men. This study was approved by
the Institutional Review Boards at the Washington University School of Medicine and the Dana-Farber/Harvard
Cancer Center.
Dietary assessment. The FFQ assessed frequency of consumption of 137 individual food items, 77 with
questions on usual portion size and frequency, over the year prior to diagnosis. Additional questions asked
about cooking methods, including frequency of fried-food consumption and doneness preferences for meats.
We assessed intake of 7 food groups: total red meat, unprocessed red meat, processed red meat (hot
dogs, bacon, deli meats), fish, seafood (fish + shellfish), poultry, and eggs. Intake of each group was estimated
in grams per day and included intake from mixed dishes. We further divided poultry and fish intake into grams
Cancer Research. on October 25, 2016. © 2016 American Association forcancerpreventionresearch.aacrjournals.org Downloaded from
Author manuscripts have been peer reviewed and accepted for publication but have not yet been edited. Author Manuscript Published OnlineFirst on September 20, 2016; DOI: 10.1158/1940-6207.CAPR-16-0070

5
per day of fried and non-fried poultry or fish. We also studied consumption specifically of rare/medium rare red
meat and well/very well-done red meat.
Assessment of prostate cancer recurrence. Men were followed for disease progression through clinical
records, either from continued care at Washington University, or through follow-up phone calls or mailings for
men who opted for local care after their treatment. In order to assess biochemically recurrence, patients’ charts
were reviewed annually to determine if patients experienced a PSA rise and/or received additional therapy. If
patients did not return to Washington University, they were contacted by phone or mail annually, and relevant
medical records were obtained from the patient’s medical provider. Patients agreed to this on-going monitoring
as part of the initial study consent, and follow-up was 98% complete. Incorrect addresses were searched for
each year, and a National Death Index search was done each year to check for deaths.
Disease recurrence was defined as the first occurrence of: two or more successive PSA values of
0.2 ng/ml or more, initiation of non-adjuvant treatment, or diagnosis of metastatic disease.
Statistical analysis. We calculated odds ratios and 95% confidence intervals using logistic regression models
to assess the cross-sectional association between quartile of dietary intake and risk of high-grade disease or
advanced stage disease. High-grade disease was defined as pathological Gleason grade of 4+3 or higher.
Advanced stage disease was defined as pathological stage T3 or higher. Analysis of high-grade and advanced
stage disease includes men who were diagnosed with node positive disease at surgery, even though these
patients are not included in the recurrence analysis. “Age-adjusted models” are adjusted for age at diagnosis
and energy intake. “Covariate-adjusted models” also included race, family history of prostate cancer, BMI at
diagnosis (<25 kg/m2, 25-<27.5, 27.5-<30, 30-<35, ≥35), smoking at diagnosis (never/former/current), vigorous
physical activity (none, <1, 1, 2, 3, ≥4 hours/week), and intakes of total calcium (from foods plus supplements,
quartiles), cooked tomato products (sum of tomato/vegetable soup, canned tomatoes, tomato/vegetable juice,
tomato sauce, quartiles), and coffee (none, <1 cup/day, 1 cup/day, 2-3 cups/day, ≥4 cups/day). These
covariates were included because they have been associated with risk of fatal or advanced prostate cancer or
Cancer Research. on October 25, 2016. © 2016 American Association forcancerpreventionresearch.aacrjournals.org Downloaded from
Author manuscripts have been peer reviewed and accepted for publication but have not yet been edited. Author Manuscript Published OnlineFirst on September 20, 2016; DOI: 10.1158/1940-6207.CAPR-16-0070

6
with prostate cancer survival in the literature.(18, 19) We also considered adjustment for several other dietary
factors: supplemental calcium, supplemental selenium (from multivitamins), lycopene, saturated fat,
monounsaturated fat, and polyunsaturated fat; these were not included in the final models as they were not
associated with the outcomes of interest and had no effect on the estimates for meat/poultry/fish/eggs. In
addition, covariate-adjusted models are adjusted for clinical stage at diagnosis (T1 or T2); however, results
were qualitatively similar for models with and without adjustment for clinical stage. Models for rare/medium rare
and well/very well-done red meat intake are also adjusted for total red meat intake to simulate the effect of
substituting red meat of one level of doneness for the other, holding total red meat intake constant.
We used Cox proportional hazards models to assess the association between quartile of dietary intake
and risk of prostate cancer progression, presented as hazard ratios and 95% confidence intervals. Follow-up
began on the date of surgery and ended at the time of disease recurrence or the date of the last follow-up visit.
Models for recurrence were all adjusted for age at diagnosis and energy intake. “Covariate-adjusted models”
are adjusted for the same variables as the advanced stage and high-grade models. We also present results
further adjusted for clinical characteristics: pathologic stage (T2, T3a, T3b), Gleason grade (6, 3+4, 4+3, 8-10),
and PSA at diagnosis (0-4.0 unit, 4.1-10.0, >10.0). Models for rare/medium and well/very well-done red meat
were also adjusted for total red meat intake.
The modeling approach above estimates the effects of increasing intake of a given food group while
holding total energy intake constant; thus it is the effect of substituting the food group in question for an equal
number of calories from a non-specified mix of other foods. To understand the effects of explicitly replacing
one source of meat/protein with another, we estimated the impact of substituting 30 grams per day (~1 ounce)
of poultry or fish for 30 grams of red meat or eggs by including all food groups as continuous variables in the
same multivariable Cox proportional hazards or logistic regression models (also adjusted for other
confounders, including total energy intake). The difference in beta coefficients between the two food groups of
interest was used to estimate the substitution associations, and the variances and covariance of the betas
were used to estimate the 95% confidence intervals.
Cancer Research. on October 25, 2016. © 2016 American Association forcancerpreventionresearch.aacrjournals.org Downloaded from
Author manuscripts have been peer reviewed and accepted for publication but have not yet been edited. Author Manuscript Published OnlineFirst on September 20, 2016; DOI: 10.1158/1940-6207.CAPR-16-0070
7
Statistical tests were 2-sided with a significance level of 0.05. SAS (version 9.3) was used for all
analyses.
Cancer Research. on October 25, 2016. © 2016 American Association forcancerpreventionresearch.aacrjournals.org Downloaded from
Author manuscripts have been peer reviewed and accepted for publication but have not yet been edited. Author Manuscript Published OnlineFirst on September 20, 2016; DOI: 10.1158/1940-6207.CAPR-16-0070

8
RESULTS
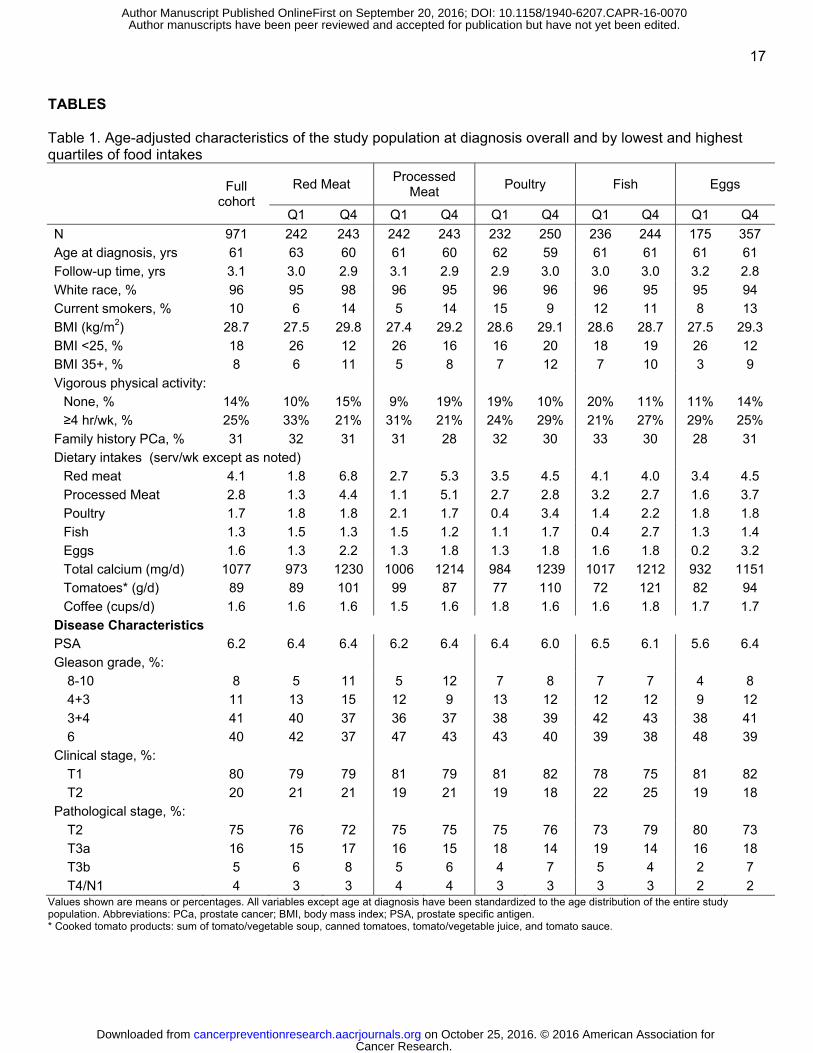
Characteristics of the full study population (N=971) at diagnosis are shown in Table 1. Mean PSA at
diagnosis was 5.9 ng/mL. The majority of men were diagnosed with clinical stage T1 disease (81%), with 19%
of men cT2. Pathological stage distribution was: 78% T2, 17% T3a, and 6% T3b. Gleason grade from
prostatectomy was 8-10 in 6% of men, 4+3 in 11%, 3+4 in 42%, and 6 in 41%. Median follow-up time of the
cohort was 3.0 years (range 1 month to 7 years and 8 months). For the analysis of disease recurrence among
940 men (2933.9 person-years) with stage T3 or lower disease, we identified 94 recurrence events (10%). Of
these, 79 were based on PSA rise, 12 on initiation of new treatment, and 3 on diagnosis of metastatic disease.
Of those with a recurrence, 13 developed metastatic disease during the follow-up period.
Characteristics of the study population for the lowest and highest quartile of consumers for each food
group are also shown in Table 1. Consumption of red meat, processed meat, and eggs was positively
correlated. Higher fish consumption was associated with somewhat lower processed meat intake and
somewhat higher poultry intake. Higher red meat consumption was associated with greater current smoking.
Higher consumption of red meat, processed meat, and eggs were all associated with higher BMI. Higher red
and processed meat consumption was associated with lower levels of vigorous physical activity, while poultry
and fish consumption was associated with higher activity. Energy intake and total calcium intake was positively
associated with consumption of all food groups. Higher poultry, fish, and egg consumption was associated with
greater intake of cooked tomato products. Men who consumed more poultry and fish had somewhat lower PSA
levels at diagnosis, while men who consumed more eggs had somewhat higher levels. (Table 1) Men with
higher red meat, processed meat, and egg intakes were more likely to be diagnosed with high grade (Gleason
8-10) disease. In addition, men with higher egg intake were more likely to have pathological stage T3 disease,
and less likely to have T2 disease.
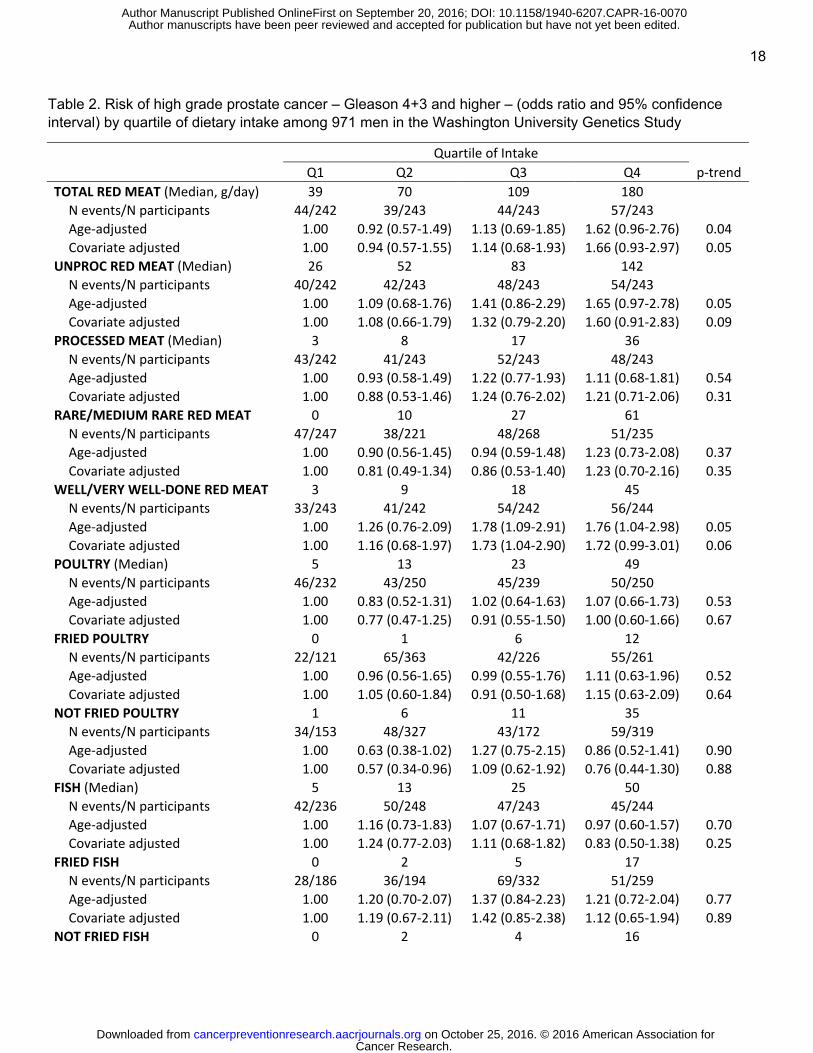
Associations between food groups and risk of high-grade prostate cancer (Gleason 4+3 and higher) are
presented in Table 2. Higher intake of total red meat was marginally associated with greater risk of high grade
disease. This association was due mainly to intakes of unprocessed red meat, and not to processed red meat.
In addition, intake of well and very well-done meat was marginally associated with greater risk of high grade
Cancer Research. on October 25, 2016. © 2016 American Association forcancerpreventionresearch.aacrjournals.org Downloaded from
Author manuscripts have been peer reviewed and accepted for publication but have not yet been edited. Author Manuscript Published OnlineFirst on September 20, 2016; DOI: 10.1158/1940-6207.CAPR-16-0070
9
disease, given a constant intake of total red meat. There was a suggestion of an increased risk for high grade
disease in the highest quartile of egg intake. When the top 10% of egg consumption was compared to the
bottom quartile, the odds ratio for high grade disease was significantly elevated, though the p-value for the
trend across categories was not significant (OR 1.98, 95% CI: 1.08-3.63, p-trend=0.08).
Diagnosis of advanced stage disease (pT3 and higher, Table 3) was not associated with intake of any
of the meat groups. However, higher intake of well/very well-done meat, substituted for rare/medium rare red
meat, was associated with a greater risk of advanced disease.
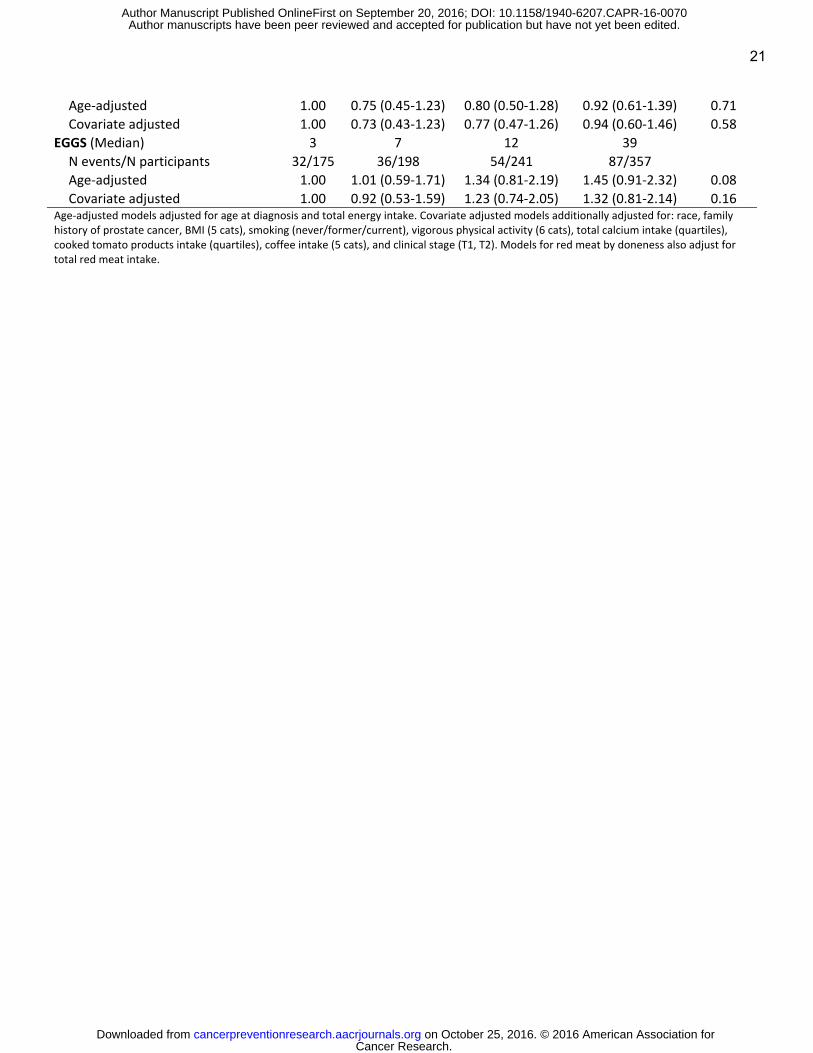
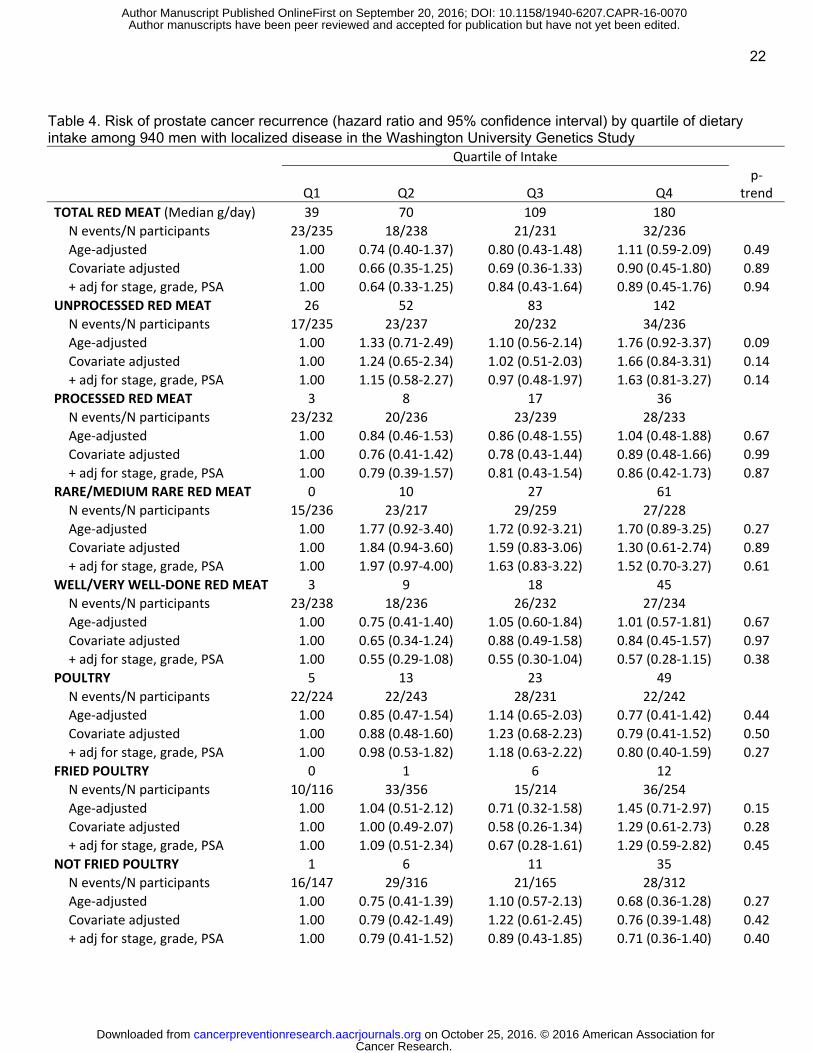
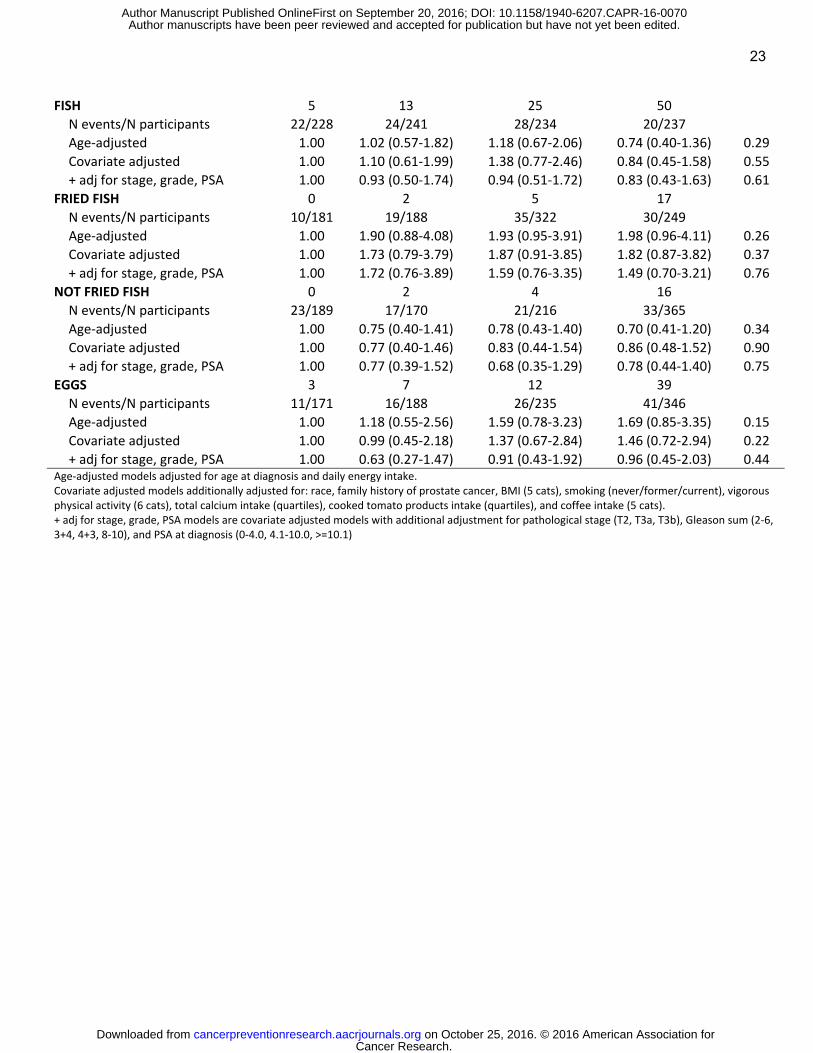
Intake of total red meat, unprocessed red meat, processed red meat, poultry, fish, and eggs were not
associated with risk of prostate cancer recurrence. (Table 4) Relative risk estimates were generally similar for
the multivariable-adjusted models and the models with additional adjustment for stage, grade, and PSA at
diagnosis for red meat, poultry, and fish. However, adjusting for clinical characteristics greatly attenuated the
association between higher egg intake and risk of recurrence, reflecting that the highest egg consumers had
worse disease characteristics at diagnosis, as suggested by Table 1. While not significant, intake of fried
poultry, fried fish, and rare or medium red meat were positively associated with risk of recurrence, and intake of
non-fried poultry, non-fried fish, and well-done or very well-done red meat were inversely associated with risk
of recurrence.
To assess very high intakes of each food group we looked at relative risk of recurrence in the top decile
compared to the lowest quartile. The top decile of poultry consumers (≥60 g/day) had a significantly lower risk
of recurrence in multivariable models (HR 0.29, 95% CI: 0.10-0.88, p-trend=0.07), which was strengthened
with adjustment for clinical characteristics (HR 0.19, 95% CI: 0.06-0.63, p=trend=0.02). There was a
suggestion of increased risk for the top 10% of egg consumers (≥42 g/day; HR 1.71, 95% CI: 0.80-3.64, p-
trend=0.11); however, this was again greatly attenuated with adjusted for clinical characteristics (HR 0.98, 95%
CI: 0.43-2.21, p-trend=0.43). Results for the top decile of intake for other food groups was in line with the
quartile results and were not statistically significant.
To assess the impact of substituting red meat or eggs in the diet with poultry or fish, we modeled the
association of the food groups simultaneously while adjusting for total energy intake. Results are shown in
Cancer Research. on October 25, 2016. © 2016 American Association forcancerpreventionresearch.aacrjournals.org Downloaded from
Author manuscripts have been peer reviewed and accepted for publication but have not yet been edited. Author Manuscript Published OnlineFirst on September 20, 2016; DOI: 10.1158/1940-6207.CAPR-16-0070
10
Figure 1. Replacing 30 grams/day of total red meat with 30 grams of poultry or fish was associated with a
significantly lower risk of recurrence (HR 0.79, 95% CI: 0.66-0.94). This association was seen for unprocessed
red meat (HR 0.76, 95% CI: 0.63-0.92) but not for processed red meat (HR 1.05, 95% CI: 0.67-1.64).
Replacing eggs in the diet with poultry or fish was associated with a non-statistically significant lower risk of
recurrence (HR 0.77, 95% CI: 0.55-1.06). Similar associations were seen for replacing these foods with only
poultry, whereas associations were weaker when the foods were replaced only with fish (data not shown).
Replacing red meat or eggs with poultry or fish was not associated with risk of high grade or advanced stage
disease. There was a suggestion of a lower risk of advanced stage disease when replacing total red meat,
unprocessed red meat, or eggs with fish alone (HR 0.86, 95% CI: 0.70-1.06 for total red meat; HR 0.86, 95%
CI: 0.69-1.06 for unprocessed red meat; HR 0.82, 95% CI 0.61-1.11 for eggs).
Cancer Research. on October 25, 2016. © 2016 American Association forcancerpreventionresearch.aacrjournals.org Downloaded from
Author manuscripts have been peer reviewed and accepted for publication but have not yet been edited. Author Manuscript Published OnlineFirst on September 20, 2016; DOI: 10.1158/1940-6207.CAPR-16-0070
11
DISCUSSION
In this study of 971 men diagnosed with prostate cancer and treated with prostatectomy, higher intake
of total red meat was marginally associated with greater risk of high grade disease, mainly due to unprocessed
red meat intake. Intake of well/very well-done meat was also associated with high grade disease and with
higher stage at diagnosis. Very high intake of eggs (≥42 g/day; 1 large egg without shell is approximately 50 g)
was associated with likelihood of high grade disease.
Intake of total red meat, unprocessed red meat, processed red meat, fish, and eggs were not
associated with risk of prostate cancer recurrence. There was some evidence that very high intakes of poultry
– 60 or more grams per day – were associated with lower risk, and replacing 30 grams/day of unprocessed red
meat with 30 grams of poultry or fish was associated with a significantly lower risk of recurrence.
Few studies have looked at diet at the time of, or after, diagnosis and risk of prostate cancer recurrence
or mortality. The Cancer of the Prostate Strategic Urologic Research Endeavor (CapSURE) found an
increased risk of recurrence for higher intakes of eggs and poultry with skin around the time of diagnosis.(11)
The Health Professionals Follow-up Study (HPFS) found a reduced risk of PSA recurrence with higher post-
diagnosis intake of fish.(12) A more recent HPFS study found a suggestion of increased risk of prostate cancer
mortality among prostate cancer patients with higher post-diagnosis intake of both poultry and processed red
meat.(13)
We found a suggestive positive association with progression after radical prostatectomy for egg
consumption, but it was not independent of stage and grade at diagnosis. We did find that very high egg intake
was associated with increased risk of high grade disease. Differences in the study populations between our
cohort and the CapSURE cohort might explain the differences regarding egg intake to some extent. Egg intake
in CapSURE was higher, with a mean of 7.9 servings per week in the top quartile of intake compared to 3.2
servings per week in our population. In addition, our population had greater numbers of men with grade 8-10
cancer. It is possible that higher egg intake is differentially associated with PSA screening and lifestyle factors
in different parts of the country, so differences in the extent of residual confounding after adjustment for
covariates may play a role.
Cancer Research. on October 25, 2016. © 2016 American Association forcancerpreventionresearch.aacrjournals.org Downloaded from
Author manuscripts have been peer reviewed and accepted for publication but have not yet been edited. Author Manuscript Published OnlineFirst on September 20, 2016; DOI: 10.1158/1940-6207.CAPR-16-0070

12
In contrast to CapSURE and HPFS, we did not find evidence of a positive association between poultry
intake and risk of recurrence. In fact, we observed a significant inverse association for very high poultry intake,
and this finding was supported by the results of our substitution models, which found significantly lower risk of
recurrence with substitution of poultry or fish for total red meat, unprocessed red meat, or eggs. The poultry
associations in those studies were driven by poultry with skin, with no associations observed for poultry without
skin. We did not have data on poultry according to skin, so we could not examine this question. We did see a
suggestion of a positive association for fried poultry and an inverse association for non-fried poultry and
recurrence, possibly indicating that the method of preparing poultry could influence risk of aggressive disease.
Two cohort studies(10, 20) found inverse associations between pre-diagnosis fish intake and prostate
cancer-specific mortality among prostate cancer patients, and HPFS found an inverse association with PSA
recurrence.(12) However, CapSURE and this cohort observed no significant associations between fish intake
and PSA recurrence. This may be due to differences between populations in the types of fish consumed or in
preparation methods; dark fish may have more protective effects than white fish, and frying of fish along with
the oils used for frying, may play a role. The FFQ in this study assessed fried versus non-fried fish but did not
include detail on type of fish consumed, so we were unable to investigate specifically dark fish intake. In
addition, our wide confidence interval for higher fish intakes cannot rule out a notable inverse association.
We found no association between processed red meat and recurrence, which is in line with CapSURE,
but in contrast to HPFS. Our observed associations for total red meat with high grade disease and with
recurrence in the substitution models were driven by unprocessed rather than processed red meat intake. We
also found a significant positive association between well-done and very well-done red meat and risk of high
grade and advanced stage disease at diagnosis. This was independent of total red meat intake, suggesting
that shifting a given intake of red meat from less done to more done is associated with worse stage and grade.
The findings for well-done and very well-done red meat along with those for fried compared to non-fried
chicken support previous work on the doneness of meat and related cooking carcinogens and incidence of
prostate cancer.(9, 21-26) Heterocyclic amines and polycyclic aromatic hydrocarbons, two classes of
carcinogenic compounds formed during high-heat cooking of meats, including both red meat and poultry, have
Cancer Research. on October 25, 2016. © 2016 American Association forcancerpreventionresearch.aacrjournals.org Downloaded from
Author manuscripts have been peer reviewed and accepted for publication but have not yet been edited. Author Manuscript Published OnlineFirst on September 20, 2016; DOI: 10.1158/1940-6207.CAPR-16-0070
13
been suggested as causes of prostate and other cancers.(27, 28) Intake of these compounds is difficult to
measure in epidemiological studies (29), but the hypothesis is supported by various lines of laboratory
evidence.(28) To our knowledge, doneness of meat has not previously been studied with respect to recurrence
among prostate cancer patients.
Our substitution model results support replacement of red meat and eggs in the diet with poultry or fish.
These results are in line with a recent study in the Physicians’ Health Study linking a post-diagnosis Western
dietary pattern, characterized by higher intake of processed and red meats, high-fat dairy, and refined grains,
with higher prostate cancer-specific and total mortality.(30) The substitution modeling approach is useful for
shaping dietary advice, as the effect of increasing intake of a given food or nutrient can depend on what food
or nutrient it replaces(31), and it gives concrete guidance to patients. In addition, it facilitates comparisons
between different study populations, as the results of standard models will depend on the typical diet in a
population, but the effects of specific substitutions should be comparable even when overall diet composition
varies.
Limitations of our study include lack of information on prediagnostic PSA screening, allowing for
possible confounding by PSA screening behavior, which is generally associated with more healthy behaviors.
We attempted to control for differences in screening to some extent by adjusting for clinical stage T1 versus
T2, as most PSA-detected disease with be T1 among men with ongoing screening. However, there is still a
possibility of residual confounding by screening.
The use of PSA recurrence as an outcome may also be a limitation. While PSA recurrence is a highly
clinically relevant event for men with prostate cancer, many men with PSA recurrence do not experience
clinical progression to metastases or prostate cancer-specific death. In this population of men diagnosed with
localized disease, only 3 men had progressed to metastatic disease during this follow-up period, so we are
unable to study metastatic or fatal disease as an outcome. In addition, we have only a single diet assessment
taken at the time of diagnosis, and it is possible that men changed their diet after treatment. The study
population is almost entirely white, limiting generalizability. Finally, the follow-up of an average of 3 years is
short, and as a result we had a limited number of PSA recurrence events. Because of this, we had relatively
Cancer Research. on October 25, 2016. © 2016 American Association forcancerpreventionresearch.aacrjournals.org Downloaded from
Author manuscripts have been peer reviewed and accepted for publication but have not yet been edited. Author Manuscript Published OnlineFirst on September 20, 2016; DOI: 10.1158/1940-6207.CAPR-16-0070
14
low power to detect associations, which may explain some of our null findings. Strengths of the study include
its prospective design, comprehensive food frequency questionnaire, and availability of clinical and follow-up
data from a single treatment center.
In conclusion, our findings support advising men with prostate cancer to replace red meat and eggs in
the diet with poultry or fish. This is associated with reduced risk of recurrence independent of stage and grade
at diagnosis and is consistent with previous findings on diet and prostate cancer survivorship. While it is
unknown if post diagnosis alterations in diet are associated with altered progression, this study raises the
possibility that substitution of poultry or fish for red meat and eggs could decrease progression in men
surgically treated for prostate cancer. In addition, this is reasonable advice more broadly, given associations
between red meat and saturated fat intake and total mortality and heart disease.(31-33) Additional studies with
longer-term follow-up for prostate cancer survival and information on changes in diet after diagnosis are
needed to further elucidate the role of diet in prostate cancer progression to inform patients and doctors.
Cancer Research. on October 25, 2016. © 2016 American Association forcancerpreventionresearch.aacrjournals.org Downloaded from
Author manuscripts have been peer reviewed and accepted for publication but have not yet been edited. Author Manuscript Published OnlineFirst on September 20, 2016; DOI: 10.1158/1940-6207.CAPR-16-0070

15
REFERENCES 1. Jemal A, Siegel R, Ward E, Hao Y, Xu J, Thun MJ. Cancer statistics, 2009. CA Cancer J Clin. 2009;59:225-49. 2. Howlader N, Noone AM, Krapcho M, Miller D, Bishop K, Altekruse SF, et al. (eds). SEER Cancer Statistics Review, 1975-2013, National Cancer Institute. Bethesda, MD, http://seer.cancer.gov/csr/1975_2013/, based on November 2015 SEER data submission, posted to the SEER web site, April 2016. 3. Park SY, Murphy SP, Wilkens LR, Henderson BE, Kolonel LN. Fat and meat intake and prostate cancer risk: the multiethnic cohort study. International journal of cancer Journal international du cancer. 2007;121:1339-45. 4. Rohrmann S, Platz EA, Kavanaugh CJ, Thuita L, Hoffman SC, Helzlsouer KJ. Meat and dairy consumption and subsequent risk of prostate cancer in a US cohort study. Cancer causes & control : CCC. 2007;18:41-50. 5. Schuurman AG, van den Brandt PA, Dorant E, Goldbohm RA. Animal products, calcium and protein and prostate cancer risk in The Netherlands Cohort Study. British journal of cancer. 1999;80:1107-13. 6. Rodriguez C, McCullough ML, Mondul AM, Jacobs EJ, Chao A, Patel AV, et al. Meat consumption among Black and White men and risk of prostate cancer in the Cancer Prevention Study II Nutrition Cohort. Cancer epidemiology, biomarkers & prevention : a publication of the American Association for Cancer Research, cosponsored by the American Society of Preventive Oncology. 2006;15:211-6. 7. Michaud DS, Augustsson K, Rimm EB, Stampfer MJ, Willet WC, Giovannucci E. A prospective study on intake of animal products and risk of prostate cancer. Cancer causes & control : CCC. 2001;12:557-67. 8. Augustsson K, Michaud DS, Rimm EB, Leitzmann MF, Stampfer MJ, Willett WC, et al. A prospective study of intake of fish and marine fatty acids and prostate cancer. Cancer epidemiology, biomarkers & prevention : a publication of the American Association for Cancer Research, cosponsored by the American Society of Preventive Oncology. 2003;12:64-7. 9. Sinha R, Park Y, Graubard BI, Leitzmann MF, Hollenbeck A, Schatzkin A, et al. Meat and meat-related compounds and risk of prostate cancer in a large prospective cohort study in the United States. American journal of epidemiology. 2009;170:1165-77. 10. Chavarro JE, Stampfer MJ, Hall MN, Sesso HD, Ma J. A 22-y prospective study of fish intake in relation to prostate cancer incidence and mortality. The American journal of clinical nutrition. 2008;88:1297-303. 11. Richman EL, Stampfer MJ, Paciorek A, Broering JM, Carroll PR, Chan JM. Intakes of meat, fish, poultry, and eggs and risk of prostate cancer progression. The American journal of clinical nutrition. 2010;91:712-21. 12. Chan JM, Holick CN, Leitzmann MF, Rimm EB, Willett WC, Stampfer MJ, et al. Diet after diagnosis and the risk of prostate cancer progression, recurrence, and death (United States). Cancer causes & control : CCC. 2006;17:199-208. 13. Richman EL, Kenfield SA, Stampfer MJ, Giovannucci EL, Chan JM. Egg, red meat, and poultry intake and risk of lethal prostate cancer in the prostate-specific antigen-era: incidence and survival. Cancer prevention research. 2011;4:2110-21. 14. Eeles RA, Olama AA, Benlloch S, Saunders EJ, Leongamornlert DA, Tymrakiewicz M, et al. Identification of 23 new prostate cancer susceptibility loci using the iCOGS custom genotyping array. Nat Genet. 2013;45:385-91, 91e1-2. 15. Kunzmann AT, Coleman HG, Huang WY, Cantwell MM, Kitahara CM, Berndt SI. Fruit and vegetable intakes and risk of colorectal cancer and incident and recurrent adenomas in the PLCO cancer screening trial. International journal of cancer Journal international du cancer. 2016;138:1851-61. 16. Kirsh VA, Hayes RB, Mayne ST, Chatterjee N, Subar AF, Dixon LB, et al. Supplemental and dietary vitamin E, beta-carotene, and vitamin C intakes and prostate cancer risk. J Natl Cancer Inst. 2006;98:245-54. 17. Subar AF, Thompson FE, Kipnis V, Midthune D, Hurwitz P, McNutt S, et al. Comparative validation of the Block, Willett, and National Cancer Institute food frequency questionnaires : the Eating at America's Table Study. American journal of epidemiology. 2001;154:1089-99.
Cancer Research. on October 25, 2016. © 2016 American Association forcancerpreventionresearch.aacrjournals.org Downloaded from
Author manuscripts have been peer reviewed and accepted for publication but have not yet been edited. Author Manuscript Published OnlineFirst on September 20, 2016; DOI: 10.1158/1940-6207.CAPR-16-0070

16
18. Chan JM, Van Blarigan EL, Kenfield SA. What should we tell prostate cancer patients about (secondary) prevention? Curr Opin Urol. 2014;24:318-23. 19. Giovannucci E, Liu Y, Platz EA, Stampfer MJ, Willett WC. Risk factors for prostate cancer incidence and progression in the health professionals follow-up study. International journal of cancer Journal international du cancer. 2007;121:1571-8. 20. Pham TM, Fujino Y, Kubo T, Ide R, Tokui N, Mizoue T, et al. Fish intake and the risk of fatal prostate cancer: findings from a cohort study in Japan. Public health nutrition. 2009;12:609-13. 21. Tang D, Liu JJ, Rundle A, Neslund-Dudas C, Savera AT, Bock CH, et al. Grilled meat consumption and PhIP-DNA adducts in prostate carcinogenesis. Cancer epidemiology, biomarkers & prevention : a publication of the American Association for Cancer Research, cosponsored by the American Society of Preventive Oncology. 2007;16:803-8. 22. Koutros S, Cross AJ, Sandler DP, Hoppin JA, Ma X, Zheng T, et al. Meat and meat mutagens and risk of prostate cancer in the Agricultural Health Study. Cancer epidemiology, biomarkers & prevention : a publication of the American Association for Cancer Research, cosponsored by the American Society of Preventive Oncology. 2008;17:80-7. 23. John EM, Stern MC, Sinha R, Koo J. Meat consumption, cooking practices, meat mutagens, and risk of prostate cancer. Nutrition and cancer. 2011;63:525-37. 24. Punnen S, Hardin J, Cheng I, Klein EA, Witte JS. Impact of meat consumption, preparation, and mutagens on aggressive prostate cancer. PloS one. 2011;6:e27711. 25. Major JM, Cross AJ, Watters JL, Hollenbeck AR, Graubard BI, Sinha R. Patterns of meat intake and risk of prostate cancer among African-Americans in a large prospective study. Cancer causes & control : CCC. 2011;22:1691-8. 26. Cross AJ, Peters U, Kirsh VA, Andriole GL, Reding D, Hayes RB, et al. A prospective study of meat and meat mutagens and prostate cancer risk. Cancer research. 2005;65:11779-84. 27. Abid Z, Cross AJ, Sinha R. Meat, dairy, and cancer. The American journal of clinical nutrition. 2014;100 Suppl 1:386S-93S. 28. Zheng W, Lee SA. Well-done meat intake, heterocyclic amine exposure, and cancer risk. Nutrition and cancer. 2009;61:437-46. 29. Trafialek J, Kolanowski W. Dietary exposure to meat-related carcinogenic substances: is there a way to estimate the risk? Int J Food Sci Nutr. 2014;65:774-80. 30. Yang M, Kenfield SA, Van Blarigan EL, Batista JL, Sesso HD, Ma J, et al. Dietary patterns after prostate cancer diagnosis in relation to disease-specific and total mortality. Cancer prevention research. 2015;8:545-51. 31. Jakobsen MU, O'Reilly EJ, Heitmann BL, Pereira MA, Balter K, Fraser GE, et al. Major types of dietary fat and risk of coronary heart disease: a pooled analysis of 11 cohort studies. The American journal of clinical nutrition. 2009;89:1425-32. 32. Pan A, Sun Q, Bernstein AM, Schulze MB, Manson JE, Stampfer MJ, et al. Red meat consumption and mortality: results from 2 prospective cohort studies. Archives of internal medicine. 2012;172:555-63. 33. Hu FB, Rimm EB, Stampfer MJ, Ascherio A, Spiegelman D, Willett WC. Prospective study of major dietary patterns and risk of coronary heart disease in men. The American journal of clinical nutrition. 2000;72:912-21.
Cancer Research. on October 25, 2016. © 2016 American Association forcancerpreventionresearch.aacrjournals.org Downloaded from
Author manuscripts have been peer reviewed and accepted for publication but have not yet been edited. Author Manuscript Published OnlineFirst on September 20, 2016; DOI: 10.1158/1940-6207.CAPR-16-0070
17
TABLES Table 1. Age-adjusted characteristics of the study population at diagnosis overall and by lowest and highest quartiles of food intakes
Full cohort
Red Meat Processed Meat Poultry Fish Eggs
Q1 Q4 Q1 Q4 Q1 Q4 Q1 Q4 Q1 Q4 N 971 242 243 242 243 232 250 236 244 175 357 Age at diagnosis, yrs 61 63 60 61 60 62 59 61 61 61 61 Follow-up time, yrs 3.1 3.0 2.9 3.1 2.9 2.9 3.0 3.0 3.0 3.2 2.8 White race, % 96 95 98 96 95 96 96 96 95 95 94 Current smokers, % 10 6 14 5 14 15 9 12 11 8 13 BMI (kg/m2) 28.7 27.5 29.8 27.4 29.2 28.6 29.1 28.6 28.7 27.5 29.3 BMI <25, % 18 26 12 26 16 16 20 18 19 26 12 BMI 35+, % 8 6 11 5 8 7 12 7 10 3 9 Vigorous physical activity:
None, % 14% 10% 15% 9% 19% 19% 10% 20% 11% 11% 14% ≥4 hr/wk, % 25% 33% 21% 31% 21% 24% 29% 21% 27% 29% 25%
Family history PCa, % 31 32 31 31 28 32 30 33 30 28 31 Dietary intakes (serv/wk except as noted)
Red meat 4.1 1.8 6.8 2.7 5.3 3.5 4.5 4.1 4.0 3.4 4.5 Processed Meat 2.8 1.3 4.4 1.1 5.1 2.7 2.8 3.2 2.7 1.6 3.7 Poultry 1.7 1.8 1.8 2.1 1.7 0.4 3.4 1.4 2.2 1.8 1.8 Fish 1.3 1.5 1.3 1.5 1.2 1.1 1.7 0.4 2.7 1.3 1.4 Eggs 1.6 1.3 2.2 1.3 1.8 1.3 1.8 1.6 1.8 0.2 3.2 Total calcium (mg/d) 1077 973 1230 1006 1214 984 1239 1017 1212 932 1151 Tomatoes* (g/d) 89 89 101 99 87 77 110 72 121 82 94 Coffee (cups/d) 1.6 1.6 1.6 1.5 1.6 1.8 1.6 1.6 1.8 1.7 1.7
Disease Characteristics PSA 6.2 6.4 6.4 6.2 6.4 6.4 6.0 6.5 6.1 5.6 6.4 Gleason grade, %:
8-10 8 5 11 5 12 7 8 7 7 4 8 4+3 11 13 15 12 9 13 12 12 12 9 12 3+4 41 40 37 36 37 38 39 42 43 38 41 6 40 42 37 47 43 43 40 39 38 48 39
Clinical stage, %: T1 80 79 79 81 79 81 82 78 75 81 82 T2 20 21 21 19 21 19 18 22 25 19 18
Pathological stage, %: T2 75 76 72 75 75 75 76 73 79 80 73 T3a 16 15 17 16 15 18 14 19 14 16 18 T3b 5 6 8 5 6 4 7 5 4 2 7 T4/N1 4 3 3 4 4 3 3 3 3 2 2
Values shown are means or percentages. All variables except age at diagnosis have been standardized to the age distribution of the entire study population. Abbreviations: PCa, prostate cancer; BMI, body mass index; PSA, prostate specific antigen. * Cooked tomato products: sum of tomato/vegetable soup, canned tomatoes, tomato/vegetable juice, and tomato sauce.
Cancer Research. on October 25, 2016. © 2016 American Association forcancerpreventionresearch.aacrjournals.org Downloaded from
Author manuscripts have been peer reviewed and accepted for publication but have not yet been edited. Author Manuscript Published OnlineFirst on September 20, 2016; DOI: 10.1158/1940-6207.CAPR-16-0070
18
Table 2. Risk of high grade prostate cancer – Gleason 4+3 and higher – (odds ratio and 95% confidence interval) by quartile of dietary intake among 971 men in the Washington University Genetics Study
Quartile of Intake Q1 Q2 Q3 Q4 p-trend TOTAL RED MEAT (Median, g/day) 39 70 109 180
N events/N participants 44/242 39/243 44/243 57/243 Age-adjusted 1.00 0.92 (0.57-1.49) 1.13 (0.69-1.85) 1.62 (0.96-2.76) 0.04 Covariate adjusted 1.00 0.94 (0.57-1.55) 1.14 (0.68-1.93) 1.66 (0.93-2.97) 0.05
UNPROC RED MEAT (Median) 26 52 83 142 N events/N participants 40/242 42/243 48/243 54/243 Age-adjusted 1.00 1.09 (0.68-1.76) 1.41 (0.86-2.29) 1.65 (0.97-2.78) 0.05 Covariate adjusted 1.00 1.08 (0.66-1.79) 1.32 (0.79-2.20) 1.60 (0.91-2.83) 0.09
PROCESSED MEAT (Median) 3 8 17 36 N events/N participants 43/242 41/243 52/243 48/243 Age-adjusted 1.00 0.93 (0.58-1.49) 1.22 (0.77-1.93) 1.11 (0.68-1.81) 0.54 Covariate adjusted 1.00 0.88 (0.53-1.46) 1.24 (0.76-2.02) 1.21 (0.71-2.06) 0.31
RARE/MEDIUM RARE RED MEAT 0 10 27 61 N events/N participants 47/247 38/221 48/268 51/235 Age-adjusted 1.00 0.90 (0.56-1.45) 0.94 (0.59-1.48) 1.23 (0.73-2.08) 0.37 Covariate adjusted 1.00 0.81 (0.49-1.34) 0.86 (0.53-1.40) 1.23 (0.70-2.16) 0.35
WELL/VERY WELL-DONE RED MEAT 3 9 18 45 N events/N participants 33/243 41/242 54/242 56/244 Age-adjusted 1.00 1.26 (0.76-2.09) 1.78 (1.09-2.91) 1.76 (1.04-2.98) 0.05 Covariate adjusted 1.00 1.16 (0.68-1.97) 1.73 (1.04-2.90) 1.72 (0.99-3.01) 0.06
POULTRY (Median) 5 13 23 49 N events/N participants 46/232 43/250 45/239 50/250 Age-adjusted 1.00 0.83 (0.52-1.31) 1.02 (0.64-1.63) 1.07 (0.66-1.73) 0.53 Covariate adjusted 1.00 0.77 (0.47-1.25) 0.91 (0.55-1.50) 1.00 (0.60-1.66) 0.67
FRIED POULTRY 0 1 6 12 N events/N participants 22/121 65/363 42/226 55/261 Age-adjusted 1.00 0.96 (0.56-1.65) 0.99 (0.55-1.76) 1.11 (0.63-1.96) 0.52 Covariate adjusted 1.00 1.05 (0.60-1.84) 0.91 (0.50-1.68) 1.15 (0.63-2.09) 0.64
NOT FRIED POULTRY 1 6 11 35 N events/N participants 34/153 48/327 43/172 59/319 Age-adjusted 1.00 0.63 (0.38-1.02) 1.27 (0.75-2.15) 0.86 (0.52-1.41) 0.90 Covariate adjusted 1.00 0.57 (0.34-0.96) 1.09 (0.62-1.92) 0.76 (0.44-1.30) 0.88
FISH (Median) 5 13 25 50 N events/N participants 42/236 50/248 47/243 45/244 Age-adjusted 1.00 1.16 (0.73-1.83) 1.07 (0.67-1.71) 0.97 (0.60-1.57) 0.70 Covariate adjusted 1.00 1.24 (0.77-2.03) 1.11 (0.68-1.82) 0.83 (0.50-1.38) 0.25
FRIED FISH 0 2 5 17 N events/N participants 28/186 36/194 69/332 51/259 Age-adjusted 1.00 1.20 (0.70-2.07) 1.37 (0.84-2.23) 1.21 (0.72-2.04) 0.77 Covariate adjusted 1.00 1.19 (0.67-2.11) 1.42 (0.85-2.38) 1.12 (0.65-1.94) 0.89
NOT FRIED FISH 0 2 4 16
Cancer Research. on October 25, 2016. © 2016 American Association forcancerpreventionresearch.aacrjournals.org Downloaded from
Author manuscripts have been peer reviewed and accepted for publication but have not yet been edited. Author Manuscript Published OnlineFirst on September 20, 2016; DOI: 10.1158/1940-6207.CAPR-16-0070

19
N events/N participants 40/196 36/178 42/222 66/375 Age-adjusted 1.00 0.98 (0.59-1.63) 0.95 (0.58-1.54) 0.84 (0.54-1.30) 0.37 Covariate adjusted 1.00 0.94 (0.55-1.61) 0.93 (0.55-1.57) 0.77 (0.47-1.24) 0.23
EGGS (Median) 3 7 12 39 N events/N participants 25/175 37/198 47/241 75/357 Age-adjusted 1.00 1.38 (0.79-2.42) 1.50 (0.87-2.58) 1.53 (0.92-2.55) 0.27 Covariate adjusted 1.00 1.44 (0.81-2.59) 1.37 (0.78-2.40) 1.53 (0.89-2.63) 0.28
Age-adjusted models adjusted for age at diagnosis and total energy intake. Covariate adjusted models additionally adjusted for: race, family history of prostate cancer, BMI (5 cats), smoking (never/former/current), vigorous physical activity (6 cats), total calcium intake (quartiles), cooked tomato products intake (quartiles), coffee intake (5 cats), and clinical stage (T1, T2). Models for red meat by doneness also adjust for total red meat intake.
Cancer Research. on October 25, 2016. © 2016 American Association forcancerpreventionresearch.aacrjournals.org Downloaded from
Author manuscripts have been peer reviewed and accepted for publication but have not yet been edited. Author Manuscript Published OnlineFirst on September 20, 2016; DOI: 10.1158/1940-6207.CAPR-16-0070

20
Table 3. Risk of advanced stage prostate cancer – pT3 and higher – (odds ratio and 95% confidence interval) by quartile of dietary intake among 971 men in the Washington University Genetics Study Quartile of Intake Q1 Q2 Q3 Q4 p-trend TOTAL RED MEAT (Median, g/day) 39 70 109 180
N events/N participants 50/242 54/243 48/243 57/243 Age-adjusted 1.00 1.14 (0.74-1.77) 1.02 (0.64-1.62) 1.30 (0.78-2.16) 0.38 Covariate adjusted 1.00 1.10 (0.70-1.73) 0.99 (0.61-1.62) 1.23 (0.71-2.14) 0.51
UNPROC RED MEAT (Median) 26 52 83 142 N events/N participants 44/242 58/243 54/243 53/243 Age-adjusted 1.00 1.44 (0.93-2.24) 1.38 (0.87-2.20) 1.35 (0.81-2.25) 0.40 Covariate adjusted 1.00 1.36 (0.86-2.15) 1.31 (0.81-2.13) 1.25 (0.73-2.15) 0.60
PROCESSED MEAT (Median) 3 8 17 36 N events/N participants 50/242 54/243 54/243 51/243 Age-adjusted 1.00 1.09 (0.71-1.69) 1.08 (0.70-1.68) 1.02 (0.64-1.62) 0.95 Covariate adjusted 1.00 0.97 (0.61-1.53) 1.10 (0.69-1.75) 0.96 (0.58-1.58) 0.91
RARE/MEDIUM RARE RED MEAT 0 10 27 61 N events/N participants 45/247 57/221 57/268 50/235 Age-adjusted 1.00 1.58 (1.01-2.47) 1.18 (0.75-1.84) 1.11 (0.66-1.87) 0.92 Covariate adjusted 1.00 1.60 (1.01-2.55) 1.14 (0.72-1.81) 1.06 (0.61-1.84) 0.76
WELL/VERY WELL-DONE RED MEAT 3 9 18 45 N events/N participants 42/243 46/242 57/242 64/244 Age-adjusted 1.00 1.12 (0.70-1.80) 1.48 (0.94-2.34) 1.71 (1.05-2.79) 0.02 Covariate adjusted 1.00 1.00 (0.61-1.63) 1.34 (0.83-2.15) 1.74 (1.05-2.90) 0.01
POULTRY (Median) 5 13 23 49 N events/N participants 51/232 56/250 53/239 49/250 Age-adjusted 1.00 1.02 (0.66-1.57) 1.05 (0.67-1.65) 0.89 (0.56-1.42) 0.56 Covariate adjusted 1.00 1.08 (0.69-1.68) 1.08 (0.68-1.72) 0.94 (0.57-1.53) 0.67
FRIED POULTRY 0 1 6 12 N events/N participants 25/121 81/363 38/226 65/261 Age-adjusted 1.00 1.09 (0.66-1.81) 0.77 (0.44-1.35) 1.26 (0.74-2.15) 0.43 Covariate adjusted 1.00 1.14 (0.68-1.93) 0.72 (0.40-1.29) 1.29 (0.73-2.26) 0.47
NOT FRIED POULTRY 1 6 11 35 N events/N participants 34/153 69/327 39/172 67/319 Age-adjusted 1.00 0.96 (0.60-1.54) 1.08 (0.64-1.83) 0.99 (0.61-1.60) 0.97 Covariate adjusted 1.00 0.98 (0.60-1.61) 1.09 (0.62-1.90) 1.06 (0.63-1.77) 0.79
FISH (Median) 5 13 25 50 N events/N participants 55/236 51/248 59/243 44/244 Age-adjusted 1.00 0.85 (0.55-1.30) 1.04 (0.68-1.58) 0.70 (0.44-1.10) 0.17 Covariate adjusted 1.00 0.92 (0.59-1.45) 1.04 (0.67-1.63) 0.64 (0.40-1.03) 0.07
FRIED FISH 0 2 5 17 N events/N participants 42/186 35/194 73/332 59/259 Age-adjusted 1.00 0.73 (0.44-1.20) 0.93 (0.60-1.44) 0.96 (0.60-1.52) 0.69 Covariate adjusted 1.00 0.68 (0.40-1.16) 0.91 (0.58-1.44) 0.87 (0.53-1.41) 0.98
NOT FRIED FISH 0 2 4 16 N events/N participants 47/196 34/178 44/222 84/375
Cancer Research. on October 25, 2016. © 2016 American Association forcancerpreventionresearch.aacrjournals.org Downloaded from
Author manuscripts have been peer reviewed and accepted for publication but have not yet been edited. Author Manuscript Published OnlineFirst on September 20, 2016; DOI: 10.1158/1940-6207.CAPR-16-0070
21
Age-adjusted 1.00 0.75 (0.45-1.23) 0.80 (0.50-1.28) 0.92 (0.61-1.39) 0.71 Covariate adjusted 1.00 0.73 (0.43-1.23) 0.77 (0.47-1.26) 0.94 (0.60-1.46) 0.58
EGGS (Median) 3 7 12 39 N events/N participants 32/175 36/198 54/241 87/357 Age-adjusted 1.00 1.01 (0.59-1.71) 1.34 (0.81-2.19) 1.45 (0.91-2.32) 0.08 Covariate adjusted 1.00 0.92 (0.53-1.59) 1.23 (0.74-2.05) 1.32 (0.81-2.14) 0.16
Age-adjusted models adjusted for age at diagnosis and total energy intake. Covariate adjusted models additionally adjusted for: race, family history of prostate cancer, BMI (5 cats), smoking (never/former/current), vigorous physical activity (6 cats), total calcium intake (quartiles), cooked tomato products intake (quartiles), coffee intake (5 cats), and clinical stage (T1, T2). Models for red meat by doneness also adjust for total red meat intake.
Cancer Research. on October 25, 2016. © 2016 American Association forcancerpreventionresearch.aacrjournals.org Downloaded from
Author manuscripts have been peer reviewed and accepted for publication but have not yet been edited. Author Manuscript Published OnlineFirst on September 20, 2016; DOI: 10.1158/1940-6207.CAPR-16-0070
22
Table 4. Risk of prostate cancer recurrence (hazard ratio and 95% confidence interval) by quartile of dietary intake among 940 men with localized disease in the Washington University Genetics Study Quartile of Intake
Q1 Q2 Q3 Q4 p-
trend TOTAL RED MEAT (Median g/day) 39 70 109 180
N events/N participants 23/235 18/238 21/231 32/236 Age-adjusted 1.00 0.74 (0.40-1.37) 0.80 (0.43-1.48) 1.11 (0.59-2.09) 0.49 Covariate adjusted 1.00 0.66 (0.35-1.25) 0.69 (0.36-1.33) 0.90 (0.45-1.80) 0.89 + adj for stage, grade, PSA 1.00 0.64 (0.33-1.25) 0.84 (0.43-1.64) 0.89 (0.45-1.76) 0.94
UNPROCESSED RED MEAT 26 52 83 142 N events/N participants 17/235 23/237 20/232 34/236 Age-adjusted 1.00 1.33 (0.71-2.49) 1.10 (0.56-2.14) 1.76 (0.92-3.37) 0.09 Covariate adjusted 1.00 1.24 (0.65-2.34) 1.02 (0.51-2.03) 1.66 (0.84-3.31) 0.14 + adj for stage, grade, PSA 1.00 1.15 (0.58-2.27) 0.97 (0.48-1.97) 1.63 (0.81-3.27) 0.14
PROCESSED RED MEAT 3 8 17 36 N events/N participants 23/232 20/236 23/239 28/233 Age-adjusted 1.00 0.84 (0.46-1.53) 0.86 (0.48-1.55) 1.04 (0.48-1.88) 0.67 Covariate adjusted 1.00 0.76 (0.41-1.42) 0.78 (0.43-1.44) 0.89 (0.48-1.66) 0.99 + adj for stage, grade, PSA 1.00 0.79 (0.39-1.57) 0.81 (0.43-1.54) 0.86 (0.42-1.73) 0.87
RARE/MEDIUM RARE RED MEAT 0 10 27 61 N events/N participants 15/236 23/217 29/259 27/228 Age-adjusted 1.00 1.77 (0.92-3.40) 1.72 (0.92-3.21) 1.70 (0.89-3.25) 0.27 Covariate adjusted 1.00 1.84 (0.94-3.60) 1.59 (0.83-3.06) 1.30 (0.61-2.74) 0.89 + adj for stage, grade, PSA 1.00 1.97 (0.97-4.00) 1.63 (0.83-3.22) 1.52 (0.70-3.27) 0.61
WELL/VERY WELL-DONE RED MEAT 3 9 18 45 N events/N participants 23/238 18/236 26/232 27/234 Age-adjusted 1.00 0.75 (0.41-1.40) 1.05 (0.60-1.84) 1.01 (0.57-1.81) 0.67 Covariate adjusted 1.00 0.65 (0.34-1.24) 0.88 (0.49-1.58) 0.84 (0.45-1.57) 0.97 + adj for stage, grade, PSA 1.00 0.55 (0.29-1.08) 0.55 (0.30-1.04) 0.57 (0.28-1.15) 0.38
POULTRY 5 13 23 49 N events/N participants 22/224 22/243 28/231 22/242 Age-adjusted 1.00 0.85 (0.47-1.54) 1.14 (0.65-2.03) 0.77 (0.41-1.42) 0.44 Covariate adjusted 1.00 0.88 (0.48-1.60) 1.23 (0.68-2.23) 0.79 (0.41-1.52) 0.50 + adj for stage, grade, PSA 1.00 0.98 (0.53-1.82) 1.18 (0.63-2.22) 0.80 (0.40-1.59) 0.27
FRIED POULTRY 0 1 6 12 N events/N participants 10/116 33/356 15/214 36/254 Age-adjusted 1.00 1.04 (0.51-2.12) 0.71 (0.32-1.58) 1.45 (0.71-2.97) 0.15 Covariate adjusted 1.00 1.00 (0.49-2.07) 0.58 (0.26-1.34) 1.29 (0.61-2.73) 0.28 + adj for stage, grade, PSA 1.00 1.09 (0.51-2.34) 0.67 (0.28-1.61) 1.29 (0.59-2.82) 0.45
NOT FRIED POULTRY 1 6 11 35 N events/N participants 16/147 29/316 21/165 28/312 Age-adjusted 1.00 0.75 (0.41-1.39) 1.10 (0.57-2.13) 0.68 (0.36-1.28) 0.27 Covariate adjusted 1.00 0.79 (0.42-1.49) 1.22 (0.61-2.45) 0.76 (0.39-1.48) 0.42 + adj for stage, grade, PSA 1.00 0.79 (0.41-1.52) 0.89 (0.43-1.85) 0.71 (0.36-1.40) 0.40
Cancer Research. on October 25, 2016. © 2016 American Association forcancerpreventionresearch.aacrjournals.org Downloaded from
Author manuscripts have been peer reviewed and accepted for publication but have not yet been edited. Author Manuscript Published OnlineFirst on September 20, 2016; DOI: 10.1158/1940-6207.CAPR-16-0070
23
FISH 5 13 25 50 N events/N participants 22/228 24/241 28/234 20/237 Age-adjusted 1.00 1.02 (0.57-1.82) 1.18 (0.67-2.06) 0.74 (0.40-1.36) 0.29 Covariate adjusted 1.00 1.10 (0.61-1.99) 1.38 (0.77-2.46) 0.84 (0.45-1.58) 0.55 + adj for stage, grade, PSA 1.00 0.93 (0.50-1.74) 0.94 (0.51-1.72) 0.83 (0.43-1.63) 0.61
FRIED FISH 0 2 5 17 N events/N participants 10/181 19/188 35/322 30/249 Age-adjusted 1.00 1.90 (0.88-4.08) 1.93 (0.95-3.91) 1.98 (0.96-4.11) 0.26 Covariate adjusted 1.00 1.73 (0.79-3.79) 1.87 (0.91-3.85) 1.82 (0.87-3.82) 0.37 + adj for stage, grade, PSA 1.00 1.72 (0.76-3.89) 1.59 (0.76-3.35) 1.49 (0.70-3.21) 0.76
NOT FRIED FISH 0 2 4 16 N events/N participants 23/189 17/170 21/216 33/365 Age-adjusted 1.00 0.75 (0.40-1.41) 0.78 (0.43-1.40) 0.70 (0.41-1.20) 0.34 Covariate adjusted 1.00 0.77 (0.40-1.46) 0.83 (0.44-1.54) 0.86 (0.48-1.52) 0.90 + adj for stage, grade, PSA 1.00 0.77 (0.39-1.52) 0.68 (0.35-1.29) 0.78 (0.44-1.40) 0.75
EGGS 3 7 12 39 N events/N participants 11/171 16/188 26/235 41/346 Age-adjusted 1.00 1.18 (0.55-2.56) 1.59 (0.78-3.23) 1.69 (0.85-3.35) 0.15 Covariate adjusted 1.00 0.99 (0.45-2.18) 1.37 (0.67-2.84) 1.46 (0.72-2.94) 0.22 + adj for stage, grade, PSA 1.00 0.63 (0.27-1.47) 0.91 (0.43-1.92) 0.96 (0.45-2.03) 0.44
Age-adjusted models adjusted for age at diagnosis and daily energy intake. Covariate adjusted models additionally adjusted for: race, family history of prostate cancer, BMI (5 cats), smoking (never/former/current), vigorous physical activity (6 cats), total calcium intake (quartiles), cooked tomato products intake (quartiles), and coffee intake (5 cats). + adj for stage, grade, PSA models are covariate adjusted models with additional adjustment for pathological stage (T2, T3a, T3b), Gleason sum (2-6, 3+4, 4+3, 8-10), and PSA at diagnosis (0-4.0, 4.1-10.0, >=10.1)
Cancer Research. on October 25, 2016. © 2016 American Association forcancerpreventionresearch.aacrjournals.org Downloaded from
Author manuscripts have been peer reviewed and accepted for publication but have not yet been edited. Author Manuscript Published OnlineFirst on September 20, 2016; DOI: 10.1158/1940-6207.CAPR-16-0070
24
FIGURE LEGENDS Figure 1. Hazard ratio1 for recurrence and odds ratio for high grade2 or advanced stage3 prostate cancer (and 95% confidence intervals) associated with substituting 30 grams/day of poultry or fish for 30 grams/day of red meat or eggs among men in the Washington University Genetics Study 1. Jemal A, Siegel R, Ward E, Hao Y, Xu J, Thun MJ. Cancer statistics, 2009. CA Cancer J Clin. 2009;59(4):225-49. doi: 10.3322/caac.20006. PubMed PMID: 19474385. 2. SEER Cancer Statistics Review, 1975-2013, National Cancer Institute. Bethesda, MD. 3. Park SY, Murphy SP, Wilkens LR, Henderson BE, Kolonel LN. Fat and meat intake and prostate cancer risk: the multiethnic cohort study. International journal of cancer Journal international du cancer. 2007;121(6):1339-45. doi: 10.1002/ijc.22805. PubMed PMID: 17487838. 4. Rohrmann S, Platz EA, Kavanaugh CJ, Thuita L, Hoffman SC, Helzlsouer KJ. Meat and dairy consumption and subsequent risk of prostate cancer in a US cohort study. Cancer causes & control : CCC. 2007;18(1):41-50. PubMed PMID: 17315319. 5. Schuurman AG, van den Brandt PA, Dorant E, Goldbohm RA. Animal products, calcium and protein and prostate cancer risk in The Netherlands Cohort Study. British journal of cancer. 1999;80(7):1107-13. doi: 10.1038/sj.bjc.6690472. PubMed PMID: 10362125; PubMed Central PMCID: PMC2363036. 6. Rodriguez C, McCullough ML, Mondul AM, Jacobs EJ, Chao A, Patel AV, et al. Meat consumption among Black and White men and risk of prostate cancer in the Cancer Prevention Study II Nutrition Cohort. Cancer epidemiology, biomarkers & prevention : a publication of the American Association for Cancer Research, cosponsored by the American Society of Preventive Oncology. 2006;15(2):211-6. doi: 10.1158/1055-9965.EPI-05-0614. PubMed PMID: 16492907. 7. Michaud DS, Augustsson K, Rimm EB, Stampfer MJ, Willet WC, Giovannucci E. A prospective study on intake of animal products and risk of prostate cancer. Cancer causes & control : CCC. 2001;12(6):557-67. PubMed PMID: 11519764. 8. Augustsson K, Michaud DS, Rimm EB, Leitzmann MF, Stampfer MJ, Willett WC, et al. A prospective study of intake of fish and marine fatty acids and prostate cancer. Cancer epidemiology, biomarkers & prevention : a publication of the American Association for Cancer Research, cosponsored by the American Society of Preventive Oncology. 2003;12(1):64-7. PubMed PMID: 12540506. 9. Sinha R, Park Y, Graubard BI, Leitzmann MF, Hollenbeck A, Schatzkin A, et al. Meat and meat-related compounds and risk of prostate cancer in a large prospective cohort study in the United States. American journal of epidemiology. 2009;170(9):1165-77. doi: 10.1093/aje/kwp280. PubMed PMID: 19808637; PubMed Central PMCID: PMC2781742. 10. Chavarro JE, Stampfer MJ, Hall MN, Sesso HD, Ma J. A 22-y prospective study of fish intake in relation to prostate cancer incidence and mortality. The American journal of clinical nutrition. 2008;88(5):1297-303. PubMed PMID: 18996866; PubMed Central PMCID: PMC2843087. 11. Richman EL, Stampfer MJ, Paciorek A, Broering JM, Carroll PR, Chan JM. Intakes of meat, fish, poultry, and eggs and risk of prostate cancer progression. The American journal of clinical nutrition. 2010;91(3):712-21. doi: 10.3945/ajcn.2009.28474. PubMed PMID: 20042525; PubMed Central PMCID: PMC3132069.
Cancer Research. on October 25, 2016. © 2016 American Association forcancerpreventionresearch.aacrjournals.org Downloaded from
Author manuscripts have been peer reviewed and accepted for publication but have not yet been edited. Author Manuscript Published OnlineFirst on September 20, 2016; DOI: 10.1158/1940-6207.CAPR-16-0070
25
12. Chan JM, Holick CN, Leitzmann MF, Rimm EB, Willett WC, Stampfer MJ, et al. Diet after diagnosis and the risk of prostate cancer progression, recurrence, and death (United States). Cancer causes & control : CCC. 2006;17(2):199-208. doi: 10.1007/s10552-005-0413-4. PubMed PMID: 16425098. 13. Richman EL, Kenfield SA, Stampfer MJ, Giovannucci EL, Chan JM. Egg, red meat, and poultry intake and risk of lethal prostate cancer in the prostate-specific antigen-era: incidence and survival. Cancer prevention research. 2011;4(12):2110-21. doi: 10.1158/1940-6207.CAPR-11-0354. PubMed PMID: 21930800; PubMed Central PMCID: PMC3232297. 14. Eeles RA, Olama AA, Benlloch S, Saunders EJ, Leongamornlert DA, Tymrakiewicz M, et al. Identification of 23 new prostate cancer susceptibility loci using the iCOGS custom genotyping array. Nat Genet. 2013;45(4):385-91, 91e1-2. doi: 10.1038/ng.2560. PubMed PMID: 23535732; PubMed Central PMCID: PMC3832790. 15. Kunzmann AT, Coleman HG, Huang WY, Cantwell MM, Kitahara CM, Berndt SI. Fruit and vegetable intakes and risk of colorectal cancer and incident and recurrent adenomas in the PLCO cancer screening trial. International journal of cancer Journal international du cancer. 2016;138(8):1851-61. doi: 10.1002/ijc.29922. PubMed PMID: 26559156. 16. Kirsh VA, Hayes RB, Mayne ST, Chatterjee N, Subar AF, Dixon LB, et al. Supplemental and dietary vitamin E, beta-carotene, and vitamin C intakes and prostate cancer risk. J Natl Cancer Inst. 2006;98(4):245-54. doi: 10.1093/jnci/djj050. PubMed PMID: 16478743. 17. Subar AF, Thompson FE, Kipnis V, Midthune D, Hurwitz P, McNutt S, et al. Comparative validation of the Block, Willett, and National Cancer Institute food frequency questionnaires : the Eating at America's Table Study. American journal of epidemiology. 2001;154(12):1089-99. PubMed PMID: 11744511. 18. Chan JM, Van Blarigan EL, Kenfield SA. What should we tell prostate cancer patients about (secondary) prevention? Curr Opin Urol. 2014;24(3):318-23. doi: 10.1097/MOU.0000000000000049. PubMed PMID: 24625429; PubMed Central PMCID: PMC4084902. 19. Giovannucci E, Liu Y, Platz EA, Stampfer MJ, Willett WC. Risk factors for prostate cancer incidence and progression in the health professionals follow-up study. International journal of cancer Journal international du cancer. 2007;121(7):1571-8. doi: 10.1002/ijc.22788. PubMed PMID: 17450530; PubMed Central PMCID: PMC2430098. 20. Pham TM, Fujino Y, Kubo T, Ide R, Tokui N, Mizoue T, et al. Fish intake and the risk of fatal prostate cancer: findings from a cohort study in Japan. Public health nutrition. 2009;12(5):609-13. doi: 10.1017/S1368980008003182. PubMed PMID: 18664313. 21. Tang D, Liu JJ, Rundle A, Neslund-Dudas C, Savera AT, Bock CH, et al. Grilled meat consumption and PhIP-DNA adducts in prostate carcinogenesis. Cancer epidemiology, biomarkers & prevention : a publication of the American Association for Cancer Research, cosponsored by the American Society of Preventive Oncology. 2007;16(4):803-8. doi: 10.1158/1055-9965.EPI-06-0973. PubMed PMID: 17416774; PubMed Central PMCID: PMC2132437. 22. Koutros S, Cross AJ, Sandler DP, Hoppin JA, Ma X, Zheng T, et al. Meat and meat mutagens and risk of prostate cancer in the Agricultural Health Study. Cancer epidemiology, biomarkers & prevention : a publication of the American Association for Cancer Research, cosponsored by the American Society of Preventive Oncology. 2008;17(1):80-7. doi: 10.1158/1055-9965.EPI-07-0392. PubMed PMID: 18199713; PubMed Central PMCID: PMC2935655. 23. John EM, Stern MC, Sinha R, Koo J. Meat consumption, cooking practices, meat mutagens, and risk of prostate cancer. Nutrition and cancer. 2011;63(4):525-37. doi: 10.1080/01635581.2011.539311. PubMed PMID: 21526454; PubMed Central PMCID: PMC3516139.
Cancer Research. on October 25, 2016. © 2016 American Association forcancerpreventionresearch.aacrjournals.org Downloaded from
Author manuscripts have been peer reviewed and accepted for publication but have not yet been edited. Author Manuscript Published OnlineFirst on September 20, 2016; DOI: 10.1158/1940-6207.CAPR-16-0070

26
24. Punnen S, Hardin J, Cheng I, Klein EA, Witte JS. Impact of meat consumption, preparation, and mutagens on aggressive prostate cancer. PloS one. 2011;6(11):e27711. doi: 10.1371/journal.pone.0027711. PubMed PMID: 22132129; PubMed Central PMCID: PMC3223211. 25. Major JM, Cross AJ, Watters JL, Hollenbeck AR, Graubard BI, Sinha R. Patterns of meat intake and risk of prostate cancer among African-Americans in a large prospective study. Cancer causes & control : CCC. 2011;22(12):1691-8. doi: 10.1007/s10552-011-9845-1. PubMed PMID: 21971816; PubMed Central PMCID: PMC3403708. 26. Cross AJ, Peters U, Kirsh VA, Andriole GL, Reding D, Hayes RB, et al. A prospective study of meat and meat mutagens and prostate cancer risk. Cancer research. 2005;65(24):11779-84. doi: 10.1158/0008-5472.CAN-05-2191. PubMed PMID: 16357191. 27. Abid Z, Cross AJ, Sinha R. Meat, dairy, and cancer. The American journal of clinical nutrition. 2014;100 Suppl 1:386S-93S. doi: 10.3945/ajcn.113.071597. PubMed PMID: 24847855; PubMed Central PMCID: PMC4144110. 28. Zheng W, Lee SA. Well-done meat intake, heterocyclic amine exposure, and cancer risk. Nutrition and cancer. 2009;61(4):437-46. doi: 10.1080/01635580802710741. PubMed PMID: 19838915; PubMed Central PMCID: PMC2769029. 29. Trafialek J, Kolanowski W. Dietary exposure to meat-related carcinogenic substances: is there a way to estimate the risk? Int J Food Sci Nutr. 2014;65(6):774-80. doi: 10.3109/09637486.2014.917146. PubMed PMID: 24828131. 30. Yang M, Kenfield SA, Van Blarigan EL, Batista JL, Sesso HD, Ma J, et al. Dietary patterns after prostate cancer diagnosis in relation to disease-specific and total mortality. Cancer prevention research. 2015;8(6):545-51. doi: 10.1158/1940-6207.CAPR-14-0442. PubMed PMID: 26031631; PubMed Central PMCID: PMC4452958. 31. Jakobsen MU, O'Reilly EJ, Heitmann BL, Pereira MA, Balter K, Fraser GE, et al. Major types of dietary fat and risk of coronary heart disease: a pooled analysis of 11 cohort studies. The American journal of clinical nutrition. 2009;89(5):1425-32. doi: 10.3945/ajcn.2008.27124. PubMed PMID: 19211817; PubMed Central PMCID: PMC2676998. 32. Pan A, Sun Q, Bernstein AM, Schulze MB, Manson JE, Stampfer MJ, et al. Red meat consumption and mortality: results from 2 prospective cohort studies. Archives of internal medicine. 2012;172(7):555-63. doi: 10.1001/archinternmed.2011.2287. PubMed PMID: 22412075; PubMed Central PMCID: PMC3712342. 33. Hu FB, Rimm EB, Stampfer MJ, Ascherio A, Spiegelman D, Willett WC. Prospective study of major dietary patterns and risk of coronary heart disease in men. The American journal of clinical nutrition. 2000;72(4):912-21. PubMed PMID: 11010931.
Cancer Research. on October 25, 2016. © 2016 American Association forcancerpreventionresearch.aacrjournals.org Downloaded from
Author manuscripts have been peer reviewed and accepted for publication but have not yet been edited. Author Manuscript Published OnlineFirst on September 20, 2016; DOI: 10.1158/1940-6207.CAPR-16-0070
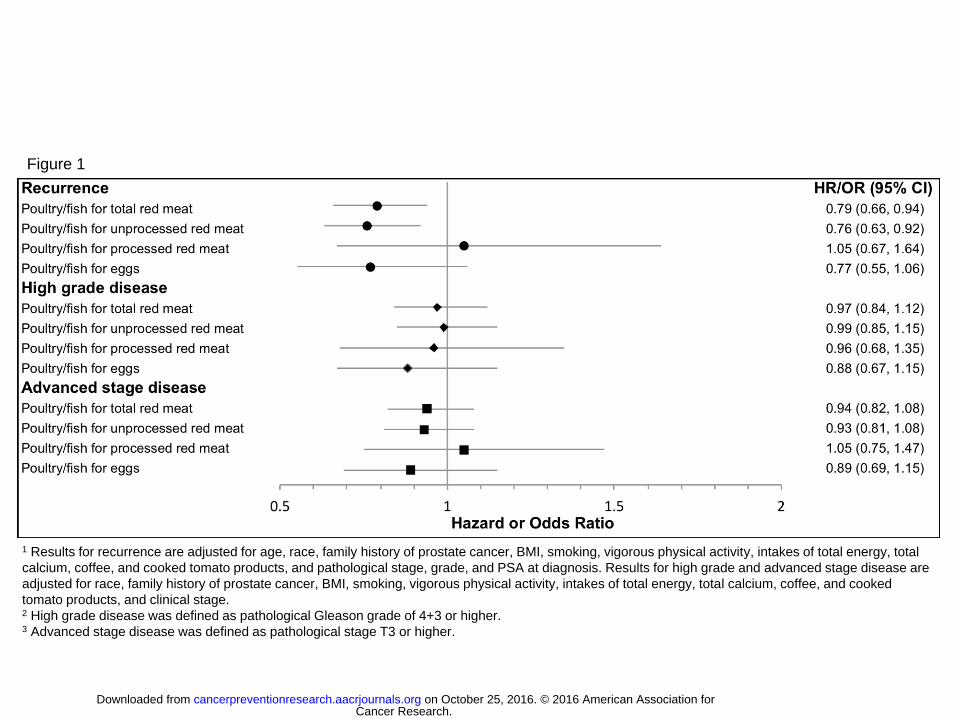
1 Results for recurrence are adjusted for age, race, family history of prostate cancer, BMI, smoking, vigorous physical activity, intakes of total energy, total
calcium, coffee, and cooked tomato products, and pathological stage, grade, and PSA at diagnosis. Results for high grade and advanced stage disease are
adjusted for race, family history of prostate cancer, BMI, smoking, vigorous physical activity, intakes of total energy, total calcium, coffee, and cooked
tomato products, and clinical stage. 2 High grade disease was defined as pathological Gleason grade of 4+3 or higher. 3 Advanced stage disease was defined as pathological stage T3 or higher.
Figure 1
Cancer Research. on October 25, 2016. © 2016 American Association forcancerpreventionresearch.aacrjournals.org Downloaded from
Author manuscripts have been peer reviewed and accepted for publication but have not yet been edited. Author Manuscript Published OnlineFirst on September 20, 2016; DOI: 10.1158/1940-6207.CAPR-16-0070
Published OnlineFirst September 20, 2016.Cancer Prev Res Kathryn M. Wilson, Lorelei A. Mucci, Bettina F. Drake, et al. prostate cancer progressionMeat, fish, poultry, and egg intake at diagnosis and risk of
Updated version
10.1158/1940-6207.CAPR-16-0070doi:
Access the most recent version of this article at:
Manuscript
Authoredited. Author manuscripts have been peer reviewed and accepted for publication but have not yet been
E-mail alerts related to this article or journal.Sign up to receive free email-alerts
Subscriptions
Reprints and
To order reprints of this article or to subscribe to the journal, contact the AACR Publications
Permissions
To request permission to re-use all or part of this article, contact the AACR Publications
Cancer Research. on October 25, 2016. © 2016 American Association forcancerpreventionresearch.aacrjournals.org Downloaded from
Author manuscripts have been peer reviewed and accepted for publication but have not yet been edited. Author Manuscript Published OnlineFirst on September 20, 2016; DOI: 10.1158/1940-6207.CAPR-16-0070