authority this page is unclassified - defense … · of acoustic power in a 100-hz band centered at...
TRANSCRIPT

UNCLASSIFIED
AD NUMBERAD382670
CLASSIFICATION CHANGES
TO: unclassified
FROM: confidential
LIMITATION CHANGES
TO:
Approved for public release, distributionunlimited
FROM:
Distribution authorized to U.S. Gov't.agencies and their contractors;Administrative/Operational Use; 15 JUN1967. Other requests shall be referred toNaval Research Labs., Arlington, VA 22203.
AUTHORITY30 Jun 1979, DoDD 5200.10; NRL ltr, 4 Apr1981
THIS PAGE IS UNCLASSIFIED

SECURITY-MARKING
The classified or limited status of this repodl applies
to each page, unless otherwise marked,.Separate page printoutsMUST be markei accordingly.
THIS DOCUMENT CONTAINS INFORMATION AFFECTING THE NATIONAL DEFENSE OFTHE UNITED STATES WITHIN THE MEANING OF-THE ESPIONAGE LAWS, TITLE 18,U.S.C., SECTIONS 793 AND 794. THE tRANSMISSION OR THE REVELATION OFITS CONTENTS IN ANY MANNER TO AN UNAUTHORIZED PERSON IS PROHIBITED BYLAW.
NOTICE: When governmentor other -drawings, specifications or otherdata Ure used for any purpose other than in connection with a defi-nitely related goirernment:-procurement operation, the U. S. Government'therbby incurs no respodnsibility, nor any obligation whatsoever; andthe.fact that the Government may have formulatfed. furnished, or in anyway sUp.plied the said draifings, specifications., or other data is notto be regarded by implication or otherwise as in any manner licensingthe .holder or any other person or corporat-ion, or conveying any rightsor permission to manufacture, use or sel1 any patented invention thatmay 4- i way be re:ated~thereto.
IA
4 4, rt
I
* ~Ut
~ -<
KY0 4 -' .-
s <snve -*
£CnW ~ lieu
'1
(malL - ~NI) C. P.. iWCMt5$
~ BpQj;Th .. . -
;44%d .~%tt
*--2
1mr~*~ 15. ~ 7 y
b1% \ ~'
-~ ~\ 'I
ii
V ' --- u~C)
t~.
C- .3
sf4
N ~ ~ IAt~ *C tAAyC
-. . 4 .
- t*~ ~ - . -.

CONFIDENTIAL
ICONTENTS
Abstract iiProblem Status iiAuthorization ii
INTRODUCTION
INITIAL TESTS WITH A ONE-WAVELENGTHSQUARE ARRAY 3
THE INTERIM 15-MODULE ARRAY 7ACOUSTIC INTERACTIONS 12
PERFORMANCE OF THE COMPLETED ARRAY 19
Power Tests of the Completed andModified Source 19
Acoustic Calibration 27
CONCLUSIONS AND RECOMMENDATIONS 44
Conclusions 44Suggested Areas for Further Investigatioak 46
REFERENCES 47
.
CONFIDENTIAL
CONFIDENTIAL
ABSTRACT[Confideniial]
The Artemis acoustic source w'.s desigued to meet the requirements foran ocean surveillance study program. These requirements included a sourcelevel of 152 dB in a 100-Hz band centered at 400 Hz with a transducer oper-ating depth of 1200 feet. The transducer, which was completed in June 1964,is a rectangular planar array 33 feet v,[de and 50 feet higL. It is composed of1440 variable-reluctance elements whicn are driven in parallel from a linearelectronic amplifier. The source is installed aboard a modified T-2 classtanker having a well amidship through which the transduce3r array is loweredand retrieved.
Initial tests of the partially completed source had revealed a severeacoustic interaction problem which imposed a restriction on the operatingpower level. A study program was initiated and experiments were conductedto investigate the interaction behavior and to discover means to alleviate itseffects. Results demonstrated that improved performance could be obtainedby modifying the original series-paral*lei connection of elements to an all-parallel form. The indicated modification was performed concurrent with thecompletion of the transducer array.
Measurements performed on the completed and modified transducer re-sulted in a set e' recommended safe power levels which depend upon fre-quency. Operation at the recommended maximum power with pulsed sinusoidsat 420 Hz, the favorable frequency, produces a source level of 147 dB refer-enced to one dyne per square centimeter at one yard. Operation at other fre-qurncies is more limited in power, particularly at the upper end of the fre-quc -y band.
An acoustic calibration of the source, accomplished with the aid ofhydrophones mounted on the end of a 190-foot boom, defined the transferfunction in a vertical plane through the acoustic axis out to the first minorlobe. Correlation functions were obtained between the input signal and theacoustic output using pseudorandom signals. It is concluded that the acousticsource introduces negligible distortion in this type of signal.
PROBLEM STATUS
This is an interim report on the Project Ar.emis acoustic source, workis continuxing.
AUTHORIZATION
NRL Problem S02-11Project ONR RS 046
Manuscript submitted December 28, 1966.
ii CONFIDENTIAL
_ - -

*CONFIDENTIAL
PROJECT ARTEMIS ACOUSTIC SOURCE[Unclassified Title]
INTRODUCTION
The ocean surveillance study program, Project Artemis, initiated by the Office ofNaval Research in 1958, required a very high power, deep acoustic source. The acous-tic requirements established. for the projector called f(,r a capability of radiating 1000 kWof acoustic power in a 100-Hz band centered at 400 Hz with pulse lengths of 10 to 60 sec-onds at a 10% duty cycle. Beamwidth to the half-power points was to be 20 degi ees inthe horizontal plane and 12.5 degrees in the vertical plane. ThJs combination of powerand beamwidth would result in a source level of approximately 152 decibels relative to1 microbar at 1 yard (dB//1 gbar at 1 yd). The acoustic axis was to have a fixed orienta-tion of 11 degrees above the horizontal plane.
Several proposals for the projector were considered, the final selection being a rec-tangular plane array 33 feet wide by 50 feet high composed of 1440 variable-reluctancetransducer elements. Eacn element is nearly cubical, being 11-1/8 inches square on theradiating face and 11-3/4 inches deep. They are assembled in frames in which 72 ele-ments are closely packed in 12 rows by six columns. Each assembly, referred to as amodule, is approximately 6 feet wide. by 12 feet high. The completed array consists offar rows of modules with five modules in each row. The modules are mounted on asuitable array frame which provides the proper tilt angle of the radiating face and sup-ports auxiliary components associated with the electrical input to the elements. Radia-tion to the rear of the array is suppressed by a system of pressure compensated, flat-tened, gas-filled tubes which serve as acoustic pressure releases on the rear faces ofthe elements.
A photograph of the completed arr"ay is shown in Fig. 1. The array structure is in-stalled in a modified T2-SE-A2 class tanker, the USNS Mission Capistrano (T-AG 162).The modification included the installation of a well amidships through which the trans-ducer array can be lowered to depths as great as 1200 feet. When the ship is in transit,the array is stowed within the well. The source ship is equipped with the necessary me-chanical equipment for lowering and raising the array and for handling the connectingelectrical c bles. It also carries suitable electrical power generating equipment and thelinear electronic driver for the transducer (1,2).
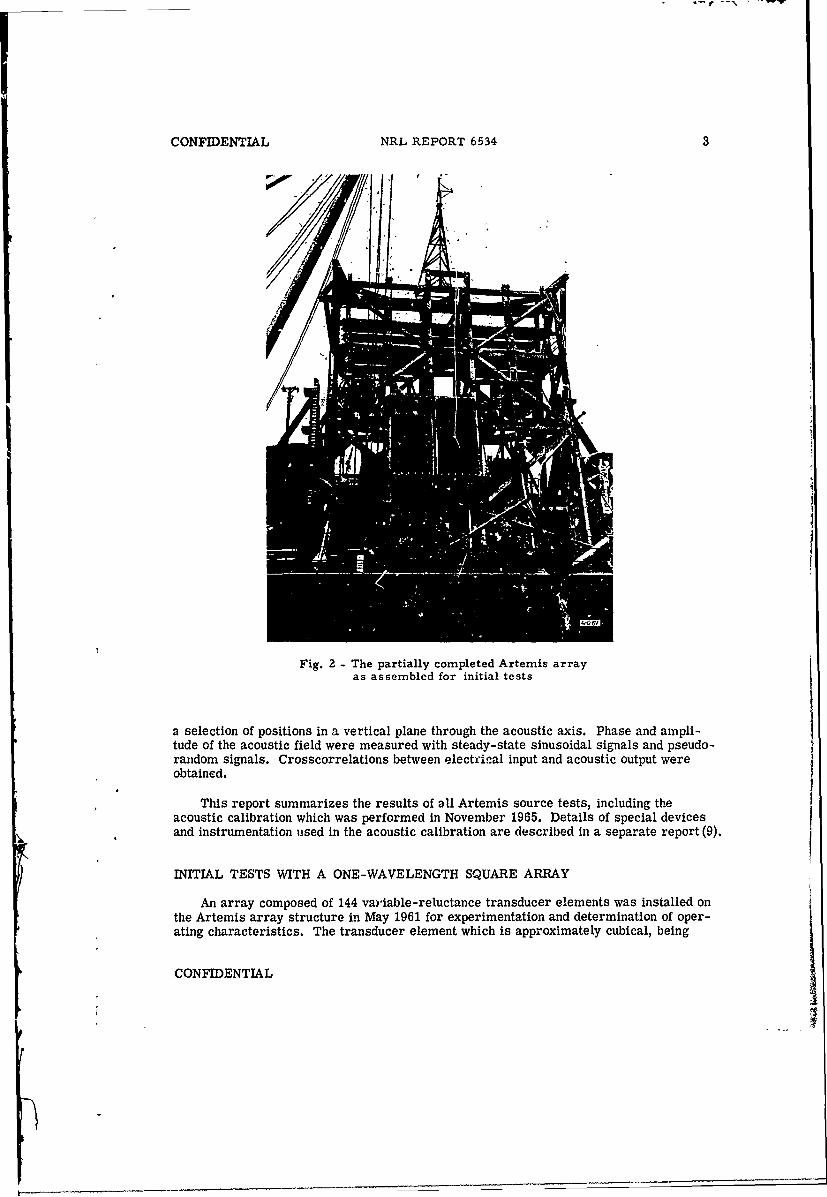
An initial test (3) of the source facility was conducted in May and June 1961. At thattime only two of the projected 20 elements had been installed, as shown in Fig. 2. Thepurpose of this test was to obtain impedance characteristics, response curves, effi..ciency, and linearity data. In addition, accelerometers were used to monitor the dy-namic displacement of the radiating faces of two of the elements during part oft .ne tests.During the experiment, tests indicated that a number of the transducer elements weredamaged. This damage was the result of excessive deflection and subsequent fatiguefailure of the transducer element springs. Accelerometer measurements revealed largevariations in radiating mass disp lacements, with the majority in excess of predictedvalues. These results prompted further tests (4) in June 1961 in which displacementamplitude and phase were monitored at 23 element positions. The results of these andsubsequent trials are treated in following sections of this report.
CONFIDENTIAL
,.U

2 FERRIS AND ROLLINS CONFIDENTIAL
Fig. I - The Artemis transducer array
After the initial tests had been completed, the array was enlarged by the installationof 13 additional transducer modules forming three rows of five modules each, as shownin Fig. 3. Evaluation (5) of the larger array configuration was conducted during Septem-ber and October 1961. While enlarging the array resulted in improved operating char-acteristics with respect to acoustic loading and displacement distribution, the permissi-ble operating power level was still severely restricted by abnormally high transducerdisplacements. It became evident that the apparently anomalous behavior was caused byacoustic interaction effects.
A program of experiments (6) and theoretical studies (7) was initiated at this pointto further define the interaction problem and to evaluate several possible solutions. Theresults of this study demonstrated the desirability of changing the electrical drive of theelements from the initial series-parallel conformation to an all-parallel connection.Subseqtiently, when the array was completed by the addition of the top row of five trans-ducer modules in June 1964, the electrical connection of elements was modified to aparallel connection for the entire array. Tests (8) of the completed and modified arrayduring July 1964 confirmed that a substantial increase in input power capacity had beenachieved, although the maximum allowable power was a marked function of frequency.Except for superficial measurements of sound field amplitudes, acoustic tests were de-ferred pending the availability of an adequate means of positioning the bydrophones stablyand accurately in the acoustic field
An acoustic calibration was performed during November 1965. A 190-foot rigidboom pivoted at the base of the array enabled the positioning of monitor hydrophones at
CONFIDENTIAL
'p
CONFIDENTIAL NRL REPORT 6534 3
Fig. 2 - The partially completed Artemis arrayas assembled for initial tests
a selection of positions in a vertical plane through the acoustic axis. Phase and ampli-tude of the acoustic field were measured with steady-state sinusoidal signals and pseudo-random signals. Crosscorrelations between electrical input and acoustic output wereobtained.
This report summarizes the results of all Artemis source tests, including theacoustic calibration which was performed in November 1965. Details of special devicesand instrumentation used in the acoustic calibration are described in a separate report (9).
INITIAL TESTS WITH A ONE-WAVELENGTH SQUARE ARRAY
An array composed of 144 va),iable-reluctance transducer elements was installed onthe Artemis array structure in May 1961 for experimentation and determination of oper-ating characteristics. The transducer element which is approximately cubical, being
CONFIDENTIAL

4 FERRIS AND ROLLINS CONFIDENTIAL
II
Fig. 3 - The interim 15-moduleArtemis transducer array
11-1/8 inches square or. the radiating face by 11-3/4 inches deep, is a type TR-11C,manufactured to Naval Research Laboratory specification by Massa Division, DynamicsCorporation of America. The transducers were assembled in modules six elements wideby 12 elements high. Two such modules were mounted side by side on the array struc-ture, as shown in Fig. 2. The six elements in each module row were electrically con-nected in series with the 12 rows connected in parallel. The two modules were then con-nected in parallel in an oil-filled junction box. Thus, fhe array consisted of 24 parallelgroups of six elements in series. The dc polarizing power, as well as the Ac power, was
supplied to this group. Each element was polarized with 10 amp of direct current.Acoustic pressure release was provided at the rear (opposite of side shown in Fig. 1) ofthe modules by flattened-tube resonant reflectors. The tubes were six feet long and ex-tended horizontally acrosr the back of each row of six transducer elements. The flat-tened tubes were approximately six inches wide, thus covering about one-half of the rearradiating surface of the transducers. The tubes were separated approximately one-halfinch from the rear face of the array. In order to prevent the tubes from collapsing underambient pressure, they were filled with nitrogen gas from a regulated system. The samepressure-release configuration is in use on the present completed array. However, thetubeL... "'e been replaced by an improved design and are now filled with dry air ratherthan nitrogen.
Experimental work with these two modules was conducted during May and June 1961.Two operating areas were used. One was in the Chesapeake Bay near Cape Charles,
CONFIDENTIAL

CONFIDENTIAL NRL REPORT 6534 5
Virginia, at a water depth of 90 feet. The maximum possible operating depth to the cen-ter of the two modules was approximately 40 feet. The second operating area was in theAtlantic Ocean northeast of the Bahamas at approximately 28 0 N, 74 0 W.
Acoustic data were recorded from two monitor hydrophones. One was mounted on aboom which placed it on the center line 28 feet in front of the array. The second hydro-phone was also on the center line, 17 feet behind the array. This hydrophone was at thefarthest point on the array structure, behind the two modules.
Accelerometers were attached to the radiating faces of two transducer elements inorder to monitor displacement amplitudes. In a later experiment, all of the pressure-release tubes were removed to permit attachment of accelerometers to a larger samplIof elements. Therefore, although the acoustic data to be presented for this experimenLwere obtained with pressure-release tubes in place, the displacement data were obtainedwith the tubes removed, thus allowing radiation both to ihe front and to the rear.
The array response characteristics and efficiency for a constant input current of30 amp is illustrated in Fig. 4. The power output was computed from the measured in-tensity on the acoustic axis and from an assumed directivity index computed for a one-wavelength square piston. The system response for a constant voltage input to the am-plifier is shown in Fig. 5. Except for small deviations from smooth curves, the responsecharacteristics appear normal and the efficiercy is high. However, during the experi-ments, tests on the transducer elements indicated that several had failed. These failuresapparently were the result of excessive deflections which resulted in failure of the trans-ducer springs. When the displacements of the elements' radiating faces were examined,
35 - 100DEPTH-40OFT1,,c
3 0 AMP
30 30)
z
________/__IEFFICENCY I&
-- 3
20, POWER IPOWER OUT
200 300 400 tOO 600FREQUENCY "IHz)
Fig. 4 - Response characteristics of the two-module Artemis array
CONFIDENTIAL

RFERRIS AND OLLINS CONFIDENTIAL
+2
1 )
0
I SYSTEM Q=2.6I
-4>-
z
0
x
i-
- 12240 300 40O0 500 600
FREQUENCY H_)
Fig. 5 -Voltage responbe of the two-module Artemis array,amplifier matched to 34 jZ2Q, transducer current responseand impedance data taken at 400 ft depth with 1a, = 30 amp
it was apparent that both phase and amplitude had wide variations from element to ele-ment and that the pattern was a function of frequency. It is assumed that deviations inthe response curves resulted from the variations in element displacement. Typicalphase and amplitude patterns for five frequencies with1in the operating band are illus-trated in 'Fig, 6. The element positions, for which these data were obtained, are those ofthe first eight elements at the top of the third column from the left, when facing the ar-ray. The uppermost element in the column occupies position one. The dashed line ineach amplitude plot represents the average value of the data presented in that plot. In anarray of displacement-limited elements having a nonuniform displacement distribution,the pwer input is limited to a value which does not result in a displacement greater thanan acceptable value in the element having the largest displacement. Since the displace-ment is proportional to the square root of the power, an element having double the nor-mal displacement limits the allowable power to one-fourth the normal value for uniformdisplacements.
At the time of these tests, instrumentation was not available to monitor transducerspring deflections. The transducer springs support a reaction mass, within a watertight
~housing, which serves as the radiating mass. Fatigue failure of the springs is the factorwhich limits the operating power level of these elements. Measurement of the outermass displacement serves as an indication of the uniform behavior of the elements, butit will be shown that there is not a one-to-one correspondence between outer mass dis-placement and spring deflection.
CONFIDENTIAL
A -

CONFIDENTIAL NRL REPORT 6534 7
2The effectiveness of the pressure-release tubes was confirmed by comparing 260 Hz 300 360 Hz
the source levels on the axis and recipro-cal axis. The results of these measure- '-.. 100 i I -
0 which were performed for variouse, input current from 5 to 30 amp, 0 260
are shown in Fig. 7. 9 23H300 380 Hz
.. . ........ oo
THE INTERIM 15-MODULE o0-360ARRAY o 260U
400H 300 400 HzBy the summer of 1961 a sufficient , 4 2 _oo
number of transducer modules were avail- 100........ ooable to permit enlargement of the array to = wO-360
a configuration of three rows of modules -o, Q 260with five modules in each row. A photo- ographof the arraywith 15modules installed 420 Hz D 420Hz
is shown in Fig. 3. The installation of the V , _ 00
fourth or top row of modules remained to a 0-3,0
complete the array. The enlarged array 260was to be used in propagation experimentspending the availability of the lp.st five 440Hz 300 440Nzmodules. Four oil-filled component tanks ,2,o00 -d }
and a junction box were installed in the 00360
base of the array structure. The double- ------ 0-360
armored cables which provide power and 0 1 2 3 4 5instrumentation connections from the ship ELEMENT POSITION ELEMENT POSITION
to the transducer were terminated in the Fig. 6 - Displacement amplitude andjunction box. phase of the radiating faces for one
column of elements in the two-moduleConnections are made witidn the junc- Artemis array
tion box to distribute the power and instru-mentation conductors to the four compo-nent tanks. The junction box also housesremotely operated contactors which can connect or disconnect power to each tank. Eachcomponent tank serves one row of transducer modules and houses the necessary electri-cal components to appropriately transform and distribute the signal current and the po-larizing current -,, each module in the row it serves. It also contains sensors whichmeasure these currents and transmit the information for remote indication. Polarizingpower is transmitted from the ship to the component tanks as three-phase 60-Hz alter-nating current. A 12-phase silicon diode rectifier in each component tank rectifies the
kalternating current to provide a 10-amp polarizing: current to each of the transducer ele-ments. Each component tank contains a transformer having five secondary windings,which distributes the signal current through appropriate tuning and blocking capacitorsto each of the five modules in the row served by that tank. The transformer primariesare connected in parallel in the junction box. Since three rows of modules were installedon the interim array, only three of the four component tanks were used at that time.Pressure release was accomplished at the transducer's rear face in the same manneras in the two-module array.
The array was driven by a 1300-kW linear electronic amplifier. Although only oneamplifier was used with the interim 15-module source, four identical amplifiers are
CONFIDENTIAL
LI

8 FERRIS AND ROLLINS CONFIDENTIAL
5-30-61-80DEPTH 40OFT10C 5-30AMP
tT30
25---
o /2C
isi0
o AVERAGE VALUE
LIMITS OF DATA
200 300 400 500 600 700FREQUENCY (Hz)
Fig. 7 -Ratio of acoustic pressures in front andto the rear of the two-module Artemis array
available on the ship for driving the completed array. Their outputs can be paralleled inany combination of from one to four amplifiers.
Tests of the 15-module array were conducted in the Cape Charles area of the Ches-apeake Bay at a water depth of 80 feet, at 27 0 28'N latitude and 75 0 19'W longitude at awater depth of 2540 fathoms, and at various areas within Exuma Sound. The purpose ofthe shallow-water tests in the Chesapeake Bay was to check the operations of the acous-tic source and instrumentation. All data to be presented were obtained in deep wateroperations.
Thirty-five accelerometers were available for measurement of displacement phaseand amplitude. These were moved to sample the displacements of the radiating massesof 81 elements in selected locations, principally in the upper-left-hand quadrant of thearray. In addition, one transducer element was specially instrumented with an acceler-ometer on its inner, or reaction, mass. Current sensors were placed in series witheach row of elements in each of two modules. The outputs of the system current sensors,which monitor the ac and dc currents to each module, were also available. Crude acous-tic measurements were obtained by suspending a hydrophone from a small boat at arange of approximately 60 yards. The hydrophone was moved in azimuth and depth untila maximum response indicated a position on the acoustic axis. The range was measuredacoustically.
CONFIDENTIAL
I

CONFIDENTIAL NRL REPORT 6534
With steady-state sinusoidal drive, the current was measured in each of the 12 rowsof elements in the module located in the geows trical center of the array. Figure 8 illus-trates the results at each of 15 discrete frequencies. An approximately sinusoidal pat-tern with a repetition interval equal to the sound wavelength in water is apparent. Theo-retical studies of the radiation loading, as modified by acoustic interactions, show asimilar pattern having acoustic load maximums spaced at approximately one-wavelengthintervals across the face of an array.. It is very probable that acoustic loading patternsresulting from interactions are responsible for the variations in current with elementposition. However, the data illustrated in Fig 8 are somewhat complicated by the factthat the current in each. row is determined by the loading on a row of six series-connected elements. Thus, variations of element displacement throughout the array arepartly due to acoustic loading interactions ind partly to electrical impedance interactions.
The distribution of displacement amplitude and phase was more uniform in the en-larged array than in the two-module array. However, peak displacements were stillmuch larger than those predicted for a fuly loaded, uniformly vibrating piston producingthe same power output. This was particularly evident in the upper half of the frequencyband. The elements to which accelerometers were attached are marked with X's in thediagram of Fig. 9. In the four following illustrations, rows of elements are numberedfrom the top and columns from the left. Figures 10a and 10b illustrate the displacementsobserved in two instrumented rows and one instrumented column of elements at frequen-cies of 400 Hz and 430 Hz, respectively. Corresponding diagrams of phase are illus-trated in Figs. lla and 11b. These are typical of patterns observed at other frequencieswith a noted tendency for less uniform patterns in the upper half of the frequency band.Again,' interpretation of the phase and amplitude data is complicated by the series-parallel connection of elements. As was previously noted, the displacement amplitude of
.3 - 1 4
3 395 42 445
f i l I I I I . .
-"J"410 ? III I it
.3 .... ...
.2 - _ X
4- 91 137 1 137 1 12 1i i i i
_,400 425------
c2
J405\1 4303
.4 -,
.3- P4359
1 3 5791, 1 35 7911 1 3 5791 122ROW NO. ROW NO ROW NO. 12 3458
Fig. 8 - Current distribution in Fig. 9 - Accelerometer locationsseries-connected rows of elements (marked with crosses), modulein one module of the 15-module identification, and element rowArtemis array and column enumeration for the
15-module Artemis array
CONFIDENTIAL

10 FERRIS AND ROLLINS CONFIDENTIAL
.2RO 81.2 ROW 18
08- 08
E 04 0 4
COUNI COLUMN I51.2 1.2
08-~ 08
ROW I ROW I12 2 (bW
(a) 0808- 0
04 0 04
G ' 3 4 67 9 10 it12 3141516r7 18 1 2 1 134,'51617 IS
ELEMENT POSITION (EDGE TOWARD CENTER) ELEMENT P JSITION iEDbE TOWARD CENTER)
Fig. 10 -Displacemen. amplitude patterns for the 15-module array
320 ~~ROW 18 ~CRW1280 280-
240 " 240
zoo- 300-
1 60-
220
ROW I ROWI1
2L0- 60lfrLf t22 ()220 (bW
81 23 45 6 78 9 10 11 1.' 3141516f?18 12 34 56?7 8 910 11 12 1314 15 16 1718ELEMENT POSITION (EDGE TOWARD CENTER) ELEMENT POSITION (EDGE TOWARD CENTER)t
Fig.l11 - Displacenient phase patterns for the 15-module arrayj
the radiating mass cannot be directly related to power limitation, since it is the trans-ducer spring deflection which limits pow::. Figure: 12 and 13 illustrat: the observedrelations of inner and outer mass displacement and phase, respectively, for an element
strumented element containing an accelerometer on. the inner mass. Since the transducersprings are between the inner and outer masses, the vector sum of the mass displace-nents is equal to the spring deflection. It is apparent that there Ls not a on~e-to-one re-lation between outer mass displacement and spring deflection as the frequency is varied.
impractical to obtain a wide sampling of spring deflections over the elements of the
CONFIDENTIAL

CONFIDENTIAL NRL REPORT 6534 1
x OUR MASS
0INRMASS
I0.7
W063
Fig.12 isplcemnt aplitude~ ~ ~ ~~ ofteinran ue 5-masse forone lemet inthe L5i.Al ar60 37w8 9 0 1 2 3 4 5 6
IL-IIS
w180
1590
I.j
w 60
a30-
Fig. 13 -Displacement phase of the0- inner and outer masses for one ele-
7X nent in the 15-module array
z
-
w 90-
0-ow- INNER MASS 414040404!
L 15-~ OUTER MASS
350 360 370 380 30404040404040
CONFIDENTIAL

12 FERRIS AND ROLLINS CONFIDENTIAL
array. Quantitative limits on power, therefore, were not available. The wide variationin outer mass displacements, however, revealed an unsatisfactory operating condition.
Results of this test, which disclosed a severe interaction problem, prompted the ini-tiation of an experimental and a theoretical program to gain a better understanding of theproblem and to develop a technique for coping with interactions in the Artemis array.
ACOUSTIC INTERACTIONS
A series of tests were conducted to investigate the effectiveness of three techniquesfor reducing the effects of acoustic interaction on the velocity distribution among ele-ments in the Artemis array. The first method consisted of bonding a group of elementsinto a subassembly to effectively increase the size of the unit element. This should havethe effect of increasing the self-acoustic loading of the unit element and thus reduce therelative contribution of the interaction loading. A minimum element size of one-half-wavelength square was indicated by the work of Rusby (10). The second approach was touse a parallel electrical connection of transducer elements as opposed t the series-parallel configuration of the original array. The parallel connection pc.rmits a currentdistribution in which the current through an element is inversely proportional to the ele-ment impedance; thus, an element with high electrical impedance resulting from lowacoustic loading caused by the interaction field would receive a lower drive current thanan element with low impedance resulting from high loading. In the original series-parallel configura'ion the current through an element was controlled by the total imped-ance of six series-connected elements and thus was not subject to the self-limiting actioninherent in an all parallel connections. The third technique used parallel connected ele-ments which were individually tuned by means of series capacitors to reduce the suscep-tibility to variations in loading. This method has been shown to be effective in an arrayof piezoelectric projectors by Carson, et al. (11).
The first test series was conducted during May 1962 in the Cape Charles area of theChesapeake Bay at a water depth of 90 feet. Operations were performed aboard the USSHunting (EAG 398), a Laboratory research vessel, the experimental array being loweredthrough a well amidships. The experimental array for this test series consisted of anominally one-wavelength square array of 144 elements. Subassemblies of transducerelements were fabricated by mechanically bonding the sides of several elements togetherto make a single larger radiating element. There were three such subassemblies, one of36 elements in a six-by-six configuration, and two of 12 elements in three-by-four con-figurations. The remaining spaces in the transducer array were filled by individual ele-ments. Nine elements each in the upper-right-hand and lower-left-hand quadrants of the36 element assembly were modfied by the addition of accelerometers attached to theinner masses. Each of the 18 elements was provided with two internal accelerometers,one at the top edge and one at the bottom edge of the inner mass. In addition, each of the36 elements in the subassembly was modified by the addition of a stainless steel slug in-serted in the lower face on the cable entrance end of each element. This slug was cen-tered below an existing slug in the center of each transducer face and, like the existingslug, was provided with a tapped hole to which an accelerometer could be attached. FThus, provision was made for monitoring the displacement at two points on the outermnass of each of the 36 elements and at two points on the inner mass of each of 18 ele-
ments. Each of the 12 elements in one of the smaller subassemblies was similarly in-strumented, as were three of the individual elements. Suitable electric cables were pro-vided to permit a series-parallel connection as in the Artemis array, or an all-parallelconnection of any group of 36 elements.
CONFIDENTIAL

CONFIDENTIAL NRL REPORT 6534 13
The second test series was conducted during July 1962 at the Navy Electronics Lab-oratory Pend Oreille Calibration Station at Bayview, Idaho. Two experimental arrays,each approximately one -half wavelength square, were investigated. One array was the36-element consolidated subassembly us2d in the Chesapeake Bay tests, whereas theother consisted of 36 unconsolidated elements. The unconsolidated array contained 18specially instrumented elements of the same type and in the same configuration as in theconsolidated array. The 36 elements in each array were connected in parallel by meansof transformers and 36 extension cables. Provisions were made for inserting tuning ca-pacitors in series with each element. As in the Chesapeake Pay tests, flattened, gas-filled tubes were installed approximately 8 inches behind each row of elements to sup-press acoustic radiation to the rear. Details of the experimental procedures for bothtest series are presented in Ref. 5.
The effect on the uniformity of outer mass displacement of electrical connection,individual t-ming, and consolidation of elements is shown in Figs. 14a through 14d. Inthese figures the average values of d~splacemrents are shown as circled points, whereasthe range of observed values is indicated by the shaded region. All values in Figs. 14athrough 14c have been normalized to 1 kW electrical ;nput power. Values in Fig. 14dhave been normalized to 1 kW acoustic power. Figure 14a, which illustrates the charac-teristics the series-parallel, unconsolidated configuration, serves as a reference toevaluate the degree of improvement. Figure 14b illustrates the improvement in displace-ment uniformity obtained by the use of an all-parallel electrical connection. When theiniividuAl elements were tuned by inserting a 5 LF capacitor in series with each elemert,the effects shown in Fig. 14c were obtained. Tuning resulted in an improved distributionat the upper end of the frequency band with a slight worsening at some other frequencies.Consolidation of the elements, with the results shown in Fig. 14d, tended to reduce thespread of the displacement data. However, the maximum values were not reduced at all,frequencies.
It was previously pointed out that the transducer spring deflections in the TR-11 ele-ment are not directly related to outer mass displacement. Exampls of the spring de-flections observed in these tests are illustrated in Figs. 15a through 15d. Again, thecircled points represent average values and the shaded area represents the range ofvalues. Spring deflections in the control group, that is, the series-parallel, unconsoli-dated configuration, are shown in Fig. 15a. Figures 15b, 15c, and 15d illustrate the ef-fects of parallel connection, tuning, and consolidation as indicated in the figures. Thehigh vaJues of spring deflection observed in the consolidated group at frequencies in theneighborhood of 370 Hz result from a nonrectilinear, or rocking, motion of the innermass. This mode of oscillation, while present in all groups, is ac( ented by consolidation.
The average acoustic powers per element which would result in spring deflections of10 mils peak to peak were computed for the various test 'onfifp.rations. Figures 16 and17 illustrate the results of these computations. It can be obse.xved that the parallel con-nection of unconsolidated elements, without individual tuning, yields the best overall re-sults. Although individual tuning effects an improvement at the upper end of the fre-quency band, the improvement, when considering the band as a whole, is marginal.
The results of this test were extrapolated to predict the improvement to be expectedif the full 2-1/2 by 4 wavelength Artemis array were modified to an all-parallel electri-cal interconnection and the elements either group tuned or individually tuned. The pre-dicted source levels are plotted in Fig. 18, along with the source level for the series-parallel configuration.
CONFIDENTIAL

14 FERRIS AND ROLLINS CONFIDENTIAL
i
2.0-
0.5
ILIuo5
350 • A. 370 380 390 41,0 410 420 430 440 450FREQUEIUCY (Wz)
Fig. 14a - 36-element unconsolidated group in X x X array, series-parallel connection, displacement values normalized to 1 kW elec-trical power. Circled points indicate average values, shaded areaindicates range of values.
2.0
.5
1,,
I- I
0.-350 360 370 360 390 400 410 420 430 440 450
FREQUENCY (Hz)
Fig. 14b - Same as above with "series-parallel connection"changed to: parallel-group tuned connection
CONFIDENTIAL
i

CONFIENTIAL NRL REPORT 6534 1
4
V-
0
En
1.
W5 6 7 8 9 0 1 2 3 4 5
0
0
.5
350 360 370 380 390 400 410 420 430 440 450FREQUENCY (HZ)
Fig. 14d - 36-element consolidated array, parallel-group tunedconnection, displacement values normalized to 1 kW acousticpower. Circled points indicate average values, shaded area in-dicates range of values.
CONFIDENTIAL

16 FERRIS AND ROLLINS CONFIENTIAL
14 -- - - -
12-
1-
4
j
0
- 15--70 30 30 0 1 40 40 44 -L
FRQECY(Z
1-
C
0
0336 6 7 8 9 0 2 2 3 4 5
FRQECY(*jI
-JJ35 6 7 8 9 0 1 2 3 4 5
FRQECY(z
Fi.1b-w-lretucnsldtdary aallgru ue onetovle oraie o1k
U ,osi oe.Crldpit niaeaeaevl
ue hddae niatsrneo aus
CC-NTA

4
CONFIDENTIAL NRL REPORT 6534 17
14
12 -
-
0
350 360 370 380 390 400 410 420 430 440 450
Fig. 15c - Same as l5b with "parallel-group tunedconnection" changed to: parallel-individually tuned(5/ iF) array
, 14
.12 -
0O
14
W
l0'
-
U
-I
II I,
04CC,
350 360 3"0 380 390 400 410 420 430 440 450FRECUENCY (HIz)
Fig. 15d - Same as 15b with "unconsolidated"changed to: consolidated
CONFIDENTIAL

18 FERRIS AND ROLLINS CONFIDENTIAL
25-
-o _ --. "-ii
I....- -. -..o 0 -
10
5 SERIES- PARALLEL CONNECTION36-ELEMENT CONSOLIDATED GROUP IN XxX ARRAY36-ELEMENT UNCONSOLIDATED GROUP IN XX. ARRAY
.......... 12-ELEMENT CONSOLIDATED BARE GROUP IN XXX ARRAY0I I I I I I I
350 360 370 380 390 400 410 420 430 440 450FREQUENCY (HZ)
Fig. 16 - Average acoustic power per element with arraylimited to a maximum spring deflection of 10 mils peakto peak
,15
• PARALLEL-GROUP TUNED CONNECTIONPARALLEL-,NDIVIDUALLY TUNED CONNECTION (5F) Fig. 17 - Average acoustic
0 -PARALLEL-INDIVIDUALLY TUNED CONNECTION (3.3#F1 poe -e leetwto power per element with
36-ELF.MENT CONSOLIDATED ARRAY array limited to a maxi-mum spring deflection of
2- 10 mils peak to peak
i
350 360 370 380 390 400 410 420 430 440 450
FREQUENCY (Hz)
CONFIDENT]Al,
- --- .-.--- ~--_ _ _ _ _ ---
CONFIDENTIAL NRL REPORT 6534 19
148 - I I i {
' PARALLEL + 5,F INDIVIDUAL TUNING G
1461,4 I 1
. 42 ,3 / - - - - -14 4 N -l
02i
~1 SERIES-PARALLEL
P_ -Ri It
350 360 370 360 390 400 410 420 430 440 450FREOUENUY (Hz)
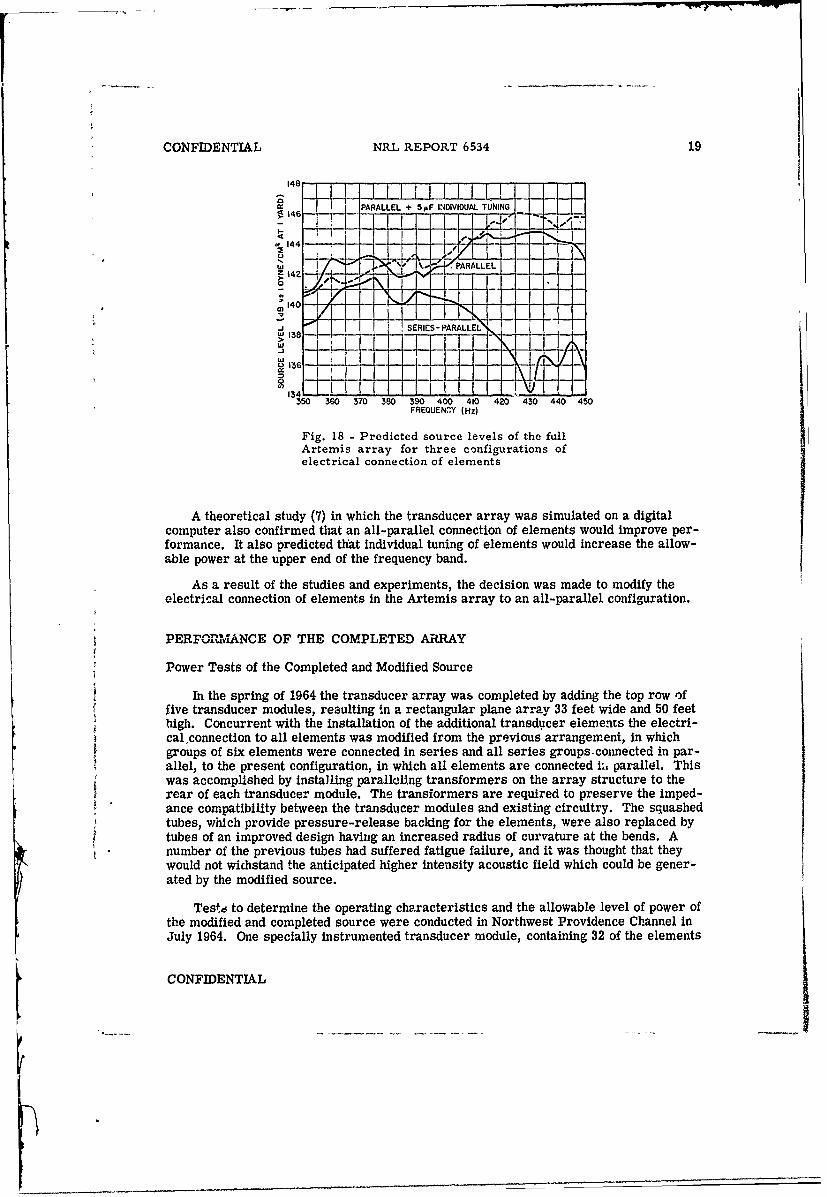
Fig. 18 - Predicted source levels of the fullArtemis array for three configurations ofelectrical connection of elements
A theoretical study (7) in which the transducer array was simulated on a digitalcomputer also confirmed that an all-parallel connection of elements would improve per-formance. It also predicted that individual tuning of elements would increase the allow-able power at the upper end of the frequency band.
As a result of the studies and experiments, the decision was made to modify theelectrical connection of elements in the Artemis array to an all-parallel configuration.
PERFORMANCE OF THE COMPLETED ARRAY
Power Tests of the Completed and Modified Source
In the spring of 1964 the transducer array was completed by adding the top row offive transducer modules, resulting in a rectangular plane array 33 feet wide and 50 feethigh. Concurrent with the installation of the additional transducer elements the electri-calconnection to all elements was modified from the previous arrangement, in whichgroups of six elements were connected in series and all series groups.connected in par-allel, to the present configuration, in which all elements are connected i:. parallel. Thiswas accomplished by installing paralloling transformers on the array structure to therear of each transducer module. The transformers are required to preserve the imped-ance compatibility between the transducer modules and existing circuitry. The squashedtubes, which provide pressure-release backing for the elements, were also replaced bytubes of an improved design having an increased radius of curvature at the bends. Anumber of the previous tubes had suffered fatigue failure, and it was thought that theywould not wichstand the anticipated higher intensity acoustic field which could be gener-ated by the modified source.
Test*d to determine the operating characteristics and the allowable level of power ofthe modified and completed source were conducted in Northwest Providence Channel inJuly 1964. One specially instrumented transducer module, containing 32 of the elements
CONFIDENTIAL

20 FERRIS AND ROLLINS CONFIDENTIAL
which had been modified by the installation of internal and external accelerometers, wasinstalled in module position two, that is, the second position from the left in the top rowivhen facing the front of the array. During the tests the special module was moved se-quentially to positions 8, 14, 20, and 11, as shown in Fig. 19. Positions of the instru-mented elements within the test module are indicated by the cross-checked areas. Ateach position the array was driven with continuous waves, the current being held constantas the frequency was stepped over the operating band. Spring deflections were computedfrom the recorded inner and outer mass displacement of each instrumented element. Inaddition, provision was made for summing the inner and outer mass displacements forfive of the instrumented elements in order to monitor spring deflections of those ele-ments when the array was driven by broadband signals. Array impedance was computedfrom the measured voltage, current, and power input. The array was submerged to adepth of 600 feet during these tests.
The resistive and reactive components of array impedance are plotted in Fig. 20.The impedance data were obtained at a constant current of 50 amp except at frequencieshigher than 445 Hz, where it was reduced to 25 amp.
The mean and maximum observed spring deflections for continuous wave excitationare illustrated in Fig. 21. The distributions of spring deflections, which have been di-vided by the mean at each frequency, are plotted for eight illustrative frequencies inFig. 22. It can be observed from both of these plots that there is a wide spread between
0456 7 8 9 0035
W %
i30
S25-
it 1 13 14 15 2U20
zX
15-
16 17 18 19 20 510
340 360 380 400 420 440 460 .80 500
___FREOUENCY (Hz)
Fig. 19 - ,.rrangement of in- Fig. 20 - Resistive and reactivestrumented elements (marked impedance components for theby crosses) during tests of the completed Artemis arraycompleted Artemis array
CONFIDENTIAL
[I

CONFIDENTIAL NRL REPORT 6534 21
W
0
o-
0
MAXIMUM- .6.0MU
z2
'a MEAN-j
S4.0a
i,
C2.0
340 360 380 400 420 440 460 480 500FREOUENCY (Hz)
Fig. 21 - Mean and maximum observed springdeflections with continuous-wave excitation forthe completed Artemis source
60-
40-
N
20-
0 1 2 0 10 L 2 0 1 2350 Hz 365 Hz 380 Hz 395 Hz
40-
N 20
1 2 0 1 2 0 1 2 0 1 2405 Hi 420 HZ 435 Hz 450 Hz
Fig. 22 - Distribution of spring deflectionsin the completed Artemis source
CONFIDENTIAL
-wr
22 FERRIS AND ROLLINS CONFIDENTIAL
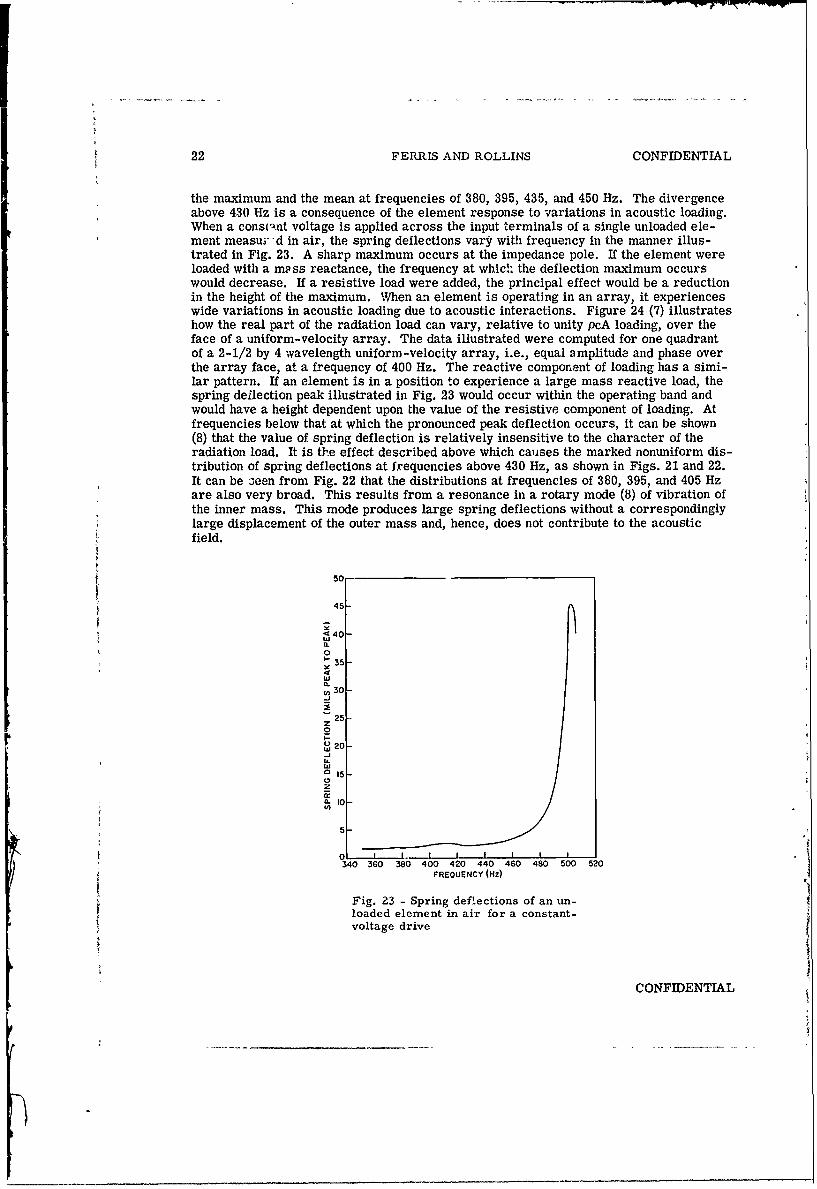
the maximum and the mean at frequencies of 380, 395, 435, and 450 Hz. The divergenceabove 430 Hz is a consequence of the element response to variations in acoustic loading.When a constant voltage is applied across the input terminals of a single unloaded ele-ment measur d in air, the spring deflections vary with frequency in the manner illus-trated in Fig. 23. A sharp maximum occurs at the impedance pole. If the element wereloaded with a mpss reactance, the frequency at whic!h the deflection maximum occurswould decrease. If a resistive load were added, the principal effect would be a reductionin the height of the maximum. When an element is operating in an array, it experienceswide variations in acoustic loading due to acoustic interactions. Figure 24 (7) illustrateshow the real part of the radiation load can vary, relative to unity pcA loading, over theface of a uniform-velocity array. The data illustrated were computed for one quadrantof a 2-1/2 by 4 wavelength uniform-velocity array, i.e., equal amplitude and phase overthe array face, at a frequency of 400 Hz. The reactive component of loading has a simi-lar pattern. If an element is in a position to experience a large mass reactive load, thespring deflection peak illustrated in Fig. 23 would occur within the operating band andwould have a height dependent upon the value of the resistive component of loading. Atfrequencies below that at which the pronounced peak deflection occurs, it can be shown(8) that the value of spring deflection is relatively insensitive to the character of theradiation load. It is the effect described above which causes the marked nonuniform dis-tribution of spring deflections at frequencies above 430 Hz, as shown in Figs. 21 and 22.It can be jeen from Fig. 22 that the distributions at frequencies of 380, 395, and 405 Hzare also very broad. This results from a resonance in a rotary mode (8) of vibration ofthe inner mass. This mode produces large spring deflections without a correspondinglylarge displacement of the outer mass and, hence, does not contribute to the acousticfield.
f50
45
<40
0I- 335
IL, 30-
z 25
~ 0_1-o
z
i cna. I0
5
o I I. I I I I I I
340 360 380 400 420 440 460 480 500 520FREOUENCY (Hz)
Fig. 23 - Spring deflections of an un-loaded element in air for a constant-voltage drive
CONFIDENTIAL

CONFIENTIAL NRL RE.PORT 6534 23
21/2X BY 4XONE QUJADRANT OF ARRAYEQUAL VELOCITYka ELEMENT DIMENSION -0.24
kx - 7.73kARRAY DIMENSIONS -12.57
AIR RESONANT FREQUENCY -~ 0.27
04 030.20/2 ,,Q aO4
/7 06 050.3 (/ (, ( ......... ........ 0Z6
07 06
0 0
09 0.8. . .
04.
0.4 5 0 .7 8 .0.6 . . 0.4 .
AV.069
Fig. 24 . .a par o .th raitinlodoon qarat fa niom-elctyara
.C. .NF..I. .EN..T. .AL0

24 FERRIS AND ROLLINS CONFIDENTIAL
Since the power limitation for these elements is imposed by fctigue of the elementsprings, the maximum allowable electrical power input can be extrapolated from themaximum observed deflection at a known input power at each frequency. Manufacturer'stests and experimental results indicate that a peak-to-peak deflection of 0.01 inch isapproximately the maximum safe value. The application oi a O-1, cafety factor reducesthe maximum value to 0.007 inch. This estimated safety factor is required to allow forthe size of the statistical sample and for the transient overshoot when the input signal ispulsed. The power input required to produce a maximum peak-to-peak spring deflectionof 0.007 inch is plotted in Fig. 25. The corresponding maximum allowable voltage inputto the driving amplifiers.is plotted in Fig. 26. Since the voltage gain of the amplifiers isadjustable, the input voltage is.given as a relative value referenced to the maximum al-lowable voltage at 380 Hz for the particular amplifier gain employed during the test. Theamplifier input-output relations were obtained with a constant voltage input over the fre-quency range to two amplifiers connected in parallel to the transducer load. The dataplotted in Fig. 26 have been extrapolated to the value required to produce the maximumallowaule input power at each frequency.
At the conclusion of the experiments an endurance run was conducted consisting of 2accumulated hours of operation each at frequencies of 350, 415, 430, and 450 Hz withpower levels of 200, 400, 300, and 120 kW electrical input, respectively. The powerlevels employed were based on preliminary analysis of the data and were somewhat
* higher at 430 Hz and 450 Hz than presently recommended. A check of the elements, fol-lowing the endurance tests, revealed that two elements had been damaged.
When the array was energized with a phase-reversal modulated pseudorandom sig-nal, an examination of the oscillographic records of element mass displacements re-vealed a very nearly linear relationship between tne signal voltage waveform and theexternal mass displacement. The spring deflections, however, showed no recognizablecorrespondence. Large peak values of deflection occurred at apparently random inter-vals in the sequence. Measurements of the maximum excursion of the deflection valuesindicated that the maximum allowable rms current input is 85 amp. It is recognized thatthe radiation loading patterns existing with steady-state excitation do not apply for mod-ulated signal waveforms. At the present levl of understanding, it is not possible to pre-dict the maximum power level for modulated waveforms from steady-state measure-ments. Additional experiments (9) conducted during the acoustic calibration testsdisclosed that maximum allowable power for pseudorandom signal excitation dependsupon a number of variables. The results presented in Table 1 show the variation in al-lowable power into the array for 12 different modulated signal types. All the signalsemployed were pseudorandom in some sense, but they differed from each other in thefollowing respects:
Center frequency 380, 400, 420 Hz
Modulation frequency 100, 80, 50, 42 Hz
Filtering 350-450 Hz, 350-430 Hz
Method of modulation PM, FSKI PRN
The phase-modulated (PM) signals were obtained by using a shift register output to co-herently phase modulate a carrier frequency f0. The carrier phase was zero or 180 de-grees, depending upon whether the shift register output was zero or one. The centerfrequency could be changed from the normal value of 400 to 380 Hz or to 420 Hz, and thefilters at the output could be changed to pass the band from 350 to 450 Hz or from 350 to430 Hz. The modulation frequency could also be varied by changing the shift register
CONFIDENTIAL

CONFIENTIAL NRL REPORT 6534 25
40
z
0
0
0
C-
W100-
350 370 390 410 430 450 470FREQUENCY (HI
Fig. 25 - Maximum allowable power input to thecompleted Artemis array for pulsed sinusoids
~0
-140-
350 370 390 410 430 450 .470FREQUENCY (Hz)
Fig. 26-Relative maximum allowable voltage inputto the completed Artemis source for pulsed sinusoids
CONFIENTIAL

26 FERRIS AND ROLLINS CONFIDENT'IAL
rate from 100 to 80 Hz or to 50 Hz, thus clanging the length (in cycles) of the signal bitfrom four to five and eight, respectively. The frequency shift keying signal (FSK) wasmodulated by the same shift register, but the modulation process consisted of shiftingthe carrier frequency between 380 and 420 Hz in a phase-coherent manner. The pseudo-random noise (PRN) signal was generated by the NRL pseudonoise generator, which is ashift register operating at a 3.2-kHz clock rate. A 100-Hz band centered at 400 Hz wasselected by filtering the generated signal. In a second mode of operation, the filteredsignal was clipped and filtered again through a 100-Hz bandpass filter, resulting in alower peak-to-rms ratio.
Table 1Allowable Power Input for Various Modulated Signals
1 Shift Modulation Center Filter AllowableNum Tion Reg. Rate Freq. Bandwidth Powerber Type* Length (Hz) (Hz) (Hz) (kW)
1 PRS 12 100 400 350-450 1822 PRS 12 100 400 350-430 2323 PRS 12 100 380 350-450 262
4 PRS 12 100 420 350-450 2295 PRS 7 100 400 350-450 2456 PRS 12 80 400 350-450 257"7 PRS 11 50 380 350-450 2688 PRS 11 50 420 350-450 3079 PRS 11 50 400 350-450 342
10 PRN - wide band 400 350-450 11011 PRN - 100 400 350-450 237
clipped andfiltered
12 FSK 11 42 400 350-450 385
*PRS = Phase reversal modulated pseudorandom signals; PRN= NRL pseudorandom noise
signals; FSK = frequency-shift keying.
The allowable power tabulated in Table 1 is the maximum allowable power based onthe largest spring deflection of any sampled element. One trend evident in the table in-dicates that, for a given center frequency and modulation, the allowable power increasesas the bandwidth decreases. This and other relationships in the tabulated results, suchas those concerning center frequency and shift register length, are difficult to explainand indicate a need for further investigation of the simultaneous effects of signal wave-form, element response, and acoustic interactions. However, the results do illustrate astrong dependence of allowable power input on signal characteristics.
It is interesting to compare the performance of the Artemis array with the perform-ance of one element represented by its electrical analog equivalent circuit. Such a com-parison is shown in Fig. 27. The upper broken curve represents the allowable continuous-wave input power to one element; assuming constant acoustic loading of unity pcA. Thelower broken curve represents the allowable continuous-wave power into the elementwhen the worst-case acoustic loading situation at each frequency is chosen. The worst-Lase condition is determined by varying the real and imaginary parts of the acousticradiation impedance over the range estimated for the Artemis source (zero to 1.0 pcAfor the real part and - 0.3 to + 0.3 pcA for the reactive part). The solid line represents
CONFIDENTIAL

CONFIDENTIAL NRL REPORT 6534 27
60 ANALOGUE ANALYSIS WITH
UNITY pCA LOADING
58-
-- EXPERIMENTAL,. ,..... ,-"DATA WITH
56 CONTINUOUSe WAVE INPUT
o 54-
52 ANALOGUE ANALYSIS WITH-5 CONTINUOUS WAVE INPUT
W0
C" EXPERIMENTAL DATA
WITH PRS INPUT ANALOGUE ANALYSIS48 WITH PRS INPUT
I-.
w-JW 46
i : ~~~~~~44 1 I I I I I I I I .I I350 360 370 380 390 400 410 420 430 440 450 460
FREQUENCY (Hz)
Fig. 27 - Comparison of allowable power for theArtemis array and one ar.alog equivalent element
tthe curve of maximum allowable input power determined from experimental measure-ments with specially instrumented elements in the complete array in the field. The dip
tin the experimental curve at 400 Hz results from the excitation of a rotary mode of vi-bration in the element. This exemplifies a shortcoming in the analog circuit analysis,since the equivalent circuit did not include this degree of freedom. The experimental andanalog curves are in reasonable agreement otherwise, when it is considered that they areboth c*ibject to inherent errors. The principal uncertainty in the experimental curve re-suits from the small size of the statist ical sample of elements; i.e., approximately 10%of the elements were instrumented. On the other hand, the analog data suffer from theIack of certainty concerning the range and combination of repl and imaginary componentsof acoustic loading values and the approxiration of the equivalent circuit to the actualelement. A similar analysis was made using phase-modulated pseudorandom signals.The maximum allowable PRS powers, as determined from experimental measurementson the array and from the analog circuit tests with the assumed loading, are plotted aspoints in Fig. 27. It can be seen that the two methods agree within I dB. This is a sur-prisingly good agreement considering that only fixed loacs, whose range of values wasderived from steady-state computations, were used. Further studies concerning the na-ture of transient loading effects are needed before conclusions can be drawn regardingthe adequacy of this technique.
Acoustic Calibration
Field Patterns - Acoustic field measurements were obtained using three hydro-phones mounted on a spar attached to a 190-foot boom. The boom was provided with alatching mechanism to insure positional accuracy of the hydrophones. Three latchedpositions were provided which, with the three hydrophones, gave nine fixed measurement
CONFIDENTIAL
F{28 FERRIS AND ROLLINS CONFIDENTIAL
points at depression angles relative to the acoustic axis of: -2.5, 0, 2.5, 5, 7.5, 10, 17.5,20, and 22.5 degrees. Some additional measurements were made at intermediate non-latched positions. Details of the measurement technique will be found in Ref. 9.
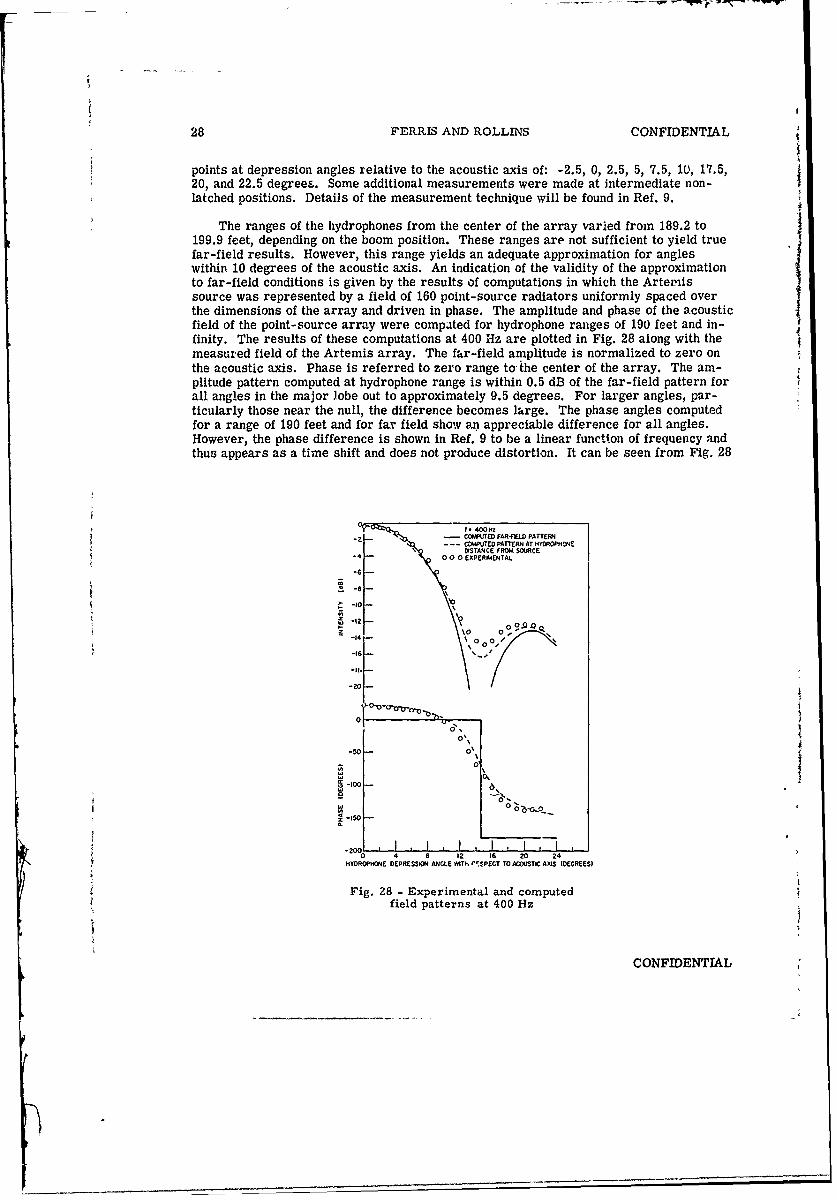
The ranges of the hydrophones from the center of the array varied from 189.2 to199.9 feet, depending on the boom position. These ranges are not sufficient to yield truefar-field results. However, this range yields an adequate approximation for angleswithin 10 degrees of the acoustic axis. An indication of the validity of the approximationto far-field conditions is given by the results of computations in which the Artemissource was represented by a field of 160 point-source radiators uniformly spaced overthe dimensions of the array and driven in phase. The amplitude and phase of the acousticfield of the point-source array were compated for hydrophone ranges of 190 feet and in-finity. The results of these computations at 400 Hz are plotted in Fig. 28 along with themeasured field of the Artemis array. The far-field amplitude is normalized to zero onthe acoustic axis. Phase is referred to zero range to-the center of the array. The am-plitude pattern computed at hydrophone range is within 0.5 dB of the far-field pattern forall angles in the major lobe out to approximately 9.5 degrees. For larger angles, par-ticularly those near the null, the difference becomes large. The phase angles computedfor a range of 190 feet and for far field show an appreciable difference for all angles.However, the phase difference is shown in Ref. 9 to be a linear function of frequency andthus appears as a time shift and does not produce distortion. It can be seen from Fig. 28
I-* 400Hz-z - COMPUJTED FAR4ELD PATTERN
- - - COMPUTED PATTERN AT HYDROP104EI0 DISTANCE FROM SOURCE
-4 0 0 0 EXPERIJENTAL-6
-10Z'%-O 0 _q
-$20
0\
2000
-0 4 02
HYDROPHONE DEPRESSION ANGLE WITh r.:SPECT TO ACOUSTIC AXIS (DEGREES)
Fig. 28 - Experimental and computedfield patterns at 400 Hz
CONFIDENTIAL

CONFIDENTIAL NRL REPORT 6534 29
that the amplitude and phase patterns measured on the Artemis array agree well with theitear-fielI computed patterns; therefore it can be ccncluded that this array pattern re-sembles that of a uniformly vibrating piston.
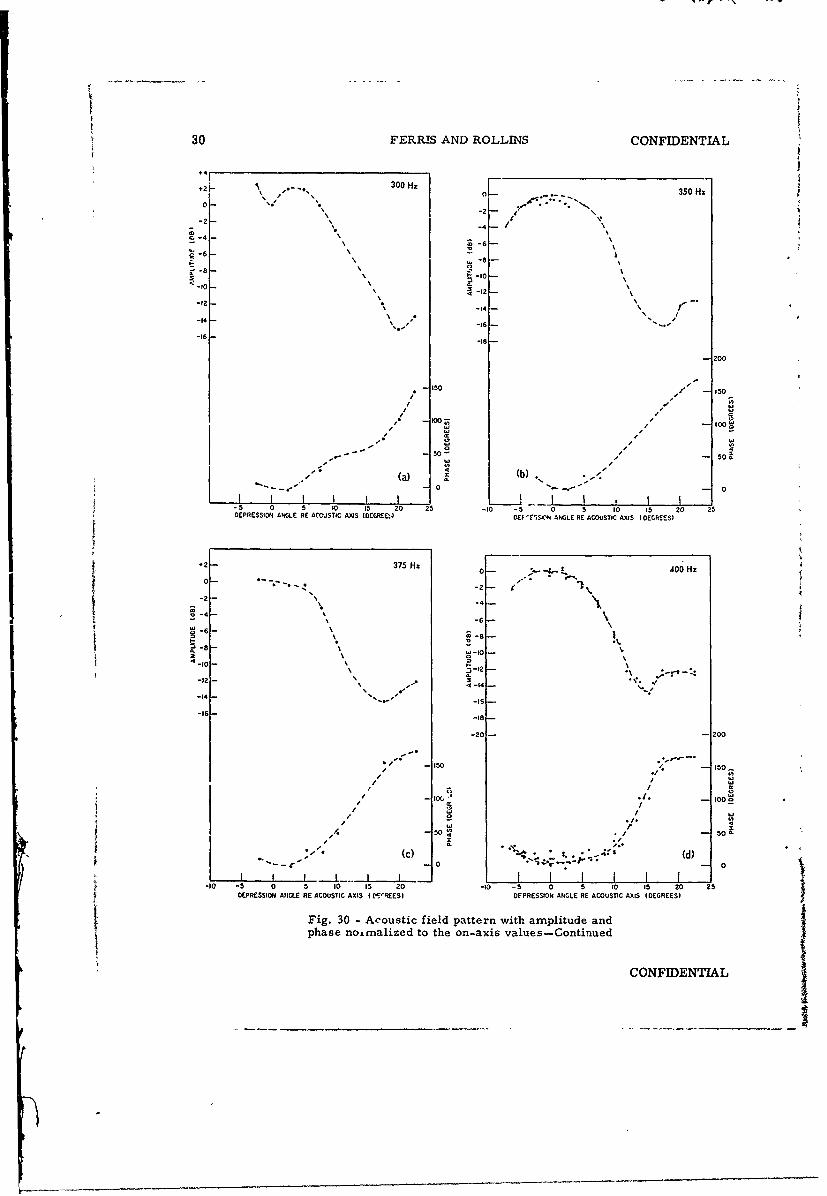
Figure 29 is a polar plot of the measured amplitude patterns at 350, 400, and 450 Hz.At each frequency the amplitude plots are normalized to the on-axis values. Figures30a through 30g present amplitude and phase data on expanded linear scales for sevenfrequencies between 300 and 500 Hz. In these plots both amplitude and phase are nor-m~ilized to the on-axis values. The 3-dB beamwidth is seen to range from 11 to 15 de-grees over the b2ndwidth from 450 to 350 Hz.
-2o" -0 -o" - -4 Hot 1 2C
-400 HZ....... 350 dz
Fig. 29 - Polar plot of field patternsat 350, 400, and 450 Hz
On-axis source levels at 1 yard for various current levels are showa, in Fig. 31.Figure 32 gives the source levels for unit power, current, and voltage into the array.
The maximum obtainable source levels, based on the maximum allowable i,.)utpower curve of Fig. 25 and the response curves of Fig. 32, are shown in Fig. 33 as afunction of frequency. The corresponding maximum allowable power and voltage curves(Figs. 25 and 26) are reprcduced in this figure for comparison purposes.
CONFIDENTIAL
30 FERRIS AND ROLLINS CONFIDENTIAL
+2k 300 Hz I02" -"S.350 Hz
-2 ", -2
- \-4 /C-4
68 -- 0 a
* -10 .4 \\2
-12 - I-Iz " -14 a\ / -"
\.Is/ -14 -.-14 -18
200
-150 .f - 150
-- " -- 50-- "50
,"(a) W. b)• .
-5 0 5 to 15 20 S -10 -5 0 5 10 15 20 25DEPRESSION ANGLE RE ACO'JSTIC AXIS IODEG:EE ,4 DEF 'FSK\1 ANGLE RE ACOUSTIC AXIS (DEGREES)
.2 - 375. oHz-,._ 0;H
0- 40,H
0-0
2 -
-6a -6
-I -8 aa -
-12 - .I-, , < -14 %
-14 S 'S
-Ie-
-20- -200
/ .150
/ UIW//IO(, I/ - 00
/ "I -/ , Ioo
0 50 4
0 r 0
-10 -5 0 5 10 15 20 -20 -5 0 5 10 15 20 25DEPRESSION AIGLE RE ACOUSTIC AXIS I D-SREES) DPRESSON ANGLE RE ACOUSTIC AXIS (DEGREES)
Fig. 30 - Acoustic field pattern with amplitude andphase no~malized to the on-axis values-Continued
CONFIDENTIAL

CONFIDENTIAL NRL REPORT 6534 31
+4 +4-
425 Hz 42450 Hz0o 0-
-4 5 -4 /
- IS 15
- IV)10
0 0
-t - 1 1. - -100 5 t
-1 500 -16 20
0 -
I /25-ISO
-12A
-cc -
+20
50H 15
0-0
-102 0 1 0 2
DERSSO ANL EAOSICAIIDGES
Fig - 0 Acutcfedptenwt mltd
an hs omlzdtoteo-xsvle
CONFIEMNA

32 FERRIS AND ROLLINS CONFIDENTIAL
150
120AMP - OQAMP80 AM P
'140
M AMP0I
MI
134.... .........
0
30320 340 360 380 400 420 440 460 480 !00FnEOUENCY (Hz)
Fig. 31 - On-axis cw source levels at I ya.,:d
110
]AMP
4UU0
54
Fig 32, -O-aiscwsouceleel
3 2k4m8 3 04 0 4 0 6 8 0FRQECY(2pemeeje atad~rvl
COFDETA

CONFIDENTIAL NRL REPORT 6534 33
414
146
.j
41
1404
350,
-FR300E NC00 (2z
Fig.0 33 VOTG Maiu>loalcw~ ' sore eel srqey
onaiwt0orsodnvolag a- power
a:15
-1 10 -10
CONFIDENTER
50-

34 FERRIS AND ROLLINS CONFIDENTIAL
Transfer Function Results - The transfer function is defined as
V(&) V (co)c ' P V(&J)
where
0 = the depression angle relative to the acoustic axis,
Vh' = the voltage of the hydrophone at depression angle 0 and range R,
Vo0 = the hydrophone voltage V. referred to zero range,
V6 = the signal generator voltage (input to the Artemis amplifier console),
Tr =the acoustic propagation delay = R/c, and
V= the signal grnerator voltage delayed by the propagation time.
In the instrumentation system. the signal generator voltage V, was delayed by rPseconds, and the phase of VhA rela'ive to v was measured, since it equaled the desiredphase of V0 relative to VG. Thus, the transfer function obtained is the ratio of the far-field signal in the water (at beam angle e) to the console input signal, with the propaga-tion delay eliminated.
These measurements (9) were made using sine wave excitation and also using PRSexcitation with amplitude and phase measurements made in contiguous 4-liz bands. ThePRS signals were generated using a linear shift register with shift rates of 50 and 100 Hz.The 50-Hz shift rate was used with an 11-bit register and the 100-Hz rate with a 12-bitregister to produce a signal length of 42 seconds in each case. The shift register outputcaused a 180-degree phase shift in the 400-Hz carrier, thus producing a signal with a400-Hz center frequency and pseudorandom phase-reversal modulation. The ll-bit reg-ister code (12) was 5205E and the 12-bit code was 10123F. The sine wave results areplotted in Figs. 34a through 34i for each of the hydrophone positions (0 = -2.5, 0, 2.5, 5,7.5, 10, 17.5, 20, and 22.5 degrees). These results were obtained at 40 amp rms ampli-fier output. Linearity considerations are discussed in a later section. It should be notedthat all transfer function measurements were made with the console filter out, and thatthere is a 180-degree phase s'ft in the amplifier input circuits. The transfer functionmeasurements were made with a 12.4 pF tuning capacitor bank connected in series withthe amplifier output.
The 0, 7.5, and 20 degree transfer function results obtained using PPS excitation ata level of 80 amp rms are plotted in Fig-. 35 and 36. The amplitude data is normalizedto zero dB on axis at 400 Hz. The 80-amp continuous wave results are plotted for com-parison. It can be seen that the results agree to within 1 dB in amplitude and 10 degreesin phase. Another significant characteristic of the transfer function results is that theamplitude characteristic over the band from 350 to 450 Hz is flat within k 1.5 dB, and thephas., characteristic is very nearly linear with fr-quency for the major lobe. The phasechar2cteristics are replotted in Fig. 37 with lineax phase shifts removed so that thephase in each case is zero degrees at 400 Hz. The phase characteristic is seen to beessentially flat for both PRS and cw signals over the band from 350 to 450 Hz.
CONFIDENTIAL

CONFIDENTIAL NRL REPORT 6534 35
The coherence ratios, derived from the cross-power spectral densities used intransfer function measurements, were computed for each hydrophone position as follows:
iS (cv) 12cohercncc ratio Y =
where
(c) =the cross-power spectral density between input and output,
S=Jcv) = the input power spectral density, and
SY(c) = the output power spectral density.
The coherence ratios are unity to within the experimental error of the mea sure-ments (approximately ± 2%), with the exception of the far off-axis results which showsome real deviation from unity ratio.
Crosscorrelation Measurements - Crosscorrelation measurements (9) were madebetween each hydrophone signal and the PRS generator. The signals used were the sameas those employed in the transfer function measurement, namely, phase modulated sig-nals of 400-Hz center frequency, and 50 and 100 Hz shift rates. The input level was 80amp rms. For comparison, the normalized autocorrelation functions for the 50 and100 Hz shift rate signals are given in Fig. 38.
The instrumentation system measured the crosscorrelation function R (7-) by per-forming the following operation:
Ry (T) f y(t) x(t-rT)dt,0
where
y = the hydrophone voltage and
= the reference signal from the generator.
The normalized crosscorrelation function is obtained by dividing Ry,(.r) by a normal-izing factor as follows:
R1,(-r)
( = (t)2 dt Y(4)2dt
0 0
The crosscorrelation functions for the on-axis hydrophone are given in Fig. 39 for50 and 100 Hz modulation rates. These results have been renormalized to let p(0) beunity. Thus, the curves can be compared directly with Fig. 38, and it can be seen thatthere is no measurable difference in curve shape between the autocorrelation functionsand the crosscorrelation functions. The peak values of the normalized crosscorrelationfunctions for both 50 and 100 Hz modulation rates were within ± 5% of unity for all de-pression angles.
CONFIDENTIAL

36 FERRIS AND ROLLINS CONFIDENTIAL
140,
'2 20. U D
~~z2
0.~~~~. 40 40 40 4
0433_
0 - . o7 4 0 0
3 2 - - II, 1{ -
M0 0 0 (d)L .5 o .
I -
40 101 W--
40 223t 40.
40V UD 20-
,.20~~"M -- 3 .40-- S -2
13-G It 1340- 5
~~z-4 -
Nof ( c)o
w. 24
040 -
CONIDETIA

CONFIDENTIAL NRL REPORT 6534 37
21
go_ 0= 17.50
-Olt (g)i3 50 4 30 0 340 4W0 420 440 4W0 4W0 0
t (00 y 3 3.)
370-
400 320 340 050~~~A 3404240404050
3000
200- 3
~2200
Fig. 34 -Transfer function (amplitudeand phase) for continuous-wave meas-
3 urements at a given depression angle 9
CONFIDENTIAL

38 FERRIS AND ROLLINS CONFIDENTIAL
80 AMPS
-PRS---- cw
44-
+2-co 0 DEGREES
0 - RE ACOUSTIC-~ AXIS
-
-4~+ 7.5 DEGREES
-6-
-8-
-10-
-12-----------------------------------420 DEGREES
-14 -
300 320 340 1,6'. 380 400 420 440 460 480 500FREQUENCY (Hz)
Fig. 35 - Pseudorandom signal and continuous-wavetransfer function amplitude
IOC 0 DEGREES
80- 80OAMPS- PRS +7.5 DEGREES
Go- -- -- - RE ACOUSTIC
40- AXIS
20--
w0 - -
w30
M 280 -0
2320
( 0 1
28 2 4 8 40 40 040 40 DEGEE
FREOUENCY (Hz)
Fig. 36 - Pseudorandom~ signal and continuous-wave transfer function phase
CONFIDENTIAL

CONFIDENTIAL NRL REPORT 6534 39
80 AMPS5 - PRN
- - - CW0 DEGREES
0 * RE ACOUSTIC
-5 AXIS
-5
0 + 70 DEGREES
-5
4
5
0 - + 20 DEGREES
-5
, S I , , I , ..1. __,... I , I , I , ,300 320 340 360 380 400 420 440 460 480 500
FREQUENCY (Hz)
Fig. 37 - Phase comparison of pseudorandom signaland continuous wave with linear component removed
5- 'I \\
09
08 I
20.7-0
I
W 06 /
0V \50-HZ SHIFT RATE
4 I IO04- IO0-R:\
N SHIFTJ / RATE
0.3- /o/
2 /\02-
/\
/ \ 5
, J,
--25 20 -15 -10 -5 0 5 10 15 20 25 30DELAY, T (MIL'SECCNJD.
Fig. 38 - Autocorrelation functionfor 50- and 100-Hz signals
CONFIDENTIAL

40 FERRIS AND ROLLINS CONFIDENTIAL
10-
50Hz SHIFT RATE
OO-Hz SHIFTI- (4WJ 06-
C,.0
0. 04-
N
J
002-
-30 -25 -20 -!5 -i0 -5 0 5 10 15 20 25 30j OELAY,r (MILLISECONDS)
Fig. 39 C ross correlation functionsfor the 00 hydrophone
Linearity Measurements - The transfer function amplitude and phase for continuouswave excitation were measured at several values of array current. Figure 40 illustratesthe results obtained with array currents of 8, 20, and 80 amp. It can be observed thatthere is an appreciable change in both amplitude and phase with changes in current level.In Fig. 41 phase is plotted as a function of array input current with frequency as a pa-rameter for values of current from 8 amp up to the highest allowable input current foreach frequency. Nonlinear behavior is particularly apparent at the lowest frequency,350 Hz. Figures 42 and 43 illustrate the array impedance as a function of frequency andarray input current, respectively. Considerable nonlinearity of array impedance can beobserved in Fig. 43. The nonlinearity is also observed in the hydrophone voltage as il-lustrated in Fig. 44, where the ratios of hydrophone voltage and array input voltage toinput current are plotted as a function of array input current. Values have been normal-ized to unity at an input current of 8 amp. Since the two curves shown in Fig. 44 are inapproximate agreement, it can be concluded that the nonlinearity of the hydrophone out-put is caused principally by the impedance nonlinearity. The data for the curves of Figs.40 through 44 were obtained with continuous v~ave excitation. When pseudorandom sig-nals were used the nonlinearity was again observed. The transfer function phases asobtained with cw excitation at 8 amp and at 80 amp array input current are plotted inFig. 45 together with he PRS transfer function phase at 80 amp. There is a large phaseIdifference between the 8 amp and 80 amp cw data at all frequencies. The 80-amp PRSphase data, however, agrees closely with the 80-amp cw phase data. This is surprising,since the energy in the PRS is spread over a broad band and only a small portion of theenergy is contained in the 4-Hz analyzing bandwidth at any one frequency. A sinilarI comparison of PRS and cw amplitude nonlinearity is complicated by several factors andhas not been performed. Apparently, the observed phase at any one frequeicy dependsupon the total current into the array and not upon the current in a particular frequency
CONFIDENTIALj
.II

CONFIDENTIAL NRL REPORT 6534 41
L-2K
Iz
at8 2,an 0 m
-606
-4 400Hz
~ -30
35 -20 37 8.9-40 40 40 3 4 5
Fig. 40 -Fig 41tnuu-wv trOn-axisacoustic
* o-360F
-50 40 Hz
-30j-
-320-
o-360
-350*
-34 20 4 0 8 O 2
INPUT CURRENT (AMP)
CONFIDENTIAL

42 FERRIS AND ROLLINS CONFIDENTIAL
ARRAY CURRENT 40 AMP f(w0
w PHASE<w60
30
S20 I0
300 320 340 360 380 400 420 440 460 480FREQUENCY (HZ)
Fig. 42 -Array impedance at 40 amp
50
q0 420HzI 350 Hz
zz 450Hz'< 3 0 ______
04 350 H
t0 20 30 43 50 60 70 80 90 t00'(RAY CJRRENT (AMP RMS)
Fig. 43 -Array impedance versus array current
CONFIDENTIALI

CONFIDENTIAL NRL REPORT 6534 43
w
0: O----O HYROPHONE VOLTAGE/CURRENT
W0
1 3 -- --- & ARRAY VOLTAGE/CURRENT
Z-
0: 2
4>00:
Cr I 0 20 30 4 C 50 60 to 80 90 I00
0 ~ARRAY INPUT :URRENT IIAMP)
Zi
Fig. 44 - A-plitude linearity versus
array current at 420 Hz
I band. It has been concluded that the observed no-ltnearitv is caused by an array imped-
ance change which depends upon total current into the array. When operating at a con-stant current level it would not be expected that nonlinearity, which is dependent upontotal input current, would cause waveform distortion. This conclusion is supported bythree additional observations:
1. There is no observable ,tveform distortion in sinusoidal signals received by thehydrophones.
2.. The crosscorrelation functions between hydrophone signals and input signals havea peak value of unity.
3. The coherence ratio between hydrophone ana input signals is unity.
Thus, it is concluded that the nonlinear characteristics do not introduce measurable dis-tortion in the instantaneous waveforms.
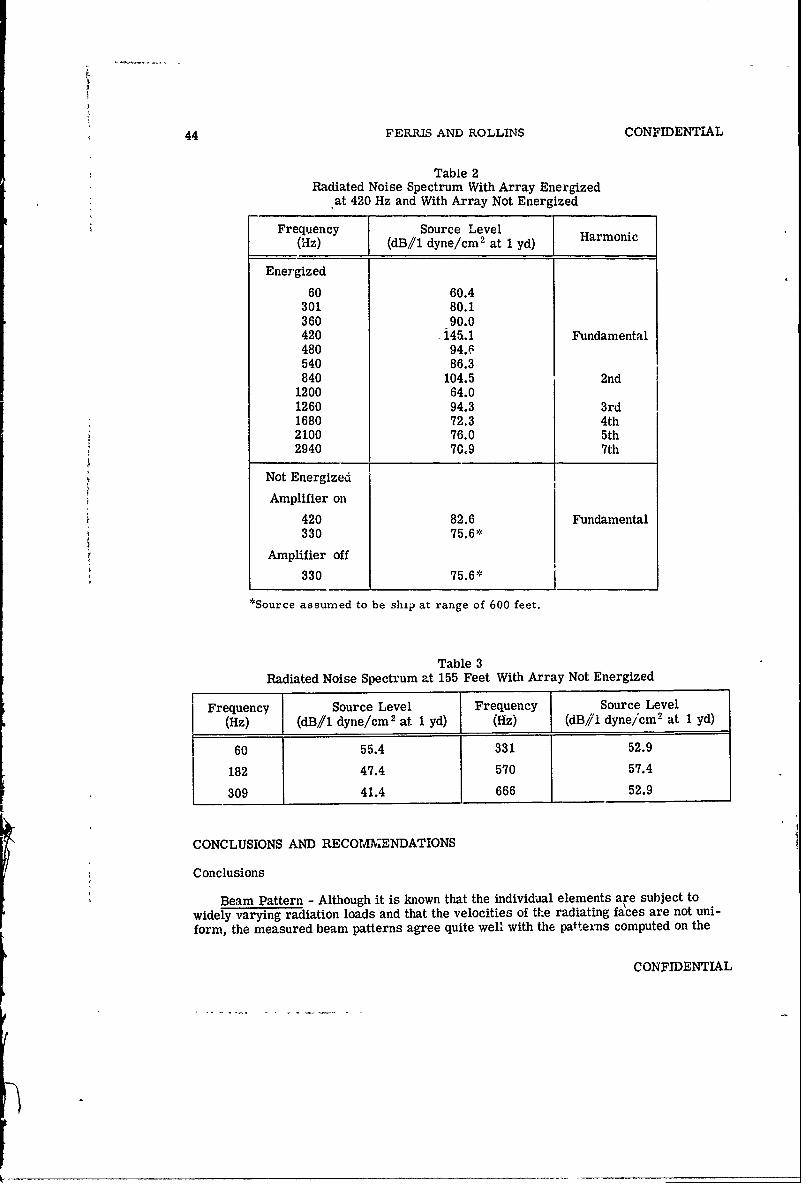
Radiated N, se Spectrum - Table 2 lists all the spectral lines observed over thefrequency range of 60 to 15,000 Hz at a hydrophone on the acoustic axis of the source ata range of 190 feet with the array submerged to a depth of 600 feet. The upper section ofTable 2 lists the observed lines when the array was energized with 100 amp at 420 Hz.The entries at the bottom of the table are the only lines observed when the array was notenergized. Following this test the amplifiers were turned o and the transdgcer discon-
nected from the output of the amplifiers. The 420-Hz line disappeared, but the 330-Hzline was unaffected. In computing source levels, it was assumed that the transducer ar-ray was the source of all lines except the 330-Hz lina, which was assumed to emanate
from the ship. It is not known whether the 330-Hz line existed when the array was ener-gized, since only the higher level lines other than ha.rmonies and 60 Hz werro recorded atthat time. The 330-Hz line represents a source of approximately I W acoustic powerradiating in a 180-degree solid angle.
At a later date the array was raised to a depth of 155 feet and additional noisemeasurements were obtained with no excitation to the array. The hydrophone was sub-merged to a depth of 50 feet at a range of 177 feet from the center of the ship. The shipwas assumed to be the source of all lines in the computation of source levels. Table 3lists all the observed spectral lines The amplitudes of al lines fluctuated rapidly, un-like the line which was previously observed at 330 Hz, which was steady.
CONFIDENTIAL
fromtheshi. I isnotknon whthe th 33-Hzlin exstedwhe th aray as ner
44 FERRIS AND ROLLINS CONFIDENTIAL
Table 2Radiated Noise Spectrum With Array Energized
at 420 Hz and With Array Not Energized
Frequency Source Level 1(Hz) C (dB//1 dyne/cm 2 at 1 yd) Harmonic
Energized
60 60.4301 80.1360 90.0420 i45.1 Fundamental480 94.6540 86.3840 104.5 2nd
1200 64.01260 94.3 3rd1680 72.3 4th2100 76.0 5th2940 70,9 7th
Not Energized
Amplifier on
420 82.6 Fundamental330 75.6*
Amplifier off
330 75.6*
*Source assumed to be ship at range of 600 feet.
Table 3Radiated Noise Spectrum at 155 Feet With Array Not Energized
Frequency Source Level Frequency Source Level
(Hz) (dB//1 dyne/cm 2 at 1 yd) (Hz) (dB/ dyne/cm 2 at 1 yd)
60 55.4 331 52.9
182 47.4 570 57.4
309 41.4 666 52.9
CONCLUSIONS AND RECOMM.ENDATIONS
Conclusions
Beam Pattern - Although it is known that the individual elements are subject towidely varying radiation loads and that the velocities of tke radiating faces are not uni-form, the measured beam patterns agree quite well with the patterns computed on the
CONFIDENTIAL
I. ... .. ....

CON1FIDENTIAL NRL REPORT 6534 45
6 0 rOF
/
80 AMP
40!
-20-
UJ
4)
360 3 8 80o
FREQUENCY (Fz)
Fig. 45 - Comparison of pseudorandom sig-nal and continuous-wave transfer functionat 80 and 8 amp
basis of a uniform velocity assumption. Figure 28 shows the relationship between theexperimental beam pattern and a pattern computed using a 160-element uniform-velocity model. While not identical, the actual and ideal curves are in reasonable agree-ment as to the major and minor lobe characteristics.
Signal Distortion - The correlation measurement, obtAied at various beam anglesindicate that the acoustic signal waveform in the water is an excellent replica of the gen-erator reference signal. No loss of correlation was measurable within the measurementaccuracy of the crosscorrelation instrumentation. Since the accuracy of these measure-ments is estimated to be better than 5%, one can conclude that the generator-to-acoustic-signal correlation is better than 0.95 for the beam angles employed and for the types ofsignalIs tested.
~Similarly, the close agreement between PRS and cw transfer functions at the same
power levels indicates that significant nonlinear behavior of the transducer array doesnot occur, although there is a dependence of array impedance on total power input. Thisis supported by the coherence ratios of, essentially, unity.
CONFIDENTIAL
2i
!/

46 FERRIS AND ROLLINS CONFIDENTIAL
Source Levels - The cw source levels, as shown in Figs. 31, 32, and 33, are slightlylower than source levels previously reported (8). The maximum allowable source levelof 147 dB at 420 Hz, as determined by the more precise measurements of the last test,is 1 dB lower than the result obtained with the acoustic measurements reported in Ref. 8.With modulated signal input, maximum allowable power inputs vary widely depending onmany factors (cf. Table 1). For pseudorandom noise signals generated by the NRL PRNgenerator the maximum allowable power input is 110 kW, whereas a signal specially de-signed for maximum power (phase coherent FSK) has a maximum allowable power inputof 385 kW, which is nearly identical to the maximum allowable power for cw excitation.Allowable powers for conventional phase reversal. PRS inputs fall between these twovalues.
The Artemis source contains 1440 massa-type TR-11C transducer elements. Theseelements have a maximum recommended spring deflection of 10 mils peak to peak. Agroup of modified elements, having newly designed springs, was tested (13) for 10,000,000cycles at a spring deflection of 22 mils peak to peak without damage. Mechanical limita-tions of the air gap prevented testing at larger deflections. The manufacturer, however,had tested the individual springs at 44 mils peak to peak deflection. If the Artemissource was to be equipped with elements containing the modified springs, an increase inthe maximum allowable power of approximately 12 dB could be expected, provided thetransducer element remained the power limiting factor.
Suggested Areas For Further Investigation
Acoustic Interaction Effects - Experience with the Artemis source has shown thatacoustic interaction effects are significant in terms of maximum power capability, al-though the beam patterns and transfer functions are apparently not adversely affected.The effect of acoustic interaction is particularly difficult to estimate when modulatedsignals are employed. Further investigation into the radiation loading of individual ele-ments in arrays excited by modulated waveforms is indicated.
Element Design Criteria - The extreme spread of spring deflections in the Artemiselements over the array under cw excitations, and the large responses of individual ele-ments when excited by modulated waveforms, indicate that additional criteria related todynamic response should be incorporated in design specifications. There is need forinvestigation of opt;-'um relationships between signal bandwidth, transduction efficiency,transducer Q, maximum power capability, radiation loading effects, and signal distortion.
Array Measurement and Evaluation Methods - The problems associated with per-formance measurements on large, low-frequency arrays are formidable. Near fieldmeasurement techniques would be helpful. It is also desirable to establish some stand-ard way of evaluating array performance under conditions of excitation by modulatedwaves for comparipon purposes and for acceptance testing.
System Response to Modulated Waveforms - The previous three paragraphs haveindicated the importance of additional investigation employing modulated waveforms. Itis to be stressed that designs based on continuous-wave sinusoidal assumptions are notadequate for use with high-power acoustic arrays which will be used with various typesof modulated s7 nls,
CONFIDENTIAL
CONFIDENTIAL N11L REPORT 6534
RE FERENCES
1. McClinton, A.T., Ferris, R.H., Cybulski, J., and Barton, A.M., "Project ARTEMISHigh Power Acoustic Source, Description of Facility as Installed on USNS MissionCapistrano (T-AG 162)," NRL Report 5599 (Confidential Report, Unclassified Title),Feb. 1961 and Supplement of July 1961
2. McClinton, A.T., "Project ARTEMIS Acoustic Source, Description and Characteris-tics of Facility as Installed on the USNS Mission Capistrano (T-AG 162)," NRLMemorandum Report 1299 (Confidential Report, Unclassified Title), Mar. 1962
3. McClinton, A.T., Ferris, R.H., Herrington, W.A., "Project ARTEMIS High PowerAcoustic Source, Interim Report on Acoustic Performance," NRL MemorandumReport 1205 (Confidential Report, Unclassified Title), Aug. 1961
4. McClinton, A.T., Ferris, R.H., "Project ARTEMIS High Power Acoustic Source,Second Interim Report on Acoustic Performance," NRL Memorandum Report 1214(Confidential Report, Unclassified Title), Sept. 1961
5. McClinton, A.T., Ferris, R.H., "Project ARTEMIS High Power Acoustic Source,Third Interim Report on Acoustic Performance," NRL Memorandum Report 1273(Confidential Report, Unclassified Title), Apr. 1962
6. Ferris, R.H., "Project ARTEMIS High Power Acoustic Source, Fourth Interim Re-port on Acoustic Performance," NRL Memorandum Report 1400 (Confidential Re-port, Unclassified Title), Mar. 1963
7. Baier, R.V., "Theoretical Interactioa Computations for Transducer Arrays, Includ-ing the Effects of Several Different Types of Electrical Terminal Connections," NRLReport 6314 (Confidential Report, Unclassified Title), Oct. 1965
8. Ferris, R.H., "Test of Project ARTEMIS Acoustic Source," NRL Memorandum Re-port 1648 (Confidential Report, Unclassified Title), Sept. 1965
9. Ferris, R.H., Rollins, C.R., "Project ARTEMIS Acoustic Source, Acoustic TestProcedures," NRL Memo undum Report 1769 (Confidential Report, UnclassifiedTitle), in preparation (to be printed)
10. Rusby, J.S.M., "An Investigation of the Total Radiation Impedance of Ridged PistonSound Sources in Arrays," Part V, Admiralty Research Laboratory Report A.R.L./R31/L (Confidential Report), Sept. 1961
11. Carson, D.L., Martin, G.E., Genthien, G.W., and Hickman, J.S., "Control of ElementVelocity Distributions in Sonar Projector Arrays," Proceedirwig of Seventh NavyScience Symposium, Office of Naval Research Report 014R 16, Vol. I (1963)
12. Peterson, W.W., "Error-Correcting Codes," Cambridge: MrI Press, 1961
13. Ferris, R.H., "Project ARTEMIS Acoustic Source, Characteristics of the TypeTR-11F Transducer Element," NRI, Memorandum Report 1498 (Confidential Report,Unclassified Title), Jan. 1964
CONFIDENTIAL 47

P.RECEDIG PAGE BLANKO IM
Securty Classtfication
DOCUMENT CONTROL DATA - R & D-Scurt t lassfl aton of t ctle, bodv of abstract n d ...de, g d- lnnotot ,,,n mut be entered when the overall report is , lssued)
I ORIGINATING ACTIVITY (Corporate author) 12a. RCPORT SECURITY CLASSIFICATION
Naval Research Laboratory I Confidential
Washington, D.C. 20390 24 GRoU 43 REPORT TITLE
PROJECT ARTEMIS ACOUSTIC SOURCE PERFORMANCE CHRACTERISTICS
AOESCRIPTIVE NOTES (Type Of report and inclusive dates)
An interim report on a continuing problem.5 AUTHOR(S) (First name, middle initial, last name)
R.H. Ferris and C.R. Rollins
6 REPORT DATE 7a. TOTAL NO OF PAGES 17b. Nr OF SEFS
June 15, 1967 52 13Sa. CONTRACT OR GRANT NO 96 ORIGINATOR'S REPORT NUMBER($)
NRL Problem S02-11b. PROJECT NO. NRL Report 6534ONR RS 046
C. Sb. OTHCR REPORT rO(S) (Any other tumbers that may be assignedthis report)
d•
10 DISTRIBUTION STATEMENT
None
It. SUPPLEIEN IAMY OTEZ 12.,SPONSORt.-.G MILITAJV ACTIV TY
Department o the Navy(Office of Naval Research),Washington, D.C. 20360
13. ABSTRACT [Confidential]
The Artemis acoustic source was designed to meet the requirements for anocean surveillance study program. These requirements included a source level of152 dB in a 100-Hz band centered at 400 Hz with a transducer operating depth of1200 feet. The transducer, which was completed in June 1964, is a iectangularplanar array 33 feet wide and 50 feet high. It is composed of 1440 variable-reluctance elements which are driven in parallel from a linear electronic amplifier.The source is installed aboard a modified T-2 class tanker having a well amidshipthrough which the transducer array is lowered and retrieved.
Initial tests of the partially completed source had revealed a severe acousticinteraction problem which imposed a restriction on the operating power level. Astudy program was initiated and experiments were conducted to investigate the in-teraction behavior and to discover means to alleviate its effects. Results demon-strated that improved performance could be obtained by modifying the originalseries-parallel connection of elements to an all-parallel form. The indicatedmodification was performed concurrent with the completion of the transducerarray.
(over)FD 1 -73 (P AGE I)i, NOM (PG 49 CONFIDENTIAL
S/N 0101-807-6801 Security Classification
_,I

CONFIDENTIALSecurity Classification
LINK A LINK 0 .INK CKEY WORDS
ROLE WT ROLE WT ROLE WT
Acoustic calibrationAcoustic fieldAcoustic interactionPlanar arrayResponse characteristicsTransducerTransfer function
Measurements performed on the completed and modified transducer resulted ina set of recommended safe power levels which depend upon frequency. Operation atthe recommended maximum power with pulsed sinusoids at 420 Hz, the favorablefrequency, produces a source level of .147 dB referenced to one dyne per squarecentimeter at one yard. Operation at other frequencies is more limited in power,particularly at the upper end of the frequency band.
An acoustic calibration of the source, accomplished with the aid of hydrophonesmounted on the end of a 190-foot boom, defined the transfer function in a verticalplane through the acoustic axis out to the first minor lobe. Correlation functionswere obtained between the input signal and the acoustic output using pseudorandomsignals. It is concluded that the acoustic source introduces negligible distortion inthis type of signal
DD INOV 1473 (BACK) 50 CONFIDENTIAL(PAGE' 2) Security Classif'cation

.S < . "-0 0.. - . = o .. . . g
t _ . ; A Z L 43- lo '-i 4
4) ) 4 0. U u, . - u J ,. - I =- , ,- < . = . . ; . o fzwU - U. Z d% Z
-_ .(N .. , .4 u "6 e o ..
I .., - .!E
29 " . u a I . e-
'- ° - = . . . ' .... - =
- .2-. *5 . * A45 40S
-¢ . -u ,. . 4 U•
8 o - o > of
ttt
7E) x4) 0 ; , r
j8,4 03 )O8 ~ 2U2 mI .~ 3.. S I .I = -
--0
5: o -I ..
Me Z
Is 4us .2 2 .W
w .2, -L 3 .-
5* .~ g' ~ ~ -A, -8- p-" J )0.4
* .'0
0E ;-0 ~ g~.05 20 45 - 0.0 ~ j

.o
0. .a~;§OR
U=2 2. &W& ~ ~ 2~' a -~- s'-8.02 0oZ m & o!
Xl > so -o. . .
o' .2 0
z9 0
7.2 1~~ .
7S A8 .28
o 0
0=1 -. 2
--
~~.2~ .g0I 3&
8.0!
o0"
9..2
S0 0. - .0 0 0 0
C c
o o.33,
0- 0
00 - c0 u(-E~~ -- : 3.93