authors: olmos, j.****
TRANSCRIPT
Authors: Yepes-Baldó, M.*, Romeo, M.*, Boria, S.**, Perez, F. J.***, and Guàrdia-
Olmos, J.****
Title: Uncertain averaging operators: a new way to study the psychosocial
organizational phenomena
Affiliation and adresses:
* Department of Social Psychology. University of Barcelona. Passeig de la Vall
d’Hebron, 171. 08035 Barcelona. PsicoSAO. Research Group in Social, Environmental
and Organizational Psychology (2014 SGR 992)
** Department of Economy and Business Organization. University of Barcelona. C/
Baldiri i Reixac, 13. 08028 Barcelona
*** Department of Social Psychology. University of Barcelona. Passeig de la Vall
d’Hebron, 171. 08035 Barcelona.
**** Department of Behavior Sciences Methodology. University of Barcelona.
Passeig de la Vall d’Hebron, 171. 08035 Barcelona. Research Institute in Brain
Cognition and Behabiour (IR3C)
Corresponding author:
Dr. Montserrat Yepes-Baldó
Tel. +34933125167
Fax. +34934021366

1
Title: Uncertain averaging operators: a new way to study the psychosocial
organizational phenomena
Abstract
The aim of this paper is to use uncertain averaging operators (Uncertain
Average, Uncertain Weighted Average, Uncertain Probabilistic Aggregation, and
Uncertain Probabilistic Weighted Average) in order to explore psychosocial processes.
Traditionally, research in the field of work and organizational psychology has departed
from positivism, based on simple deterministic laws that are unable to account for the
complexity of organizational phenomena. Our purpose is to show how the Experton
methodology contributes to the study of managers’ subjectivity on their perception of
Corporate Social Responsibility policies development. This is a very innovating
perspective in the research of work and organizational psychology. We developed an
interview guideline to analyze the level of development of policies for the workplace
integration of persons with disabilities. Thirty-five interviews were obtained.
Respondents were top managers, Chief Executive Officers, human resources and
Corporate Social Responsibility managers. Ten academic and professional experts, with
a minimum of 10 years’ experience in the field of Corporate Social Responsibility, were
asked to establish confidence intervals based on four anchors. The results achieved by
the managers and by the experts group reached a similar assessment of the degree of
deployment of those policies related to collaborate with the local community and
associations, and the setting-up of strategic alliances. These techniques provide an
assessment that optimizes the result, as it indicates the exact level of implementation of
the policies for the workplace integration of persons with disabilities.
Keywords
Uncertain averaging operators; Experton methodology; Psychosocial perspective;
Corporate Social Responsibility

2
1 Introduction
In organizations, when dealing with management decision making processes, we can
assume that all the information we have is clear and can be assessed with aggregation
operators based on exact numbers. Therefore, there exists a wide range of aggregation
operators, as weighted average (Beliakov et al. 2007), the probabilistic aggregation, the
OWA operator (Emrouznejad and Amin 2010; Kacprzyk and Zadrozny 2009; Yager
1988, 1993; Yager and Kacprzyk 1997), the Choquet integral (Tan and Chen 2010),
distance measures (Merigó and Casanovas 2011), norms (Yager 2010), logarithm
aggregations (Zhou and Chen 2010), heavy aggregations (Merigó and Casanova 2010)
or induced aggregator operators (Merigo and Gil-Lafuente 2009).
The most used aggregation operators based on exact numbers are weighted average
and the probabilistic aggregation. The first operator aggregates the information by
giving different levels of importance to each argument in the problem. On the other
hand, the probabilistic aggregation uses probabilities to aggregate the data. Merigó
(2009) proposed a combination of operators, the probabilistic weighted average (PWA)
that considers the degree of importance of each concept in the analysis including the
objective and the subjective information of the environment.
However, organizations are complex realities where information is not always so
clear. In order to deal with this reality, Moore (1966) proposed interval numbers as a
useful technique for representing uncertainty since it considers the minimum and the
maximum results that may occur. When using interval numbers to aggregate the
avalaible information, we form uncertain aggregation operators. The main operators
based on interval numbers are the uncertain weighted average (UWA) and the uncertain
probabilistic aggregation (UPA). Several studies use this kind of aggregation operators
(Jin and Liu 2010, interval grey linguistic variables; Liu 2009, 2010, decision making
under risk, interval vague set and TOPSIS method; Merigó and Casanovas 2011,
induced and uncertain heavy OWA operators; Wei 2009, uncertain linguistic hybrid
geometric mean operator).
2 The Uncertain Aggregation Operators
Following one of the main authors on this topic (Merigó 2009, 2010, 2011), in this
section we develop the different uncertain aggregation operator, the UPA, the UWA and
the UPWA.
The UPA can be defined as follows:
Ω is the set of interval numbers and an UPA operator of dimension n is a mapping
UPA: Ω → Ω that has an associated weighting vector P, with !" ∈ [0,1] and ∑ %& =&'(1, such that:
)*+ (.%(, … , .%) = 2 %&
&'(.%&.
Where .%& is an interval number representing the i-th argument variable.

3
Meanwhile, UWA can be defined as:
Ω is the set of interval numbers and a WA operator of dimension n is a mapping
WA: Ω → Ω that has an associated weighting vector W, with !" ∈ [0,1] and ∑ % =%&'1, such that:
()* (-.', … , -.) = 2 3%
%&'-.%.
Where -.% is an interval number representing the i-th argument variable.
Merigó (2011) proposed a new decision making approach based on a new
operator that is the result of the union between the uncertain weighted average (UWA)
and the uncertain probabilistic aggregation (UPA) operators. This result considers not
only the subjective part of the assessment of the individual, but also the objective of the
subject being treated, and it is called the uncertain probabilistic weighted averaging
(UPWA) or the interval probabilistic weighted average (IPWA). The UPWA can be
defined as:
Ω is the set of interval numbers and an UPWA operator of dimension n is a
mapping UPWA: Ω → Ω such that:
(5)* (-.', … , -.) = 2 6.%
7&'-.%.
Where -.% is an interval number representing the i-th argument variable. Each -.% has an associated weight (WA) 6.% with ∑ 6.% = 17&' and 6!3 ∈ [0,1], and a probabilistic
weight 8.7 with ∑ 8.% = 17&' and 8!3 ∈ [0,1]. 69% = :;8.% + (1 − :;)6.% with :; ∈ [0,1] and
it is also an interval number and 69% is the weight that unifies probabilities and WA in the
same formulation. This formulation can be proposed as an alternative way to fit
confidence intervals around the statistics values and to improve the estimation
procedure. In fact, there are two special facilities in the use of UPWA: i) the possibility
to apply this formulation to any numerical distribution without special assumptions and
ii) a major precission in the interval estimation so the standard error is reduced in front
of the classical statistical approach.
These operators have shown their suitability as an analysis tool in different fields
as the quality assessment (Barreiro et al. 2007; Levrat et al. 1997), monitoring of stocks
management (Reig and González 2002), marketing (Zalila et al. 2005) and business
ethics (Gámez-González et al. 2010), but it is very innovative at work and
organizational psychology research. In this sense, this methodology has been used in a
few studies to analyse the effect of the subjectivity on management systems as selection
and human resources assessment processes (Canós et al. 2011; Capaldo and Zollo 2001;
Chen and Chen 2005).
Traditionally, research in the field of work and organizational psychology has
departed from positivism, based on simple deterministic laws that are unable to account
for the complexity of organizational phenomena (Navarro, 2006). From this point of
view, the purpose of this study is to use uncertain averaging operators (UA, UWA,
UPA, and UPWA) to explore psychosocial processes, specifically the effect of

4
managers’ subjectivity on their perception of Corporate Social Responsibility (CSR)
policies developement.
3 The case study
3.1 Participants
The study target group consisted of the companies included in the Iberian Balance Sheet
Analysis System (SABI). This database listed a total of 1,300,000 companies. The
inclusion criteria and indicators used to select the sample established that companies
should have a total of more than 50 employees, should be operational and should have
existed at least for seven years.
Respondents were top managers, Chief Executive Officers (CEOs), human
resources (HR) and CSR managers. In order to improve the valid response rate, the
interviewers explained the objectives of the study and the interview content. A total of
35 fully answered interviews were obtained. The characteristics of the participating
companies are presented in Table 1.
3.2 Instrument
We developed an interview guideline to analyze policies for the workplace integration
of persons with disabilities, understood as those guidelines, rules and procedures
established with the aim of supporting the efforts to achieve the planned goals (Fred
2003).
Specifically, the instrument included, on the one hand, six items on the Likert
scale with four anchors: 1 = No.; 2 = Under planning; 3 = Under development; 4 =
Implemented (Table 2) related to the level of internal analysis of disability and
integration, regularization plans, social action, communication plans, partnerships and
corporate commitment. The items take into account the internal (item 1 and item 3) and
external facets (item 2 and item 4) of CSR policies, and their integration (item 5 and
item 6). On the other hand, it includes a section presenting data on the segmentation and
identification of the companies and interviewees.
3.3 Procedure
The instrument developed was subjected to a pilot study involving ten academics and
professionals from the field of CSR to ensure that the items were clearly
understandable, regardless of the sector and type of business. Subsequently, the wording
of the questions in the interviews was adjusted in line with the observations made by the
participants in the pilot study, and was administered to top managers, CEOs, HR and
CSR managers above mentioned.
Finally, a group of ten academic and professional experts, with a minimum of 10
years’ experience in the field of CSR, were asked to establish confidence intervals based
on four anchors (Zalila et al. 2005).
3.4 Data analysis
In order to establish the confidence intervals the experts used a 11-point scale (11 values
between 0, “null” and 1, “totally”) and considered confidence levels as [0,1]. They
allocated the “Implemented” response the value of 1 and the value of 0 to “Not
implemented”. Likewise, the responses “Under planning” and “Under development”,

5
there being an uncertain level, were ascribed the values of [0.1, 0.5] and [0.5, 0.9]
respectively. In this way, the imprecision in the validation corresponds to a specific
situation that is semantically acceptable (Kaufmann et al. 1994).
When the company makes an evaluation indicating “Under development” or
“Under planning”, this has a factor of subjectivity, and the Experton method, as an
aggregation procedure, combines the evaluations of the different experts in a single one
(Gámez-González et al. 2010).
In general terms, each of the interviews (B) was assessed by N experts (E1,…,EN),
with z questions (C1,…,Cz). Each expert Ei, i ∈[1,…,N] offers his evaluation as a fuzzy
set Bi=µBi(C1), µBi(C2),…., µBi(CZ), with reference ℜ= C1, C2,…,Cz),where:
"k ∈ 1,2,…,z]
µ"#($%) = &µ"#'#*($%), µ"#
'+-($%). ∈ [0,1].
The aggregation has considered µBi (Ck), as a case of generic variables µB(Ck),
placing the values between [0,1], where the following is obtained by probability:
"k ∈ 1,2,…,z]
P3µ"#'#*($%) = µ4 = 567
879
:.
P(µ"#'+-($%) = µ) = 567
8;<
:.
And where minimum and maximum nB are the frequencies of μ for the two,
lower and upper limits.
Through the laws of probability the equations are transformed into a
complementary cumulative distribution function, Experton, calculating both limits of
each item (Luis 2011).
F(µ"'#*($%) = µ) = ∑ P?
@A5 3µ"'#*(Ck) = Ψ4.
F(µ"'+-($%) = µ) = ∑ P?
@A5 (µ"'+-(Ck) = Ψ).
Experton facilitates the analysis of the subjectivity of managers, using a
confidence interval "[a1, a2]”, with 0≤ a1≤ a2≤ 1. It can be seen that a1 and a2 refer to the
lower and the upper limits of the interval or a real number when a1 =a2.
0 1
a1 a2
As an example, in our case study and using our semantic scale:
[0.0] = [Not implemented]
[0.1, 0.5] = [Under planning]
[0.5, 0.9] = [Under development]
[1.0] = [Implemented]
Based on that, if six experts give their opinions about one of the items, the
results could be as follows:
Expert1 = [0.2, 0.4] Expert2 = [0.0, 0.3] Expert3 = [0.5, 0.8].
Expert4 = [0.2, 0.5] Expert5 = [0.9, 1.0] Expert6 = [0.4, 0.8].

6
Using Experton methodology the opinions are aggregated on the endecadarian
scale, including the lower and the upper limits of the interval. Results are divided by the
total number of answers. After that, the complementary aggregated law is applied
(starting on α = 1). Thus, we obtain a representation of the group opinion, called
Experton (Table 3). The group opinion can be represented also graphically (Figure 1).
In this exemple the graphical representation of the item shows a convex curve, which
means that the experts consider that most policies aimed at the occupational insertion of
persons with disabilities have been “Implemented”. Nonetheless, it appears that there
exists some disagreement among experts on their evaluation (separate curves).
To obtain UA, we calculate the average between the lower and upper limits of
the intervals. The result thus obtained corresponds to the nearest semantic scale
determined by the experts group.
Once we have the intervals for each item, in order to calculate the UA intervals
for a set of them we proceed as follows:
Being different confidence intervals such as:
A = [a1, a2]⊂ R, B = [b1, b2]⊂ R, and C = [c1, c2]⊂ R,
the addittion is A(+)B(+)C=[a1+b1+c1 , a2+b2+c2] and the mean is
=[A(+)B(+)C]/3.
The mean provides an average value of all the experts’ opinions. In some cases,
knowledge or degree of influence of each expert can be different and this leads to
having to use weighted averages. In this case, the general mean is used.
! (#, $) = %& $'#'*+
'-./
. *0.
234ℎ $'6[0,1] #9: ∑ $' = 1+'-. .
Depending on the values of p and λ different averages can be obtained:
If p=1, weighted arithmetic average
If p=2, quadratic weighted average
If p=1 and λ =1/n, simple arithmetic average (SMA)
If λ =1/n, generalized simple average
In our study the SMA from the previously obtained UA was used as the basis for
obtaining the UPA, UWA and the UPWA operators, because they allow analysing
situations with subjective and objective information in the same formulation.
The different intervals for each item thus obtained are the basis to calculate
UPA. An UPA operator of dimension n is a mapping UPA: Ωn → Ω (Ω be the set of
interval number) that has an associated probabilistic vector P, with p< > ∈ [0, 1] and ∑ p< >@>-. = 1 , thus:
ABC(#<., #<D, … , #<+) = & !<'+
'-.#<'.

7
For the UPA weights, each expert gives his/her own opinions. These opinions are
consensuated in order to form the collective weights to be used in the aggregation
process. The UPA operator in our example uses de following vector P = (0.1, 0.3, 0.1,
0.25, 0.15, 0.1). It is important to note that the experts consensuated, on one hand, the
higher coefficients for Item 3, related to adaptation of communication systems, and for
Item 4, related to alliances with specialized associations. These items showed the higher
levels of developement. On the other hand, they consensuated lower coefficients for
Items 1, 3, 5 and 6, those with lower level of developement.
An UWA operator of dimension n is a mapping UPA: Ωn → Ω (Ω be the set of
interval number) that has an associated weighting vector W, with ∈ [0, 1]and ∑ !" = 1, thus:
#$%(&'", &'), … , &' ) = +
!"&'.
Furthermore, we determined for UWA the vector V = (0.15, 0.1, 0.15, 0.1, 0.25,
0.25). Note that we consensuated the higher coefficients to items 5 and 6, those
considered as more strategic from the internal and external point of view. Items related
to internal policies (item 1 and item 3) received intermediate coefficients and those
related to external policies (item 2 and item 4) the lowest ones.
UPWA operator is an aggregation operator, which unifies the probability and the
weighted average, joining the UPA and UWA, and combinating objective and
subjective probabilities. The sum of the two operators must be equal to 1, and for this
we use ß and (1-ß).
An UPWA operator of dimension n is a mapping UPWA: Ωn → Ω (Ω be the set
of interval number), it has an associated probabilistic vector P, with -' ∈ [0, 1]and ∑ -' !" = 1 and a weighting vector W, with ∈ [0, 1]and ∑ !" = 1,
thus
#/$%(&'", &'), … , &' ) = ß + -'
!"&' + (1 − ß) +
!"&'.
Following Merigó (2011), the UPWA operator uses UPA vector with a 40 % of
importance and the UWA vector with a 60%.
4 Results
Among the top managers, CEOs, HR and CSR managers, 53.9% consider that their
organizations have not implemented policies aimed at the integration of persons with
disabilities in the workplace, while 40.1% claim they had policies under development or
fully implemented and 6% are planning their implementation. In Table 4 the frequency
distribution of each item is shown globally and segmented by sector and scale of
operations.
In general terms, policies perceived as the most developed are those related to
collaboration with the local community and associations (47.6 %) and the development
of strategic alliances (43.9 %) (item 2 and item 4). Conversely, actions linked to the
internal policies of the organization, i.e. the existence of strategic plans for
regularization (Item 6), corporate policies (Item 5), communication plans (Item 3) and
surveys on integration (Item 1), are those seen with a lower percentage of development.
Respectively, 69%, 42.9%, 61.9% and 75% of top managers, CEOs, HR and CSR
managers assure they have not implemented them.

8
The analysis of the results as segmented by scale of operations and sector shows
that international companies and the service sector managers present above average
percentages of implementation of external policies. At the same time, it should be noted
that the service sector is below the average as regards the development of internal
policies. Between 43.8 % and 87.5 % of service companies admit they have not
developed these policies. Finally, national companies state in greater proportion that
they have not developed strategic plans for regularization (75%), nor evaluated levels of
integration by means of internal surveys (84.2 %). Both sectors concur in indicating that
the strong point is “collaboration with local community and associations for persons
with disabilities to raise awareness in society and promote the incorporation and
integration of persons with disabilities in the labor market”.
In order to analyse the effect of managers’ subjectivity on perception of CSR
policies, we performed an aggregation using the Experton methodology (Kaufmann and
Gil-Aluja 1993) and uncertain averaging operators.
As regards the scale of operations (Table 5) the results show that firms operating
internationally enjoy more highly developed employment policies for persons with
disabilities than those restricted to the national sphere, regardless of the operator used.
In this respect, the experts consider that national companies have a level of development
of policies for occupational insertion between [0.50 , 0.64] by UA, [0.53 , 0.67] by
UPA, [0.50 , 0.64] by UWA and [0.51 , 0.65] by UPWA, while they consider that this
level is higher in the case of international companies, being between [0.57 , 0.70] by
UA, [0.62 , 0.75] by UPA, [0.55 , 0.68] by UWA and [0.58 , 0.71] by UPWA.
Nevertheless, when the responses on the 11-point scale are taken into consideration, the
position of national and international companies, in relation to policies for occupational
insertion, can be said to be “Under development”.
Analyzing the items, “collaboration with the local community and associations
for persons with disabilities in order to raise awareness in society and promote the
inclusion and integration of persons with disabilities in the labor market” is valued by
the experts as the most developed in both, national and internation companies. On the
other hand, “incorporation of questions on disability and integration in internal
surveys” is considered by the experts as the less developed policy in both groups of
companies. This policy is considered to be “Under planning” in national companies,
while in international companies is situaded between “Under planning” and “Under
development”.
Taking into account the sector, results show that construction and industry are
the sectors that most favor the integration of persons with disabilities through their
policies (Table 6). All operators indicate similar values ([0.56 , 0.61] by UA, [0.60 ,
0.65] by UPA, [0.54 , 0.59] by UWA and [0.56 , 0.62] by UPWA) and they have a
range between 5 and 6 points. Experts consider that policies in the construction/industry
sector are “Under development”.
Service sector companies have low levels of development, being the intervals
[0.44 , 0.60] by UA, [0.51 , 0.65] by UPA, [0.42 , 0.57] by UWA and [0.45 , 0.60] by
UPWA. In this case, the experts have a lower level of agreement. All the operators
indicate that the policies in service sector companies are “Under planning” and “Under
development”, except for UPA, that indicates they are “Under development”. With this
operator the level of agreement between experts is higher.
As was the case with the results obtained in the scale of operations, experts
believe that the most developed policy in both sectors is “collaboration with the local
community and associations for persons with disabilities in order to raise awareness in
society and promote the inclusion and integration of persons with disabilities in the
9
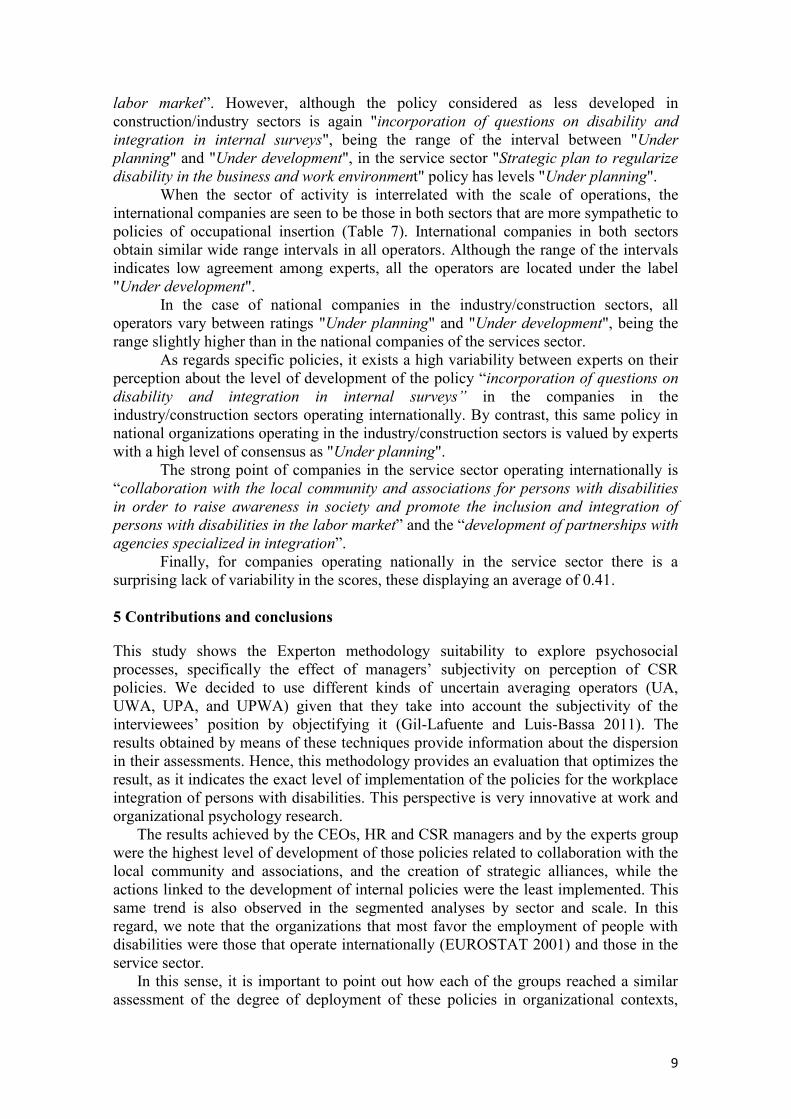
labor market”. However, although the policy considered as less developed in
construction/industry sectors is again "incorporation of questions on disability and
integration in internal surveys", being the range of the interval between "Under
planning" and "Under development", in the service sector "Strategic plan to regularize
disability in the business and work environment" policy has levels "Under planning".
When the sector of activity is interrelated with the scale of operations, the
international companies are seen to be those in both sectors that are more sympathetic to
policies of occupational insertion (Table 7). International companies in both sectors
obtain similar wide range intervals in all operators. Although the range of the intervals
indicates low agreement among experts, all the operators are located under the label
"Under development".
In the case of national companies in the industry/construction sectors, all
operators vary between ratings "Under planning" and "Under development", being the
range slightly higher than in the national companies of the services sector.
As regards specific policies, it exists a high variability between experts on their
perception about the level of development of the policy “incorporation of questions on
disability and integration in internal surveys” in the companies in the
industry/construction sectors operating internationally. By contrast, this same policy in
national organizations operating in the industry/construction sectors is valued by experts
with a high level of consensus as "Under planning".
The strong point of companies in the service sector operating internationally is
“collaboration with the local community and associations for persons with disabilities
in order to raise awareness in society and promote the inclusion and integration of
persons with disabilities in the labor market” and the “development of partnerships with
agencies specialized in integration”.
Finally, for companies operating nationally in the service sector there is a
surprising lack of variability in the scores, these displaying an average of 0.41.
5 Contributions and conclusions
This study shows the Experton methodology suitability to explore psychosocial
processes, specifically the effect of managers’ subjectivity on perception of CSR
policies. We decided to use different kinds of uncertain averaging operators (UA,
UWA, UPA, and UPWA) given that they take into account the subjectivity of the
interviewees’ position by objectifying it (Gil-Lafuente and Luis-Bassa 2011). The
results obtained by means of these techniques provide information about the dispersion
in their assessments. Hence, this methodology provides an evaluation that optimizes the
result, as it indicates the exact level of implementation of the policies for the workplace
integration of persons with disabilities. This perspective is very innovative at work and
organizational psychology research.
The results achieved by the CEOs, HR and CSR managers and by the experts group
were the highest level of development of those policies related to collaboration with the
local community and associations, and the creation of strategic alliances, while the
actions linked to the development of internal policies were the least implemented. This
same trend is also observed in the segmented analyses by sector and scale. In this
regard, we note that the organizations that most favor the employment of people with
disabilities were those that operate internationally (EUROSTAT 2001) and those in the
service sector.
In this sense, it is important to point out how each of the groups reached a similar
assessment of the degree of deployment of these policies in organizational contexts,

10
leading to a shared vision for the levels obtained by the semantic scale. Some authors
(Dess and Picken 2000; Maani and Benton 1999) note the importance of having a
shared vision among different organizational groups, since it facilitates organizational
development. Specifically, the set of policies analyzed marks the strategic lines to be
followed by organizations for effective integration of disabled persons. Hence, those
organizations that present a greater deployment of their policies will be the most
committed to the occupational insertion of persons with disabilities and show a
willingness to go beyond mere compliance with the law, while at the same time
organizational effectiveness is facilitated within the same company in terms of
satisfaction (Aharon et al. 2011), engagement (Brammer et al. 2007), identification
(Kim et al. 2010), and motivation (Skudiene and Auruskeviciene 2012).
Considering the data in detail, we observe that experts tend to value the policies for
the workplace integration of persons with disabilities as more developed, in
comparation with directors’ ratings. The CEOs, HR and CSR managers show a low
level of impact of motivational distortion, hence being more demanding when analyzing
the degree of deployment of CSR policies.
Finally, the most importat contribution of this research is to present a new way to
study psychosocial organizational phenomena, using an alternative way to fit
confidence intervals around the statistics values and to improve the estimation
procedure.
Given that this study was carried out in Spain its findings cannot be generalized.
Future research should include other sectors and countries in order to provide further
proof of the suitability of these methods using different sources and cultural contexts.

11
References
Aharon, T., Lior, O., Yaki, B., Gal, K.: Corporate social responsability, organizational
justice and job satisfaction: How do they interrelate, if at all?. Rev. Psicol. Trab.
Organ. 27(1), 67-72 (2011)
Barreiro, B., Díez, J., De Miguel, J. C.: The urban audit model. An evaluation using an
experton. Universidad de Santiago de Compostela, Santiago de Compostela
(2007)
Beliakov G, Calvo T, Pradera, A.: Aggregation Functions: A Guide for Practitioners.
Springer, Berlin (2007)
Brammer, S., Millington, A., Rayton, B.: The conctribution of corporate social
responsability to organizational commitment. Int. J. Hum. Resour. Man. 18, 1701-
1719 (2007)
Canós, L., Casasús, T., Crespo, E., Lara, T, Pérez, J. C.: Personnel selection based on
fuzzy methods. Rev. Mat.: Teor. Apl. 18(1), 177–192 (2011).
Capaldo, G., Zollo, G.: Applying fuzzy logic to personnel assessment: a case study.
Omega. 29, 585–597 (2001)
Chen, L.S., Cheng, C.H.: Selecting IS personnel use fuzzy GDSS based on metric
distance method. Eur. J. Oper. Res. 160(3), 803–820 (2005)
Dess, G.G., Picken, J.C.: Changing Roles: Leadership in the 21st Century. Organ. Dyn.
28(3), 18-34 (2000).
Emrouznejad A, Amin G.R.: Improving minimax disparity model to determine the
OWA operator weights. Inform. Sci. 180(8), 1477-1485 (2010).
EUROSTAT: Disability and social participation in Europe.
http://ec.europa.eu/health/reports/docs/disability_en.pdf (2001). Accesed 25
September 2014
Fred, D.: Conceptos de Administración Estratégica. Pearson Education, México (2003)
Gámez-González, J., Rondan-Cataluña, F. J., Diez de Castro, E., Navarro-Garcia, A.:
Toward an international code of franchising. Manag. Decis. 48(10), 1568-1595
(2010)
Gil-Lafuente, A., Luis-Bassa, C.: Fuzzy logic for the selection of customer service staff.
Investig Eur Dir Econ Empres. 17(2), 15-32 (2011)
Jin, F., Liu, P.: The multi-attribute group decision making method based on the
interval grey linguistic variables. Afr. J. Bus. Manag. 4(17), 3708-3715 (2010)
Kacprzyk, J., Zadrozny, S.: Towards a generalized and unified characterization of
individual and collective choice functions under fuzzy and nonfuzzy
preferences and majority via ordered weighted average operators. Int. J. Intell.
Syst. 24(1), 4-26 (2009)
Kaufmann, A., Gil-Aluja, J.: Técnicas especiales para la gestión de expertos.
Milladoiro, Vigo (1993)
Kaufmann, A., Gil-Aluja, J., Gil-Lafuente, A. M.: La creatividad en la gestión de las
empresas. Pirámide, Madrid (1994)
Kim, H., Lee, M., Lee, H., Kim, N.: Corporate social responsibility and employee-
company identification. J. Bus. Ethics. 95, 557-569 (2010)
Levrat, E., Voisin, A., Bombardier, S., Bremont, J.: Subjective evaluation of car seat
comfort with fuzzy set techniques. Int. J. Intell. Syst. 12, 891-913 (1997)
Liu, P.: Multi-attribute decision-making method research based on interval vague set
and TOPSIS method. Technol. Econ. Dev. Econ., 15(3), 453-463 (2009)
Liu, P.: Method for multiple attribute decision-making under risk with interval
numbers. Int. J. Fuzzy Syst. 12(3), 237-242 (2010)

12
Maani, K., Benton, C.: Rapid Team Learning: Lessons from Team New Zealand
America’s Cup Campaign. Org. Dyn.. 28(4), 48-62 (1999)
Merigó, J.M.: The probabilistic weighted averaging operator and its application in
decision making. Intersymp 2009, Baden-Baden, Germany, 55-58 (2009)
Merigó, J.M.: The uncertain probabilistic weighted average and its application in the
theory of expertons. Afr. J. . Bus. Manag. 5(15), 6092-6102 (2011)
Merigó, J.M., Casanovas, M.: Induced and heavy aggregation operators with distance
measures. J. Syst. Eng. Elect. 21(3), 431-439 (2010)
Merigó, J.M., Casanovas, M.: The uncertain induced quasi-arithmetic OWA operator.
Int. J. Intel. Syst. 26(1), 1-24 (2011)
Merigó, J.M., Gil-Lafuente, A.M.: The induced generalized OWA operator. Inform. Sci.
179(6), 729-741 (2009)
Moore, R.: Interval analysis. Prentice Hall, Englewood Cliffs, NJ (1966)
Navarro, J.: Caos, complejidad y consultoria. In Quijano, S. (Dir.) Direción de recursos
humanos y consultoría en las organizaciones. El ASH (Auditoría del Sisitema
Humano, pp. 171-198. Icaria, Barcelona (2006)
Reig, J., González, J.F.: Modelo borroso de control de gestión de materiales. Rev. Esp.
Finan. Contab. 31(112), 431-459 (2002)
Skudiene, V., Auruskeviciene, V.: The contribution of corporate social responsability to
internal employee motivation. Balt. J. Manag. 7(1), 49-67 (2012)
Tan, C., Chen, X.: Induced Choquet ordered averaging operator and its application in
group decision making. Int. J. Intell. Syst. 25(1), 59-82 (2010)
Wei, G.W.: Uncertain linguistic hybrid geometric mean operator and its application
to group decision making under uncertain linguistic environment. Int. J. Uncert.
Fuzz. Know. Based Syst. 17(2), 251-267 (2009)
Yager, R.R.: On ordered weighted averaging aggregation operators in multi-criteria
decision making. IEEE Trans. Syst. Man Cybern. 18(1), 183-190 (1988)
Yager, R.R.: Families of OWA operators. Fuzzy Sets Syst. 59(2), 125-148 (1993)
Yager, R.R.: Norms induced from OWA operators. IEEE Trans. Fuzzy Syst. 18(1),
57-66 (2010)
Yager, R.R., Kacprzyk, J.: The ordered weighted averaging operators: Theory and
applications. Kluwer Academic Publishers, Norwell, MA (1997)
Zalila, Z., Guenant, A., Martin, J.: Application of experton theory in te sensory analysis
of cell phone flaps. Qual. Eng. 17(4), 727-734 (2005)
Zhou, L.G., Chen, H.Y.: Generalized ordered weighted logarithm aggregation
operators and their applications to group decision making. Int. J. Intell. Syst.
25(7), 683-707 (2010)

1
Fig 1 Graph illustrating the opinion of the experts on the item example
.0
.1
.2
.3
.4
.5
.6
.7
.8
.9
1.0
.0 .1 .2 .3 .4 .5 .6 .7 .8 .9 1.0
Accu
mu
late
d f
un
cti
on
Values
ITEM EXAMPLE
Lower level
Upper level

1
Table 1 Description of participating companies
SOCIO-DEMOGRAPHIC DATA ON THE PARTICIPATING COMPANIES %
Gender distribution of company
employees (average %)
Men
Women
62.3
37.9
Scale of operations International
National
Regional Local
50
32.5
5 12.5
Business sector Manufacturing industry
Construction
Wholesale and retail trade, vehicle repairs Transport and storage
Professional, scientific and technical activities,
Administrative activities and auxiliary services Hotel and catering
Other services
56.4
2.6
5.1 5.1
10.3
5.1 10.3
5.1
Companies that comply with the
2% quota of disabled workersa
79.8
Companies that comply with
alternative measures
Donations and sponsorship
Employment of staff through a job center for disabled persons
No compliance
NS/NC
11.9
21.4
50
7.1 aThe Spanish Law on Social Integration of the Disabled (LISMI - Law 13/1982) stipulates the legal obligation of
companies over 50 employees to cover a 2% staff quota with persons with disabilities or else comply with the law by
means of alternative measures.

1
Table 2 Items from the interview guidelines concerning policies for the integration of persons with disabilities
ITEMS CORRESPONDING TO POLICIES MEASURING SCALE
I1 Are questions about disability and integration included in the company’s internal
surveys?
1=No 2=Under planning
3=Under development
4=Implemented
I2
Does the company collaborate with the local community and associations for
persons with disabilities to raise awareness in society and promote the inclusion and integration of persons with disabilities in the labor market?
I3 Is the communication plan tailored to employees’ specific needs?
I4 Has the company developed partnerships with agencies specialized in integrating people with disabilities?
I5 Do corporate policies exist that define the company’s commitment and objectives
in the field of the integration in the workplace of persons with disabilities?
I6 Does the company have a strategic plan addressed to its main stakeholders to
regularize disability in the business and work environment

1
Table 3 Example of applied experton methodology
0 1
0,1
0,2 2
0,3 1
0,4 1 1
0,5 1 1
0,6
0,7
0,8 2
0,9 1
1 1
0 1/6
0,1
0,2 2/6
0,3 1/6
0,4 1/6 1/6
0,5 1/6 1/6
0,6
0,7
0,8 2/6
0,9 1/6
1 1/6
0 6/6 6/6
0,1 5/6 6/6
0,2 5/6 6/6
0,3 3/6 6/6
0,4 3/6 5/6
0,5 2/6 4/6
0,6 1/6 3/6
0,7 1/6 3/6
0,8 1/6 3/6
0,9 1/6 1/6
1 0/6 1/6

1
Table 4 Distribution of frequencies of the items (%)
Item Variable Category No Under
Planning
Under
development Implemented
I1
Scale
National 84.2 - 10.5 5.3
International 73.7 5.3 5.3 15.8
Sector
Industry/
construction 81 4.8 4.8 9.5
Services 81.3 - 6.3 12.5
Global 75 5 7.5 12.5
I2
Scale
National 50 - 10 40
International 25 5 20 50
Sector
Industry/
construction 39.1 4.3 21.7 34.8
Services 37.5 - - 62.5
Global 35.7 2.4 14.3 47.6
I3
Scale
National 60 5 20 15
International 70 5 15 10
Sector
Industry/ construction
60.9 8.7 13 17.4
Services 75 - 18.8 6.3
Global 61.9 4.8 19 14.3
I4
Scale
National 52.6 5.3 10.5 31.6
International 30 10 5 55
Sector
Industry/ construction
39.1 13 4.3 43.5
Services 46.7 - 6.7 46.7
Global 39 7.3 9.8 43.9
I5
Scale
National 40 20 15 25
International 50 10 10 30
Sector
Industry/ construction
47.8 17.4 8.7 26.1
Services 43.8 12.5 12.5 31.3
Global 42.9 14.3 14.3 28.6
I6
Scale
National 75 5 10 10
International 70 - 10 20
Sector
Industry/
construction 65.2 - 13 21.7
Services 87.5 - 6.3 6.3
Global 69 2.4 11.9 16.7
Average percentage 53.9 6 12.8 27.3

1
Table 5 Experton mathematical expectations and their averages according to scale of operations
ITEM National International
I1 Are questions about disability and integration included in the
company’s internal surveys? [0,37 , 0,50] [0,44 , 0,57]
I2
Does the company collaborate with the local community and
associations to raise awareness in society and promote integration?
[0,60 , 0,74] [0,72 , 0,86]
I3 Is the communication plan tailored to employees’ specific
needs? [0,50 , 0,65] [0,46, 0,60]
I4 Have partnerships with agencies specialized in integration been
developed? [0,53 , 0,66] [0,70 , 0,84]
I5 Have the company’s commitment and objectives been defined in the field of integration?
[0,57 , 0,72] [0,58 , 0,71]
I6 Has a strategic plan been developed to regularize disability in the
business and work environment? [0,44 , 0,57] [0,50 , 0,63]
EXPERTON AVERAGE
UA [0,50 , 0,64] [0,57 , 0,70]
UPA [0,53 , 0,67] [0,62 , 0,75]
UWA [0,50 , 0,64] [0,55 , 0,68]
UPWA [0,51 , 0,65] [0,58 , 0,71]

1
Table 6 Experton mathematical expectations and their averages according to sector.
ITEMS Industry/Construction Services
I1 Are questions about disability and integration included in the
company’s internal surveys? [0,40 , 0,53] [0,33 , 0,56]
I2
Does the company collaborate with the local community and
associations to raise awareness in society and promote integration?
[0,73 , 0,77] [0,71 , 0,84]
I3 Is the communication plan tailored to employees’ specific
needs? [0,50 , 0,54] [0,34, 0,48]
I4 Have partnerships with agencies specialized in integration been
developed? [0,63 , 0,67] [0,50 , 0,63]
I5 Have the company’s commitment and objectives been defined in the field of integration?
[0,56 , 0,60] [0,49 , 0,63]
I6 Has a strategic plan been developed to regularize disability in the
business and work environment? [0,51 , 0,55] [0,29 , 0,43]
EXPERTON AVERAGE
UA [0,56 , 0,61] [0,44 , 0,60]
UPA [0,60 , 0,65] [0,51 , 0,65]
UWA [0,54 , 0,59] [0,42 , 0,57]
UPWA [0,56 , 0,62] [0,45 , 0,60]

1
Table 7 Experton mathematical expectations and their averages to sector and scale
ITEMS
National
Industry/
Construction
National
Services
International
Industry/
Construction
International
Services
I1 Are questions about disability and integration included in the company’s internal surveys?
[0,30 , 0,44] [0,41 , 0,56] [0,13 , 0,58] [0,43 , 0,58]
I2 Does the company collaborate with the local community and associations to raise awareness
in society and promote integration?
[0,46 , 0,63] [0,68 , 0,63] [0,70 , 0,85] [0,78 , 0,93]
I3 Is the communication plan tailored to
employees’ specific needs? [0,51 , 0,69] [0,48, 0,63] [0,49 , 0,64] [0,33 , 0,48]
I4 Have partnerships with agencies specialized in integration been developed?
[0,51 , 0,69] [0,61 , 0,76] [0,67 , 0,83] [0,78 , 0,93]
I5 Have the company’s commitment and objectives been defined in the field of
integration?
[0,56 , 0,70] [0,58 , 0,78] [0,55 , 0,70] [0,60 , 0,78]
I6
Has a strategic plan been developed to
regularize disability in the business and work environment?
[0,46 , 0,63] [0,41 , 0,41] [0,53 , 0,68] [0,33 , 0,58]
EXPERTON AVERAGE
UA [0,47 , 0,63] [0,53 , 0,66] [0,51 , 0,71] [0,54 , 0,70]
UPA [0,48 , 0,64] [0,57 , 0,72] [0,58 , 0,76] [0,63 , 0,78]
UWA [0,47 , 0,63] [0,51 , 0,64] [0,50 , 0,70] [0,50 , 0,66]
UPWA [0,47 , 0,64] [0,54 , 0,67] [0,53 , 0,72] [0,55 , 0,71]