author's personal copy - california state polytechnic ...minghengli/pdfs/thermodynamic analysis...
TRANSCRIPT

This article appeared in a journal published by Elsevier. The attachedcopy is furnished to the author for internal non-commercial researchand education use, including for instruction at the authors institution
and sharing with colleagues.
Other uses, including reproduction and distribution, or selling orlicensing copies, or posting to personal, institutional or third party
websites are prohibited.
In most cases authors are permitted to post their version of thearticle (e.g. in Word or Tex form) to their personal website orinstitutional repository. Authors requiring further information
regarding Elsevier’s archiving and manuscript policies areencouraged to visit:
http://www.elsevier.com/copyright
Author's personal copy
Thermodynamic analysis of adsorption enhancedreforming of ethanol
Mingheng Li*
Department of Chemical and Materials Engineering, California State Polytechnic University, Pomona, CA 91768, USA
a r t i c l e i n f o
Article history:
Received 9 July 2009
Received in revised form
14 September 2009
Accepted 21 September 2009
Available online 17 October 2009
Keywords:
Hydrogen generation
Adsorption enhanced reforming
Thermodynamic analysis
Graphite formation
a b s t r a c t
Adsorption enhanced reforming (AER) is a novel hydrogen generation method. To study
hydrogen yield and graphite formation in the AER process, a recently developed thermo-
dynamic code for reaction–adsorption systems is extended to account for the formation of
condensed species. Parametric analysis of the steam reforming of ethanol is performed to
study the effect of adsorption and other parameters (temperature, pressure, steam/carbon
ratio and O2/ethanol ratio in the feed) on the yield of hydrogen and the formation of
graphite. It is shown that with CO2 adsorption, the hydrogen yield is enhanced while the
graphite formation is suppressed. Based on the thermodynamic analysis, AER is a potential
low-temperature method for hydrogen generation.
ª 2009 Professor T. Nejat Veziroglu. Published by Elsevier Ltd. All rights reserved.
1. Introduction
As reducing the demand on fossil resources has been
a public concern, hydrogen, being a potential carrier of clean
energy, is now an important topic that may lead into a new
era of energy research. Among various industrial tech-
niques, steam reforming of hydrocarbons accounts for about
50% of the hydrogen produced over the world. In the United
States, 95% of the hydrogen production is made through
steam reforming of methane [1]. In this sense, steam
reforming serves as a foundation in America’s transition to
a hydrogen economy.
The past decade witnessed a significant development in
steam reforming. On the feedstock side, the reforming of
biomass-derived hydrocarbons (e.g., bio-ethanol) is widely
acknowledged as a potentially viable, renewable and
carbon-neutral (or even carbon-negative in conjunction
with sequestration) process [2–4]. On the technology side,
the steam reforming combined with CO2 removal using
adsorption [5–10] or membrane [11] is shown to signifi-
cantly enhance the yield and purity of hydrogen. When CO2
is removed from the reforming process, the thermody-
namic limitation of the water gas shift reaction
(COþH2O¼CO2þH2) is circumvented and therefore, the
chemical equilibrium shifts to the right, resulting in an
enhancement in the extent of the forward reaction.
Removing CO2 from the reactive system enables a relatively
lower reforming temperature, thus alleviating the require-
ment for both the catalyst and the reactor. Moreover, the
higher purity in the syngas leaving the reformer makes it
easier for downstream hydrogen separation, which is
typically achieved through a pressure swing adsorption (or
PSA) unit. Extensive experimental and computational
studies indicate that reforming with simultaneous CO2
removal is a very promising technique for enhanced
hydrogen production [11–14]. Ongoing research is
* Tel.: þ1 909 869 3668; fax: þ1 909 869 6920.E-mail address: [email protected]
Avai lab le at www.sc iencedi rect .com
journa l homepage : www.e lsev ie r . com/ loca te /he
0360-3199/$ – see front matter ª 2009 Professor T. Nejat Veziroglu. Published by Elsevier Ltd. All rights reserved.doi:10.1016/j.ijhydene.2009.09.054
i n t e r n a t i o n a l j o u r n a l o f h y d r o g e n e n e r g y 3 4 ( 2 0 0 9 ) 9 3 6 2 – 9 3 7 2

Author's personal copy
conducted by various companies such as Chevron, Shell
and Intelligent Energy to commercialize these novel
reforming technologies [8,15,16].
Despite their wide utilization for hydrogen generation,
the reforming processes (including the aforementioned
enhanced reforming processes) might be accompanied by
unfavorable formation of graphite under certain conditions,
which could lead to catalyst deactivation and reformer
malfunction due to its accumulative nature [12,17–27].
Studies have shown that the formation of graphite can be
suppressed by using high steam/carbon (or S/C) ratios in the
feedstock [17,20,24,28], adding oxygen to the feed [20],
doping with a trace amount of sulphur, tin, chromium,
molybdenum, potassium, and gold on the catalyst [18,23–
25,29], adjusting reforming temperatures [30], enhancing
support (e.g., alumina, silica, magnesia, zirconia, and ceria
[25,31]), and adding sodium [32] etc. However, due to the
inherent complexity of various coupled physicochemical
phenomena involved in the reforming process, no general
fundamental understanding is currently available towards
the graphite formation and catalyst deactivation [12,21,26].
Bridging such a gap could germinate solutions to a longer
catalyst lifetime, which will lead to significant economical
benefits in the reforming process. Thermodynamic
modeling has been a powerful tool in the analysis of
hydrogen generation and fuel cells [33–37] and may provide
insight into graphite-free operating windows for the AER
process. However, to the best knowledge of the author,
a generic thermodynamic model that accounts for gaseous
reaction, adsorption, and formation of condensed species is
not yet available. Motivated by this, a comprehensive ther-
modynamic model is developed in this work to calculate the
equilibrium compositions in both the gaseous and the
condensed phases of general reaction–adsorption systems.
The thermodynamic analysis is carried out for steam
reforming of ethanol under various operating conditions
and it shows that adsorption enhanced reforming (AER) is
advantageous over conventional reforming processes not
only in terms of hydrogen yield but also in graphite
suppression. Such an analysis might be used to guide the
design and operation of an AER process.
2. Equilibrium of reaction–adsorptionsystems with formation of condensed species
The aim of this work is to develop a comprehensive thermo-
dynamic model to analyze reaction–adsorption systems
coupled by formation of condensed species. In the context of
AER of hydrocarbons, the adsorbed species of interest is CO2,
and the condensed species is graphite [5,10,13,14,38,39]. Multi-
component adsorption and multi-component condensation
might also be included in the current model to handle other
condensed species and the adsorption of gaseous species
besides CO2.
The equilibrium algorithm is based on the minimization of
the total Gibbs free energy in an isothermal and isobaric
system. Different from the equilibrium constant method, the
Gibbs minimization approach does not require the specifica-
tion of a detailed reaction scheme. A list of reactants and
possible products and their thermodynamic properties suffice
for the equilibrium calculation. Interested readers may refer
to a previous work for a comparison of both approaches for
solving a generic adsorption–reaction system with no
condensed species [40]. The condensed species have different
forms in the Gibbs free energy and pose a mathematical
challenge to the optimization algorithm. In order to calculate
the Gibbs free energy, the concept of mole ratio between the
gaseous species and the adsorbed species [40] is employed
here. According to the Langmuir adsorption/desorption iso-
therm (and also the equilibrium chemisorption isotherms of
CO2 on hydrotalcites [14,35]), the adsorbed amount of a
species follows the relationship below:
nðadsÞj ¼ S
nðadsÞj;sat bjPj
1þXs
j¼1
bjPj
¼ SnðadsÞ
j;sat bjnj
nTP
1þXs
j¼1
bj
nj
nTP
ðj ¼ 1;.; sÞ (1)
0 10 20 30 40 50 600
10
20
30
40
50
60
Measured mole fraction (%)
Pred
icte
d m
ole
fract
ion
(%)
COCO2CH4H2H2O
Fig. 1 – Comparison of gas composition of steam reforming of ethanol solved using the current equilibrium code with
experimental data [42] under various conditions (S/C [ 2, 3, 4, P [ 2, 5, 9 bar, T [ 700 8C and no CO2 adsorption).
i n t e r n a t i o n a l j o u r n a l o f h y d r o g e n e n e r g y 3 4 ( 2 0 0 9 ) 9 3 6 2 – 9 3 7 2 9363

Author's personal copy
where nj is the amount of species j in the gas phase ([mole]),
nj(ads) is the amount of species j on the adsorbent ([mole]), nj,
sat(ads) is the saturated surface concentration ([mole/m2]), S is
the total surface area of the adsorbent [m2], bj is a constant
for species j under isothermal conditions ([bar–1]), Pj is the
partial pressure of species j in the gas phase, and P is the
system pressure. nT ¼Ps
j¼1 nj, where s is the number of
gaseous species. For the adsorption of gaseous species on an
adsorbent, nj, sat(ads) and bj can be determined experimentally. S
is then derived as the product of the experimentally
measured specific surface area of the adsorbent and its
weight. From Eq. (1), the ratio of nj(ads) to nj is expressed as
follows:
rj ¼nðadsÞ
j
nj¼
SnðadsÞj;sat bjP
nT þXs
j¼1
bjnjP
ðj ¼ 1;.; sÞ (2)
Because the adsorbed species and its gaseous counterpart have
the same chemical potential under chemical equilibrium, the
optimization problem is formulated as follows:
minnj
G ¼Xs
j¼1
�1þ rj
�mjnj þ
Xt
j¼sþ1
mjnj
s:t:
0 ¼Xs
j¼1
�1þ rj
�aijnj þ
Xt
j¼sþ1
aijnj � bið0Þ ði ¼ 1;.; 3Þ
mj ¼
8<:
m0j þ RT ln
P
P0þ RT ln
nj
nTðj ¼ 1;.; sÞ
m0j ðj ¼ sþ 1;.; tÞ
nT ¼Xs
j¼1
nj
rj ¼SnðadsÞ
j;sat bjP
nT þXs
j¼1
bjnjP
ðj ¼ 1;.; sÞ
nj � 0 ðj ¼ 1;.; tÞ
(3)
where G is the Gibbs free energy, mj is the chemical potential
for species j, aij is the number of element i in species j, bi(0)
is the total number of element i in the feed mixture bið0Þ ¼Ptj¼1 aijnjð0Þ, where nj(0) is the amount of species j in the feed),
0 stands for standard conditions, and t is the total number of
species including the condensed material.
The known parameters are T, P, S and nj(0) and the
variables to be determined are rj ( j¼ 1,., s), nj ( j¼ 1,., t), li
(i¼ 1,., e) and nT. Due to the complexity of the problem
represented by Eq. 3, one could solve an equivalent
problem in which T, P, rj ( j¼ 1,., s) and nj(0) are known
while S, nj ( j¼ 1,., t), li (i¼ 1,., e) and nT are to be deter-
mined [40]. However, it is worth noting that the following
relationship:
ri
rj¼
nðadsÞi;sat bi
nðadsÞj;sat bj
(4)
should be satisfied when specifying rj ( j¼ 1,., s) if multiple
component adsorption occurs in the system.
It is also worth noting that inequity constraints nj� 0
( j¼ 1,., s) are handled in the solution procedure by solving ln
nj instead of nj [40,41]. To avoid singularity problems when
taking logarithms of extremely small positive numbers, any nj
that is less than 10�50 will be replaced by this number during
the iteration process.
The constrained optimization problem represented by Eq. (3)
can be solved by the Lagrange multiplier method. Based on this
method, an auxiliary function is first defined as follows:
f ¼Ps
j¼1 ð1þ rjÞmjnj þPt
j¼sþ1 mjnj þPe
i¼1 li
hPsj¼1ð1þ rjÞaijnjþPt
j¼sþ1 aijnj � bið0Þi, where li are the Lagrange multipliers for the
atomic balance constraints. As a result, the optimal solution to
the optimization problem of Eq. (3) is determined by solving the
following equations:
0 ¼�1þ rj
�"mj þ
Xe
i¼1
aijli
#ðj ¼ 1;.; sÞ
0 ¼ mj þXe
i¼1
aijli ðj ¼ sþ 1;.; tÞ
0 ¼Xs
j¼1
�1þ rj
�aijnj þ
Xt
j¼sþ1
aijnj � bið0Þ ði ¼ 1;.; 3Þ
mj ¼(
m0j þ RT ln
PP0þ RT ln
nj
nTðj ¼ 1;.; sÞ
m0j ðj ¼ sþ 1;.; tÞ
nT ¼Xs
j¼1
nj
(5)
The decent Newton–Raphson method is used to solve the
above problems, and the iterative variables are chosen to be D
ln nj ( j¼ 1,., s), D ln nj ( j¼ sþ 1,., t), D ln nT and pi¼�li/RT
(i¼ 1,., e) which are different from the NASA Chemical
Equilibrium with Applications (CEA) code [41]. The following
iterative formulas are then derived:
0 ¼ �mj
RTþXe
i¼1
aijpi þ D ln nT � D ln nj ðj ¼ 1;.; sÞ
0 ¼Xe
i¼1
aijpi �mj
RTðj ¼ sþ 1;.; tÞ
0 ¼Xs
j¼1
�1þ rj
�aijnj þ
Xt
j¼sþ1
aijnj � bið0Þ
þXs
j¼1
�1þ rj
�aijnjD ln nj þ
Xt
j¼sþ1
aijnjD ln nj ði ¼ 1;.; 3Þ
0 ¼Xs
j¼1
nj � nT þXs
j¼1
njD ln nj � nTD ln nT
mj ¼(
m0j þ RT ln
PP0þ RT ln
nj
nTðj ¼ 1;.; sÞ
m0j ðj ¼ sþ 1;.; tÞ
(6)
The ‘‘reduced Gibbs iteration’’ scheme [41] is employed to
effectively track a large number of species. The idea is to
cancel D ln nj in Eq. (6). Consequently, the following equations
are derived:
i n t e r n a t i o n a l j o u r n a l o f h y d r o g e n e n e r g y 3 4 ( 2 0 0 9 ) 9 3 6 2 – 9 3 7 29364
Author's personal copy
Xe
k¼1
�Xs
j¼1
�1þ rj
�akjaijnj
�pk þ
Xt
j¼sþ1
aijnjDln nj
þ�Xs
j¼1
�1þ rj
�aijnj
�DlnnT ¼
�bið0Þ �
Xs
j¼1
�1þ rj
�aijnj
�Xt
j¼sþ1
aijnj þXs
j¼1
�1þ rj
�aijnj
mj
RT
�ði ¼ 1;.; eÞ
Xe
k¼1
akjpk ¼mj
RTðj ¼ sþ 1;.; tÞ
Xe
k¼1
�Xs
j¼1
akjnj
�pk þ
�Xs
j¼1
nj � nT
�Dln nT
¼�nT �
Xs
j¼1
nj þXs
j¼1
nj
mj
RT
�
mj ¼(
m0j þ RT ln
PP0þ RT ln
nj
nTðj ¼ 1;.; sÞ
m0j ðj ¼ sþ 1;.; tÞ
(7)
Eq. (7) is an eþ t–sþ 1 dimensional linear equation which can
be written in a matrix form. The variables to be determined at
each iteration step are pk (k¼ 1,., e), D ln nj ( j¼ sþ 1,., t) and
nT. During the iteration process, if any column vector has
a norm close to zero such that the matrix becomes nearly
singular, the associated variable will be temporarily removed
from Eq. (7). The solution procedure is described as follows.
With initial guesses of nj ( j¼ 1,., t) and nT, Eq. (7) is solved to
determine D ln nj ( j¼ sþ 1,., t) and D ln nT. D ln nj ( j¼ 1,., s) is
then determined using the first equation in Eq. (6). Subse-
quently, nj ( j¼ 1,., t) and nT are updated. To avoid divergence
of the algorithm, the step size used for updating nj ( j¼ sþ 1,.,
t) is smaller than nj ( j¼ 1,., s) and nT. The iterative procedure
continues until the changes in all the correction variables in
Eq. (7) fall into specified regions [40]. The thermodynamic data
of each species at temperature T, such as the heat capacity,
enthalpy, entropy and chemical potential are calculated as
functions of temperature [41].
3. Thermodynamic analysis of the effect ofCO2 adsorption on steam reforming of ethanol
A reactive system consisting of steam and ethanol is studied
in this section. The steam reforming of biomass-generated
ethanol would be a potentially viable and renewable process
for hydrogen production [2–4]. Experimental studies have
shown that for a system of hydrocarbon (e.g., methane,
methanol or ethanol) and steam, the yield and purity of
hydrogen can be significantly improved if CO2 is adsorbed [5–
10]. Calculations in this section will provide a quantitative
thermodynamic analysis of the AER process.
In the steam reforming of ethanol, the most common
products and by-products would be H2, CH4, CO, CO2 and C
300400
500600
0.51
1.52
2.50
1
2
3
Temperature (oC)S/C ratio
H2
a
300400
500600
0.51
1.52
2.50
1
2
3
4
5
Temperature (oC)S/C ratio
H2
b
300400
500600
0.51
1.52
2.50
0.2
0.4
0.6
0.8
Temperature (oC)S/C ratio
Gra
phite
c
300400
500600
0.51
1.52
2.50
0.2
0.4
0.6
0.8
Gra
phite
Temperature (oC)S/C ratio
d
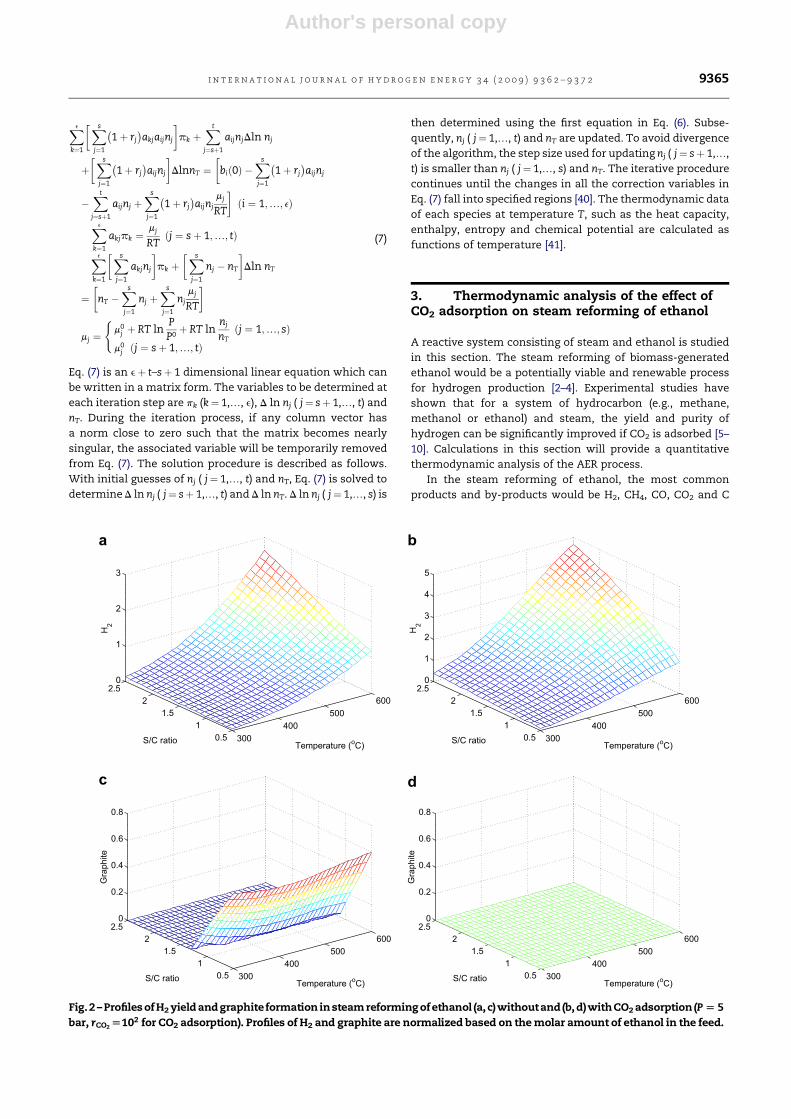
Fig.2 – Profiles ofH2 yield andgraphite formation insteam reforming ofethanol (a, c) withoutand (b, d)withCO2 adsorption (P [ 5
bar, rCO2 [102 for CO2 adsorption). Profiles of H2 and graphite are normalized based on the molar amount of ethanol in the feed.
i n t e r n a t i o n a l j o u r n a l o f h y d r o g e n e n e r g y 3 4 ( 2 0 0 9 ) 9 3 6 2 – 9 3 7 2 9365
Author's personal copy
(graphite). An inclusion of more species would not affect the
complexity of this problem because the developed algorithm
is based on the reduced Gibbs iteration. One possible reaction
scheme, specified based on the minimum number of inde-
pendent reactions, is listed as follows:
C2H5OH ¼ CH4þCOþH2 (8a)
CH4þH2O ¼ COþ 3H2 (8b)
COþH2O ¼ CO2þH2 (8c)
2CO ¼ CO2þC (8d)
As mentioned earlier, these reactions are not necessary in the
calculation of equilibrium composition using the Gibbs mini-
mization approach. However, they are helpful for the expla-
nation of gas composition change as operating conditions vary.
The developed algorithm is first applied to a conventional
steam reforming of ethanol process with no CO2 adsorption
300400
500600
0.51
1.52
2.5
0.8
1
1.2
1.4
1.6
Temperature (oC)S/C ratio
CH
4
a
300400
500600
0.51
1.52
2.50
0.5
1
1.5
Temperature (oC)S/C ratio
CH
4
b
300400
500600
0.51
1.52
2.50
0.1
0.2
0.3
0.4
Temperature (oC)S/C ratio
CO
c
300400
500600
0.51
1.52
2.50
0.005
0.01
0.015
0.02
Temperature (oC)S/C ratio
CO
d
300400
500600
0.51
1.52
2.50.2
0.4
0.6
0.8
1
Temperature (oC)S/C ratio
CO
2
e
300400
500600
0.51
1.52
2.50.005
0.01
0.015
0.02
Temperature (oC)S/C ratio
CO
2
f
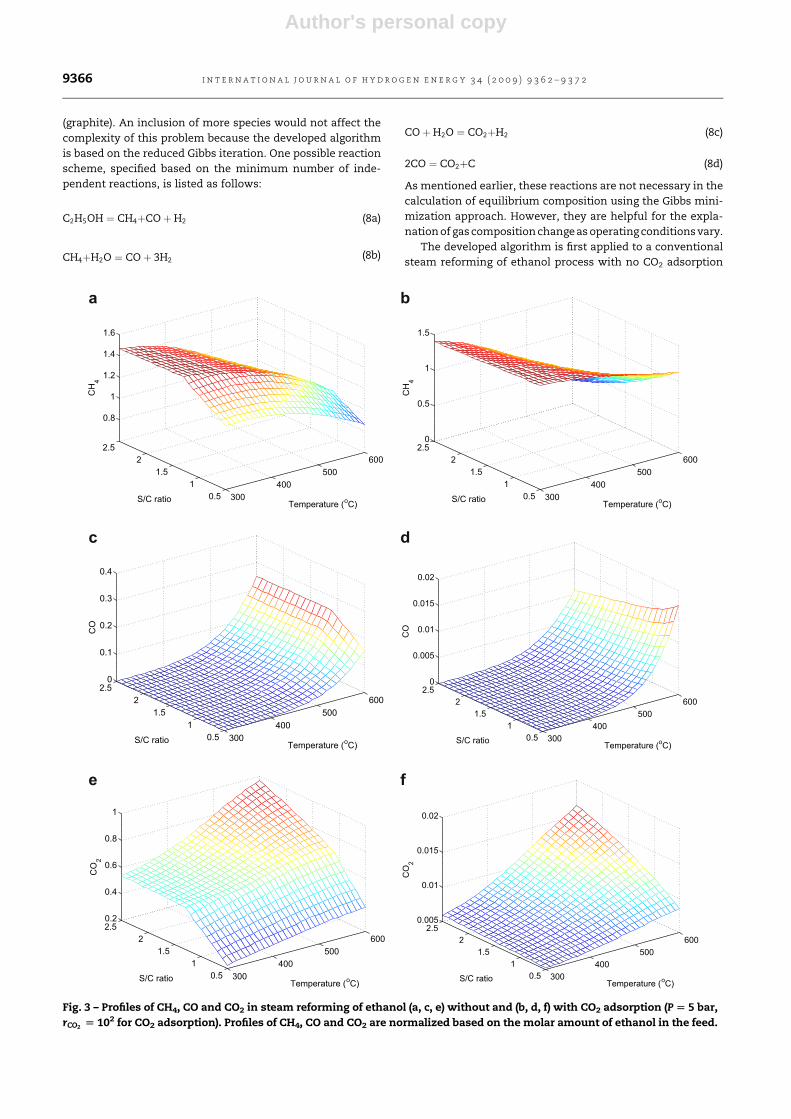
Fig. 3 – Profiles of CH4, CO and CO2 in steam reforming of ethanol (a, c, e) without and (b, d, f) with CO2 adsorption (P [ 5 bar,
rCO2 [ 102 for CO2 adsorption). Profiles of CH4, CO and CO2 are normalized based on the molar amount of ethanol in the feed.
i n t e r n a t i o n a l j o u r n a l o f h y d r o g e n e n e r g y 3 4 ( 2 0 0 9 ) 9 3 6 2 – 9 3 7 29366
Author's personal copy
(i.e., rCO2 ¼ 0) [42]. In this process, the reforming occurs in
a tube reactor where Ni was used as the catalyst. All carbon
containing gases in the product gas mixture were analyzed
using a NDIR spectrometer. A comparison of model predicted
gas composition in the steam reforming of ethanol using Ni as
catalyst with experimental data under various pressures and
steam/carbon ratios is given in Fig. 1. The model prediction
matches the experimental data very well, which partly
validates the accuracy of the developed thermodynamic
model.
The equilibrium analysis is then made for steam reforming
of ethanol with/without CO2 adsorption at various S/C ratios,
temperatures and a fixed pressure of 5 bar. In the case of CO2
adsorption, rCO2 is set to be 102. It is shown in Fig. 2 that in both
cases, the yield of hydrogen increases as the S/C ratio or the
temperature increases. When CO2 is partly removed form the
system by adsorption, the hydrogen yield is improved (by 8–
178%). The enhancement in hydrogen yield is more prominent
at low temperatures and S/C ratios higher than 1.3. Moreover,
while the graphite formation is very severe when the S/C is
below 1.3 when no CO2 is adsorbed, it reduces to a minimal
level when adequate CO2 adsorption is taken into effect.
The profiles of CH4, CO and CO2 with/without CO2
adsorption are shown in Fig. 3. It is worth noting that
rCO2 ¼ 102 means the amount of CO2 in the gaseous phase is
1% of the one adsorbed on the surface of the adsorbent. If one
compares the CO2 in the gaseous phase in Fig. 3(e) (without
adsorption) and (f) (with adsorption), the latter is not exactly
1% but between 1% and 2% of the former. This is because the
entire reactive system behaves like a buffer solution [40].
When CO2 is partly adsorbed on the surface of adsorbent, it is
generated by other reaction mechanisms, e.g., the water gas
shift reaction (Eq. 8c). Because the CO2 generation partly
compensates for the removal in the gaseous phase due to
adsorption, the total amount of CO2 (in both the gaseous
phase and on the surface) is more in the case of AER. This also
explains why the CO concentration in the gas phase is reduced
to a minimal level when substantial CO2 is removed by
adsorption (The CO in Fig. 3(d) is only 2–10% of the one in
Fig. 3(b)). The reduction in CO2 and CO favors the water gas
shift reaction (Eq. 8c) and the methane reforming reaction (Eq.
8b), leading to an enhancement in the hydrogen yield. Even
though the reduction in CO2 is more than the one in CO when
CO2 is substantially adsorbed, the carbon formation reaction
(Eq. 8d) moves backwards because its equilibrium constant is
related to the square of CO concentration.
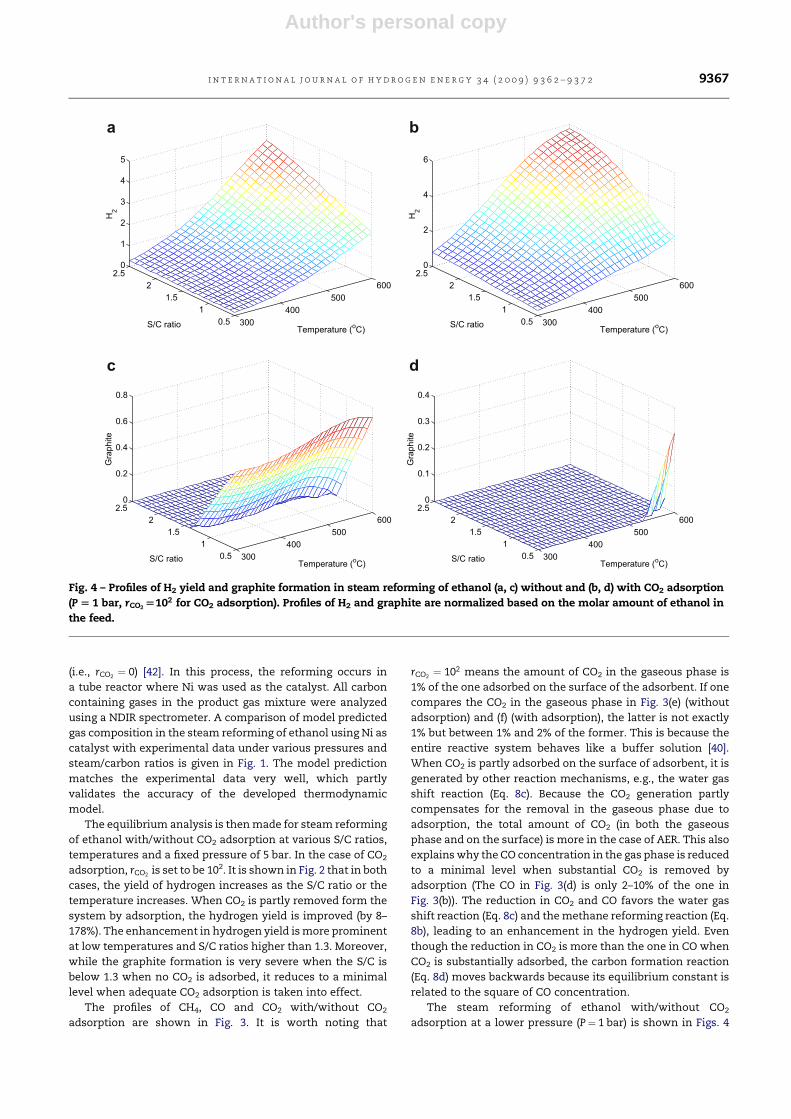
The steam reforming of ethanol with/without CO2
adsorption at a lower pressure (P¼ 1 bar) is shown in Figs. 4
300400
500600
0.51
1.52
2.50
1
2
3
4
5
Temperature (oC)S/C ratio
H2
a
300400
500600
0.51
1.52
2.50
2
4
6
Temperature (oC)S/C ratio
H2
b
300400
500600
0.51
1.52
2.50
0.2
0.4
0.6
0.8
Temperature (oC)S/C ratio
Gra
phite
c
300400
500600
0.51
1.52
2.50
0.1
0.2
0.3
0.4
Temperature (oC)S/C ratio
Gra
phite
d
Fig. 4 – Profiles of H2 yield and graphite formation in steam reforming of ethanol (a, c) without and (b, d) with CO2 adsorption
(P [ 1 bar, rCO2 [102 for CO2 adsorption). Profiles of H2 and graphite are normalized based on the molar amount of ethanol in
the feed.
i n t e r n a t i o n a l j o u r n a l o f h y d r o g e n e n e r g y 3 4 ( 2 0 0 9 ) 9 3 6 2 – 9 3 7 2 9367
Author's personal copy
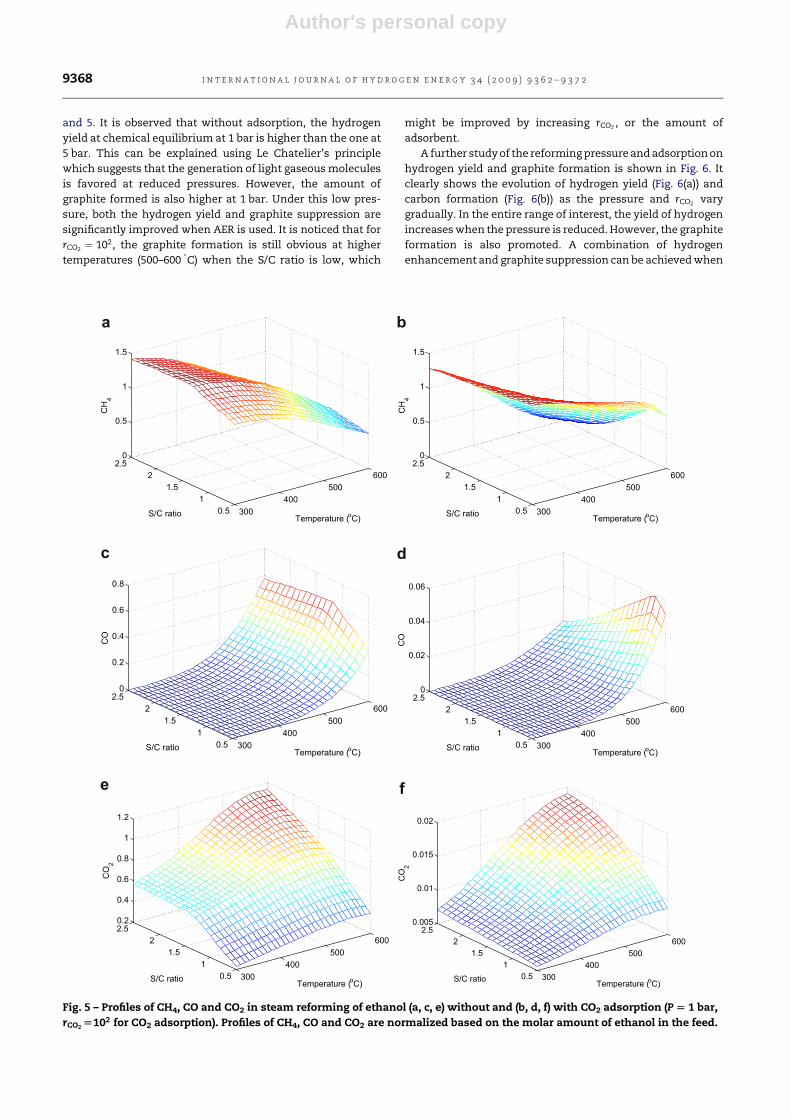
and 5. It is observed that without adsorption, the hydrogen
yield at chemical equilibrium at 1 bar is higher than the one at
5 bar. This can be explained using Le Chatelier’s principle
which suggests that the generation of light gaseous molecules
is favored at reduced pressures. However, the amount of
graphite formed is also higher at 1 bar. Under this low pres-
sure, both the hydrogen yield and graphite suppression are
significantly improved when AER is used. It is noticed that for
rCO2 ¼ 102, the graphite formation is still obvious at higher
temperatures (500–600�C) when the S/C ratio is low, which
might be improved by increasing rCO2 , or the amount of
adsorbent.
A further study of the reforming pressure and adsorption on
hydrogen yield and graphite formation is shown in Fig. 6. It
clearly shows the evolution of hydrogen yield (Fig. 6(a)) and
carbon formation (Fig. 6(b)) as the pressure and rCO2 vary
gradually. In the entire range of interest, the yield of hydrogen
increases when the pressure is reduced. However, the graphite
formation is also promoted. A combination of hydrogen
enhancement and graphite suppression can be achieved when
300400
500600
0.51
1.52
2.50
0.5
1
1.5
Temperature (oC)S/C ratio
CH
4
a
300400
500600
0.51
1.52
2.50
0.5
1
1.5
Temperature (oC)S/C ratio
CH
4
b
300400
500600
0.51
1.52
2.50
0.2
0.4
0.6
0.8
Temperature (oC)S/C ratio
CO
c
300400
500600
0.51
1.52
2.50
0.02
0.04
0.06
Temperature (oC)S/C ratio
CO
d
300400
500600
0.51
1.52
2.50.2
0.4
0.6
0.8
1
1.2
Temperature (oC)S/C ratio
CO
2
e
300400
500600
0.51
1.52
2.50.005
0.01
0.015
0.02
Temperature (oC)S/C ratio
CO
2
f
Fig. 5 – Profiles of CH4, CO and CO2 in steam reforming of ethanol (a, c, e) without and (b, d, f) with CO2 adsorption (P [ 1 bar,
rCO2 [102 for CO2 adsorption). Profiles of CH4, CO and CO2 are normalized based on the molar amount of ethanol in the feed.
i n t e r n a t i o n a l j o u r n a l o f h y d r o g e n e n e r g y 3 4 ( 2 0 0 9 ) 9 3 6 2 – 9 3 7 29368

Author's personal copy
CO2 is removed from the reactive system by adsorption. Based
on Fig. 6(b), a contour of graphite formation is plotted in
Fig. 6(c), which reveals that a graphite-free region is guaranteed
by sufficient CO2 adsorption. Based on this thermodynamic
analysis, CO2 adsorption could be an alternative or supplement
to the high S/C ratios or high pressures used in the reforming
processes to inhibit carbon formation. The required amount of
adsorbent per mol of ethanol in the feed at specified rCO2 and P
can be calculated based on Eq. (2), or
SnðadsÞCO2 ;sat ¼
rCO2
�Psj¼1 nj þ bCO2
nCO2P�
bCO2P
(9)
Because nðadsÞCO2 ;sat is a physical parameter of the adsorbent that is
measured experimentally, the surface area of the adsorbent S
can be readily determined if SnðadsÞCO2 ;sat is known. The group
SnðadsÞCO2 ;sat based on potassium promoted hydrotalcite (bCO2
is
around 22 bar–1 at 500�C [43]) is shown in Fig. 6(d). It is seen
that the amount of adsorbent reduces with increased pressure
if rCO2and the temperature are fixed. This is primarily due to
an increased partial pressure of CO2 in the gaseous phase,
which favors CO2 adsorption on the adsorbent.
Partial oxidation reforming is a method to heat up the
reforming gas by burning part of the fuel using oxygen, thus
reducing the energy demand for the reforming process [36].
The AER can be potentially combined with partial oxidation.
When oxygen is present in the feed, one more reaction should
be included in the reaction scheme described by Eq. (8). The
option is not unique. One acceptable reaction independent of
all the reactions in Eq. (8) is as follows:
2COþO2 ¼ 2CO2 (10)
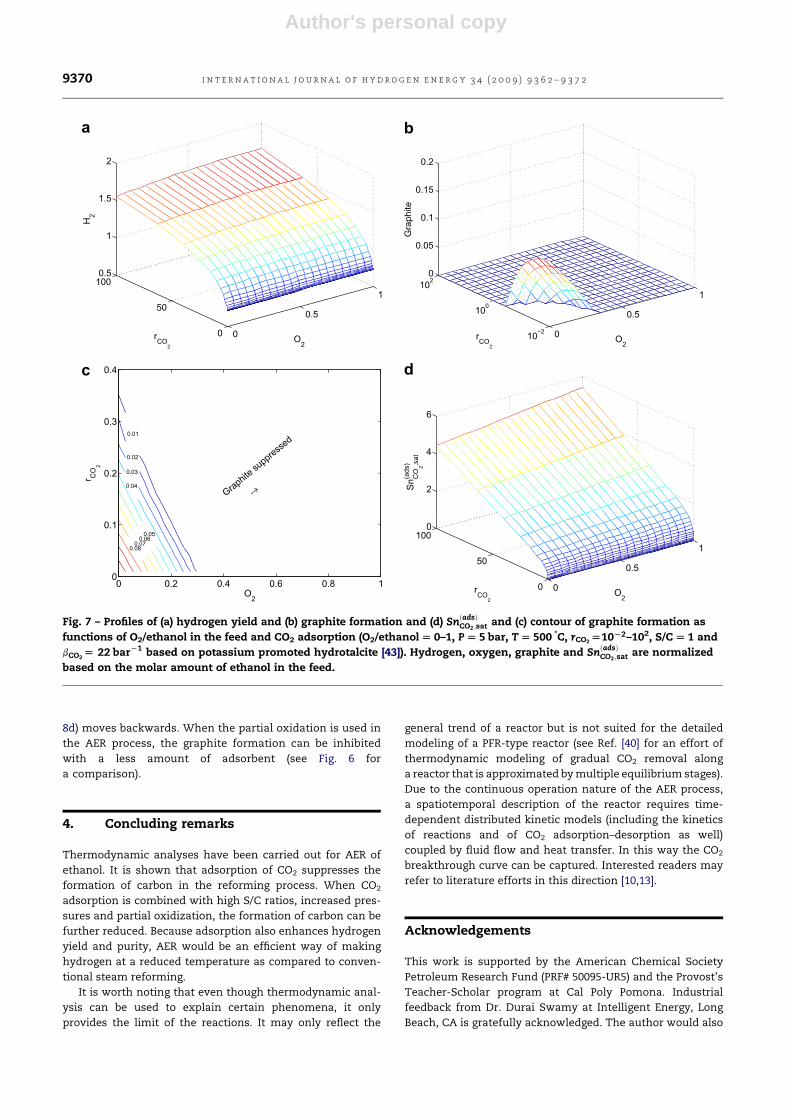
The effect of O2 and adsorption on hydrogen yield and
graphite formation is shown in Fig. 7. It can be seen that
without adsorption, partial oxidation does not lead to
significant improvement in the hydrogen yield under the
given operating conditions. In fact, at high S/C ratios, the
thermodynamic model shows that partial oxidation might
result in a reduction in the hydrogen yield (not shown in
Fig. 7). However, when partial oxidation is combined with
CO2 adsorption, the hydrogen yield is enhanced. Moreover,
partial oxidation suppresses graphite formation. This is
because the addition of O2 in the system converts part of CO
into CO2 (see Eq. 10), and the carbon formation reaction (Eq.
0
5
10
0
50
1000.5
1
1.5
2
2.5
Pressure (bar)rCO2
H2
a
0
5
10
10−2
100
1020
0.1
0.2
0.3
0.4
Pressure (bar)rCO2
Gra
phite
b
0.05
0.05
0.050.1
0.1
0.150.2
Pressure (bar)
r CO
2
Grap
hite
supp
ress
ed
→
1 2 3 4 5 6 7 8 9 100
0.5
1
1.5c
0
5
10
0
50
1000
5
10
15
20
Pressure (bar)rCO2
SnC
O2,s
at(a
ds)
d
Fig. 6 – Profiles of (a) hydrogen yield and (b) graphite formation and (d) SnðadsÞCO2 ;sat and (c) contour of graphite formation as
functions of system pressure and CO2 adsorption (P [ 1–10 bar, T [ 500 8C, rCO2 [10L2–102, S/C [ 1 and bCO2[ 22 barL1
based on potassium promoted hydrotalcite [43]). The profiles of hydrogen, graphite and SnðadsÞCO2 ;sat are normalized based on
the molar amount of ethanol in the feed.
i n t e r n a t i o n a l j o u r n a l o f h y d r o g e n e n e r g y 3 4 ( 2 0 0 9 ) 9 3 6 2 – 9 3 7 2 9369
Author's personal copy
8d) moves backwards. When the partial oxidation is used in
the AER process, the graphite formation can be inhibited
with a less amount of adsorbent (see Fig. 6 for
a comparison).
4. Concluding remarks
Thermodynamic analyses have been carried out for AER of
ethanol. It is shown that adsorption of CO2 suppresses the
formation of carbon in the reforming process. When CO2
adsorption is combined with high S/C ratios, increased pres-
sures and partial oxidization, the formation of carbon can be
further reduced. Because adsorption also enhances hydrogen
yield and purity, AER would be an efficient way of making
hydrogen at a reduced temperature as compared to conven-
tional steam reforming.
It is worth noting that even though thermodynamic anal-
ysis can be used to explain certain phenomena, it only
provides the limit of the reactions. It may only reflect the
general trend of a reactor but is not suited for the detailed
modeling of a PFR-type reactor (see Ref. [40] for an effort of
thermodynamic modeling of gradual CO2 removal along
a reactor that is approximated by multiple equilibrium stages).
Due to the continuous operation nature of the AER process,
a spatiotemporal description of the reactor requires time-
dependent distributed kinetic models (including the kinetics
of reactions and of CO2 adsorption–desorption as well)
coupled by fluid flow and heat transfer. In this way the CO2
breakthrough curve can be captured. Interested readers may
refer to literature efforts in this direction [10,13].
Acknowledgements
This work is supported by the American Chemical Society
Petroleum Research Fund (PRF# 50095-UR5) and the Provost’s
Teacher-Scholar program at Cal Poly Pomona. Industrial
feedback from Dr. Durai Swamy at Intelligent Energy, Long
Beach, CA is gratefully acknowledged. The author would also
0
0.5
1
0
50
1000.5
1
1.5
2
O2rCO
2
H2
a
0
0.5
1
10−2
100
1020
0.05
0.1
0.15
0.2
O2rCO
2
Gra
phite
b
0.01
0.02
0.03
0.04
0.050.06
0.070.08
O2
r CO
2
Graphite suppresse
d
→
0 0.2 0.4 0.6 0.8 10
0.1
0.2
0.3
0.4c
0
0.5
1
0
50
1000
2
4
6
O2rCO
2
SnC
O2,s
at(a
ds)
d
Fig. 7 – Profiles of (a) hydrogen yield and (b) graphite formation and (d) SnðadsÞCO2 ;sat and (c) contour of graphite formation as
functions of O2/ethanol in the feed and CO2 adsorption (O2/ethanol [ 0–1, P [ 5 bar, T [ 500 8C, rCO2 [10L2–102, S/C [ 1 and
bCO2[ 22 barL1 based on potassium promoted hydrotalcite [43]). Hydrogen, oxygen, graphite and SnðadsÞ
CO2 ;sat are normalized
based on the molar amount of ethanol in the feed.
i n t e r n a t i o n a l j o u r n a l o f h y d r o g e n e n e r g y 3 4 ( 2 0 0 9 ) 9 3 6 2 – 9 3 7 29370

Author's personal copy
like to thank the anonymous reviewers for their valuable
comments and suggestions.
Nomenclature
bj adsorption parameter of species j in the Langmuir
isotherm model, bar–1
e total number of chemical elements in the reactive
system
l Lagrange multiplier
m chemical potential, J/mol
p –l/RT(ads) properties of adsorbed species
aij number of chemical element i in species j
G Gibbs energy, J
i, j, k indices
nj molar amount of species j in the gas phase, mol
nj(ads) molar amount of species j on the surface, mol
nT total molar amount in the gas phase, mol
nj, sat(ads) saturated concentration of species j on the
adsorbent surface, mol/m2
P pressure, bar
R gas constant, 8.314 J/mol/K
ri molar ratio of a species in the gas phase to the
surface
S surface area of adsorbent, m2
s total number of gaseous species
T temperature, K
t total number of species
r e f e r e n c e s
[1] Lattin WC, Utgikar VP. Transition to hydrogen economy inthe united states: a 2006 status report. Int J Hydrogen Energy2007;32:3230–7.
[2] Arteaga LE, Peralta LM, Kafarov V, Casas Y, Gonzales E.Bioethanol steam reforming for ecological syngas andelectricity production using a fuel cell SOFC system. ChemEng J 2008;136:256–66.
[3] Deluga GA, Salge JR, Schmidt LD, Verykios XE. Renewablehydrogen from ethanol by autothermal reforming. Science2004;303:993–7.
[4] Florin NH, Harris AT. Enhanced hydrogen production frombiomass with in situ carbon dioxide capture using calciumoxide sorbents. Chem Eng Sci 2008;63:287–316.
[5] Hufton JR, Mayorga S, Sircar S. Sorption-enhancedreaction process for hydrogen production. AIChE J 1999;45:248–56.
[6] Koumpouras GC, Alpay E, Stepanek F. Mathematicalmodelling of low-temperature hydrogen production with insitu CO2 capture. Chem Eng Sci 2007;62:2833–41.
[7] Ortiz AL, Harrison DP. Hydrogen production using sorption-enhanced reaction. Ind Eng Chem Res 2001;40:5102–9.
[8] Stevens JF, Krishnamurthy B, Atanassova P, Spilker K.Development of 50 kW fuel processor for stationary fuel cellapplications. DOE Technical Report DOE/GO/13102–1.Chevron Techology Ventures, LLC; 2007.
[9] Wang YN, Rodrigues AE. Hydrogen production from steammethane reforming coupled with in situ CO2 capture:conceptual parametric study. Fuel 2005;84:1778–89.
[10] Xiu G, Li P, Rodrigues AE. New generalized strategy forimproving sorption-enhanced reaction process. Chem EngSci 2003;58:3425–37.
[11] Tiemersma TP, Patil CS, van Sint Annaland M, Kuipers JAM.Modelling of packed bed membrane reactors for autothermalproduction of ultrapure hydrogen. Chem Eng Sci 2006;61:1602–16.
[12] Chen Z, Yan Y, Elnashaie SS. Catalyst deactivation andengineering control for steam reforming of higherhydrocarbons in a novel membrane reformer. Chem Eng Sci2004;59:1965–78.
[13] Ding Y, Alpay E. Adsorption-enhanced steam-methanereforming. Chem Eng Sci 2000;55:3929–40.
[14] Lee KB, Beaver MG, Caram HS, Sircar S. Novel thermal-swingsorption-enhanced reaction process concept for hydrogenproduction by low-temperature steam-methane reforming.Ind Eng Chem Res 2007;46:5003–14.
[15] Engwall E, Saukaitis J, Joshi M, Matzakos A, Paggio AD.Hydrogen production with a membrane steam reformer. In:AIChE Annual Meeting, paper 479c, Salt Lake City, Utah;2007.
[16] Duraiswamy K, Mauzey JL, Pena DA, and Chellappa AS. Low-cost high-efficiency distributed hydrogen production. In:AIChE Spring National Meeting, paper 168b. New Orleans, LA;2008.
[17] Bartholomew CH. Mechanisms of catalyst deactivation. ApplCatal A 2001;212:17–60.
[18] Bengaarda HS, Norskova JK, Sehested J, Clausenb BS,Nielsenb LP, Molenbroekb AM, et al. Steam reforming andgraphite formation on Ni catalysts. J Catal 2002;209:365–84.
[19] Batista MS, Santos RKS, Assaf EM, Assaf JM, Ticianelli EA.Characterization of the activity and stability of supportedcobalt catalysts for the steam reforming of ethanol. J PowerSources 2003;124:99–103.
[20] Klouz V, Fierro V, Denton P, Katz H, Lisse JP, Bouvot-Mauduit S, et al. Ethanol reforming for hydrogen productionin a hybrid electric vehicle: process optimisation. J PowerSources 2002;105:26–34.
[21] Ren X-H, Bertmer M, Stapf S, Demco DE, Blumich B, Kern C,et al. Deactivation and regeneration of a naphtha reformingcatalyst. Appl Catal A 2002;228:39–52.
[22] Snoeck JW, Froment GF, Fowles M. Filamentous carbonformation and gasification: thermodynamics, driving force,nucleation, and steady-state growth. J Catal 1997;169:240–9.
[23] Snoeck JW, Froment GF, Fowles M. Steam/CO2 reforming ofmethane. carbon formation and gasification on catalystswith various potassium contents. Ind Eng Chem Res 2002;41:3548–56.
[24] Trimm DL. Coke formation and minimisation during steamreforming reactions. Catal Today 1997;37:233–8.
[25] Tang SB, Qiu FL, Lu SJ. Effect of supports on the carbondeposition of nickel catalysts for methane reforming withCO2. Catal Today 1995;24:253–5.
[26] Trimm DL. Catalysts for the control of coking during steamreforming. Catal Today 1999;49:3–10.
[27] Tomishige K, Chen YG, Fujimoto K. Studies on carbondeposition in CO2 reforming of CH4 over nickel–magnesiasolid solution catalysts. J Catal 1999;181:91–103.
[28] Mathure PV, Ganguly S, Patwardhan AV, Saha RK. Steamreforming of ethanol using a commercial nickel-basedcatalyst. Ind Eng Chem Res 2007;46:8471–9.
[29] Subramani V, Gangwal SK. A review of recent literature tosearch for an efficient catalytic process for the conversion ofsyngas to ethanol. Energy Fuels 2008;22:814–39.
[30] Gronchi P, Fumagalli D, Rosso RD, Centola P. Carbondeposition in methane reforming with carbon dioxide.J Therm Anal 1996;47:227–34.
i n t e r n a t i o n a l j o u r n a l o f h y d r o g e n e n e r g y 3 4 ( 2 0 0 9 ) 9 3 6 2 – 9 3 7 2 9371
Author's personal copy
[31] Duan S, Senkan S. Catalytic conversion of ethanol tohydrogen using combinatorial methods. Ind Eng Chem Res2005;44:6381–6.
[32] Llorca J, Homs N, Sales J, Fierro JLG, de la Piscina PR. Effect ofsodium addition on the performance of Co–ZnO-based catalystsfor hydrogen productionfrombioethanol. JCatal2004;222:470–80.
[33] Assabumrungrat S, Laosiripojana N, Pavarajarn V,Sangtongkitcharoen W, Tangjitmatee A, Praserthdam P.Thermodynamic analysis of carbon formation in a solidoxide fuel cell with a direct internal reformer fuelled bymethanol. J Power Sources 2005;139:55–60.
[34] Colpan CO, Dincer I, Hamdullahpur F. Thermodynamicmodeling of direct internal reforming solid oxide fuel cellsoperating with syngas. Int J Hydrogen Energy 2007;32:787–95.
[35] Ding Y, Alpay E. Equilibria and kinetics of CO2 adsorption onhydrotalcite adsorbent. Chem Eng Sci 2000;55:3461–74.
[36] Lutz AE, Bradshaw RW, Bromberg L, Rabinovich A.Thermodynamic analysis of hydrogen production by partialoxidation reforming. Int J Hydrogen Energy 2004;29:809–16.
[37] Lutz AE, Bradshaw RW, Keller JO, Witmer DE.Thermodynamic analysis of hydrogen production by steamreforming. Int J Hydrogen Energy 2003;28:159–67.
[38] Yong Z, Mata VG, Rodrigues AE. Adsorption of carbondioxide on chemically modified high surface area carbon-based adsorbents at high temperature. Adsorption 2001;7:41–50.
[39] Lee KB, Beaver MG, Caram HS, Sircar S. Chemisorption ofcarbon dioxide on sodium oxide promoted alumina. AIChE J2007;53:2824–31.
[40] Li M. Equilibrium calculation of gaseous reactive systemswith simultaneous species adsorption. Ind Eng Chem Res2008;47:9263–71.
[41] Gordon S, McBride BJ. Computer program for calculation ofcomplex chemical equilibrium compositions andapplications. Technical Report NASA RP-1311. NASA LewisResearch Center; 1996.
[42] Rampe T, Hubner P, Vogel B, Heinzel A. Hydrogengeneration from ethanol by allothermal reforming. In:proceedings of the first world conference on biomass forenergy and industry. James & James (Science Publishers)Ltd.; 2001. p. 1889–92.
[43] Lee KB, Verdooren A, Caram HS, Sircar S. Chemisorption ofcarbon dioxide on potassium-carbonate-promotedhydrotalcite. J Colloid Interf Sci 2007;308:30–9.
i n t e r n a t i o n a l j o u r n a l o f h y d r o g e n e n e r g y 3 4 ( 2 0 0 9 ) 9 3 6 2 – 9 3 7 29372