author's personal copy - dr. daniel j. levitin...
TRANSCRIPT
This article appeared in a journal published by Elsevier. The attachedcopy is furnished to the author for internal non-commercial researchand education use, including for instruction at the authors institution
and sharing with colleagues.
Other uses, including reproduction and distribution, or selling orlicensing copies, or posting to personal, institutional or third party
websites are prohibited.
In most cases authors are permitted to post their version of thearticle (e.g. in Word or Tex form) to their personal website orinstitutional repository. Authors requiring further information
regarding Elsevier’s archiving and manuscript policies areencouraged to visit:
http://www.elsevier.com/copyright

Author's personal copy
Cross-modal interactions in the experience of musical performances:Physiological correlates
Catherine Chapados a, Daniel J. Levitin a,b,*
a Department of Psychology, McGill University, 1205 Avenue Docteur Penfield, Montreal, Que., Canada H3A 1B1b Faculty of Music and Center for Interdisciplinary Research in Music Media and Technology, McGill University, Montreal, Que., Canada
a r t i c l e i n f o
Article history:Received 5 September 2007Revised 3 April 2008Accepted 2 May 2008
Keywords:Cross-modal interactionsMusic cognitionEmotionElectrodermal activity
a b s t r a c t
This experiment was conducted to investigate cross-modal interactions in the emotionalexperience of music listeners. Previous research showed that visual information presentin a musical performance is rich in expressive content, and moderates the subjective emo-tional experience of a participant listening and/or observing musical stimuli [Vines, B. W.,Krumhansl, C. L., Wanderley, M. M., & Levitin, D. J. (2006). Cross-modal interactions in theperception of musical performance. Cognition, 101, 80–113.]. The goal of this follow-upexperiment was to replicate this cross-modal interaction by investigating the objective,physiological aspect of emotional response to music measuring electrodermal activity.The scaled average of electrodermal amplitude for visual–auditory presentation was foundto be significantly higher than the sum of the reactions when the music was presented invisual only (VO) and auditory only (AO) conditions, suggesting the presence of an emergentproperty created by bimodal interaction. Functional data analysis revealed that electroder-mal activity generally followed the same contour across modalities of presentation, exceptduring rests (silent parts of the performance) when the visual information took on partic-ular salience. Finally, electrodermal activity and subjective tension judgments were foundto be most highly correlated in the audio-visual (AV) condition than in the unimodal con-ditions. The present study provides converging evidence for the importance of seeing musi-cal performances, and preliminary evidence for the utility of electrodermal activity as anobjective measure in studies of continuous music-elicited emotions.
� 2008 Elsevier B.V. All rights reserved.
1. Introduction
The scientific exploration of music perception and cog-nition has enjoyed exponential growth in the past few dec-ades (Levitin, 1999) and follows a long and distinguishedhistory dating back to the origins of experimental psychol-ogy/psychobiology. The Gestalt psychology movement, forexample, was vitally concerned with questions about thenature of melody and melodic transformations (Ehrenfels,1890/1988), and Wundt, Fechner and Helmholtz devoted
a great deal of their research to understanding fundamen-tals of sound (Boring, 1942). The vast majority of humanexperiments conducted over the past century have focusedprimarily on psychophysical, perceptual and cognitive as-pects of music, with comparatively little time devoted tostudying the emotionally expressive aspects of music(Vines, Krumhansl, Wanderley, Dalca, & Levitin, 2005). Gi-ven that music serves to communicate emotion (Bernstein,1959/2004; Meyer, 1956; Meyer, 1994; Schopenhauer,1859), this represents an unfortunate bias in the historyof the field, but one that is being remedied as emotionhas recently become a major topic of study for experimen-tal psychology in general (Adolphs, 2002; Elfenbein &Ambady, 2002; Izard, 1992), behavioral neuroscience(Davidson, Jackson, & Kalin, 2000) and music cognition
0010-0277/$ - see front matter � 2008 Elsevier B.V. All rights reserved.doi:10.1016/j.cognition.2008.05.008
* Corresponding author. Address: Department of Psychology, McGillUniversity, 1205 Avenue Docteur Penfield, Montreal, Que., Canada H3A1B1. Tel.: +1 514 398 8263; fax: + 1 514 398 4896.
E-mail address: [email protected] (D.J. Levitin).
Cognition 108 (2008) 639–651
Contents lists available at ScienceDirect
Cognition
journal homepage: www.elsevier .com/locate /COGNIT

Author's personal copy
specifically (Juslin & Laukka, 2003; Krumhansl, 2002; Lev-itin, 2006; Vines, Krumhansl, Wanderley, & Levitin, 2006).We begin this paper with two fundamental questionsabout musical representations in humans: first, to whatextent are listeners sensitive to the expressive intent ofcomposers; and second, how do people integrate informa-tion from the visual and auditory domains when experi-encing a musical performance?
Within the field of cognitive neuroscience, psycho-physiology has been shown to be a powerful tool forunderstanding complex cognitive, behavioural and affec-tive states or events, an objective measure that can beused alongside or in lieu of subjective measures (Hug-dahl, 1995; Lang, 1968; Sutton, Braren, Zubon, & John,1965; Tranel & Damasio, 1985). Music offers a promisingavenue for investigating the physiological correlates ofemotions, especially given that most people report themain function of music in their everyday lives is the reg-ulation of their mood through music-induced changes inemotional states (North, Hargreaves, & Hargreaves, 2004;Sloboda, 1999). Two opponent views exist with respectto musical emotions: cognitivism and emotivism. Thesupporters of cognitivism argue that music does not pro-duce emotions in listeners, but that it merely representsemotions that are recognized, but not experienced by thelisteners (Meyer, 1956). In contrast, the emotivist theoryclaims that music does elicit emotional responses in lis-teners (Iwaki, Hayashi, & Hori, 1997; Krumhansl, 1997).Given the potential biases in verbal subjective self-re-ports and the lack of consensus on an operationalizeddefinition of emotion, Scherer and Zentner (2001) arguedthat it is difficult to find evidence that music not onlyexpresses but also elicits emotion. The measurement ofpsychophysiological responses to music is an attemptto demonstrate that music does cause bodily reactionsand that the latter can be linked to different aspects ofemotions experienced while listening to music. In fact,the 100-year-old literature on the study of different re-sponses of the autonomic nervous system, such as car-diovascular activity, body temperature and skinconductivity to music demonstrates that music doeshave an effect on these measures, but that they varywidely across studies and participants depending onhypotheses and stimuli being tested (see the review byBartlett, 1996).
Musical experience may be characterized as an ebb andflow of tension that gives rise to emotional responses(Krumhansl, 2002; Meyer, 1956; Patel, 2003; Vines et al.,2006). Many structural features of music contribute tothe experience of ‘‘tension,” including pitch range, loud-ness dynamics, note density, harmonic relations, and im-plicit expectations based on experience with a musicalgenre (Bigand & Parncutt, 1999; Krumhansl, 1996; Meyer,1956); for this reason, tension is considered a ‘‘global”attribute of musical experience (Madsen & Fredrickson,1993).1
Some studies have shown that the intended basic emo-tions of a musical piece can be identified correctly by lis-
teners. For instance, Krumhansl (1997) selected musicalstimuli to represent three distinct basic emotions (happi-ness, fear and sadness). Participants were instructed to ratecontinuously the degree to which they experienced one ofthe three emotions or tension during the performance. Re-sults indicated that continuous ratings of the consistentemotion for each excerpt were significantly higher thanfor the other emotions. This suggests that music has thepotential to produce emotions similar to basic real lifeemotions and that they are assigned consistently acrossindividuals during a performance.
Moreover, in the second part of Krumhansl’s experi-ment, the physiological changes in the peripheral nervoussystem were measured in an independent group of partic-ipants during the presentation of the same musical ex-cerpts, by tracking heart rate, skin conductance, fingertemperature, blood pressure and respiration. Analysesshowed that music compared to silence had a significanteffect on all the physiological measures recorded. The dif-ferent selected emotions caused different physiologicalchanges in participants, with larger changes in the sadnessand fear music groups. For example, the average skin con-ductance level decreased the most during the sad excerptsand was highly correlated with average (subjective) sadratings.
Others have suggested that music-induced emotionsare not analogous to primary emotions, but constitute dis-tinct types of emotions that lack verbal labels and defini-tions (Scherer & Zentner, 2001). For instance, Panksepp(1995) suggested that such emotional responses to musiccould be defined as ‘chills’, that is, prickly skin responsessimilar to shivers (‘‘goosebumps” or ‘‘gooseflesh”). Hefound that up to 0.5 chills/min/person could be elicitedwhile listening to a familiar piece of music, selected forits emotionally moving capacity. The physiological changesoccurring during music-induced chills mainly consist of anincrease in levels of galvanic skin response and pilo-erec-tion (Craig, 2005). The neural correlates of such chill re-sponses to emotional music have been mapped to braincircuitry involved in pleasant emotion and reward, includ-ing increases in nucleus accumbens and ventral tegmentalarea activity (Menon & Levitin, 2005) and decreases inamygdala activity (Blood & Zatorre, 2001).
As in the mainstream emotion domain, the two maindimensions mentioned in the literature specific to music–emotion are evaluation (or valence) and activity (or arou-sal; Schubert, 2001). The former varies on a continuumfrom negative to positive, whereas the latter varies fromlow to high. Consistent with the findings from pictorialstimuli (Lang, Greenwald, Bradley, & Hamm, 1993), anexperiment demonstrated that the arousal dimension ofmusic was associated with autonomic responses, with in-creases in skin conductance and heart rate associated withhigher levels of arousal. On the other hand, the negativeand positive valence effects could be associated with elec-tromuscular activity of the corrugator and zygomatic facialmuscles, respectively (Witvliet, 1998). Therefore, the studyof the physiological correlates of music-generated emo-tions within these two dimensions of affect seems to bethe most appropriate, given our current level ofknowledge.1 This paragraph was taken verbatim from Vines et al. (2006), p. 83.
640 C. Chapados, D.J. Levitin / Cognition 108 (2008) 639–651

Author's personal copy
The finding that facial muscular activity is related tomusical emotion suggests the possibility that these facialmuscles might be responding through a mechanism analo-gous to the ‘‘motor theory” of speech perception (Liber-man, 1982), a mechanism by which facial muscles reactin sympathy to the muscles that were presumed to be usedin creating the musical emotion; such a mechanism wouldparallel the so-called ‘‘mirror neuron” system (Rizzolatti,Fadiga, Gallese, & Fogassi, 1996) by which the visual per-ception of many gestural movements causes correspond-ing motor neurons to fire (Dimberg & Thunberg, 1998;Levenson, Ekman, & Friesen, 1990). This raises the intrigu-ing possibility that the visual perception of a musical per-formance (replete with physical gestures) might elicitphysiological activity in addition to activity elicited bystrictly auditory presentation. This could account for thefact that many people place a high value on seeing musicalperformances (in concerts, television, etc.) in addition tohearing them (Vines et al., 2005; Vines et al., 2006).
When a music performance is experienced throughboth auditory and visual channels, these two modes arelikely to interact in order to give rise to the emotionalexperience. Scherer and Zentner (2001) argued that oneof the main factors determining the emotional responseto music is the performance features, specifically the abil-ity and performance state (i.e. stage presence, motivation,mood) of the performer. This is consistent with findingson paralinguistic cues and the hand gestures that oftenaccompany verbal speech to amplify, modify, or enhancethe speech code (McNeill, 1992).
The literature indicates that vision conveys substantialinformation about internal states and emotions of humangestures. For example, observers are able to detect the cov-ert mental dispositions and intentions of an actor who isperforming different movement patterns (Runeson & Fryk-holm, 1983). Movements of dancers also carry informationabout both the emotional and structural qualities of themusic (Krumhansl & Schenck, 1997). In that study, partic-ipants either only heard (AO), only saw (VO) or both heardand saw (AV) Balanchine’s ballet of Mozart’s DivertimentoNo.15; they made continuous judgments about the amountof tension and emotion expressed in the ballet during thestimulus presentation. In the three conditions, continuousjudgments of tension and emotion correlated strongly,suggesting that amount of tension can be used as a mea-sure for the amount of emotion expressed. For both tasks,the additive combination of the data of AO and VO condi-tions could predict the AV condition results. Even thoughAO contributed more to the multiple correlation than VOand the profiles of AO condition as regard to the emotionalaspect of the piece were more sensitive and showed great-er variability than VO, this study demonstrated that visualinformation conveys a portion of the affective qualities ofmusic.
On this basis, one might hypothesize that intentionalexpressivity could be detected as well in the gestures of asolo musician performing a piece. Indeed, it has beenshown that observers could correctly identify the emo-tional intention of soloists who were instructed to play dif-ferent pieces with three particular performance mannersreflecting varying levels of expressivity: ‘‘deadpan” where
the expression is minimized, ‘‘projected” as if playing infront of a public audience and ‘‘exaggerated” where theexpression is maximized (Davidson, 1993). In that study,the excerpts were presented in three different modes:AO, VO and AV, with the visual stimuli being presentedwith the Point-Light Technique. This technique, adaptedfrom Johansson’s (1973) biological motion technique, con-sists in creating a high brightness contrast between themajor body joints of the actor and the background, so theparticipant’s judgements are based only on movement. Itis designed to overcome the possible confounding effectsof contextual information of the visual stimulus (such asfacial expressions, gender of participant, etc.). Post hoctests on the manner by mode interaction showed thatthe VO mode received the most extreme scores while theAO mode received the most moderate scores, indicatingthat expression conveyed visually was more informativeof manner. This finding suggests that movements of musi-cians reveal their expressive intentions in their interpreta-tion of a piece.
In an attempt to quantify musician’s movements, Wan-derley (2002) tracked the ancillary gestures of four clari-nettists who were instructed to play segments ofStravinsky’s second piece for solo clarinet in three ways:standard, exaggerated and immobile. (Ancillary gesturesare those movements made while playing an instrument,but that are not necessary for sound production.) Theywere analysed according to their mode of production,repeatability and degree of similarity across different per-formers. Movements across players showed substantialdifferences with regard to the amplitude and temporalcharacteristics, yet, some performers shared similaritiesin their movements over time, suggesting an influence ofthe piece’s structure on gesture. For all the players, therewas also a tendency to perform similar movements whenbreathing. This indicates that material and physiologicalaspects of the performance give rise to similar movementsin different players. Finally, within a performer, move-ments tended to be similar and repeatable, suggesting thatthey are not spontaneous. It was also found that facialexpressions and head movements of singers correlate withthe size of sung pitch intervals, suggesting that pitch rela-tion is another structural aspect of music having an influ-ence on the visual aspect of performance (Thompson &Russo, 2007).
Vines and colleagues (2006) studied judgments of bothemotion (indexed by perceived tension) and structure(indexed by perceived phrasing) of the performances pre-viously described (Wanderley, 2002). Thirty musically-trained participants were divided into three groups thateither only heard (AO), only saw (VO) or both heard andsaw (AV) the piece performed by two different musicians(R and W). Participants were instructed to continuouslyrate the amount of tension or their perception of phrasingexperienced during the performance by moving a slider inreal time. The experiment found that during specific por-tions of the piece, vision was more important to the overallexperience of tension and phrasing than was sound, and atdifferent points in the piece the opposite held. Moreover,the experience of emotion and structure in the integrated,AV condition was rated more highly than the sum of the
C. Chapados, D.J. Levitin / Cognition 108 (2008) 639–651 641

Author's personal copy
AO or the VO conditions, suggesting an emergent propertyof experiencing the two modalities together. This findingsuggests that the two sensory modalities interact in orderto create the overall emotional response.
A logical extension of the experiment conducted byVines and colleagues (2006) would be to investigate thephysiological correlates of these emotional responses as afunction of cross-modal interactions, to complement thepreviously obtained subjective measures with objectiveones. In the music–emotion domain, electrodermal activity(or EDA) is a better indicator than other physiological mea-sures (such as heart rate and facial electromyography) ofthe arousal dimension of emotion (Witvliet, 1998), thusthe present experiment employed EDA as the dependentvariable. The present experiment constitutes a preliminaryinvestigation of the neurophysiological correlates of musi-cal emotion, as indexed by EDA, with an emphasis on theways in which two different sensory modalities conveythat emotion: vision and audition.
2. Methods
2.1. Experimental design
This study had one between-subjects independent var-iable: the sensory modality in which the musical perfor-mance was presented to the participants. Participantswere randomly assigned to one of the three following con-ditions: they either only heard (auditory only, or AO), onlysaw (visual only, or VO) or both heard and saw (auditoryand visual, or AV) the musical performance. Both prior tothe experiment (to establish a resting baseline) and thenas the musical performances unfolded, the electrodermalactivity of the listeners was continuously recorded as aquantitative measure of the autonomic nervous systemactivity, or arousal level.
2.2. Participants
Twelve right-handed females between 20 and 25 yearsof age (mean 22.3 years, SD 1.2) volunteered as partici-pants in this experiment. The participants were requiredto be musically trained for at least five years. The motiva-tion for this was the observation that using musicians inmusic perception experiments typically reduces measure-ment variability without limiting generalizability of the re-sults (Krumhansl, 1991). It has been shown previously thatmusic students exhibit more consistent emotional arousaland more pronounced sympathetic activity (e.g. higher ele-trodermal response peaks) while listening to music thannon-music students (VanderAck & Ely, 1992; VanderAck& Ely, 1993), thus reducing the signal to noise ratio inthe dependent variable.
In the present study, the average amount of musicaltraining of the participants was 9.5 years (SD 4.2). Therewas no significant difference in years of musical trainingbetween the three modality groups (F(2, 9) = 0.590,p > 0.1). The participants were selected from the same sub-ject population as those in the tension judgement study(Vines et al., 2006). The reason for recruiting different par-ticipants instead of collecting new data with the former
participants was to prevent any bias due to prior exposureand reaction to the musical stimuli. Therefore, the recollec-tion of previous tension judgments and motor responses tothe musical performance would not contaminate the affec-tive experience and physiological measures in the presentexperiment.
All procedures of this experiment followed the McGillUniversity Policy on the Ethical Conduct of ResearchInvolving Human Subjects and received an approval fromthe Research Ethics Board – II.
2.3. Materials
2.3.1. Stimulus presentationThe stimuli consisted of three videos2 of a male profes-
sional musician performing Stravinsky’s second piece forsolo clarinet. These performances were originally createdfor the study conducted by Wanderley (2002) and later usedby Vines et al. (2006). The durations of the three videos were75 s, 79 s and 80 s. Because this piece is not well known bythe general population, it is a good candidate for an experi-ment in which we want to prevent bias due to previousexposure or to cultural background. This piece was selectedin order to compare the physiological responses obtained inthe present experiment with the behavioural ratings of dif-ferent participants for the same musical piece (Vines et al.,2006). The performances were presented using QuickTimesoftware on a Toshiba 15-inch laptop computer screen run-ning Windows NT, an LCD/TFT display with 2048 � 1536pixels resolution and 32 bits color depth. The participantsin the AV or AO conditions listened to the different perfor-mances over Sony MDR-P1 headphones. For consistencyacross conditions, participants in the AO condition wereasked to keep their eyes open and to fixate on the blackscreen of the laptop while they listened to the musical piece.Participants in the VO condition wore the same headphonesduring the stimulus presentation, but no sound was pro-duced. At any time during the experiment, the participantsin the AO and AV conditions were able to adjust the volumeto a comfortable level.
2.3.2. Recording of electrodermal activityThe participants’ electrodermal activity was processed
with a PowerLab�/4SP high-performance system [ADIn-struments Pty Ltd., Colorado Springs, CO]. EDA was mea-sured by applying an alternating current (AC) throughdry electrodes (MTL116F GSR Finger electrodes) that were
2 The three different performances represent the same piece played withdifferent levels of expressivity by the musician: ‘‘immobile” where themusician tries to move as little as possible (I), ‘‘standard” as if playing infront of a public audience (S) and ‘‘exaggerated” where the musician wasinstructed to maximized his gestures (E). In the original design of thisstudy, this additional within-subject factor, performance manner, wasincluded, meaning that all participants were exposed to all three particularperformances varying in levels of expressivity. However, during dataanalysis, only half of the total trials were retained (refer to Result section),which would have resulted in important loss of statistical power for theanalysis of performance manner factor. Since the retained trials wereevenly distributed across performance manners and since the difference inscaled electrodermal amplitude did not significantly differ between thedifferent manners (F (2, 14) = .218, p = 0.81) , we decided to ignore thisfactor in the analyses.
642 C. Chapados, D.J. Levitin / Cognition 108 (2008) 639–651

Author's personal copy
attached to the participants’ fingers. The amplifier (ML116GSR Amp) used was fully isolated with low voltage, 75 Hz(�22 mV) AC excitation. Even though electrodermal activ-ity is normally recorded using direct current (DC), AC wasapplied in this study, as it presents some advantages overDC including the prevention of electrode and skin polariza-tion (Schaefer & Boucsein, 2000). The EDA signal was re-corded at a sampling rate of 100 Hz with the softwareChart v5 for Windows� [ADInstruments Pty Ltd., ColoradoSprings, CO].
2.3.3. Music questionnaireA modified version of the Queens University Musical
Experience questionnaire (Cuddy, Balkwill, Peretz, & Hol-den, 2005) was completed by the participants. In additionto general information questions, this standard question-naire includes 20 questions about the music training andbackground of the participants.
2.4. Procedure
After the signature of the consent form, participantswashed and dried their hands and removed watches andjewelry from their left hand. They entered the lightingand temperature controlled testing room equipped withthe recording apparatus and stimulus laptop. Participantswere invited to sit down in front of the stimulus laptop,and to place their left hand on the armrest of a chair withtheir palm facing up. They were instructed to keep theirhand as still as possible during the whole experiment in or-der to avoid movement artefacts. The electrodes were thenpositioned and attached on the palmar surface of thathand, on the middle phalanges of the index and third fin-gers. The experimenter read the following instructions tothe participants:
While you are listening to the music, I would like you tofocus on the amount of tension you feel in the perfor-mance. You can think of tension using any definition youlike. We conducted this experiment recently with anothergroup of people who moved a slider up and down toexpress the tension they experienced during different partsof the performance. While you are listening, I would likeyou to imagine that you are moving a slider up and downto express the tension you experience in the performance.In your mind, move the slider upward as the tensionincreases and downward as the tension decreases. Beginwith the slider in your mind all the way down, and usethe whole range of the imaginary slider.
The monitor displaying the EDA was hidden from theparticipants. The participants were then given 3 min tohabituate to the sensors and to the testing room in orderto obtain a stable electrodermal level. After this relaxationperiod, the baseline EDA of the participant was recordedfor 60 s.
Participants in the three modality conditions (AO, VOand AV) were each exposed to the Clarinet Concerto ninetimes. The EDA was monitored continuously during thewhole experiment, including the 30-s intervals betweenstimulus presentations. For each performance, only theEDA monitored 10 s before the onset of the performance,
during the performance itself and 10 s after the end ofthe performance was kept for further analysis.
3. Results
Out of the 108 trials recorded (9 trials for each of the 12participants), 51 trials showed clear evidence of dynamicelectrodermal responses during the musical performances,whereas the remaining 57 trials were flat signals with littleor no variation (or discrete brief peaks likely representingmovement artefacts). The criteria for EDA signals to be re-tained for analysis were the following: at least two peakswith an amplitude of more than one standard deviationlasting more than 5 s and less than 50 s, or showing a var-iation in amplitude during the 5 seconds following the on-set of the piece. Only the 51 trials meeting these criteriawere analysed (the 51 trials retained were representativeof the 12 participants). Different statistical techniqueswere employed in order to fully explore these physiologi-cal data: correlation across modalities, analysis of varianceand functional data analysis. We also employed a newtechnique to separate the phasic from the tonic compo-nents of the signal (Benedek & Kaernbach, 2008). Finally,EDA data were then correlated with subjective tensiondata obtained in a previous study by Vines and colleagues(2006).
3.1. Correlation analysis
Correlations of EDA signals between sensory modalitieswere performed in order to understand the relation be-tween seeing only, hearing only, and both hearing and see-ing the performance. The curves representing the averageof all EDA signals for each sensory modality were con-structed and a correlational analysis was performed be-tween those curves. It yielded correlation coefficients of0.04 for AO vs. AV conditions, �0.14 for AO vs. VO condi-tions and �0.01 for VO vs. AV conditions. None of thesecorrelations was found to be significant. Fig. 1 shows theaverage EDA signal for each modality of presentation. Notethat for time-varying data, these Pearson correlations arenot considered as statistically powerful as functional anal-yses which will be reviewed in Section 3.3.
3.2. Analysis of variance
As a first step in the analysis, the average amplitude ofelectrodermal activity was compared across the three lev-els of sensory modalities. In order to account for the vari-ability between and within participants in EDA, it iscustomary to establish a baseline for scaling the EDA data;researchers have used the previous 15 seconds (Gomez &Danuser, 2004) or the previous 5 seconds (Kaszniak, Rem-inger, Rapcsak, & Glisky, 1999) for this purpose. Here, wetook into account baseline activity in the 10 seconds pre-ceding the stimulus epoch. That is, for each trial, the aver-age amplitude of the 10-s baseline activity before the onsetof the music was subtracted from the electrodermal ampli-tudes when music was presented. The resulting values werefer to as the scaled electrodermal amplitudes.
C. Chapados, D.J. Levitin / Cognition 108 (2008) 639–651 643
Author's personal copy
A one-way ANOVA with scaled electrodermal ampli-tude as the dependent variable and sensory modality asan independent-group factor yielded a significant differ-ence in scaled electrodermal amplitude (F(2, 48) = 7.51,p < .001) depending on the sensory modality. Scheffé posthoc tests on sensory modalities revealed that EDA ampli-tude of the AV condition (mean 1.16, SD 1.68) was signifi-cantly higher than that of both AO (mean 0.17, SD 0.59;p < .01) and VO (mean 0.30, SD 0.85; p < .01) conditions.Fig. 2 shows the EDA averaged across all trials as a functionof the sensory mode. Single sample t-test comparing eachgroup scaled mean to 0 (i.e. no difference between baselineEDA and music EDA) demonstrated that the mean EDA inAO and VO conditions did not significantly differ frombaseline EDA (t(13) = 1.080, p > .05; t(18) = 1.538, p > .05,respectively), but the mean EDA in AV condition signifi-cantly differ from baseline EDA (t(17) = 3.841, p < .01).
In order to account for between subject variability, aone-way ANOVA was performed to compare scaled elec-trodermal amplitude between participants for each modal-ity of presentation. There was no significant differencebetween the subject for each condition (F(3, 10) = 1.373,p > .05; F(3, 15) = .538, p > .05; F(3, 14) = 2.299, p > .05 forAO, VO and AV, respectively), suggesting low between sub-ject variability. No significant correlation was found be-tween average scaled EDA amplitude and years ofmusical training (r = �0.174, p > .01).
3.3. Functional analysis of variance
In the analysis of variance reported above, curves of7500, 7900 and 8000 values (corresponding to 100 valuesper second collected for the three respective perfor-mances) for the signals were collapsed into one single va-
Fig. 1. Average z-score scaled EDA curve for each condition (AO, AV, VO) as a function of time (in seconds).
Fig. 2. Overall mean electrodermal amplitude as a function of sensory modality, indicating a main effect (*p < .001) of sensory mode, with AV > AO = VO. Theerror bars represent the standard error of the mean.
644 C. Chapados, D.J. Levitin / Cognition 108 (2008) 639–651

Author's personal copy
lue, which was then compared across conditions. Averag-ing curves into a single data point results in loss of infor-mation about of the dynamics of physiological reaction tomusic. As both music and EDA vary over time, it is impor-tant to capture general patterns and particular events inparticipants’ skin conductance as time unfolds and to re-late these events to the musical performance. One way tolook at the present data is to consider each set of data(i.e. each trial) as a curve on a time scale instead of a stringof independent numbers. The curves can be represented bymathematical functions each of which become a datum,and are analyzed using functional data analysis (Levitin,Nuzzo, Vines, & Ramsay, 2007; Ramsay & Silverman, 2005).
Before these functional transformations were per-formed, the raw data were downsampled, scaled andtime-warped. The initial sets of data comprise 7500,7900 and 8000 values, that is, 100 values per second.Each set of data was downsampled by a factor 10, result-ing in 10 data points per second. As EDA is a slow phys-iological response (i.e. seconds), one data point per 10thof a second was estimated to be sufficient. Each data setwas then scaled in z-scores in order to control for thegreat variability in absolute values from one data set toanother. (This follows because we were not interestedin the absolute EDA value, but in its change as a functiontime.) Finally, because the three different performancespresented in all conditions were not of equal duration,the resulting electrodermal activity signals were not allof the same duration within each subject and eachmodality of presentation. In order to have signals ofequal length and of corresponding points in time, thetime vectors of the shortest signals (75s and 79s) werestretched to the length of the longest time vector (80s)using time-warping registration. With this mathematicalprocedure, the idea is to scale, by globally expandingtime, the recorded time points for each trial so that itcorresponds to time points of a reference time vector,which in this case was the longest dataset (standard per-formance manner). We performed simple linear transfor-mation of the timings for the shortest signals so theywould correspond to the reference timing. In some com-plex time-warping functions, time is stretched over someintervals and compressed over others. However in thiscase, we opted for a global stretching approach, whichwe considered would provide a good approximation oftime matching with minimal loss of information aboutdifferences in EDA reaction times between modalities ofpresentation.
Each of these curves was mathematically modeled byusing 50 4th order (cubic) B-spline functions. Splinefunctions are considered best at approximating mostnon-periodic functional data. Modeling the data with 50functions, rather than keeping all of the 750, 790 or800 points as independent parameters rendered our basicunits of analysis more computable and allowed for moredegrees of freedom in testing the hypothesis and explor-ing the data. Each functional observation was thus mod-eled in the form:
xiðtÞ ¼X150
k¼1
ckUkðtÞ;
where x is the functional observation (as a function oftime), t denotes time, k is the number of basis functions,U is a basis function of time, and c is the coefficient corre-sponding to the basis function.
Three two-way functional analyses of variance (fANO-VA) were employed with modality and subjects as theindependent-group variable and the random variable,respectively. One fANOVA was employed for each compar-ison, i.e. AO–AV, AO–VO and AV–VO. One advantage of thistechnique compared to traditional ANOVA is to allow us todiscover when in the musical performance significant dif-ferences arise.
3.3.1. AO vs. AVThe electrodermal signals for AO and AV conditions
generally followed the same contour, but they differed sig-nificantly (DF = 1,6; p < .05) from one another between thefollowing sections of the excerpt: 26.4–30.4 s, 39.3–39.5 s,and 58.2–59.4 s. Moreover, using a critical level of p < .01,the curves differed significantly during the following sec-tions of the piece: 27.3–9.2 s and 58.6–58.9 s. Fig. 3a showsthe F-ratio contrasting these two modalities as a functionof time.
3.3.2. AO vs. VOThe electrodermal signals for AO and VO conditions
generally followed the same contour, but they differed sig-nificantly (DF = 1,6; p < .05) from one another between thefollowing sections of the excerpt: 28.1–29.7 s, 35.2–36.4 s,and 38.8–40.2 s. Fig. 3b shows the F-ratio contrasting thesetwo modalities as a function of time.
3.3.3. AV vs. VOThe electrodermal signals for AV and VO conditions
generally followed the same contour, but they differed sig-nificantly (DF = 1,6; p < .05) from one another between thefollowing sections of the excerpt: 1.8–5.1 s, 34.6–39.2 s,43.1–46.2 s, 73.4–74.1 s, and 77.1–79.1 s. Moreover, usinga critical level of p < .01, the curves differed significantlyduring the following section of the piece: 35.3–36.8 s.Fig. 3c shows F-ratio contrasting these two modalities asa function of time.
3.4. Analysis of phasic EDA responses
We also employed a new technique consisting of thedecomposition and analysis of single phasic skin conduc-tance responses (Benedek & Kaernbach, 2008). BecauseEDA reflects a pattern of partially overlapping discrete re-sponses on a slowly changing background, this techniqueallows distinguishing between the phasic componentsand a tonic component, and to analyze the amplitudesand onset times of the single phasic responses.
One-way ANOVA showed that the skin conductance re-sponse amplitudes were significantly different (F(2,968) = 53.25, p < .01) between the modalities of presenta-tion. Post hoc pairwise comparisons (using Tukey–Kra-mer’s honestly significant difference criterion) revealedthat the average of amplitudes in AV mode (mean0.93 lS, SD 0.97) was significantly higher than amplitudesin AO (mean 0.37 lS , SD 0.40; p < .01) and VO (mean
C. Chapados, D.J. Levitin / Cognition 108 (2008) 639–651 645

Author's personal copy
0.49 lS, SD 0.67; p < .01) modes. These results are consis-tent with the differences in average EDA amplitude forthe entire signal, as we assessed by ANOVA in §3.2 be-tween the modalities of presentation.
The mean onset times (in seconds) were 9.12, 9.07 and8.68 for the phasic responses in AO, VO and AV conditions,respectively. One-way ANOVA showed that the onset timesdid not significantly differ between modalities (F(2,968) = 2.73, p = 0.07).
3.5. Correlation with subjective tension judgments
Correlations between EDA and subjective tension dataobtained in a previous study (Vines et al., 2006) wereperformed. The original tension data sets were down-sampled to 10 Hz, resulting in a sampling rate equivalentto EDA data. Each tension data set was then scaled in z-scores in order to control for the great variability inabsolute values from one data set to another and to haveequivalent scaling and units for tension and EDA data.The curves representing the average of all tension judg-ments for the same musical stimuli as in the presentstudy were calculated for each sensory modality. A cor-relational analysis was performed between those tensioncurves and the average EDA curves for each modality. Ityielded correlation coefficients of 0.12 for AO modalityand 0.09 for AV modality, which reached significance(p < .05; note however that the explained variance issmall and the significance is a product of the very largenumber of datapoints and violations of stationarity). Asignificant negative correlation coefficient of �0.55 wasfound between tension and EDA for VO modality(p < .01). Fig. 4a, b and c show the averaged curves forEDA and tension in the AO, AV and VO conditions,respectively.
The Stravinsky piece can be regarded as comprisingthree different sections (Friedland, n.d.). The first sectionextends from the beginning of the piece to the pause indi-cated by the double bar (see Appendix A), occurring at�t = 32 s in the performance we used. The second sectionextends from the end of Section 1 to the 16th-note restand breath mark at around 58 s. The third and last sectionextends from this point to the end of the piece. The firstand final sections are similar in musical content, whereasthe second middle section is unique. On Fig. 4, these sec-tion boundaries are represented by the vertical lines.
Additional correlation analyses between EDA and ten-sion were performed within each of these sections forall three modalities. For the AO modality, correlation coef-ficients of .32, .07, and .06 were obtained for the first, sec-ond and third sections, respectively. For the AV modality,correlation coefficients of .71, .39, and �.63 were obtainedfor the first, second and third sections, respectively. Forthe VO modality, correlation coefficients of �.44, .54,and �.90 were obtained for the first, second and thirdsections, respectively. We performed moving windowedcross-correlations to take into account any lags in latencybetween the physiological response and the slider re-sponses, and these did not yield significantly different re-sults, so here we report only the correlations on theunshifted data.
Finally, an analysis of variability was performed in orderto compare the variance between EDA and tension for eachmodality. In all AO, VO and AV conditions, variability wassignificantly greater in the tension judgments than in theelectrodermal activity (F(8, 13) = 7.4, p < .001; (F(8,18) = 4.63, p < .01; (F(9, 17) = 8.90, p < .001, respectively).
4. Discussion
The research described here compliments work onelectrodermal response to emotion-evoking stimuli, aswell as investigations into the emotional response tomusical performance. It also adds new insights intocross-modal interactions giving rise to physiological reac-tions to music.
4.1. Effect of sensory mode
The higher levels of electrodermal activity for partici-pants who could both hear and see the performances, ascompared to those who could only hear or only see, indi-cates that the interaction between the two sensorymodalities conveyed by musical performances createdan emergent property, a holistic perception that wasgreater than the sum of its parts. This result is consistentwith the tension study (Vines et al., 2006), which alsoidentified evidence for emergent properties in their AVcondition, using subjective behavioral measurements oftension and other emotions. It appears that there is anonlinear summation of physiological arousal when bothsensory modalities are observed. The music theorist,Alexander Truslit, proposed that both a musician’s bodymovements and musical sound originate in the same ‘‘in-ner motion” (innere bewegtheit; Repp, 1993). It is impor-tant to recognize that all musical sounds, includingsinging, require movements of the body to producethem. That is, the origin of the auditory signal that weso closely associate with music is in a physical gesturethat normally has a visual counterpart. Primates evolvedover hundreds of thousands of years in a world in whichseeing and hearing one another were part of the sameevent – indeed, human infants undergo a period of sen-sory ambiguation in which seeing and hearing are con-nected (infantile synaesthesia) – and the notion of anaudio recording existing independently of the visual ges-tures that gave rise to the performance is only recent.
Perhaps audience members having access to both dimen-sions of a performance leads to an enhanced connectionwith the mental state and musical intentions of the musi-cian, and thus an overall experience with enhanced emo-tional response. People who enjoy attending live concertsmight seek this increased arousal that is not available solelyby listening to CDs. It also reveals that the notion that musicas a purely auditory art form should be revised to include avisual dimension, since the latter conveys important infor-mation about musician’s intention and interacts with thesound for the overall arousal state of the listener.
In addition, the present experiment showed that dy-namic galvanic skin response was generally similar acrossthe modalities of presentation (AV, AO and VO), that is, theresponses tended to follow similar contours. However, in
646 C. Chapados, D.J. Levitin / Cognition 108 (2008) 639–651
Author's personal copy
some parts of the piece, the level of electrodermal activityvaried significantly from one presentation mode to an-other, revealing its sensitivity to physiological differences,and hence its utility as an objective measure of music-in-duced emotion. For instance an important musical eventoccurs between 28 s and 40 s of the piece. At this point,the first section ends at t = �31 s and is followed by a longpause before the beginning of the second section att = �33 s. Here there is a discrepancy between the informa-tion conveyed in the auditory mode and information con-veyed visually. The music stops and a listener unfamiliarwith the piece may be uncertain as to whether the piecehas ended, or what is going to happen next. An observerof the visual channel has an entirely different informa-tional set available: the performer is holding the clarinetnear his mouth, his fingers are at the ready, his eyes are fo-cused on the score and he inhales. The observer in the VOcondition is able to extract a great deal of informationabout what is happening in the piece during this time per-iod, information that is unavailable to the listener in theAO condition. A participant in the AV condition can inte-grate these two sources of information and appreciatethe musical and performance tension that the rest creates.
As we might expect, the electrodermal activity follow-ing this musical event is different between modalities ofpresentation. When the excerpt was presented in the audi-tory only mode compared with the visual only mode, the
electrodermal activity differed significantly at three timespoints in this time window: from 28.1 to 29.7 s, from35.2 to 36.4 s, and from 38.8 to 40.2 s. In these portionsof the piece, the scaled EDA was higher in the AO conditioncompared to the VO condition. Electrodermal activity alsodiffered when the musical piece was presented in bothmodalities (AV) compared with the VO mode from 34.6to 39.2 seconds (scaled EDA higher in AV than in VO mode)and compared with the AO mode from 26.4 to 30.4 s andfrom 39.3 to 39.5 s (scaled EDA higher in AO than in AVmode).
As shown on Fig. 5, the average electrodermal activ-ity in the AO condition (black curve) dropped as thefirst section ended. Then, the performer’s breath wasclosely followed by an increase in EDA levels, probablyresulting from a short period of unexpectedness. TheEDA levels for participants who only saw the perfor-mance (VO) also decreased as the musician stoppedmoving at the end of the first section. However, thebreath preceding the second section was not closely fol-lowed by a peak in activity. Instead, the electrodermalactivity levels started to increase after the second sec-tion had started and the musician started moving again.Finally, during this whole section of the piece, the EDAlevels in the AV modality increased with a high ampli-tude. These results seem to indicate that differentmodalities conveyed different pieces of information
Fig. 3. Functional F-ratio for the three pairwise comparisons (a) AO vs. AV conditions; (b) AO vs. VO conditions; (c) AV vs. VO conditions. The green dashedline represents the critical level p = .01; and the red dashed line represents the critical level p = .05.
Fig. 4. Average of scaled (z-score) values of tension judgments from Vines, Krumhansl, Wanderley, and Levitin (2006) (blue line) and EDA amplitude (redline) as a function of time (a) AO; (b) AV; (c) VO.
C. Chapados, D.J. Levitin / Cognition 108 (2008) 639–651 647
Author's personal copy
about the structure of a musical piece and the tension itexpresses, giving rise to different arousal activationsmeasured by electrodermal activity.
Readers interested in knowing more about the directionof the other significant differences yielded by the func-tional ANOVA can refer to the average EDA curves repre-sented in Fig. 1.
4.2. Comparisons with subjective data
Arousal may be the link between tension and emotion-ality experienced in reaction to music. Steinbeis, Koelsch,and Sloboda (2006) propose a causal chain whereby theperception of tension in music first leads to increased arou-sal, which in turn contributes to the subjective experienceof emotion. According to this view, any measures of phys-iological arousal should correlate with continuous tensionjudgments, and with a small, negative phase offset (that is,occurring occur slightly ahead of time).
Electrodermal activity obtained in our study and thetension judgments (Vines et al., 2006) were indeed foundto be positively correlated in some sections of the piece,but also negatively correlated or uncorrelated in othersections of the piece, depending on the modality of pre-sentation and the particular musical events, visual/ges-tural events or rests taking place. In the AO mode,electrodermal activity and tension judgments were notsignificantly correlated during the whole piece. Whenthe piece was presented in the VO mode, EDA and ten-sion were significantly negatively correlated during thefirst and third sections of the piece and significantly pos-itively correlated during the middle section of the piece.In the AV condition (in which both modalities were pres-ent), EDA and tension were positively correlated in thefirst and second sections and negatively correlated inthe third section. Based on these results, we can con-clude that in some portions of the piece, the electroder-
mal activity is driven by the same underlyingphenomena that are giving rise to the subjective tensionjudgments. However, this is not true for all portions ofthe piece. Discrepancies between the two sets of datacould be in part explained by the fact that electrodermalactivity is a slower response with a more complexdynamics and lower variability over time, or alterna-tively, that the slider ratings are highly variable andintrinsically subjective. There may be still other factorsat work underlying the differences between these twomeasures – for example, if the discrepancy was merelybecause EDA is slower, an autocorrelation would haveshown up in our sliding window technique.
A correlational analysis of EDA and tension data assets of functions over time would have revealed moreinformation about the dynamics of the correlation, butno such techniques are available presently (such func-tional correlations are currently under development inour laboratory and others). This preliminary investigationthus indicates that the hypothesis proposed by Steinbeisand colleagues (2006) may be only part of the story. Fac-tors as yet uncovered may mediate the relationship be-tween tension and physiological arousal, and this willrequire further investigation.
Finally, the highest correlations between tension andelectrodermal activity were found in the condition inwhich the information was conveyed through both audi-tory and visual modalities. The integration of the twomodalities gave rise to more consistent subjective andphysiological responses, suggesting that bimodal integra-tion leads to a better appreciation of the surrounding stim-uli and is therefore advantageous. In fact, the integration ofmultiple sensory channels is also more realistic and natu-ralistic, as we did not evolve to – and in fact rarely – pro-cess information conveyed by only one sense, but tend toperceive, process and react to information presented in amulti-modal fashion.
Fig. 5. Average z-score scaled electrodermal amplitude as a function of time for each modality condition (AO, VO, AV) for the time window starting at 28 sand ending at 40 s.
648 C. Chapados, D.J. Levitin / Cognition 108 (2008) 639–651

Author's personal copy
The idea of measuring subjective tension judgmentsand electrodermal activity concurrently in the same indi-viduals in our experiment was discarded because of con-cerns that the movement of the dominant hand for theslider would interfere with the electrodermal activity ofthe other hand. However, since the participants were in-structed to imagine that they were moving a slider upand down to express the experienced tension, it is possiblethat part of the physiological response was due to motorimagery; a previous study showed that motor imageryand motor behaviour largely share their neural mecha-nisms (Decety, 2002). Additional experiments in whichparticipants are given no instruction to imagine moving aslider, and in which participants move a slider while theirelectrodermal activity is being measured in the other handwill help to determine the factors influencing the resultsidentified in the present study.
4.3. Comparisons with musical score
Zones and peaks of tension were determined in thescore by a music theorist (A. Vishio, personal communi-cations, April 4, 2003). For instance, he noted a peak oftension at the end of the first section and a zone of ten-sion following the onset of the second section of thepiece. At this point in the piece, we observed an increasein average EDA activity in all modes of presentation(Fig. 5) as well as discrepancies in EDA activity acrossthe different modes of presentation. Moreover, the musictheorist noted a zone of tension from � t = 65 s to �t = 68 s of the musical piece. This section is characterizedby a high density of high-frequency notes compared tothe preceding section. During this time window, theaveraged EDA levels for AO and AV modalities increase,but not for VO modality (see Fig. 1). It is noteworthy thatthe musician does not perform any high-amplitudemovements during this section of the piece. This couldexplain the non-significant discrepancy between electro-dermal activity contour of conditions in which auditoryinformation is available and that of the visual onlymodality. Some other zones and peaks of tension thathave been described by the music theorist do not corre-spond to changes in average electrodermal activity in thelisteners, but tension in the music is not the only factorinfluencing arousal. Moreover, composers and music the-orists may hold incorrect beliefs about what listeners areactually attending to (Lalitte et al., 2004; Levitin & Cud-dy, 2004).
Several features in music were pinpointed as causingchanges on the arousal dimension of emotion and onsome physiological measures. First, expectations are be-lieved to play a great role in musical emotions (Berlyne,1971; Levitin, 2006; Meyer, 1956; Steinbeis et al., 2006).For instance, increases in the level of harmonic unex-pectedness during a musical piece produced increasesin subjective tension and emotionality responses as wellas in electrodermal activity (Steinbeis et al., 2006). Thissuggests that a surprising musical structure can increasearousal, but uncertainty (suspense and absence of clearexpectations) is also a potential arousal-increasing fea-ture (Berlyne, 1971). This might explain why the breath
occurring at t = �32 s of the performance caused a peakin electrodermal activity for the auditory, but not forthe visual mode of presentation. Other features suchas tempo, accentuation and rhythmic articulation, wereshown to be highly correlated with physiological mea-sures such as electrodermal activity and could discrimi-nate between high and low arousal (Gomez & Danuser,2007). Other aspects of musical structure were associ-ated with increased arousal, such as novelty, complexity,ambiguity and instability (Berlyne, 1971).
In the present work, we focused on the dynamic nat-ure of emotional responses to music. The way electroder-mal activity varies as a function of time is complex andvariable. An important related aspect to be taken intoconsideration in the following discussion is the latencyof EDA, which refers to the interval of time from stimu-lus presentation to the onset of the physiological re-sponse. It usually ranges between 1 and 4 seconds forEDA following the presentation of emotion-evoking stim-uli (such as familiar faces (Ellis & Lewis, 2001) andacoustic stimulation (Elie & Guiheneuc, 1990). This isalso the latency of EDA following a musical event(Krumhansl, 1996; Sloboda & Lehmann, 2001). Therefore,we estimate the musical stimuli presented in this workto activate physiological responses with a similar timecourse. Much less is known about the temporal dynamicsof latency, that is, whether it is consistent or it variesover time. A better understanding of the dynamics ofEDA latency would help determine the temporal rela-tionship between EDA and subjective tension and be-tween electrodermal responses and their underlyingevents in the musical stimuli.
Our results point to the potential utility of electroder-mal recordings as an objective measure to support andfurther validate subjective judgments of the experienceof music-elicited emotions. In fact, electrodermal re-sponse reveals the overall affective state of the listener,and especially the arousal dimension of emotional re-sponse (Lang, Greenwald, Bradley & Hamm,1993; Witvli-et, 1998). At the same time, this study also shows thatbehavioral continuous measurements convey informationthat is consistent with objective physiological measuresin the experience of emotion.
In conclusion, this research contributes to knowledgeabout the ties between physiology, subjective emotion,and brain processing of emotion-evoking stimuli andmusical performance in particular. Furthermore, it re-vealed multi-sensory interactions in ongoing perception.
Acknowledgements
We thank Ioana Dalca, Mitchel Benovoy and Jim Ram-say for their contribution to the statistical analysis, Mar-ilyn Jones-Gotman for the EDA recording equipment. Wealso thank Bradley Vines for his contribution in thedevelopment of the study, and Marcelo Wanderley formaking available the stimulus tapes. This work was sup-ported by grants from VRQ (to DJL and Wieslaw Woszc-zyk), SSHRC and NSERC (to DJL), NSF (to DJL and VinodMenon), and a NSERC Graduate Student Fellowship toC.C.
C. Chapados, D.J. Levitin / Cognition 108 (2008) 639–651 649
Author's personal copy
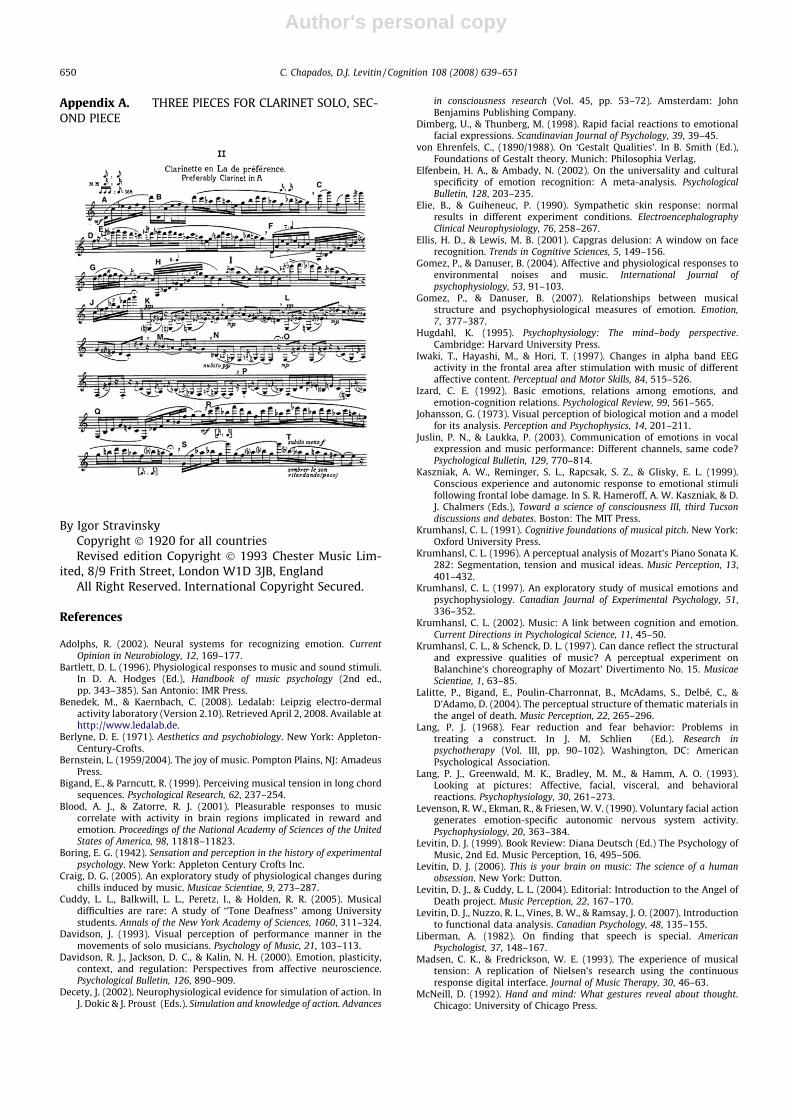
Appendix A. THREE PIECES FOR CLARINET SOLO, SEC-OND PIECE
By Igor StravinskyCopyright � 1920 for all countriesRevised edition Copyright � 1993 Chester Music Lim-
ited, 8/9 Frith Street, London W1D 3JB, EnglandAll Right Reserved. International Copyright Secured.
References
Adolphs, R. (2002). Neural systems for recognizing emotion. CurrentOpinion in Neurobiology, 12, 169–177.
Bartlett, D. L. (1996). Physiological responses to music and sound stimuli.In D. A. Hodges (Ed.), Handbook of music psychology (2nd ed.,pp. 343–385). San Antonio: IMR Press.
Benedek, M., & Kaernbach, C. (2008). Ledalab: Leipzig electro-dermalactivity laboratory (Version 2.10). Retrieved April 2, 2008. Available athttp://www.ledalab.de.
Berlyne, D. E. (1971). Aesthetics and psychobiology. New York: Appleton-Century-Crofts.
Bernstein, L. (1959/2004). The joy of music. Pompton Plains, NJ: AmadeusPress.
Bigand, E., & Parncutt, R. (1999). Perceiving musical tension in long chordsequences. Psychological Research, 62, 237–254.
Blood, A. J., & Zatorre, R. J. (2001). Pleasurable responses to musiccorrelate with activity in brain regions implicated in reward andemotion. Proceedings of the National Academy of Sciences of the UnitedStates of America, 98, 11818–11823.
Boring, E. G. (1942). Sensation and perception in the history of experimentalpsychology. New York: Appleton Century Crofts Inc.
Craig, D. G. (2005). An exploratory study of physiological changes duringchills induced by music. Musicae Scientiae, 9, 273–287.
Cuddy, L. L., Balkwill, L. L., Peretz, I., & Holden, R. R. (2005). Musicaldifficulties are rare: A study of ‘‘Tone Deafness” among Universitystudents. Annals of the New York Academy of Sciences, 1060, 311–324.
Davidson, J. (1993). Visual perception of performance manner in themovements of solo musicians. Psychology of Music, 21, 103–113.
Davidson, R. J., Jackson, D. C., & Kalin, N. H. (2000). Emotion, plasticity,context, and regulation: Perspectives from affective neuroscience.Psychological Bulletin, 126, 890–909.
Decety, J. (2002). Neurophysiological evidence for simulation of action. InJ. Dokic & J. Proust (Eds.). Simulation and knowledge of action. Advances
in consciousness research (Vol. 45, pp. 53–72). Amsterdam: JohnBenjamins Publishing Company.
Dimberg, U., & Thunberg, M. (1998). Rapid facial reactions to emotionalfacial expressions. Scandinavian Journal of Psychology, 39, 39–45.
von Ehrenfels, C., (1890/1988). On ‘Gestalt Qualities’. In B. Smith (Ed.),Foundations of Gestalt theory. Munich: Philosophia Verlag.
Elfenbein, H. A., & Ambady, N. (2002). On the universality and culturalspecificity of emotion recognition: A meta-analysis. PsychologicalBulletin, 128, 203–235.
Elie, B., & Guiheneuc, P. (1990). Sympathetic skin response: normalresults in different experiment conditions. ElectroencephalographyClinical Neurophysiology, 76, 258–267.
Ellis, H. D., & Lewis, M. B. (2001). Capgras delusion: A window on facerecognition. Trends in Cognitive Sciences, 5, 149–156.
Gomez, P., & Danuser, B. (2004). Affective and physiological responses toenvironmental noises and music. International Journal ofpsychophysiology, 53, 91–103.
Gomez, P., & Danuser, B. (2007). Relationships between musicalstructure and psychophysiological measures of emotion. Emotion,7, 377–387.
Hugdahl, K. (1995). Psychophysiology: The mind–body perspective.Cambridge: Harvard University Press.
Iwaki, T., Hayashi, M., & Hori, T. (1997). Changes in alpha band EEGactivity in the frontal area after stimulation with music of differentaffective content. Perceptual and Motor Skills, 84, 515–526.
Izard, C. E. (1992). Basic emotions, relations among emotions, andemotion-cognition relations. Psychological Review, 99, 561–565.
Johansson, G. (1973). Visual perception of biological motion and a modelfor its analysis. Perception and Psychophysics, 14, 201–211.
Juslin, P. N., & Laukka, P. (2003). Communication of emotions in vocalexpression and music performance: Different channels, same code?Psychological Bulletin, 129, 770–814.
Kaszniak, A. W., Reminger, S. L., Rapcsak, S. Z., & Glisky, E. L. (1999).Conscious experience and autonomic response to emotional stimulifollowing frontal lobe damage. In S. R. Hameroff, A. W. Kaszniak, & D.J. Chalmers (Eds.), Toward a science of consciousness III, third Tucsondiscussions and debates. Boston: The MIT Press.
Krumhansl, C. L. (1991). Cognitive foundations of musical pitch. New York:Oxford University Press.
Krumhansl, C. L. (1996). A perceptual analysis of Mozart’s Piano Sonata K.282: Segmentation, tension and musical ideas. Music Perception, 13,401–432.
Krumhansl, C. L. (1997). An exploratory study of musical emotions andpsychophysiology. Canadian Journal of Experimental Psychology, 51,336–352.
Krumhansl, C. L. (2002). Music: A link between cognition and emotion.Current Directions in Psychological Science, 11, 45–50.
Krumhansl, C. L., & Schenck, D. L. (1997). Can dance reflect the structuraland expressive qualities of music? A perceptual experiment onBalanchine’s choreography of Mozart’ Divertimento No. 15. MusicaeScientiae, 1, 63–85.
Lalitte, P., Bigand, E., Poulin-Charronnat, B., McAdams, S., Delbé, C., &D’Adamo, D. (2004). The perceptual structure of thematic materials inthe angel of death. Music Perception, 22, 265–296.
Lang, P. J. (1968). Fear reduction and fear behavior: Problems intreating a construct. In J. M. Schlien (Ed.). Research inpsychotherapy (Vol. III, pp. 90–102). Washington, DC: AmericanPsychological Association.
Lang, P. J., Greenwald, M. K., Bradley, M. M., & Hamm, A. O. (1993).Looking at pictures: Affective, facial, visceral, and behavioralreactions. Psychophysiology, 30, 261–273.
Levenson, R. W., Ekman, R., & Friesen, W. V. (1990). Voluntary facial actiongenerates emotion-specific autonomic nervous system activity.Psychophysiology, 20, 363–384.
Levitin, D. J. (1999). Book Review: Diana Deutsch (Ed.) The Psychology ofMusic, 2nd Ed. Music Perception, 16, 495–506.
Levitin, D. J. (2006). This is your brain on music: The science of a humanobsession. New York: Dutton.
Levitin, D. J., & Cuddy, L. L. (2004). Editorial: Introduction to the Angel ofDeath project. Music Perception, 22, 167–170.
Levitin, D. J., Nuzzo, R. L., Vines, B. W., & Ramsay, J. O. (2007). Introductionto functional data analysis. Canadian Psychology, 48, 135–155.
Liberman, A. (1982). On finding that speech is special. AmericanPsychologist, 37, 148–167.
Madsen, C. K., & Fredrickson, W. E. (1993). The experience of musicaltension: A replication of Nielsen’s research using the continuousresponse digital interface. Journal of Music Therapy, 30, 46–63.
McNeill, D. (1992). Hand and mind: What gestures reveal about thought.Chicago: University of Chicago Press.
650 C. Chapados, D.J. Levitin / Cognition 108 (2008) 639–651

Author's personal copy
Menon, V., & Levitin, D. J. (2005). The rewards of music listening:Response and physiological connectivity of the mesolimbic system.Neuroimage, 28, 175–184.
Meyer, L. (1956). Music and emotion. Chicago: University of Chicago Press.Meyer, L. (1994). Music, the arts, and ideas: Patterns and predictions in
twentieth-century culture. Chicago: University of Chicago Press.North, A. C., Hargreaves, D. J., & Hargreaves, J. J. (2004). Uses of music in
everyday life. Music Perception, 22, 41–77.Panksepp, J. (1995). The emotional sources of ‘‘chills” induced by music.
Music Perception, 13, 171–207.Patel, A. D. (2003). Language, music, syntax and the brain. Nature
Neuroscience, 6, 674–681.Ramsay, J. O., & Silverman, B. W. (2005). Functional data analysis (2nd ed.).
New York: Springer.Repp, B. H. (1993). Music as motion: A synopsis of Alexander Truslit’s
(1938) Gestaltung und Bewegung inder Music (shaping and motion inmusic). Psychology of Music, 21, 48–72.
Rizzolatti, G., Fadiga, L., Gallese, V., & Fogassi, L. (1996). Premotor cortexand the recognition of motor actions. Cognitive Brain Research, 3,131–141.
Runeson, S., & Frykholm, G. (1983). Kinematic specification of dynamicsas an informational basis for people-and-action perception:Expectations, gender, recognition, and deceptive intention. Journalof Experimental Psychology: General, 112, 585–615.
Schaefer, F., & Boucsein, W. (2000). Comparison of electrodermalvoltage and constant current recording techniques using thephase angle between alternating voltage and current.Psychophysiology, 37, 85–91.
Scherer, K. B., & Zentner, M. R. (2001). Emotional effects of music:Production rules. In P. N. Juslin & J. A. Sloboda (Eds.), Music andemotion: Theory and research (pp. 361–392). Oxford: OxfordUniversity Press.
Schopenhauer, A. (1859). The world as will and representation (3rd ed.).New York: Dover.
Schubert, E. (2001). Continuous measurement of self-report emotionalresponse to music. In P. N. Juslin & J. A. Sloboda (Eds.), Music andemotion: Theory and research (pp. 393–414). Oxford: OxfordUniversity Press.
Sloboda, J. A. (1999). Everyday uses of music listening: A preliminarystudy. In S. W. Yi (Ed.), Music, mind and science (pp. 354–369). Seoul,Korea: Western Research Institute.
Sloboda, J. A., & Lehmann, A. C. (2001). Tracking performance correlates ofchanges in perceived intensity of emotion during differentinterpretations of a Chopin piano prelude. Music Perception, 19,87–120.
Steinbeis, N., Koelsch, S., & Sloboda, J. A. (2006). The role of harmonicexpectancy violations in musical emotions: Evidence from subjective,physiological and neural responses. Journal of Cognitive Neuroscience,18, 1380–1393.
Sutton, S., Braren, M., Zubon, J., & John, E. R. (1965). Evoked potentialcorrelates of stimulus uncertainty. Science, 150, 1187–1188.
Thompson, W. F., & Russo, F. A. (2007). Facing the music. PsychologicalScience, 18, 756–757.
Tranel, D., & Damasio, A. R. (1985). Knowledge without awareness: Anautonomic index of facial recognition by prosopagnosics. Science, 228,1453–1454.
VanderAck, S. D., & Ely, D. (1992). Biochemical and galvanic skinresponses to music stimuli by college students in biology andmusic. Perceptual and Motor Skills, 74, 1079–1090.
VanderAck, S. D., & Ely, D. (1993). Cortisol, biochemical and galvanic skinresponses to music stimuli of different preference values by collegestudents in biology and music. Perceptual and Motor Skills, 77,227–234.
Vines, B. W., Krumhansl, C. L., Wanderley, M. M., Dalca, I., & Levitin, D. J.(2005). Dimensions of emotion in expressive musical performances.Annals of the New York Academy of Sciences, 1060, 462–466.
Vines, B. W., Krumhansl, C. L., Wanderley, M. M., & Levitin, D. J. (2006).Cross-modal interactions in the perception of musical performance.Cognition, 101, 80–113.
Wanderley, M. M. (2002). Quantitative analysis of non-obvious performergestures. In I. Wachsmuth & T. Sowa (Eds.), Gesture and sign languagein human–computer interaction (pp. 241–253). Berlin: Springer.
Witvliet, C. C. V. (1998). The impact of music-prompted emotionalvalence and arousal on self-report, autonomic, facial EMG, and startleresponses across experimental contexts. Dissertation AbstractsInternational: Section B: The Sciences & Engineering, 58, 6832.
C. Chapados, D.J. Levitin / Cognition 108 (2008) 639–651 651