author's personal copy - Δρ. Γρηγόριος Νάσιος et al 2009.pdf · author's...
TRANSCRIPT

This article appeared in a journal published by Elsevier. The attachedcopy is furnished to the author for internal non-commercial researchand education use, including for instruction at the authors institution
and sharing with colleagues.
Other uses, including reproduction and distribution, or selling orlicensing copies, or posting to personal, institutional or third party
websites are prohibited.
In most cases authors are permitted to post their version of thearticle (e.g. in Word or Tex form) to their personal website orinstitutional repository. Authors requiring further information
regarding Elsevier’s archiving and manuscript policies areencouraged to visit:
http://www.elsevier.com/copyright

Author's personal copy
Neck rigidity in Parkinson's disease patients is related to incomplete suppression ofreflexive head stabilization
Dimitri Anastasopoulos a,b, Christoph Maurer b, Gregory Nasios b,c, Thomas Mergner b,⁎a Department of Physiology and Clinical Neurophysiology, School of Nursing, University of Athens, Tetrapoleos 8, 11527 Goudi, Athens, Greeceb Neurologische Klinik, Neurozentrum, Universität Freiburg, Breisacherstraβe 64, 79106 Freiburg, Germanyc Department of Speech and Language Therapy, TEI of Epirus, Athens National Road, 45500 Ioannina, Greece
a b s t r a c ta r t i c l e i n f o
Article history:Received 12 January 2009Revised 10 March 2009Accepted 13 March 2009Available online 21 March 2009
Keywords:Parkinson's diseaseRigidityPassive head rotationDynamic modelSuppression of reflexive head stabilization
Muscle rigidity in PD (Parkinson's disease) patients represents an involuntary increase in muscle tone thatstands out upon passive rotation of a joint. The pathophysiology of rigidity is still not well understood. Wemeasured head–trunk torque in PD patients and normal controls during transient passive head rotations bymeans of servomotors under the instruction to the subjects to relax the neck muscles. We observed thatrotation onset was followed by an initial rapid rise in resistive torque, similarly in both subject groups. It thenleveled off or declined in controls. With PD patients, in contrast, the rise continued roughly proportional tohead eccentricity almost until the end of the rotation. These observations led us to the hypothesis that the initialrise in torque represents reflexive head stabilization that normal subjects in the course of the rotationalstimulus are able to suppress, whereas PD patients are less effective in doing so. The hypothesis wasimplemented into a dynamic controlmodel of active and passive head rotation.Model simulations successfullyreproduced the torque responses of normal subjects and PD patients in the present and previous studies.
© 2009 Elsevier Inc. All rights reserved.
Introduction
Increased resistance to passive joint rotation, i.e. rigidity, is one ofthe cardinal signs of Parkinson's disease (PD). It is assessed clinicallyby slowly and unpredictably rotating the joint of interest while askingthe patient to relax and remain passive. Rigidity tends to be sustainedthroughout the passive movement, unless occasionally additionaltremor leads to cogwheel-type interruptions. The underlying patho-physiology is still not well understood (Lee, 1989; Delwaide, 2001;Hallett, 2003). A current hypothesis considers suppression of auto-matic postural activity a function of the basal ganglia (cf. Mink, 1996).We therefore asked whether PD rigidity reflects joint stabilization bylong-latency proprioceptive reflexes, which patients, unlike normalsubjects, cannot voluntarily control. This study explores into thehypothesis of an impaired voluntary suppression of reflexive neckstabilization as the cause of neck rigidity in PD patients.
There is a considerable amount of electrophysiological work on PDrigidity that focused on the role of spinal mechanisms andproprioceptive afferents. Foerster (1921) found that rigidity wasabolished after section of the dorsal roots. Yet, the spinal propriocep-tive reflex loop, fusimotor activity, and the gain of α–γ co-activationare normal in PD (Burke et al., 1977), in accordance with the clinicalexperience that tendon jerks are not exaggerated. Thus, with PD
rigidity, unlike with spasticity, short-latency components of thestretch reflex are normal, whereas late components, starting in the50–100 ms latency range, are enhanced (Tatton and Lee, 1975). Theiraugmented magnitude has been claimed to correlate to rigidity(Tatton et al. 1984). The long latency of these components has beenattributed mainly to low-conduction-velocity secondary spindle(group II) afferent inflow by some authors (Berardelli et al., 1983;Cody et al., 1986). Others, in contrast, related it to the involvement oflong neural loops through supra-spinal centers including the cerebralcortex, arising mainly from primary muscle spindle (Ia) input(Rothwell et al., 1983). Few studies related rigidity to reduced groupIb (Golgi tendon organ) inhibition of motoneuronal activity (Delwaideet al., 1991; Burne and Lippold, 1996).
While the short-latency reflexes are considered stereotypicalautogenic local spinal responses, the subsequently occurring long-latency reflexes appear to be involved in supra-spinal multi-jointcontextual responses to external disturbances (Marsden et al., 1983;also Kurtzer et al., 2008). The latter appear to involve the basal ganglia.A lesion study in primates suggests that the basal ganglia areimportant for controlling the sensitivity of flexors and extensors tostretch (Rea and Ebner, 1991). Furthermore, it has been shown that PDpatients, unlike normal subjects, have difficulties adjusting long-latency reflexes to the postural context (Diener et al., 1987). Theamount of PD rigidity seems to correlate with electromyographicactivity in the corresponding muscle and may be used for quantifyingand monitoring it over time and treatment (Meara and Cody, 1992;Levin et al., 2009).
Experimental Neurology 217 (2009) 336–346
⁎ Corresponding author. Fax: +49 761 270 5390.E-mail address: [email protected] (T. Mergner).
0014-4886/$ – see front matter © 2009 Elsevier Inc. All rights reserved.doi:10.1016/j.expneurol.2009.03.010
Contents lists available at ScienceDirect
Experimental Neurology
j ourna l homepage: www.e lsev ie r.com/ locate /yexnr

Author's personal copy
In behavioral studies, several proprioceptive functions have beenshown to be impaired in PD patients. Conscious perception ofproprioceptive stimulation by joint rotation is abnormal (Zia et al.,2000; Maschke et al., 2003). Additionally, arm pointing under pureproprioceptive control is abnormally slow and under-shooting, whileit improves when visuo-proprioceptive movement control is added tothe proprioceptive-motor integration (Klockgether and Dichgans,1994; Klockgether et al., 1995; Adamovich et al., 2001). Propriocep-tive-motor integration appears to be abnormal as well in stancestabilization of PD patients (Bloem et al., 2001; Rocchi et al., 2002;Maurer et al., 2003) and in walking (Jacobs and Horak, 2006). Thedeficit is related to a general difficulty in task- and set-switching(Fimm et al., 1994; Cools et al., 2001), which becomes especiallypronounced when the patients have to use internal cues and self-initiation instead of external input (Brown and Marsden, 1988;Kimmig et al., 2002; Werheid et al., 2007). There are studies onneuronal activity in the basal ganglia, which suggest that suppressionof automatic postural reactions is a relevant constitute of the PDmotorimpairment (Mink and Thach, 1991; Mink, 1996).
It is still unknown, however, how PD rigidity relates to thepresumed impairment of proprioceptive-motor integration. A hypoth-esis, to be valid, would have to address not only the just mentionedelectrophysiological and behavioral aspects, but also quantitativecharacteristics of the abnormal motor resistance. There are severalstudies that measured torque of limb joints or EMG activity inresponse to passive movements, but did so mainly in order toquantitatively distinguish PD rigidity from normal muscle resistanceand spasticity or to evaluate therapy effects (e.g. Webster, 1960;Prochazka et al., 1997; Mak et al., 2007; Shapiro et al., 2007, to name afew). Some of them characterized rigidity in terms of its stimulusvelocity and position dependency, though with differing results(Berardelli et al., 1983; Rothwell et al., 1983; Teräväinen et al., 1989;Lee et al., 2002; Mak et al., 2007). Also the damping in a leg pendulumtest was evaluated (Le Cavorzin et al., 2003). However, a systemsanalysis approach that addresses the signal processing deficit ofrigidity using a dynamic model of voluntary stiffness control has notyet been published to our knowledge.
In addition to affecting limb muscles, PD rigidity may also affectaxial muscles (Wright et al., 2007) including those of the neck(Kroonenberg et al., 2006). Axial rigidity is of functional relevance tothe extent that precise distal segment movements depend on exacttone regulation of the more proximal and axial muscles (Diener et al.,1989). Tone regulation of axial muscles has been considered to differsomewhat from that of distal muscles (Gurfinkel et al., 2006). Thisnotion has been extended to rigidity (Wright et al., 2007). However,the issue is still unresolved due to major methodological differencesbetween studies.
This study investigated axial rigidity at the neck level. Reasons forthis are that our laboratory has expertisewith headmovement controlin the horizontal plane and that there already exist correspondingdynamic models of reflexive head control from other laboratories(Schor et al., 1988; Keshner and Peterson, 1995; Keshner et al., 1999;Peng and Hain, 1996; Tangorra et al., 2003). The models considermainly two head stabilizing mechanisms that have originally beenidentified in animal experiments (Outerbridge and Melvill-Jones,1971; Goldberg and Peterson,1986). One is neck proprioceptive head–trunk stabilization, the cervico-collic reflex, the other, vestibular head-space stabilization, the vestibulo-collic reflex. Their presumed actionin adult humans depends to a large extent on the experimentalsituation in which they are tested (Schor et al., 1988; Keshner andPeterson, 1995).
We assessed transient neck torque responses upon passivehorizontal head rotations with different peak angular velocities(2.3, 4.6, and 18.4°/s) while keeping peak displacement constant.Furthermore, we applied proprioceptive and vestibular stimuli and acombination of both. This study extends the previous work of
Wright et al. (2007) who applied inter-segmental rotations at thelevel of the hips and shoulders, using periodic stimuli with very lowangular velocity (1°/s). These authors focused on directionalasymmetries, relations of rigidity to motor symptoms in theUPDRS, and on treatment effects by levo–dopa. In contrast, ourstudy aimed at a formalized explanation of rigidity in terms of adynamic control model to be derived from the experimentalfindings. Since passive tissue resistance may contribute considerablyto PD rigidity (Dietz et al., 1981; Watts et al., 1986), our study tookcare to measure foremost active muscle force rather than intrinsicmechanical properties. This was accomplished by using smallexcursions about primary position (within the so-called neutralzone; Kumar, 2004) and omitting severely affected patients withsecondary changes of the mechanical properties.
Methods
Patients and control subjects
Fourteen PD patients (63±8 yrs; seven females and seven males)were compared with 23 age-matched normal controls (55±13;eleven males and twelve females). All subjects gave their informedconsent to the study, which was approved by the local ethicscommittee. Patients' clinical data are given in Table 1. Disease durationranged between 1 and 10 yrs. The patients were moderately affected(average UPDRS scores just prior to measurements, 36±12; Hoehnand Yahr stages I, II or III, assessed by the same neurologist). Rigiditywas mild to moderate (most affected arm, score 1–3). All patientsreceived L-dopa (some in addition selegiline, amandatine, oragonists). Measurements took place in the early morning so that atleast 10 h had elapsed after the last medication. Six of the fourteenpatients had received brain imaging that showed no pathologicalfindings. None of the patients showed signs of considerable structuralbrain damage. None of the patients complained of neck pain or had ahistory of cervical syndrome.
Apparatus, stimuli and protocol
Subjects (Ss) were seated on a Bárány chair (Toennies, Freiburg) inthe center of a cylindrical screen of 0.8 m radius. Their heads werestabilized by means of a dental bite board during presentation of thestimuli. The board was attached to a head holder that wasmounted onthe chair, but could be rotated independently from the latter in thehorizontal plane (see inset of Fig. 1). The shaft of the head holdercontained a device for measuring horizontal head torque (Burster,Gernsbach, Germany; range 0–20 Nm, nonlinearity b0.2% of r.o.). The
Table 1Clinical data of PD patients.
Patient Age(years)
Diseaseduration(years)
Medication UPDRSscore(total)
Rigidity score(all extremitiesand neck)
1 55 5 L-dopa, selegiline 35 82 81 4 L-dopa 53 93 62 1 L-dopa 31 84 70 10 L-dopa 55 125 60 3 L-dopa, bromocriptine 33 26 56 1 L-dopa, bromocriptine 7 17 71 9 L-dopa, bromocriptine 37 58 59 4 L-dopa 22 49 66 10 L-dopa, bromocriptine 32 910 66 8 L-dopa, amantadine, 29 1011 48 3 L-dopa 40 812 60 7 L-dopa, amantadine,
selegiline46 7
13 70 6 L-dopa, selegiline 36 914 61 10 L-dopa, amantadine,
selegiline45 13
337D. Anastasopoulos et al. / Experimental Neurology 217 (2009) 336–346
Author's personal copy
chair and head holder were rotated by two independent position-controlled servomotors. The position of the subject's head wasadjusted so that the rotation axis passed through the intersection ofthe inter-aural and naso-occipital lines. Prior to testing, carewas takento align subject's head and trunk such that the head was facing in thedirection of the body'smid-sagittal plane. A laser spot, subtending 0.2°of visual angle, could be projected onto the screen and movedhorizontally by a mirror galvanometer, the axis of which was collinearwith the rotation axes of the chair and head holder.
Three stimuli were generated (compare insets in Figs. 2A–C): (A)Trunk-only rotation, by rotating chair and chair-mounted headgearby the same angle, but into opposite directions, with the result thatthe head remained stationary in space (physiologically, neck stimu-lus). (B) Head-only rotation, by head gear rotation; it resulted in head-space rotation upon the stationary trunk (combination of vestibularand neck stimuli). (C) Trunk+head (whole-body) rotation, by chairrotation with the headgear chair-fixed (vestibular stimulus). Therotation trajectories showed a smoothed trapezoidal wave form (seeFigs. 1 and 2). Peak angular displacement was kept constant (14°,towards either the left or the right side with respect to the primaryposition), while stimulus duration was varied (10, 5, and 1.25 s;dominant frequencies were 0.1, 0.2 and 0.8 Hz, respectively), as waspeak angular velocity that amounted to 2.3, 4.6, and 18.4°/s. With the14° head rotations to either the right or left side, the torsional motionis essentially restricted to the C1–C2 segments and is clearly withinthe physiological motion range and neutral zone (McClure et al., 1998;Takahiro et al., 2004).
The stimuli were always applied in darkness. Subjects' ears wereplugged in order to minimize auditory spatial orientation cues. Thestimuli were presented in 18 separate trials (3 stimulus peakvelocities×2 directions×3 different stimuli) in random order withina recording session that lasted 30–40 min.
InstructionsCare was taken to guide subjects' spatial attention appropriately
prior to each rotational stimulus. To this end, the afore mentioned
light spot was transiently switched on and subjects adjusted itsposition bymean of a remote control to their subjective visual straightahead direction (for details, cf. Maurer et al., 1997). During the time ofthe subsequent rotation stimuli, subjects were asked to relax the neckmuscle and to neither assist nor resist the rotation. Rest periods ofseveral minutes were given after 3–4 trials with the room lights on. Indarkness, the experiments were continuously checked through aninfrared video camera.
Data acquisition and analysis
Position readings of the chair and head holder potentiometers (indeg), of the torque applied to the head holder (in Nm), and of thestimulus trigger signals were sampled at 200 Hz and stored in acomputer for off-line analysis. The torque 5 s prior to stimulus onsetwas averaged and taken as baseline. It was close to 0 Nm inapproximately all subjects, meaning that they exerted no considerableforce on the bite board at rest. In grand average torques curves, aninitial response (‘phase I’) to the trunk-only and head-only rotationsstood out clearly (Fig. 2; individual examples in Fig. 1). In normals, itwas followed by an abrupt trend change in that the torque decreasedor leveled off (see Figs. 2 and 4; ‘phase II’).
Occurrence of a trend change in slope at a certain instant tpafter stimulus onset was tested by means of a linear regressionmodel
Y = b0 + b1 � t + b2 � D + b3 � t � D + e; ð1Þ
where Y=[Yi]1≤ i≤n is the torque development vector defined on thetime vector t=[ti]1≤ i≤n, ɛ=[ɛi]i=1,…, n is a vector of Gaussian randomerrors of zero mean and fixed (unknown) variance and thepseudovariable D equals one and zero when t≤ tp and tN tprespectively. n denotes total vector length. A t-test is applied for theb3 coefficient of the above regression model and if b3≠0 a slopechange at tp has to be considered, since two linear models ofsignificant different slopes b1+b3 for t≤ tp and b3 for tN tp arepredicted; Eq. (1) yields Y ðD = 1Þ
t V tp = b0 + b2ð Þ + b1 + b3ð Þ � t andYðD = 0ÞtNtp = b0 + b1 � t.The slopes of the phase I and phase II were approximated by
straight line fits in order to obtain torque measures and the time ofslope change with respect to stimulus onset (referred to as ‘durationof phase I’) for statistical purposes. The same procedurewas applied tothe responses of the patients where the torque responses were morevariable and the slopes change showed, inmost cases, only a reductionrather than a reversal.
Statistics
Torque responses were analyzed by repeated measures ANOVA,unless otherwise stated, with stimulus peak velocity (2.3, 4.6, and18.4°/s) and stimulus condition (trunk-only rotation, head-onlyrotation) as within-subject repeated measures factors and group asthe between groups factor (patients vs. normal subjects). Theresponses to head+trunk rotation were not included for simplicity,since this rotation evoked a qualitatively different response upon the18.4°/s stimulus and did not evoke considerable responses upon the2.3°/s and 4.6°/s stimuli (cf. Fig. 2). Responses to leftward andrightward stimuli were pooled, as no consistent trend of torqueasymmetry was detected in patients and controls.
Modeling
The model simulations were performed using MATLAB/SIMULINK(TheMathWorks Inc., Natick, MA, USA). This programwas also used tomake torque response curve fits to the experimentally determinedtorque responses. These curve fits were based on a theoretical model
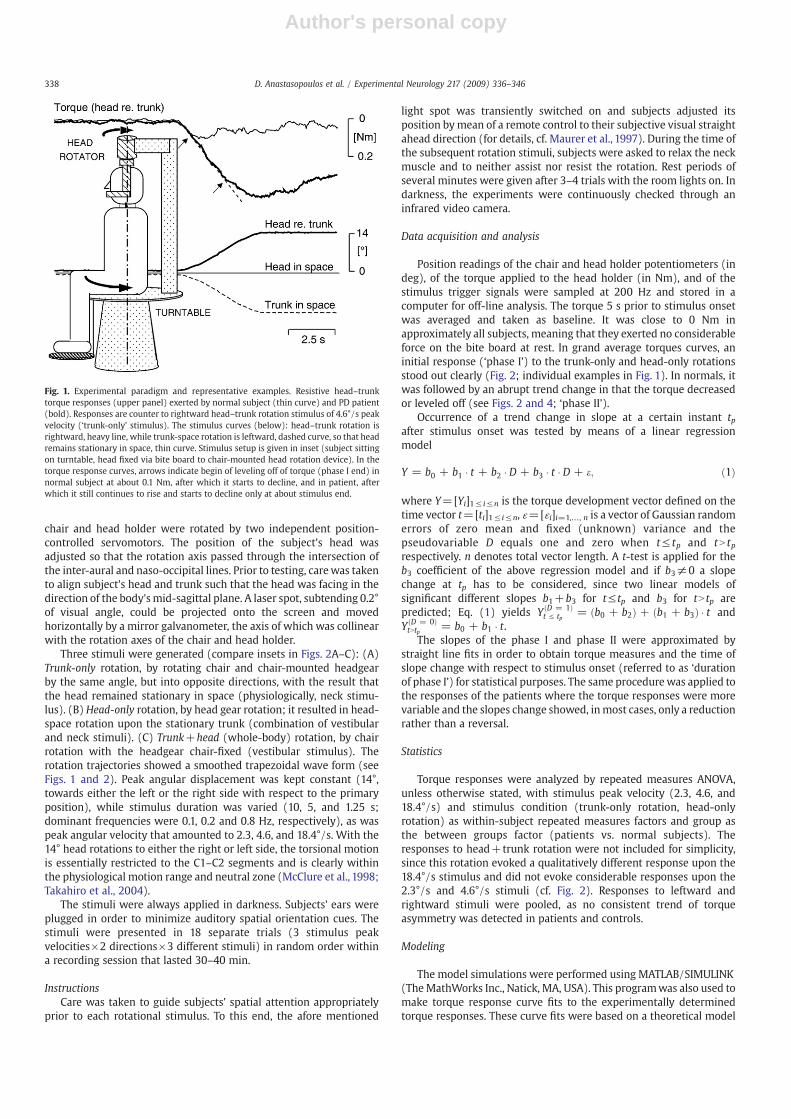
Fig. 1. Experimental paradigm and representative examples. Resistive head–trunktorque responses (upper panel) exerted by normal subject (thin curve) and PD patient(bold). Responses are counter to rightward head–trunk rotation stimulus of 4.6°/s peakvelocity (‘trunk-only’ stimulus). The stimulus curves (below): head–trunk rotation isrightward, heavy line, while trunk-space rotation is leftward, dashed curve, so that headremains stationary in space, thin curve. Stimulus setup is given in inset (subject sittingon turntable, head fixed via bite board to chair-mounted head rotation device). In thetorque response curves, arrows indicate begin of leveling off of torque (phase I end) innormal subject at about 0.1 Nm, after which it starts to decline, and in patient, afterwhich it still continues to rise and starts to decline only at about stimulus end.
338 D. Anastasopoulos et al. / Experimental Neurology 217 (2009) 336–346

Author's personal copy
of a voluntary head control system (see Discussion) and were used toderive estimates of model parameters. The curve fits were made usinga constrained nonlinear optimization algorithm (‘fmincon’ from theMatlab Optimization Toolbox) that adjusted model parameters tominimize the weighted error value given by
E =XT
t=1jM tð Þ− H tð ÞM tð Þ + H tð Þj ð2Þ
where M(t) and H(t) represent the values of the model andexperimental torque responses, respectively, at the time instant t.
The error magnitude at each instant was summed across the 3stimulus peak velocities (2.3, 4.6, and 18.4°/s) and the two stimuliused for the fitting (trunk-only and head-only rotations). Extensivesimulations were performed to validate the data analysis andparameter estimation procedures. Simultaneous curve fits weremade to all average torque response curves, separately for the twosubject groups. To limit the number of unconstrained fit parameters,we made the assumption that passive stiffness and damping amountto 10% of active stiffness and damping (compare Maurer et al., 2006).The curve fits described in Discussion reliably converged to singlesolutions.
Fig. 2. Average torque response data. Mean responses of PD patients (bold curves) and of normal controls over time (thin). Leftward and rightward data are lumped together. Greyareas give ±1SD ranges of normals and dashed curves +1SD ranges of patients. Rows: Stimulus trunk-only (A), head-only (B), and head+trunk (C; insets, subject from above).Columns: Peak velocities (a, 2.3°/s; b, 4.6°/s; c, 18.4°/s). Negative sign of torques indicates that they are resistive. HS, TS, HT: head-space, trunk-space, and head–trunk rotation (seeFig. 1). Inset in panel Aa shows correlation between PD patients' peak torques and values of UPDRS rigidity score (r, correlation coefficient; see also text).
339D. Anastasopoulos et al. / Experimental Neurology 217 (2009) 336–346

Author's personal copy
Results
Fig. 1 illustrates the experimental paradigm and gives representa-tive examples of the resistive torque exerted by a normal subject (thincurve) and a PD patient (bold) in response to the trunk-only rotationwith peak velocity of 4.6°/s (5s duration stimulus). Here, the trunk-space rotation is to the left (downward), while the head-trunkrotation is to the right, so that the head remains stationary in space.Resistive leftward torque is presented as deflection downward,meaning that torque was directed counter to the head-trunkexcursion. The response starts with a steep slope (phase I; seeMethods). Approximately 700ms later, the torque curve of the normalsubject levels off and starts to decline (phase II). The response of thepatient also shows an initial sharp rise, with a similar slope to that ofthe normal subjects, but it continues to rise almost till the end of therotation, before it starts to decline.
The grand average data obtained for the three stimulus combina-tions and the three peak stimulus velocities are given in analogousform in Figs. 2A–C, superimposing the mean torque responses of thePD patients (bold curves; dashed lines, patients' 1SD ranges) on thoseof the normal controls (thin; grey shaded areas, normals' ±1SDranges).
Normal subjects
Trunk-only rotationThe averaged torque response to the 4.6°/s trunk-only stimulus in
Fig. 2Ab essentially resembles the above described representativeexample of the normal subject in Fig. 1. Qualitative similar responseswere obtained with the 2.3°/s and 18.4°/s stimuli with the followingexceptions. With increasing stimulus speed (decreasing duration,from10 s and 5 s to 1.25 s) the initial torque slope increased essentiallylinearly (0.09±0.05, 0.22±0.12, to 0.86±0.32 Nm/s, respectively;Fig. 3A), while the duration of phase I decreased correspondingly (Fig.3B). The corresponding mean peak torque values, attained at variabletime intervals after stimulus onset for each subject (and therefore notstanding out in average curves), amounted to 0.24±0.24, 0.20.±0.18,and 0.39±0.18 Nm, respectively. Thereafter, the torque decreasedtowards baseline, first sharply and then more gradually, approxi-mately reaching the baseline within the following 20 s.
The data are re-plotted in Fig. 4A in terms of so-called tension-length diagrams (here torque–angle diagrams) with an indication ofthe torque at phase I end (mean and +1SD of normals and patients,large and small vertical dashed lines and circles, respectively). In thesediagrams, the slopes give a measure of stiffness (Nm/°). Note thatphase I is characterized by high stiffness and that the phase I stiffnessslopes are similar across all three stimulus speeds. Thereafter, thecurves level off, first more abruptly and then gradually, indicating thatstiffness is increasingly replaced by compliance. This applies similarlywith the three different peak velocity stimuli. Note, however, that theleveling off was clearly less pronounced and that the average torquemagnitude reached was considerably higher with the 18.4°/s stimulusthan with the 2.3°/s and 4.6°/s stimuli.
Head-only rotationThe results were very similar to those obtained upon the trunk-
only stimuli. This applied to the average responses (Fig. 2B, a–c)and the initial slopes of torque increase over time (Fig. 3A) as wellas to phase I duration (not shown). Peak torque values weresomewhat lower with head-only rotation, however, as can be seenfrom the torque–angle curves in Fig. 4B. The mean valuesamounted to 0.13±0.13, 0.13±0.10, and 0.35±0.17 Nm upon the2.3, 4.6, and 18.4°/s stimuli, respectively. The peak values wereattained earlier during the course of stimulus application with thehead-only than the trunk-only rotation, especially with the 18.4°/sstimulus, after which torque magnitude decreased before peak
displacement was reached. Thus, normals followed the “relax theneck” instruction more successfully with the head-only than thetrunk-only stimulus.
Head+trunk rotationUpon the en-block head and trunk rotations, no considerable
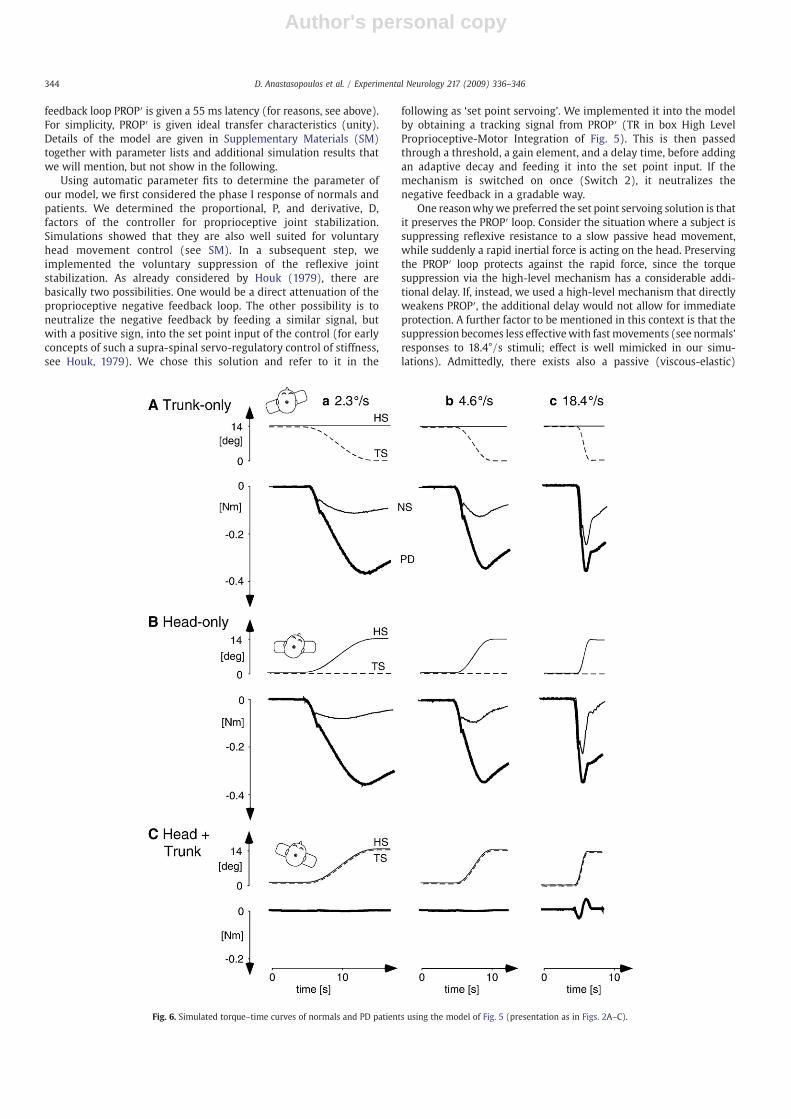
torque responses were obtained for the 2.3°/s and 4.6°/s stimuli. Incontrast, the 18.4°/s stimulus evoked a transient biphasic response(Fig. 2C) that we could attribute essentially to head inertia (seeDiscussion and Fig. 6C).
PD patients
Trunk-only rotationAs shown above for the representative patient (Fig. 1), the initial
rise in torque was normal in the patients (Fig. 2A, a–c). Thecorresponding torque velocity values obtained for the 2.3°/s, 4.6°/s,and 18.4°/s stimuli amounted to 0.08±0.06, 0.26±0.66, and 0.88±0.52 Nm/s, respectively (Fig. 3A). But leveling off started later than innormals and a shallow rise of torque continued essentially until theend of the stimuli (see Fig. 2A, a–c). Averaging the individual peaktorque values with the 2.3, 4.6, and 18.4°/s stimuli yielded values of0.5±0.18, 0.47±0.46, and 0.52±0.41 Nm, respectively. Note thatthese values are similar across the three stimuli. After the peak, thetorque decreased, first sharply and then more gradually, staying wellabove baseline during the following 20 s, unlike in normal subjects.
In the torque–angle re-plots of the data (Fig. 4A), the initialstiffness essentially coincide with those of normals, similarly for the2.3, 4.6, and 18.4°/s (i.e. 10, 5, and 1.25 s duration) stimuli. Thesignificant decrease in slope, taken as change from phase I to phase II,
Fig. 3. Characteristics of phase I response. Dependency of torque velocity (A) andduration (B) on stimulus peak velocity, separately for normal controls and patients andthe three peak stimulus velocities used (both panels) and for trunk-only and head-onlyrotations (A only). Vertical bars give 1SD.
340 D. Anastasopoulos et al. / Experimental Neurology 217 (2009) 336–346

Author's personal copy
occurs later than in normals (Fig. 3B; duration values of phase I arelumped together across the trunk-only and head-only stimuli in bothnormals and patients, as the effect of the factor condition wasinsignificant; cf. below, statistics). In the torque–angle presentationsshown in Fig. 4A, the following decrease in slope stands out moreclearly than in the torque–time presentations (Fig. 2A). It demon-strates that also patients, tried to follow the instruction to relax theneck muscle, but did so less effectively than normal subjects.Inspection of the individual responses revealed that also in patientsthe change in slope tended to occur abruptly, but its timing showedconsiderable variation.
Head-only rotationThe responses to the head-only rotations resembled those of the
trunk-only rotations. A slight difference was that the mean across theindividual peak torque values declined somewhat with increasingstimulus peak velocity (0.57±0.65, 0.45±0.50, and 0.38±0.23 Nmupon the 2.3, 4.6, and 18.4°/s stimulus, respectively, Fig. 2B). And, theleveling off upon the 18.4°/s stimulus was earlier and stronger thanwith trunk-only rotation (Fig. 4Bc).
Note furthermore that upon both the head-only and trunk-onlyrotations, the leveling off during the 18.4°/s stimulus was moreeffective than during the slower stimuli. This was different fromnormals' responses where it was less effective during the fasteststimulus. As a consequence, the difference in peak torque betweennormals and patients was smallest with the fastest stimulus.
Head+trunk rotationThe rotation evoked a biphasic response upon the 18.4°/s
stimulus, which closely resembled that of the normal subjects. No
considerable response was obtained upon the 2.3 and 4.6°/s stimuliin patients either.
StatisticsIt was performed using a 3×2×2 repeated measures ANOVA, with
stimulus peak velocity and condition, i.e. trunk-only and head-onlyrotation, as within-subject repeatedmeasures factors and group as thebetween groups factor: Initial torque slope in patients was statisticallynot different from that in controls (F=0.09, p=0.77). Stimulus peakvelocity proved highly significant (F=174.5, pb0.0001), reflecting thefact that the initial slope increased with increasing peak velocity. Also,there was a significant interaction of the factors peak velocity×condi-tion (F=10.8, p=0.0001), which reflects the fact that the rate oftorque increase with the 18.4°/s head-only rotation was higher thanwith trunk-only rotation. Slopes upon the 2.3°/s and 4.6°/s stimuliwere not different between the two conditions (Fig. 3A).
Phase I duration. The time until the initial slope started to level offamounted to 0.76±0.66 s in normals (average across the threestimulus velocities and the head-only and trunk-only conditions)and was significantly longer and more variable in patients (1.49±1.50 s). Stimulus peak velocity proved to be a statistically significantfactor (F=83.1, pb0.0001; reflecting the fact that phase I durationdecreased with increasing stimulus peak velocity; Fig. 3B). Both theinteractions stimulus peak velocity×group and stimulus condi-tion×group proved to be significant as well (F=15.7, p=0.0001and F=8.7, p=0.006, respectively). Thus, phase I duration wasmore prolonged in the patient group when (i) stimulus speed waslow (Fig. 3B) and (ii) head-only was compared with trunk-onlystimulation.
Fig. 4. Torque–angle diagrams (re-plots of torque–time plots in Figs. 2A, B). Data of normals, thin curves, and PD patients, bold. Curve slopes reflect stiffness (oblique dashedcomparison lines, –0.1 Nm/°). Initial slopes are similar in normals and patients with the trunk-only (A) and head-only (B) stimuli and the three peak velocities used (a–c).Vertical long and short dashed lines, normal subjects' mean values and +SD of end of phase I, respectively (i.e., of initial torque responses). Corresponding data of PD patients,big and small open circles.
341D. Anastasopoulos et al. / Experimental Neurology 217 (2009) 336–346

Author's personal copy
Peak torque. This value was significantly higher in patients than incontrols (F=19.8, p=0.0001). There was a significant interactionwith stimulus velocity. Testing with post hoc Scheffé showed asignificant difference for the 2.3°/s stimulus (p=0.0008) and the4.6°/s stimulus (p=0.0002), whereas the peak torque values uponthe 18.4°/s stimulus were not significantly different. As shown in theinset of Fig. 2Aa, patients' peak torque correlated with the UPDRSrigidity score (Table 1). This applied to the stimuli with 2.3°/s and4.6°/s (p=0.045) and not with the 18.4°/s stimuli (p=0.28).
Discussion
Passive head rotation in our subjects led to an initial steep rise inresistive neck torque, similarly in normals and PD patients. The risewas followed by a pronounced attenuation in normal subjects, whichwas clearly less so in the patients. These observations suggested to usthat the responses may stem from reflexive head stabilization, whichnormals are able to suppress, whereas the patients show difficulties indoing so. These findings are compatible with the hypothesis putforward byMink and Thach (1991),which suggests that suppression ofpostural reactions is a main basal ganglia function (see Introduction).
In the following, we first compare our findings to previous ones inthe literature. Then, we address our hypothesis using an engineeringapproach. We present a dynamic model of reflexive head stabilizationand add to it a mechanism that allows for voluntarily suppression ofreflexive neck stabilization. The experimental findings are then usedfor parameter fitting to themodel, which allows us tomake inferenceson the cause of PD rigidity. Finally, we test whether the modeldescribes and predicts present, as well as, previous findings.
Comparison with earlier torque measurements in PD
Phase I (initial transient) torque responseComparable previous studies on PD rigidity addressed mainly
steady state responses during periodic stimulation and paid little, ifany attention to the initial transient torque response. The transientresponse can be found, however, in previous studies of axial rigidity(normals: Gurfinkel et al., 2006, see their Fig. 2; normals and PDpatients:Wright et al., 2007, their Figs. 2B, D; alsoMak et al., 2007) andlimb rigidity (e.g. Xia and Rymer, 2004). Gurfinkel et al. (2006; normalsubjects) briefly addressed the initial transient response, attributing itto a passive muscular resistance that is found in contracting musclesupon rapid stretch (‘short-range stiffness’, Rack and Westbury, 1974).Neither rapid stretch nor considerable background muscles contrac-tion were given in our experiments, however. We therefore assumethat this short-range stiffness played no considerable role in ourexperiments. Instead, we attribute it foremost to reflexive stiffness.
In phase I, torque velocity essentially followed stimulus velocity(Fig. 3A). A particular finding in normals was that torque velocity withthe 18.4°/s stimulus was higher during head-only than during trunk-only rotation. This can be explained mainly by a head inertia effectstemming from head rotation (Fig. 2C). This notion was confirmed byour simulations (compare Fig. 6C). A minor contribution from thevestibulo-collic reflex cannot be excluded, though. The torque–angleplots shed a different light on the data. They show that the stiffnessslopes of phase I are similar across all trunk-only and head-onlyresponses, amounting to approximately −0.1 Nm/° (see obliquecomparison lines in Figs. 4A, B). Only with the 18.4°/s stimuli was theinitial stiffness slightly higher.
Whereas torque velocity and stiffness of phase I were similaracross subject groups, the parameters related to its end differed. Aqualitative feature common to both groups was that the higher peakvelocity of the stimuli was, the earlier phase I ended. Quantitatively,the duration values in normals were shorter than in patients, and theirvariability was smaller (Fig. 3B). As a consequence of the durationeffects, the torquemagnitude reached at the end of phase I was largest
with the fastest stimulus, again qualitatively similar and quantitativelydifferent in both groups (Figs. 4A, B). Interestingly, the parameter fitprocedure in our simulations (see below) suggested that phase I end isrelated to both, a time consuming process (delay time) and anamplitude dependent process (magnitude threshold and gain) of thepresumed suppression mechanism, with clear differences in theparameters between the two subject groups.
The present data did not allow us to directly measure the onsetlatency of the phase I response because our stimuli showed a gradualrise, as did the torque responses. We therefore refer to data from astudy that applied amore appropriate method (abrupt stimulus onset,EMG measurements). The work of Ito et al. (1995) distinguishesbetween subjects with functioning vestibular system and vestibularloss, observing EMG onset latencies of ≈20 ms and ≈55 ms afterabrupt head drops, respectively. In our study, vestibular headstabilization can largely be neglected, since vestibular stimulationduring head+trunk rotation yielded no responses upon the 2.3°/sand 4.6°/s stimuli and only a transient response upon the 18.4°/sstimulus. The latter could be explained by head inertia (see above).We therefore assume that the torque responses stemmedmainly froma proprioceptive loop and that this has a delay of 55 ms (this loop wasused in our simulations, see below).
A latency of 55 ms is considerably longer than the 20 ms onsetlatency of the short-latency reflexes known for passive armmovements(see Introduction).We therefore consider the 55ms response amediumto long-latency reflex. The absence of a short-latency neck response canpossibly be related to previous findings of a relatively weak directexcitatoryconnection ofmuscle spindles to neckmotoneurons in the cat(AbrahamsandRichmond,1988;RichmondandLoeb,1992).At any rate,since the phase I end of our subjects' torque responses occurred clearlylater than 55 ms, we feel rather safe in assuming that the torquesuppression involves supra-spinal mechanisms.
Phase II torque responseThe most outstanding difference between normal controls and PD
patients concerned the ability to level off further rise in torque afterphase I. This led us to suggest that PD rigidity results from insufficientsuppression of the reactive resistive torque that is evoked uponpassivejoint rotation. In the following, we focus on the per-rotatory part ofphase II (response till rotation end, i.e. until final stimulus positionwasreached). The subsequent slow post-rotatory torque decay will beconsidered in the modeling part (‘adaptation time constant’).
If we consider, by comparison, previous studies, the leveling offcorresponds to a ‘flattening’ of the torque–time or torque–anglecurves after the stimulus onset transient (to be distinguished fromtransients occurring at the turning points during periodic stimuli withtriangular waveform, for instance). The leveling off can be seen inqualitatively similar manner in figures of the afore mentioned studies,despite differences in the joint tested as well as in stimulus wave formand velocity (axial: Wright et al., 2007; 1°/s periodic triangularhorizontal rotations; Mak et al., 2007, 60–105°/s hip flexions andextensions; limb: Xia and Rymer, 2004; 50°/s triangular periodic wristflexions–extensions). In our stiffness data, the leveling off can best beappreciated by the deviations of the torque slopes from the 0.1 Nm/°comparison lines in Figs. 4A, B. Interestingly, when increasing peakstimulus velocity from 2.3°/s and 4.6°/s to 18.4°/s, it became lesspronounced in normals and more pronounced in the patients. As aresult, the differences between the two subjects groups became lesswith the 18.4°/s stimulus. This suggests that fast stimuli are less suitedthan slow ones to distinguish PD rigidity from normal resistive torque.
Howare these opposite velocity effects in normals vs. patients withthe 18.4°/s stimulus to be accounted for? Considering first the effect innormals, their weaker leveling off with the high stimulus velocity canbe explained by a delay in the suppression mechanism, as suggestedby our simulations (distinct from the 55 ms proprioceptive loopdelay). The delay is even longer in patients. However, how is then the
342 D. Anastasopoulos et al. / Experimental Neurology 217 (2009) 336–346

Author's personal copy
slightly improved suppression in patients with the 18.4°/s stimulus tobe explained? We tend to explain it with a signal-to-noise effect.Assuming that the torque suppression involves a higher processinglevel, we expect that patients profited from the 18.4°/s stimulus in thatthis provides them with better sensory input than the slower stimuli(e.g. via the bite boards, through dental shear forces). An analogousassumption might explain why patients showed a more efficienttorque suppression with the head-only as compared to the trunk-only18.4°/s stimulus. The former, unlike the latter, adds a further stimulusmodality (vestibular; strongest with 18.4°/s stimulus, since thehorizontal canals provide a velocity signal). An additional point isthat the head-only stimulus is likely perceptually better identifiedthan the trunk-only stimulus, since one is more familiar with head ontrunk rotations than with trunk rotations under a stationary head.
How does our hypothesis of an impaired voluntary suppression ofreflexive muscle tone in PD relate to other proprioceptive impair-ments of these patients previously reported in the literature (seeIntroduction)?We like to speculate that there is a common underlyingproblem in the proprioceptive sensorimotor integration of PDpatients, caused by abnormally large internal noise and unwantedoscillations (compare Moran et al., 2008). Our own previous work onstance control in PD patients revealed an abnormal tendency for highfrequency/velocity body oscillations (Maurer et al., 2003). Using adynamic stance control model, parameter fitting suggested noise to bea relevant factor (Maurer et al., 2004). It remains to be seen whetherand to what extent the main findings in the present simulations (seebelow): changes in threshold, gain, and delay times, representprimary deficits or secondary attempts of patients to compensate forthe noise and oscillations (compare Janson et al., 2004).
Our hypothesis of rigidity resulting from insufficient voluntarycontrol of reflexive proprioceptive join stabilization would explain anumber of earlier observations. For instance, it would explain why PDpatients show reduced leg swinging during the pendulum leg test (LeCavorzin et al., 2003) and reduced head oscillations during pseudor-andom back-forth oscillations of the trunk (Gresty, 1989).
Previous literature gives a hint as to the suppression mechanismitself. Xia and Rymer (2004), investigating fast passive wrist exten-
sion–flexion cycles, related the “lead-pipe” character of PD rigidity toflattening in the torque–angle relation. They attributed the flatteningto so-called “shortening reactions” they observed in the EMG of thecorresponding muscles. Such shortening (as well as lengthening)reactions have originally been described in animal preparations andhumanswith brain damage (see Tatton et al.,1984, and Gurfinkel et al.,2006, for literature). They consist of an active muscle shortening thatcan be observed to occur upon, and along with passive shortening.According to Gurfinkel et al. (2006), however, they represent aphysiological mechanism. These authors investigated passive axialrotations in healthy normal subjects and found shortening reactions inabout half of them. In PD patients, the reactions appear not to beenhanced ormore frequent (Wright et al., 2007). Howare intermittentactive contractions during passive muscle shortenings to be inter-preted? We interpret them as evidence for a stiffness servo controlmechanism that levels off reflexive joint stabilization, i.e. for thepresumed voluntary torque suppression mechanism (details below).
We assume a supra-spinal loop for the suppression mechanism,since normal subjects are able to voluntarily titrate the resistivetorque upon passive movements (making it larger or smaller, or evenreverse it). And, in PD patients, it is a common clinical experience thatrigidity is related to the perceptual awareness of the passive jointstimulus. When one is testing a wrist joint, for instance, rigiditybecomes enhanced if one succeeds to shift the patient's perceptualawareness away from the tested hand. This may be achieved, forinstance, by having her or him perform a demanding finger-to-thumbtapping sequence with the other hand. In contrast, a simple tappingtask that can be performed automatically has no such effect. Weconceive that the perceptual awareness effect may also be responsiblefor the “activated rigor” phenomenon, where the patient is asked toactively contract the contra-lateral limb (Webster, 1960).
Model of voluntary control of reflexive joint stabilization
Our model of proprioceptive head stabilization is shown in Fig. 5.Unlike in previous head control models (see Introduction), avestibular feedback is omitted and the relevant proprioceptive
Fig. 5. Dynamic control model of reflexive proprioceptive head stabilization and its voluntary suppression (details in Supplementary Materials). The model contains twoproprioceptive negative feedback loops for head stabilization: PROP, autogenic short-latency spinal reflex (dashed; not relevant in neck; see text), PROP′: supra-spinal long-latencyreflex loop. Box Biom. (for biomechanics) contains passive viscous-elastic elements, considered to be relatively weak. Box High Level Proprioceptive-Motor Integration containsmechanism of voluntary suppression. When switched on (Switch 2), it derives a tracking signal from PROP′ (box TR) and adds it after some delay with positive sign to the Set PointSignal. This partially neutralizes the negative PROP′ feedback, leading to leveling off of resistive torque. In our experiments, Switch 1 was open: torque and head inertia effect,measured before switch, did not evoke head movements, because head was strongly fixed via bite board to head rotation device. Stimuli affecting loop are head-space and head–trunk rotations (obtained through turntable and head gear rotations).
343D. Anastasopoulos et al. / Experimental Neurology 217 (2009) 336–346
Author's personal copy
feedback loop PROP′ is given a 55 ms latency (for reasons, see above).For simplicity, PROP′ is given ideal transfer characteristics (unity).Details of the model are given in Supplementary Materials (SM)together with parameter lists and additional simulation results thatwe will mention, but not show in the following.
Using automatic parameter fits to determine the parameter ofour model, we first considered the phase I response of normals andpatients. We determined the proportional, P, and derivative, D,factors of the controller for proprioceptive joint stabilization.Simulations showed that they are also well suited for voluntaryhead movement control (see SM). In a subsequent step, weimplemented the voluntary suppression of the reflexive jointstabilization. As already considered by Houk (1979), there arebasically two possibilities. One would be a direct attenuation of theproprioceptive negative feedback loop. The other possibility is toneutralize the negative feedback by feeding a similar signal, butwith a positive sign, into the set point input of the control (for earlyconcepts of such a supra-spinal servo-regulatory control of stiffness,see Houk, 1979). We chose this solution and refer to it in the
following as ‘set point servoing’. We implemented it into the modelby obtaining a tracking signal from PROP′ (TR in box High LevelProprioceptive-Motor Integration of Fig. 5). This is then passedthrough a threshold, a gain element, and a delay time, before addingan adaptive decay and feeding it into the set point input. If themechanism is switched on once (Switch 2), it neutralizes thenegative feedback in a gradable way.
One reasonwhywe preferred the set point servoing solution is thatit preserves the PROP′ loop. Consider the situation where a subject issuppressing reflexive resistance to a slow passive head movement,while suddenly a rapid inertial force is acting on the head. Preservingthe PROP′ loop protects against the rapid force, since the torquesuppression via the high-level mechanism has a considerable addi-tional delay. If, instead, we used a high-level mechanism that directlyweakens PROP′, the additional delay would not allow for immediateprotection. A further factor to be mentioned in this context is that thesuppression becomes less effectivewith fastmovements (see normals'responses to 18.4°/s stimuli; effect is well mimicked in our simu-lations). Admittedly, there exists also a passive (viscous-elastic)
Fig. 6. Simulated torque–time curves of normals and PD patients using the model of Fig. 5 (presentation as in Figs. 2A–C).
344 D. Anastasopoulos et al. / Experimental Neurology 217 (2009) 336–346

Author's personal copy
resistance frommuscle and joint elements (box Biom. in Fig. 5), butweconsider it to be relatively weak (compare Maurer et al., 2006).
Applying the parameter fitting to the elements of the servoingmechanism in themodel, we considered all torque responses obtainedwith the trunk-only and head-only rotations, comparing patients withnormals. Patients showed higher gain, G=0.93 vs. G=0.70, slightlyhigher position threshold, T=0.7° vs. T=0.6°, and prolonged delaytime, Δt=161 ms vs. Δt=103 ms. The mean square fitting erroracross all responses indicated a good correspondence betweensimulated and experimental data for patients and normal subjects(0.012 and 0.011, respectively; a value of zero/unity error refers tozero/unity gain when expressing the difference between experimen-tal and simulated responses in terms of gain). The simulated torque–time curves are shown in Figs. 6A–C. They closely resemble theexperimental ones (Figs. 2A–C).
Conclusion
We take the experimental and model findings as support for ourhypothesis that PD rigidity represents incomplete suppression ofproprioceptive head stabilization. We relate the impairment in thepatients mainly to an increased delay time, enlarged threshold, andreduced gain of the set point servoing signal that they use for thesuppression.
Acknowledgments
DFG Ma 2543/3-1; Me 715/5-3; ELKE, University of Athens.
Appendix A. Supplementary data
Supplementary data associated with this article can be found, inthe online version, at doi:10.1016/j.expneurol.2009.03.010.
References
Abrahams, V.C., Richmond, F.J.R., 1988. Specialization of sensorimotor organization inthe neck muscle system. Prog. Brain Res. 76, 125–135.
Adamovich, S.V., Berkinblit, M.B., Hening, W., Sage, J., Poizner, H., 2001. The interactionof visual and proprioceptive inputs in pointing to actual and remembered targets inParkinson's disease. Neuroscience 104, 1027–1041.
Berardelli, A., Sabra, A.F., Hallett, M., 1983. Physiological mechanisms of rigidity inParkinson's disease. J. Neurol. Neurosurg. Psychiatry 46, 45–53.
Bloem, B.R., Grimbergen, Y.A.M., Cramer, M., Willemsen, M., Zwinderman, A.H., 2001.Prospective assessment of falls in Parkinson's disease. J. Neurol. 248, 950–958.
Brown, R.G., Marsden, C.D., 1988. An investigation of the phenomenon of “set” inParkinson's disease. Mov. Disord. 5, 178–179.
Burne, J.A., Lippold, O.C.J., 1996. Loss of tendon organ inhibition in Parkinson's disease.Brain 119, 1115–1121.
Burke, D., Hagbarth, K.-E., Wallin, B.G.,1977. Reflexmechanisms in Parkinsonian rigidity.Scand. J. Rehab. Med. 9, 15–23.
Cody, F.W., MacDermott, N., Matthews, P.B., Richardson, H.C., 1986. Observations on thegenesis of the stretch reflex in Parkinson's disease. Brain 109, 229–249.
Cools, R., Barker, R.A., Sahakian, B.J., Robbins, T.W., 2001. Enhanced or impairedcognitive function in Parkinson's disease as a function of dopaminergic medicationand task demands. Cereb. Cortex 11, 1136–1143.
Delwaide, P.J., 2001. Parkinsonian rigidity. Funct. Neurol. 16, 147–156.Delwaide, P.J., Pepin, J.L., Maertens de Noordhout, A., 1991. Short-latency autogenic
inhibition in patients with parkinsonian rigidity. Ann. Neurol. 30, 83–89.Diener, C., Scholz, E., Guschlbauer, B., Dichgans, J., 1987. Increased shortening reaction in
Parkinson's disease reflects a difficulty in modulating long loop reflexes. Mov.Disord. 2, 31–36.
Diener, H.C., Dichgans, J., Guschlbauer, B., Bacher, M., Langenbach, P., 1989. Disturbancesof motor preparation in basal ganglia and cerebellar disorders. Progr. Brain Res. 80,481–488.
Dietz, V., Quintern, J., Berger, W., 1981. Electrophysiological studies of gait in spasticityand rigidity. Evidence that altered mechanical properties of muscle contribute tohypertonia. Brain 104, 431–449.
Fimm, B., Bartl, G., Zimmermann, P., Wallesch, C.W., 1994. Different mechanismsunderly shifting set on external and internal cues in Parkinson's disease. Brain Cogn.25, 287–304.
Foerster, O., 1921. Zur Analyse und Pathophysiologie der striären Bewegungsstörungen.Z. Gesamte Neurol. Psychiatr. 73, 1–169.
Goldberg, J., Peterson, B.W., 1986. Reflex and mechanical contributions to headstabilization in alert cats. J. Neurophysiol. 56, 857–875.
Gresty, M., 1989. Stability of the head in pitch (neck flexion–extension): studies innormal subjects and patients with axial rigidity. Mov. Disord. 4, 233–248.
Gurfinkel, V., Cacciatrore, T.W., Cordo, P., Horak, F., Nutt, J., Skoss, R., 2006. Posturalmuscle tone in the body axis of healthy humans. J. Neurophysiol. 96, 2678–2687.
Hallett, M., 2003. Parkinson revisited: pathophysiology of motor signs. Adv. Neurol. 91,19–28.
Houk, J.C., 1979. Regulation of stiffness by skeletomotor reflexes. Ann. Rev. Physiol. 41,99–114.
Ito, Y., Corna, S., von Brevern, M., Bronstein, A., Rothwell, J., Gresty, M., 1995. Neckmuscle responses to abrupt free fall of the head: comparison of normal withlabyrinthine-defective human subjects. J. Physiol. 489, 911–916.
Jacobs, J.V., Horak, F.B., 2006. Abnormal proprioceptive-motor integration contributes tohypomentric postural responses of subjects with Parkinson's disease. Neuroscience141, 999–1009.
Janson, N.B., Balanov, A.G., Schöll, E., 2004. Delayed feedback as a means of control ofnoise-induced motion. Phys. Rev. Lett. 93 010601 (Electronic publication).
Keshner, F.A., Peterson, B.W., 1995. Mechanisms controlling human head stabilization. I.Head–neckdynamicsduring randomrotations in thehorizontal plane. J.Neurophysiol.73 (6), 2293–2301.
Keshner, E.A., Hain, T.C., Chen, K.J., 1999. Predicting control mechanisms for human headstabilization by altering the passive mechanics. J. Vestib. Res. 9, 423–434.
Kimmig, H., Haussmann, K., Mergner, T., Lucking, C.H., 2002. What is pathological withgaze shift fragmentation in Parkinson's disease? J. Neurol. 249, 683–692.
Klockgether, T., Dichgans, J., 1994. Visual control of arm movement in Parkinson'sdisease. Mov. Disord. 9, 48–56.
Klockgether, T., Borutta, M., Rapp, H., Spieker, S., Dichgans, J., 1995. A defect ofkinesthesia in Parkinson's disease. Mov. Disord. 10, 460–465.
Kroonenberg, P.M., Oort, F.J., Stebbins, G.T., Leurgans, S.E., Cubo, E., Goetz, C.G., 2006.Motor function in Parkinson's disease and supranuclear palsy: simultaneousfactor analysis of a clinical scale in several populations. BMC Med. Res. Methodol.6, 26.
Kumar, S., 2004. Ergonomics and biology of spinal rotation. Ergonomics 47, 370–415.Kurtzer, I.L., Pruszynski, J.A., Scott, S.H., 2008. Long-latency reflexes of the human arm
reflect an internal model of limb dynamics. Curr. Biol. 18, 449–453.Le Cavorzin, P., Carrault, G., Chagneau, F., Rochcongar, P., Allain, H., 2003. A computer
model of rigidity and relatedmotor dysfunction in Parkinson's disease. Mov. Disord.18, 1257–1265.
Lee, R.G., 1989. Pathophysiology of rigidity and akinesia in Parkinson's disease. Eur.Neurol. 29 (Suppl. 1), 13–18.
Lee, H.M., Huang, Y.Z., Chen, J.J., Hwang, I.S., 2002. Quantitative analysis of the velocityrelated pathophysiology of spasticity and rigidity in the elbow flexors. J. Neurol.Neurosurg. Psychiatry 72, 621–629.
Levin, J., Krafczyk, S., Valkovic, P., Eggert, T., Claassen, J., Bötzel, K., 2009. Objectivemeasurement of muscle rigidity in parkinsonian patients treated with subthalamicstimulation. Mov. Disord. 24, 57–63.
Mak, M.K., Wong, E.C., Hui-Chan, C.W., 2007. Quantitative measurement of trunkrigidity in parkinsonian patients. J. Neurol. 254, 202–209.
Marsden, C.D., Rothwell, J.C., Day, B.L., 1983. Long-latency automatic responses tomuscle stretch in man: origin and function. Adv. Neurol. 39, 509–539.
Maschke, M., Gomez, C.M., Tuite, P.J., Konczak, J., 2003. Dysfunction of the basal ganglia,but not the cerebellum, impairs kinaesthesia. Brain 126, 2312–2322.
Maurer, C., Kimmig, H., Trefzer, A., Mergner, T., 1997. Visual object localization throughvestibular and neck inputs. I. Localization with respect to space and relative to thehead and trunk mid-sagittal planes. J. Vest. Res. 7, 119–135.
Maurer, C., Mergner, T., Xie, J., Faist, M., Pollak, P., Lücking, C.H., 2003. Effect of chronicbilateral subthalamic nucleus (STN) stimulation on postural control in Parkinson'sdisease. Brain 126, 1146–1163.
Maurer, C., Mergner, T., Peterka, R.J., 2004. Abnormal resonance behavior of the posturalcontrol loop in Parkinson's disease. Exp. Brain Res. 157, 369–376.
Maurer, C., Mergner, T., Peterka, R.J., 2006. Multisensory control of human uprightstance. Exp. Brain Res. 171, 231–250.
McClure, P., Siegler, S., Nobilini, R., 1998. Three dimensional flexibility characteristics ofthe human cervical spine in vivo. Spine 23, 216–223.
Meara, R.J., Cody, F.W., 1992. Relationship between electromyographic activity andclinically assessed rigidity studied at the wrist joint in Parkinson's disease. Brain115, 1167–1180.
Mink, J.W.,1996. The basal ganglia: focused selection and inhibition of competingmotorprograms. Prog. Neurobiol. 50, 381–425.
Mink, J.W., Thach,W.T.,1991. Basal gangliamotor control, Parts 1, 2, and 3. J. Neurophysiol.65, 273–351.
Moran, A., Bergman, H., Israel, Z., Bar-Gad, I., 2008. Subthalamic nucleus functionalorganization revealed by parkinsonian neuronal oscillations and synchrony. Brain131, 3395–3409.
Outerbridge, J.S., Melvill-Jones, G., 1971. Reflex vestibular control of head movement inman. Aerosp. Med. 42, 935–950.
Peng, G.C.Y., Hain, T.C., 1996. A dynamical model for reflex activated head movements inthe horizontal plane. Biol. Cybern. 75, 309–319.
Prochazka, A., Bennett, D.J., Stephens, M.J., Patric, S.K., Sears-Duru, R., Roberts, T.,Jhamandas, J.H., 1997. Measurement of rigidity in Parkinson's disease. Mov. Disord.12, 24–32.
Rack, P.M.H., Westbury, D.R., 1974. The short range stiffness of active mammalianmuscle and its effect on mechanical properties. J. Physiol. 240, 331–350.
Rea, G.L., Ebner, T.J., 1991. Quantitative assessment of the effect of basal ganglia lesionson the stretch reflex in primates. Stereotact. Funct. Neurosurg. 56, 44–65.
Richmond, F.J., Loeb, G.E., 1992. Electromyographic studies of neck muscles in the intactcat. 2. Reflexes evoked by muscle nerve stimulation. Exp. Brain Res. 88, 59–66.
345D. Anastasopoulos et al. / Experimental Neurology 217 (2009) 336–346

Author's personal copy
Rocchi, L., Chiari, L., Horak, F.B., 2002. Effects of deep brain stimulation and levodopa onpostural sway in Parkinson's disease. J. Neurol. Neurosurg. Psychiatry 73, 267–274.
Rothwell, J.C., Obeso, J.A., Traub, M.M., Marsden, C.D., 1983. The behaviour of long-latency stretch reflex in patients with Parkinson's disease. J. Neurol. Neurosurg.Psychiatry 46, 35–44.
Schor, R.H., Kearney, R.E., Dieringer, N., 1988. Reflex stabilization of the head. In:Peterson, B.W., Richmond, F.J. (Eds.), Control of Head Movement. Oxford UniversityPress, New York, Oxford, pp. 141–166.
Shapiro, M.B., Vaillancourt, D.E., Sturman, M.M., Verhagen Metman, L., Bakay, R.A.E.,Corcos, D.M., 2007. Effects of STN DBS on rigidity in Parkinson's disease. IEEE Trans.Neural. Syst. Rehabil. Eng. 15, 173–181.
Takahiro, K., Mukai, Y., Hosono, N., Sakaura, H., Nakajiama, Y., Sato, Y., Sugamoto, K.,Yoshikawa, H., 2004. Kinematics of the upper cervical spine in rotation. Spine 29,E139–144.
Tangorra, J.L., Lynette, A.J., Hunter, I.W., 2003. Dynamics of the human head–necksystem in the horizontal plane: joint properties with respect to a static torque. Ann.Biomed. Eng. 31, 606–620.
Tatton, W.G., Lee, R.G., 1975. Evidence of abnormal long-loop reflexes in rigidParkinsonian patients. Brain Res. 100, 671–676.
Tatton, W.G., Bedingham, W., Verrier, M.C., Blair, R.D., 1984. Characteristic alterations in
responses to imposed wrist displacements in parkinsonian rigidity and dystoniamusculorum deformans. Can. J. Neurol. Sci. 11, 281–287.
Teräväinen, H., Tsui, J.K.C., Mak, E., Calne, D.B., 1989. Optimal indices for testingparkinsonian rigidity. Can. J. Neurol. Sci. 16, 180–183.
Watts, R.L., Wiegner, A.W., Young, R.R., 1986. Elastic properties of muscle measured atthe elbow in man: II. Patients with parkinsonian rigidity. J. Neurol. Neurosurg.Psychiatry 49, 1177–1181.
Webster, D.D., 1960. Dynamic measurement of rigidity, strength, and tremor inParkinson patients before and after destruction of mesial globus pallidus.Neurology 10, 157–163.
Werheid, K., Koch, I., Reichert, K., Brass, M., 2007. Impaired self-initiated taskpreparation during task switching in Parkinson's disease. Neuropsychologia 45,273–281.
Wright, W.G., Gurfinkel, V.S., Nutt, J., Horak, F., Cordo, P.J., 2007. Axial hypertonicity inParkinson's disease: directmeasurements of trunk and hip torque. Exp. Neurol. 208,38–46.
Xia, R., Rymer, W.Z., 2004. The role of shortening reaction in mediating rigidity inParkinson's disease. Exp. Brain Res. 156, 524–528.
Zia, S., Cody, F., O'Boyle, D., 2000. Joint position sense is impaired by Parkinson's disease.Ann. Neurol. 47, 218–228.
346 D. Anastasopoulos et al. / Experimental Neurology 217 (2009) 336–346