author's personal copy - wordpress.com · · 2016-05-30compass is a registered trial on the...
TRANSCRIPT

This article appeared in a journal published by Elsevier. The attachedcopy is furnished to the author for internal non-commercial researchand education use, including for instruction at the authors institution
and sharing with colleagues.
Other uses, including reproduction and distribution, or selling orlicensing copies, or posting to personal, institutional or third party
websites are prohibited.
In most cases authors are permitted to post their version of thearticle (e.g. in Word or Tex form) to their personal website orinstitutional repository. Authors requiring further information
regarding Elsevier’s archiving and manuscript policies areencouraged to visit:
http://www.elsevier.com/copyright

Author's personal copy
The impact of macular pigment augmentation on visual performancein normal subjects: COMPASS
John M. Nolan a,⇑,2, James Loughman b,2, Mukunda C. Akkali a,1, Jim Stack a,2, Grainne Scanlon b,1,Peter Davison b, Stephen Beatty a,2
a Macular Pigment Research Group, Chemical and Life Sciences, Waterford Institute of Technology, Waterford, Irelandb Macular Pigment Research Group, Optometry Department, Dublin Institute of Technology, Dublin, Ireland
a r t i c l e i n f o
Article history:Received 30 September 2010Received in revised form 8 December 2010Available online 13 January 2011
Keywords:Macular pigmentLuteinZeaxanthinVision performance
a b s t r a c t
This study was conducted to investigate whether augmentation of macular pigment (MP) enhances visualperformance (VP). 121 normal subjects were recruited. The active (A) group consumed 12 mg of lutein (L)and 1 mg of zeaxanthin (Z) daily. MP optical density (MPOD) was assessed by customized heterochro-matic flicker photometry. VP was assessed as best corrected visual acuity (BCVA), mesopic and photopiccontrast sensitivity (CS), glare disability, photostress, and subjective visual function. Subjects wereassessed at baseline; 3; 6; 12 months (V1, V2, V3 and V4, respectively). Central MPOD increased signif-icantly in the A group (p < 0.05) but not in the placebo group (p > 0.05). This statistically significantincrease in MPOD in the A group was not, in general, associated with a corresponding improvement inVP (p > 0.05, for all variables), with the exception of a statistically significant time/treatment effect in‘‘daily tasks comparative analysis’’ (p = 0.03). At V4, we report statistically significant differences in meso-pic CS at 20.7 cpd, mesopic CS at 1.5 cpd under high glare conditions, and light/dark adaptation compar-ative analysis between the lower and the upper MP tertile groups (p < 0.05) Further study into therelationship between MP and VP is warranted, with particular attention directed towards individualswith low MP and suboptimal VP.
� 2011 Elsevier Ltd. All rights reserved.
1. Introduction
The dietary carotenoids zeaxanthin (Z) and lutein (L) and L’s ret-inal isomer meso-zeaxanthin (meso-Z) are lipid-like molecules thataccumulate at the macula, where they are collectively referred toas macular pigment (MP) (Bone, Landrum, Hime, Cains, & Zamor,1993). An average western diet contains about 1.3–3 mg/day of Land Z combined (Nebeling, Forman, Graubard, & Snyder, 1997a,1997b), with significantly more L than Z (represented by an esti-mated ratio of 7:1). Approximately 78% of dietary L and Z issourced from vegetables (Sommerburg, Keunen, Bird, & van Kuijk,1998). L is found in highest concentrations in dark green leafy veg-etables, such as spinach, kale, and collard greens (Sommerburget al., 1998). Z is the major carotenoid found in orange peppers,and oranges, with a high mole percentage of both L and Z beingfound in egg yolk (Sommerburg et al., 1998), with comparableamounts of L and Z recently reported in corn and a variety of corn
containing products (e.g. cornmeal and cereal) (Perry, Rasmussen,& Johnson, 2009). Possible dietary sources of meso-Z includeshrimp, certain marine fish, and turtles, none of which are foundin a typical western diet (Maoka, Arai, Shimizu, & Matsuno,1986), however, it has recently been suggested that MZ may bepresent in some other, yet to be identified, foods (Connolly et al.,2010).
The macula is a specialized part of the retina, as it mediates cen-tral vision, provides sharpest visual acuity, and facilities best colordiscrimination (Hirsch & Curcio, 1989). Age-related maculardegeneration (AMD) is a disease of the macula and results in theloss of central and color vision. AMD is the most common causeof blindness in the elderly population in the developed world(Congdon et al., 2004). It is now understood that oxidative stress(Beatty, Koh, Henson, & Boulton, 2000; Winkler, Boulton, Gottsch,& Sternberg, 1999), exacerbated in part by cumulative short-wavelength visible light exposure (Algvere, Marshall, & Seregard,2006; Fletcher et al., 2008), is important in the aetiopathogenesisof AMD. MP is a short-wavelength (blue) light filter (Bone,Landrum, & Cains, 1992) and a powerful antioxidant (Khachik,Bernstein, & Garland, 1997), and is therefore believed to protectagainst AMD (Loane, Kelliher, Beatty, & Nolan, 2008). Thishypothesis, referred to as the ‘‘protective’’ hypothesis of MP, hasbeen studied and reported on extensively (Loane et al., 2008).
0042-6989/$ - see front matter � 2011 Elsevier Ltd. All rights reserved.doi:10.1016/j.visres.2010.12.016
⇑ Corresponding author.E-mail address: [email protected] (J.M. Nolan).
1 Disclosure: Mukunda C. Akkali, None; Grainne Scanlon, None.2 James Loughman and Jim Stack do consultancy work for nutraceutical companies
in a personal capacity. John M. Nolan and Stephen Beatty do consultancy work fornutraceutical companies, in a personal capacity, and as directors of NutrasightConsultancy Limited.
Vision Research 51 (2011) 459–469
Contents lists available at ScienceDirect
Vision Research
journal homepage: www.elsevier .com/locate /v isres
Author's personal copy
Beyond its ‘‘protective’’ hypothesis, MP’s optical and anatomicproperties have prompted the ‘‘optical’’ hypotheses of this pigment.The ‘‘optical’’ hypotheses of MP have been previously discussed byReading and Weale (1974) and later by Nussbaum, Pruett, and Delori(1981), and include MP’s putative ability to enhance visual perfor-mance and/or comfort by attenuation of the effects of chromaticaberration and light scatter, via its short wave light-filtering proper-ties (Walls & Judd, 1933). This traditional description of the ‘‘opticalhypothesis’’ does not account for additional mechanisms wherebyMP may enhance visual performance, that are, perhaps, unrelatedto the short wave filtration properties of MP. MP has been shownto exhibit dichroic properties (Hemenger, 1982) which may facili-tate the reduction of glare disability through preferential absorptionof polarized light. Higher MPOD has also been observed to relate to atrend towards lower root-mean-square wavefront aberrations (inparticular, higher order aberrations), thereby enhancing visual per-formance (Kvansakul et al., 2006).
There is one additional, and important, mechanism, wherebyMP may have a beneficial effect on visual performance and experi-ence. The antioxidant properties of the MP carotenoids may atten-uate or prevent the deleterious effects of free radical damage onthe physiological functions of the photoreceptors and their axons.
Many studies (to date mostly cross-sectional in design) haveevaluated, and reported on the role of MP in visual performance,including: visual acuity; contrast sensitivity; glare disability; pho-tostress recovery; critical flicker fusion frequency (CFF); color vi-sion (amongst others) (Bartlett & Eperjesi, 2008; Engles, Wooten,& Hammond, 2007; Hammond & Wooten, 2005; Kvansakul et al.,2006; Loughman et al., 2010; Rodriguez-Carmona et al., 2006;Stringham, Fuld, & Wenzel, 2004; Stringham & Hammond, 2007,2008; Wooten & Hammond, 2002). However, a placebo-controlled,randomized, L-based supplementation trial was needed to investi-gate if augmentation of MPOD actually enhances visual perfor-mance and/or comfort. The Collaborative Optical MacularPigment ASsessment Study (COMPASS), presented here, was de-signed specifically to answer this important research question.
2. Methods
2.1. Subjects and study sites
COMPASS was conducted at Waterford Institute of Technology(WIT) and Dublin Institute of Technology (DIT), vision science labo-ratories, located in the southeast and east of the Republic of Ireland,respectively. One hundred and twenty-one healthy subjectsvolunteered to participate in this two-centered study, which wasapproved by the research ethics committees at both study sites.Self-selected recruitment of subjects (WIT: n = 61 and DIT: n = 60)was facilitated by poster and newsletter advertisement, and alsoby word of mouth, in the respective local communities. Informedconsent was obtained from each volunteer, and the experimentalprocedures adhered to the tenets of the Declaration of Helsinki.
All subjects were aged between 18 to 41 years, in perfect gen-eral (self report) and ocular health (see below), and with visualacuity of at least 20/30 in the study eye. A typical study visit lastedapproximately 4 h. Subjects were assessed at baseline, three, six,and 12 months (V1, V2, V3 and V4, respectively). All subjects re-cruited into the study were classed as naïve observers to the testscarried out (with the exception of the visual acuity test, with whichall subjects were familiar). However, to optimize performance, andalso to minimize any potential learning effects on performance, allsubjects underwent a defined period of pre-test training. Thistraining consisted of careful explanation of the nature of each test,pictorial and/or video demonstration of the test requirements andprocedure, and was followed by a defined session of pre-testpractice.
2.2. Study design and formulation
COMPASS is a registered trial on the ISRCTN database (number35481392), and is a randomized placebo-controlled clinical trial oforal supplementation with a formulation containing the macularcarotenoids (L and Z) and co-antioxidants versus placebo. The tabletsused in the current study were hard film coated tablets. The dailydose of two tablets for the active (A) group consisted of 12 mgL, 1 mg Z (provided as ester), 120 mg vitamin C, 17.6 mg vitaminE, 10 mg zinc and 40 lg selenium. The placebo (P) consisted of cellu-lose, lactose and magnesium stearate, and was manufactured to beidentical to the A preparation in terms of size and color. The studytablets for the A and P groups were packaged into identical blisterpacks which contained the subjects’ anonymized unique identifica-tion number and COMPASS study label information. Subjects wereinstructed to consume the daily dose of two tablets with a meal.
Compliance was assessed by tablet counting at each study visit,and encouraged by frequent reminder telephone calls and textmessages by the study COMPASS research team. Compliance wasalso assessed at the end of the study by quantifying L and Z concen-trations in serum, at each study visit, using high performance li-quid chromatography (HPLC).
2.3. Demographic, medical history, lifestyle and vision case historyquestionnaires
The following details were recorded, for each volunteer, on apurpose designed case report form: demographics; general healthstatus; smoking habits (never, current or past); alcohol consump-tion (average unit weekly intake); exercise (minutes per week);body mass index (BMI, kg/m2); blood pressure; ethnicity; maritalstatus; education; occupation.
A vision case history was also performed, and details reportedincluded: time since last eye examination; spectacles or contactlens use; history of ocular treatment or surgery; history of occlu-sion therapy or visual training in childhood; family history of eyedisease; current problems with vision; asthenopia associated withcomputer use; history of headaches.
2.4. Diet and serum concentrations of lutein and zeaxanthin
Dietary intakes of L and Z were quantified using a self-adminis-trated, semiquantitative food frequency questionnaire developedby the Scottish Collaborative Group at the University of Aberdeen(Scotland UK), recently described by O’Connell et al. (O’Connellet al. 2008) Serum concentrations of L and Z were quantified byHPLC using an assay previously reported by Loane et al.(Loane,Nolan, & Beatty 2010).
2.5. Spectacle refraction, visual acuity, and ocular dominance
Each subject underwent precise spectacle refraction by an expe-rienced optometrist to determine refractive error and best cor-rected visual acuity (BCVA) for each eye. A computer generatedLogMAR test chart (Test Chart 2000 Pro; Thomson Software Solu-tions) was used to determine BCVA at a viewing distance of 4 m,using a Sloan ETDRS letterset. BCVA was determined as the averageof three measurements, with letter and line changes facilitated bythe software pseudo-randomization feature. Best corrected visualacuity was recorded using a letter-scoring visual acuity rating, with20/20 visual acuity assigned a value of 100. Best corrected visualacuity was scored relative to this value, with each letter correctlyidentified assigned a nominal value of one, so that, for example,a BCVA of 20/20+1 equated to a score of 101, and 20/20�1 to 99.The study eye was selected on the basis of ocular dominance,determined using the Miles Test (Roth, Lora, & Heilman, 2002) with
460 J.M. Nolan et al. / Vision Research 51 (2011) 459–469
Author's personal copy
the dominant eye chosen as the study eye, except in cases of ob-served equidominance, in which case the right eye was selected.All subsequent tests were conducted with the subject’s optimalsubjective refraction in place.
2.6. Glare disability
Glare disability is a term used to describe the degradation of vi-sual performance typically caused by loss of retinal image contrast.Glare disability is often caused, for example, by surface light reflec-tions, or bright light sources such as car headlights, and typically isa consequence of increased forward light scatter within the eye.Glare disability was assessed using a Functional Acuity ContrastTest (FACT) (Hitchcock, Dick, & Krieg, 2004; Terzi, Buhren,Wesemann, & Kohnen, 2005), displayed using the FunctionalVision Analyzer (Hohberger, Laemmer, Adler, Juenemann, & Horn,2007) (Stereo Optical Co., Inc., Chicago, IL), which is a desktopdevice that allows the measurement of contrast sensitivity, andincludes a customized internal glare source for assessing theimpact of glare on this measure of visual performance. The testcomprised linear, vertically oriented, sine wave gratings presentedat five different spatial frequencies including 1.5, 3, 6, 12 and 18cycles per degree (cpd). Nine circular patches were presented ateach spatial frequency, the contrast of each patch decreasing by0.15-log units from the previous. Gratings were tilted �15�, 0� or+15� with respect to the vertical, to keep them within the orienta-tion bandwidth of the visual channel. The background was taperedinto a grey field in order to keep retinal illumination constant andavoid ghost imaging. Baseline contrast sensitivity was determinedon the basis of the lowest contrast compatible with accurate deter-mination of patch orientation across all five spatial frequencies formesopic [three candelas per meter squared (cdm�2)] instrumentbackground conditions, initially in the absence of a glare source.Subjects were asked to identify grating orientation, starting withthe patch at highest contrast, and continuing until identificationwas no longer possible due to reducing contrast. Subjects wereinstructed not to guess, but to respond ‘‘don’t know’’ if patch orien-tation could not be correctly identified. As this procedure repre-sented a non-standard psychophysical method of thresholddetection, each subject was required to re-identify the orientationof certain gratings in a pseudo-random fashion in order to confirmthe validity of the subject responses at each spatial frequency.Glare disability was assessed using a radial glare source consistingof 12 white LEDs arranged circumferentially in an oval pattern sur-rounding the grating charts (ranging from 4.5� to 6� from centralfixation). These LEDs have a color temperature of 6500 K, and thespectral emission profile demonstrated a single large peak at453 nm (close to MP peak absorption), where the spectral irradi-ance was approximately double that of the peak emissions in theflatter emission spectrum across mid to long wavelengths. Twocustomized intensity settings were used to determine the effectof different levels of glare on contrast sensitivity. Glare source set-tings were set at a medium intensity of 42 Lux and a higher inten-sity of 84 Lux. All correct responses were entered into the Eyeviewsoftware provided, and contrast sensitivity scores for no glare,medium and high glare conditions were determined for the respec-tive spatial frequencies.
2.7. Visual Function in Normals questionnaire
A 30-part, non-validated, Visual Function in Normals question-naire (VFNq30) was designed specifically for the study (JL). The de-sign was based loosely on a previously validated visual activitiesquestionnaire (Sloane, Ball, Owsley, Bruni, & Roenker, 1992), butadapted to suit a normal, young and healthy population sample.This questionnaire allowed the subject to quantify their visual
performance using three separate metrics: situational analysis(SA) which required the subject to rate their visual performance inspecified daily life situations; comparative analysis (CA) which re-quired the subject to compare their perceived visual performanceto that of their peers/family/friends; subject satisfaction score(SSS) which required the subject to provide an overall estimate oftheir perceived quality of vision. Each of the three metrics abovewas computed to give a performance score for five different func-tional aspects of their vision: acuity/spatial vision; glare disability;light/dark adaptation; daily visual tasks; color discrimination.
2.8. Contrast sensitivity function
A Dell Dimension 9200 computer and a Metropsis Visual Stim-ulus Generation device (VSG (ViSaGe S/N: 81020197), CambridgeResearch Systems Ltd., Cambridge, UK) were used to generateand control the stimuli. The VSG provided 14-bit output resolutionper phosphor. The stimuli were displayed on a 1900 ViewSonic pro-fessional series p227f color CRT flat screen monitor with a framerate of 119.98 Hz. The resolution of the monitor was set to1024 � 769 pixels. Non-linearities in the screen luminance outputwere eliminated by gamma correction prior to testing using aphotometer system (Opti-Cal; Minolta, Japan). The Metropsissoftware calculated the inverse curves required to correct for themonitor’s non-linearities.
The Metropsis contrast sensitivity system generated luminancemodulated sine gratings (Gabor patches). The orientation of thestimuli was vertical. The Gabor patches were presented on theCRT monitor and subtended a visual angle of 4.2�. The mean lumi-nance was used as the background luminance. The Gabor had atwo-dimensional spatial Gaussian envelope and was radially sym-metrical with equal standard deviations, dx and dy.
Contrast sensitivity functions were determined under both me-sopic and photopic conditions. Each subject was seated at a fixedviewing distance of 1.5 m from the CRT monitor. Natural pupils wereused throughout the experiment. The non-dominant eye was oc-cluded. Testing was carried out in a light free (other than CRT back-ground mesopic and photopic light) environment. The subject wasdark adapted for 5 min and a 5-min training session was given priorto testing under mesopic conditions. Subject responses were re-corded using a handheld responder (CR6, Cambridge Research Sys-tems Ltd., Cambridge, UK), which communicated with the VSGdevice via an infra red link. A four alternate forced choice testing sys-tem was used, with four possible target locations. The stimuli wererandomly presented at 2� spatial offset from the central cross target.The subject indicated the location of the target in relation to the fix-ation cross using the appropriate button on the responder box. Thesubject’s contrast sensitivity was determined for five different spa-tial frequencies (1.0, 4.1, 7.5, 11.8 and 20.7 cpd) under both mesopicand photopic conditions, all at a mean luminance of 3 cdm�2 (meso-pic) and 100 cdm�2 (photopic).
A linear staircase method was used to determine the contrastthreshold. The first Gabor at a particular location was presentedat an initial contrast level where it was anticipated that the obser-ver would be able to detect the Gabor patch for that particular spa-tial frequency (initial contrast settings were informed by a briefpilot study involving five young healthy subjects). Subsequently,the contrast of the Gabor patch was varied using an adaptive stair-case procedure, which was computer controlled and dependedupon the subject’s responses. The stimulus contrast was reducedin steps of 0.3 log units until the subject did not detect the Gaborpatch (first reversal). The contrast was subsequently increased by0.15-log unit steps until the subject saw the Gabor patch andresponded correctly (second reversal). The Metropsis softwarecalculated the contrast threshold for each location and spatial fre-quency by taking the mid-point between the mean for peaks and
J.M. Nolan et al. / Vision Research 51 (2011) 459–469 461
Author's personal copy
troughs for 12 reversal points. The standard deviation was calcu-lated by taking the deviations of the peak reversals from their peakmeans and using the average square of these deviations to calcu-late a peak variance. This method was repeated for the troughs.The square root of both variances were then calculated and aver-aged to provide the threshold standard deviation.
For each subject, the Metropsis software plotted the inverse ofthe contrast threshold against the range of spatial frequenciestested to provide a contrast sensitivity function under both meso-pic and photopic conditions.
2.9. Photostress recovery
Photostress recovery time (PRT) was calculated using a macularautomated photostress (MAP) test (Dhalla & Fantin, 2005; Dhalla,Fantin, Blinder, & Bakal, 2007). MAP is a novel photostress methodfor the evaluation of macular function using the Humphrey� fieldanalyzer (Model 745i Carl Zeiss Meditec Inc. Dublin, CA, USA).The foveal threshold feature of the field analyzer was used toestablish baseline foveal sensitivity as the average of three consec-utive foveal sensitivity measurements recorded in decibels (dB),with each dB representing a 0.1 log unit sensitivity variation.
Following baseline foveal sensitivity calculation, the subject wasexposed to a photostress stimulus, which consisted of a 5-s exposureto a 300-W, 230-V tungsten lamp head from a viewing distance of1 m. The spectral irradiance in the wavelength range, 300–800 nm,was measured using a Bentham DMc 150 double monochromatorscanning spectroradiometer. The input optic consisted of a very highprecision cosine response diffuser (f2 error < 1%) and the measure-ments were performed in 1 nm intervals. Calibration was carriedout with reference to a quartz-halogen lamp traceable to the UKNational Physical Laboratory. The illuminance at 1 m was obtainedby using the photopic weighting function.
Immediately post-photostress, a continuous and timed cycle offoveal sensitivity measurements were conducted and recorded foreach subject. The reduction in foveal sensitivity from baseline,along with the time taken to recover to baseline foveal sensitivity,was recorded.
2.10. Macular pigment optical density
We used the Macular Densitometer™, a device developed andoriginally described by Wooten, Hammond, Land, and Snodderly(1999), to measure MPOD, including its spatial profile across theretina (i.e. 0.25�, 0.5�, 1.0�, 1.75� and 3� of retinal eccentricity).The Macular Densitometer™ uses heterochromatic flicker photom-etry (HFP) to obtain a valid measure of MPOD at a given retinallocation.(Hammond, Wooten, & Smollon, 2005) This method hasrecently been refined and is now referred to as customized HFPor cHFP. For a detailed description of this protocol please see recentpublications by our research group and others (Loane, Stack,Beatty, & Nolan, 2007; Nolan et al., 2009; Stringham et al., 2008).One subject (cwit2553) was excluded from analysis due to inabilityto use the Densitometer to obtain reliable MPOD data.
2.11. Fundus photography
Fundus photographs were obtained in both eyes using a NIDEKnon-mydriatic fundus camera (AFC-230). Fundus photographswere assessed by an expert eyecare professional to exclude fundo-scopically evident retinal pathology.
2.12. Statistical analysis
The statistical software package SPSS (version 17) and the sta-tistical programming language R were used for analysis. It was
determined at the outset of the study that a minimum sample sizeof 91 subjects was required in order to detect an effect size (corre-lation between two continuous variables) of 0.4 at the 5% level ofsignificance with high power. However, 121 subjects were re-cruited into the study in order to allow for dropouts and for otherpossible analyses, in particular repeated measures analysis.
All continuous variables at baseline exhibited a typical normaldistribution. Mean ± SDs are presented in the text and tables.Comparisons of A and P groups at baseline were conducted usingindependent samples t-tests and chi-square analysis, as appropriate.
We conducted repeated measures analysis of MPOD at each ret-inal eccentricity measured, for each of four study visits using a gen-eral linear model approach, with treatment (i.e. A and P) andsmoking habits (non-smoker, past and current cigarette smoker)as between-subjects factors. Where appropriate we used theGreenhouse–Geisser correction for violation of sphericity. We usedthe 5% level of significance throughout our analysis, withoutadjustment for multiple testing.
Four visual performance (VP) variables (assessed subjectivelyby questionnaire) in this study were recorded as percentagechange of V4 score compared to V1 score. Repeated measures anal-ysis would not have been appropriate for these, and instead theywere analysed using a general linear model with V4 percentagechange as the dependent variable and fixed between-subjects fac-tors treatment and smoking habits as explanatory variables.
3. Results
3.1. Baseline findings
The demographic, lifestyle, dietary and serum carotenoid con-centrations, MPOD, and vision data of all 121 subjects recruitedinto the study, and divided by study arm (i.e. A or P group), aresummarized in Table 1. As seen from this table, there was no
Table 1Demographic, lifestyle, vision, and macular pigment data at baseline.
Characteristic All A P **Sig.an = 121 n = 61 n = 60
Age 29 ± 7 29 ± 7 29 ± 6 0.864Body mass index 26 ± 4 26 ± 4 25 ± 3 0.736Best corrected visual acuity 113 ± 3 113 ± 3 112 ± 3 0.747
Macular pigment optical density0.25� 0.5 ± 0.19 0.49 ± 0.19 0.51 ± 0.20 0.4580.5� 0.4 ± 0.17 0.39 ± 0.16 0.41 ± 0.18 0.4251� 0.22 ± 0.13 0.20 ± 0.12 0.22 ± 0.15 0.4331.75� 0.10 ± 0.11 0.09 ± 0.10 0.10 ± 0.11 0.3763� 0.10 ± 0.10 0.08 ± 0.08 0.12 ± 0.12 0.058
Dietary carotenoids (mg/day)Lutein 1.26 ± 0.95 1.16 ± 0.96 1.36 ± 0.94 0.253Zeaxanthin 0.21 ± 0.12 0.19 ± 0.10 0.23 ± 0.14 0.074
Serum carotenoids (lmol/L)Lutein 0.60 ± 0.32 0.57 ± 0.27 0.62 ± 0.36 0.399Zeaxanthin 0.36 ± 0.17 0.36 ± 0.15 0.37 ± 0.18 0.623
SexMale 69 34 35Female 52 27 25 0.773
Smoking habitsb
Never smoked 73 42 31Ex-smoker 21 11 10Current smoker 27 8 19 0.046
a n = sample size.b Smoking habits: ex-smoker = smoked P 100 cigarettes in lifetime but none in
last 12 months; current smoker = smoked P 100 cigarettes in lifetime and at least 1cigarette per week in last 12 months; A = active group and P = Placebo group.** Sig. = probability significance value.
462 J.M. Nolan et al. / Vision Research 51 (2011) 459–469

Author's personal copy
significant difference between the A and P groups with respect tolifestyle, vision, and MP data, with the exception of a statisticallysignificant difference between these groups for smoking habits(p = 0.046). Smoking status was therefore considered as a potentialconfounding variable and was controlled for throughout repeatedmeasures analysis. The COMPASS baseline findings have alreadybeen published in a separate manuscript in this journal and, there-fore, are not discussed in the current manuscript (Loughman,Akkali et al., 2010).
3.2. Longitudinal findings
3.2.1. Supplement complianceSeventy-six subjects returned tablets, and (based on the num-
ber of tablets returned) 94.7% of these subjects averaged at leastone tablet per day. The average number of tablets per day was1.57 in the A group and 1.65 in the P group, a difference that isnot statistically significant (ANOVA, p = 0.32). In comparing changein MPOD and VP variables between A and P groups, therefore, itwas not deemed necessary to control for differences in compliancein the two groups.
3.2.2. Macular pigment optical densityWe conducted repeated measures ANOVA of MPOD, for all ret-
inal eccentricities measured (i.e. at 0.25�, 0.5�, 1.0 �, 1.75 �, and 3�),over time (i.e. over the study period [at V1, V2, V3, and V4, respec-tively]), using a general linear model approach, with two between-subjects factors: treatment (A, P) and smoking habits (never, past,current smoker). As seen in Fig. 1, there was a trend (in the Agroup) towards an increase in MPOD at all eccentricities measured,but this increase was only statistically significant (at the 5% level)at the more central measured eccentricities (i.e. at 0.25�, 0.5� and1.75�).
Fig. 2 (obtained from R statistical program) shows MPOD varia-tion at 0.25� for 20 consecutive individual subjects from each of theA and P groups. The graphs are arranged so that those with lowest
MP are in the bottom row, and only subjects who presented for allfour visits are displayed.
3.2.3. Serum concentrations of lutein and zeaxanthinWe conducted repeated measures analysis of serum concentra-
tions of L and Z over time (i.e. over the study period) including allstudy visits (V1, V2, V3 and V4), using a general linear model ap-proach, with treatment and cigarette smoking as between-subjectsfactors. As seen in Fig. 3, there was a statistically significant time/treatment interaction effect for serum concentrations of L, whichremained significant (p < 0.001, for all) using any of the standardcorrections for violation of sphericity. It is clear from the meanplots of Fig. 3, how these significant time/treatment interaction ef-fects came about: serum concentrations of L increased with time inthe A group, but remained virtually static in the P group. This time/treatment effect was significant from V2 (as expected andconfirmed using paired t-test analysis between V1 and V2,p < 0.001). There was no statistically significant time or time/treat-ment interaction effect for serum concentrations of Z over thestudy period (p > 0.05, for all tests); however, there was a trend to-wards an increase in the A group.
3.2.4. Visual performanceWhile the repeated measures ANOVA presented above is based
on findings at all four study visits, it is apparent from the graphs(Figs. 1 and 2) that the largest differences in MPOD between Aand P subjects are between V1 and V4. The analysis of VP variableswhich follows is, therefore, confined to V1 and V4 only (controllingfor between-subjects factors: treatment and smoking habits).
Using repeated measures ANOVA or a general linear model, asappropriate, we report a statistically significant time/treatment ef-fect in only one measure of VP, namely ‘‘daily tasks comparativeanalysis’’ assessed subjectively (p = 0.03); whereas all other mea-sures of VP were statistically non-significant (p > 0.05, for all)[see Table 2].
Fig. 1. Change in MPOD at each eccentricity measured, over the 12-month study period, following supplementation in both the active and placebo groups. Repeated measureresults for MPOD over the four study visits and analyzing visit � treatment interaction at eccentricities 0.25�, 0.5�, 1.0�, 1.75� and 3�. The p-values reported are for theGreenhouse–Geisser correction for violation of sphericity and are as follows: MPOD 0.25 = p < 0.001; MPOD 0.5 = p < 0.001; MPOD 1.0 = 0.001; MPOD 1.75 = 0.585; MPOD3.0 = 0.103. Subjects were assessed at baseline, 3, 6, and 12 months (V1, V2, V3 and V4, respectively).
J.M. Nolan et al. / Vision Research 51 (2011) 459–469 463

Author's personal copy
3.2.5. Visual performance differences: low MPOD versus high MPODsubjects
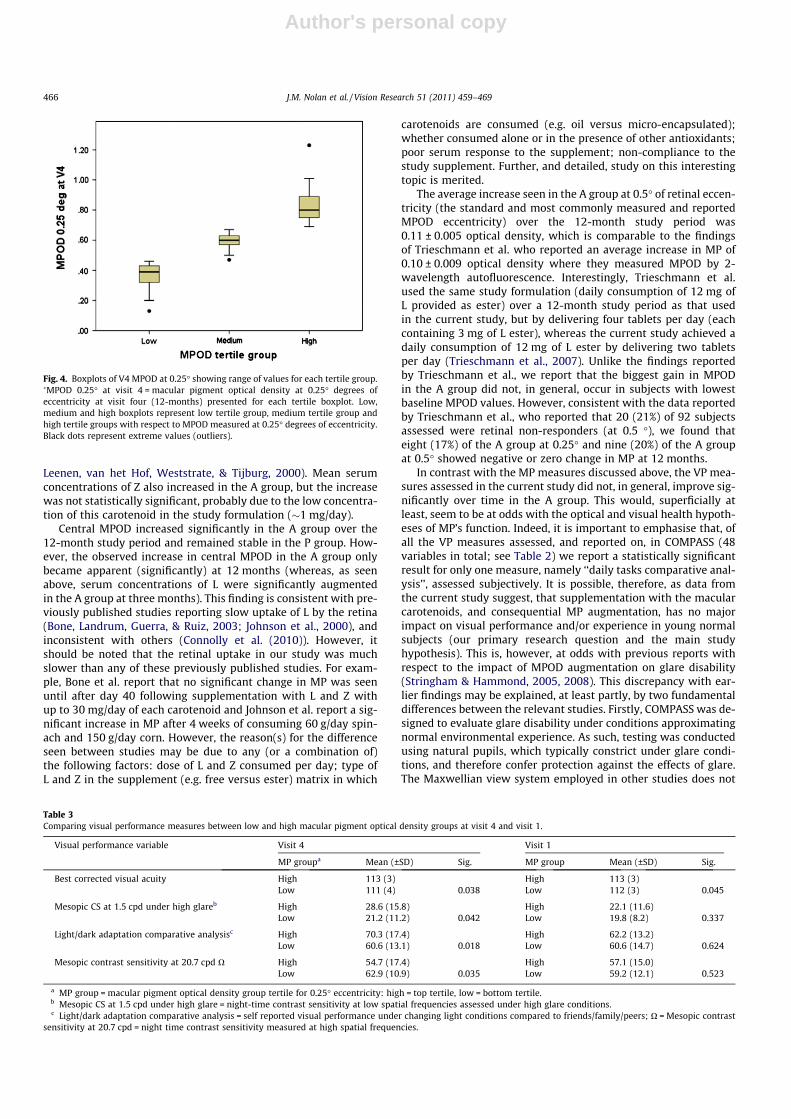
We investigated whether subjects with high MPOD had signifi-cantly better VP scores than subjects with low MPOD followingsupplementation. We based this investigation, for the most part,on MPOD at 0.25� at V4. We used tertiles for V4 MPOD at 0.25�eccentricity to create low, medium and high MPOD groups, andthen compared the low and high groups on a variety of VP mea-sures assessed. The low group consisted of 31 subjects with V4MPOD at or below 0.46 optical density and the high MPOD grouphad 29 subjects with V4 MPOD at or above 0.69 optical density(Fig. 4). Table 3 presents results for VP measures which differ sig-nificantly between these low and high MPOD groups. Table 3 also
presents the corresponding results for V1. It should be noted thatdifferences in these VP measures at V1 were not, in general, statis-tically significant.
4. Discussion
COMPASS is a randomized placebo-controlled clinical trial oforal supplementation with a formulation containing the macularcarotenoids (L and Z) and co-antioxidants versus placebo in youngnormal subjects The pre-specified hypothesis was that supplemen-tation, and consequential MPOD augmentation, would result in im-proved visual performance and/or comfort in those randomized tothe A arm when compared with the P arm, by 12 months.
COMPASS was designed to investigate whether augmentation ofMP results in enhancement of visual performance and/or experi-ence, regardless of the mechanism(s) whereby any such improve-ments may be realized. The optical and neuroprotectivehypotheses around MP, which have been discussed previously byReading and Weale (1974), later by Nussbaum et al. (1981) andare extended here, have generated interest amongst macular pig-ment scientists, evident in a recent review (Loughman, Davison,Nolan, Akkali, & Beatty, 2010). In brief, some authors have sug-gested that MP may be important for visual performance and/orexperience by at least one of a number of mechanisms, includingthe reduction of the effects of chromatic aberration, light scatter,higher order aberrations, and plane polarization of light (Loughman,Davison et al., 2010; Walls & Judd, 1933). Importantly, however, andin theory at least, the macular carotenoids have the capacity toconfer these optical advantages because of their light-filtering anddichroic properties and because of their central location withinthe retina and crystalline lens.
An additional consideration in relation to any trial investigatingthe impact of MP augmentation on visual performance and experi-ence is the potential beneficial effect of MP on neurophysiologicalhealth. For example, the majority of studies investigating theeffects of MP augmentation in ocular disease, including AMD
Fig. 2. Change in MPOD at 0.25� eccentricity for 20 subjects from each of active and placebo groups. �MP 0.25� = macular pigment optical density at 0.25� degrees ofeccentricity
Visit1 2 3 4
Seru
m c
once
ntra
tions
of l
utei
n (µ
mol
/L)
0.0
0.5
1.0
1.5
2.0
2.5
3.0
Fig. 3. Change in serum concentrations of lutein over the 12-month study period,following supplementation in both the active and placebo groups. Mean (±SD)serum concentrations of lutein were quantified by high-performance liquidchromatography at baseline, 3, 6, and 12 months (V1, V2, V3 and V4, respectively)
464 J.M. Nolan et al. / Vision Research 51 (2011) 459–469

Author's personal copy
(summarized by Loughman, Davison et al. (2010)), have reported abeneficial effect on vision, and such findings are probably attribut-able to the neuroprotective, as opposed to the optical, properties ofthese intracellular compounds. These studies have traditionallyemployed basic psychophysical outcome measures, including vi-sual acuity and contrast sensitivity, and as such have not includedstimuli likely to reveal improvements facilitated solely by imageenhancement attributable to the optical properties of this pigment.
The study formulation used in COMPASS, in addition to L and Z,contained the co-antioxidants vitamin C, vitamin E, zinc and sele-nium. In contrast to the capacity to measure subjects’ retinal re-sponse to supplementation with the macular carotenoids (i.e. bymeasuring MP) it was not possible to assess, or quantify, subjects’response to supplementation with the above named co-antioxi-dants. It is important to note that, as seen in the age-related eyedisease study (AREDS) (Kassoff & The AREDS research group,2001), that these antioxidants may have contributed to any bene-fits reported in visual performance in the current study.
Interestingly, several studies have reported, amongst normalsubjects, findings which suggest that MP may play a key role in vi-sual health through a complex interplay between the optical, neu-rological and physiological mechanisms underlying vision. Theseobservations include (a) better critical flicker fusion frequency(CFF) in the presence of higher MPOD (Hammond & Wooten,2005), (b) associations between high MPOD and crystalline lenstransparency and cataract formation (Brown et al., 1989; Chasan-Taber et al., 1999; Hammond, Wooten, & Snodderly, 1997), (c)the presence of L and Z in substantial concentrations in the primaryvisual cortex (Craft, Haitema, Garnett, Fitch, & Dorey, 2004) and (d)higher pattern electroretinogram (PERG) P50 amplitudes and bet-ter dark adapted cone sensitivities in association with higherMPOD (Carboni, Forma, Mutolo, Jennings, & Iannaccone, 2010)(Carboni et al., 2010 ARVO Abstract 1293-A105).
The randomized design of COMPASS resulted in desirable base-line similarity between A and P groups on possible confoundingvariables, with the exception of smoking habits (which was con-trolled for throughout analysis, as appropriate). Significant effortswere made to encourage compliance during the study, and basedon the number of tablets returned, we calculated that 95% of sub-jects averaged at least one tablet per day, with the average numberof tablets consumed per day statistically comparable between theA and P groups (at around 1.6 tablets per day).
Consistent with the positive tablet compliance, on average, ser-um L concentrations increased significantly over the course of thestudy in the A group with no significant change observed in the Pgroup. Indeed, despite the slight drop in mean serum L concentra-tions between V3 and V4 in the A group, L concentrations morethan doubled in the A group over the course of the study. This find-ing is consistent with other and recent L interventional studies(Bone & Landrum, 2010; Trieschmann et al., 2007). However, whileaverage serum L concentrations significantly increased in the Agroup and remained stable in the P group, it is important to pointout that 9 (23%) of the A group showed negative or zero change inserum L concentrations. This ‘‘non-response’’ to L supplementationin serum is consistent with an observation by Hammond et al. in1997 who reported that one subject (out of 11 measured) demon-strated no significant change in serum concentrations of L follow-ing consumption of �12 mg of L per day over a 15 week studyperiod (albeit L consumption in that study was achieved from diet[e.g. spinach and corn] and not from dietary supplements [as in thecurrent study]). To explain the high percentage of serum non-response in the current study, we propose the following possibili-ties: non-compliance with respect to consumption of the studytablet in these subjects: possible attenuation of the gastrointestinalabsorption of supplemental L and Z if the subject fails to take thestudy tablet in the presence of synchronously ingested fat or oil(importantly, subjects were instructed to consume the daily doseof two tablets with a meal to facilitate the bioavailability of L fromthe tablet). Indeed, it has been shown that the amount of fat in aperson’s diet significantly affects the absorption of L ester and itsbioavailability, and given that the tablet used in the current studywas a film coated tablet not containing oil, failure to consume thestudy formulation in the presence of fat and/or oil (i.e. with a meal)could significantly impact on the bioavailability of L (Roodenburg,
Table 2Repeated measures assessment of all VP measures in COMPASS.
Visual performance measure Sub-measure/device p-value
Glare disability Medium glare (Optec)1.5 cpd 0.583.0 cpd 0.946.0 cpd 0.6512.0 cpd 0.9618.0 cpd 0.49
Glare disability High glare (Optec)1.5 cpd 0.193.0 cpd 0.996.0 cpd 0.8912.0 cpd 0.4118.0 cpd 0.86
Glare questionnaire Glare comparative analysis 0.32Glare change analysis 0.88Glare situational analysis 0.74Glare subject satisfaction score 0.51
Visual acuity BCVA (Thomson Chart) 0.16
Visual acuity questionnaire Acuity comparative analysis 0.08Acuity change analysis 0.15Acuity situational analysis 0.14Acuity subject satisfaction score 0.59
Daily tasks questionnaire Daily tasks comparative analysis 0.03�
Daily tasks change analysis 0.21Daily tasks situational analysis 0.27Daily tasks subject satisfactionscore
0.41
Light–dark adaptationquestionnaire
Light–dark comparative analysis 0.35
Light–dark change analysis 0.15Light–dark situational analysis 0.75Light–dark subject satisfactionscore
0.56
Mesopic contrast sensitivity F.A.C.T. (Optec)1.5 cpd 0.723.0 cpd 0.776.0 cpd 0.8412.0 cpd 0.6618.0 cpd 0.5
Mesopic contrast sensitivity Metropsis1.0 cpd 0.544.1 cpd 0.797.5 cpd 0.8211.8 cpd 0.1820.7 cpd 0.08
Photopic contrast sensitivity Metropsis1.0 cpd 0.954.1 cpd 0.427.5 cpd 0.3111.8 cpd 0.1920.7 cpd 0.87
Critical flicker fusion frequency Densitometer 0.3
Foveal sensitivity Humphrey perimeter 0.93
VP = visual performance; ��sig. = probability significance value.Four VP variables in this study were recorded as percentage change of V4 scorecompared to V1 score. Repeated measures analysis would not have been appro-priate for these, and instead they were analysed using a general linear model withV4 percentage change as the dependent variable and fixed between-subjects factorstreatment and smoking as explanatory variables.
J.M. Nolan et al. / Vision Research 51 (2011) 459–469 465
Author's personal copy
Leenen, van het Hof, Weststrate, & Tijburg, 2000). Mean serumconcentrations of Z also increased in the A group, but the increasewas not statistically significant, probably due to the low concentra-tion of this carotenoid in the study formulation (�1 mg/day).
Central MPOD increased significantly in the A group over the12-month study period and remained stable in the P group. How-ever, the observed increase in central MPOD in the A group onlybecame apparent (significantly) at 12 months (whereas, as seenabove, serum concentrations of L were significantly augmentedin the A group at three months). This finding is consistent with pre-viously published studies reporting slow uptake of L by the retina(Bone, Landrum, Guerra, & Ruiz, 2003; Johnson et al., 2000), andinconsistent with others (Connolly et al. (2010)). However, itshould be noted that the retinal uptake in our study was muchslower than any of these previously published studies. For exam-ple, Bone et al. report that no significant change in MP was seenuntil after day 40 following supplementation with L and Z withup to 30 mg/day of each carotenoid and Johnson et al. report a sig-nificant increase in MP after 4 weeks of consuming 60 g/day spin-ach and 150 g/day corn. However, the reason(s) for the differenceseen between studies may be due to any (or a combination of)the following factors: dose of L and Z consumed per day; type ofL and Z in the supplement (e.g. free versus ester) matrix in which
carotenoids are consumed (e.g. oil versus micro-encapsulated);whether consumed alone or in the presence of other antioxidants;poor serum response to the supplement; non-compliance to thestudy supplement. Further, and detailed, study on this interestingtopic is merited.
The average increase seen in the A group at 0.5� of retinal eccen-tricity (the standard and most commonly measured and reportedMPOD eccentricity) over the 12-month study period was0.11 ± 0.005 optical density, which is comparable to the findingsof Trieschmann et al. who reported an average increase in MP of0.10 ± 0.009 optical density where they measured MPOD by 2-wavelength autofluorescence. Interestingly, Trieschmann et al.used the same study formulation (daily consumption of 12 mg ofL provided as ester) over a 12-month study period as that usedin the current study, but by delivering four tablets per day (eachcontaining 3 mg of L ester), whereas the current study achieved adaily consumption of 12 mg of L ester by delivering two tabletsper day (Trieschmann et al., 2007). Unlike the findings reportedby Trieschmann et al., we report that the biggest gain in MPODin the A group did not, in general, occur in subjects with lowestbaseline MPOD values. However, consistent with the data reportedby Trieschmann et al., who reported that 20 (21%) of 92 subjectsassessed were retinal non-responders (at 0.5 �), we found thateight (17%) of the A group at 0.25� and nine (20%) of the A groupat 0.5� showed negative or zero change in MP at 12 months.
In contrast with the MP measures discussed above, the VP mea-sures assessed in the current study did not, in general, improve sig-nificantly over time in the A group. This would, superficially atleast, seem to be at odds with the optical and visual health hypoth-eses of MP’s function. Indeed, it is important to emphasise that, ofall the VP measures assessed, and reported on, in COMPASS (48variables in total; see Table 2) we report a statistically significantresult for only one measure, namely ‘‘daily tasks comparative anal-ysis’’, assessed subjectively. It is possible, therefore, as data fromthe current study suggest, that supplementation with the macularcarotenoids, and consequential MP augmentation, has no majorimpact on visual performance and/or experience in young normalsubjects (our primary research question and the main studyhypothesis). This is, however, at odds with previous reports withrespect to the impact of MPOD augmentation on glare disability(Stringham & Hammond, 2005, 2008). This discrepancy with ear-lier findings may be explained, at least partly, by two fundamentaldifferences between the relevant studies. Firstly, COMPASS was de-signed to evaluate glare disability under conditions approximatingnormal environmental experience. As such, testing was conductedusing natural pupils, which typically constrict under glare condi-tions, and therefore confer protection against the effects of glare.The Maxwellian view system employed in other studies does not
Fig. 4. Boxplots of V4 MPOD at 0.25� showing range of values for each tertile group.�MPOD 0.25� at visit 4 = macular pigment optical density at 0.25� degrees ofeccentricity at visit four (12-months) presented for each tertile boxplot. Low,medium and high boxplots represent low tertile group, medium tertile group andhigh tertile groups with respect to MPOD measured at 0.25� degrees of eccentricity.Black dots represent extreme values (outliers).
Table 3Comparing visual performance measures between low and high macular pigment optical density groups at visit 4 and visit 1.
Visual performance variable Visit 4 Visit 1
MP groupa Mean (±SD) Sig. MP group Mean (±SD) Sig.
Best corrected visual acuity High 113 (3) High 113 (3)Low 111 (4) 0.038 Low 112 (3) 0.045
Mesopic CS at 1.5 cpd under high glareb High 28.6 (15.8) High 22.1 (11.6)Low 21.2 (11.2) 0.042 Low 19.8 (8.2) 0.337
Light/dark adaptation comparative analysisc High 70.3 (17.4) High 62.2 (13.2)Low 60.6 (13.1) 0.018 Low 60.6 (14.7) 0.624
Mesopic contrast sensitivity at 20.7 cpd O High 54.7 (17.4) High 57.1 (15.0)Low 62.9 (10.9) 0.035 Low 59.2 (12.1) 0.523
a MP group = macular pigment optical density group tertile for 0.25� eccentricity: high = top tertile, low = bottom tertile.b Mesopic CS at 1.5 cpd under high glare = night-time contrast sensitivity at low spatial frequencies assessed under high glare conditions.c Light/dark adaptation comparative analysis = self reported visual performance under changing light conditions compared to friends/family/peers; O = Mesopic contrast
sensitivity at 20.7 cpd = night time contrast sensitivity measured at high spatial frequencies.
466 J.M. Nolan et al. / Vision Research 51 (2011) 459–469
Author's personal copy
allow normal pupillary response, so, while MP was shown to im-pact glare disability under these conditions, it is not clear whetherthe effect would have remained if a pupillary response had been al-lowed, which would have caused a variable reduction in retinalilluminance proportional to the magnitude of the pupillary re-sponse. Secondly, our findings can only be applied to the stimulusand glare intensity settings employed here, which, although in-formed by a detailed pilot study, are less comprehensive than thevariable glare annulus intensity employed by Stringham &Hammond.
Kvansakul et al. (Kvansakul et al., 2006) conducted a study toevaluate the effect of MP supplementation on mesopic contrastacuity thresholds (CAT) in normal subjects.(Kvansakul et al.,2006) They reported a significant and beneficial effect of MP sup-plementation on mesopic CAT that was not evident in their placebogroup, their findings therefore appearing to be at odds with thoseof the current study, probably reflecting a number of differencesbetween the two studies in terms of methodology and design[e.g. stimuli, illumination levels (1cdm�2 vs 3cdm�2), etc.]. Also,the design by Kvansakul et al. did not incorporate longitudinalevaluation of MPOD, which was measured only at the final visit(interestingly the CATs reported by Kvansakul showed no correla-tion with MPOD). Furthermore, contrast acuity thresholds were notmeasured at baseline, but only after six months of supplementa-tion and then again at the final 12 month visit. One cannot, there-fore, draw meaningful conclusions with respect to the relationship,if any, between their mesopic CAT findings and MPOD, as there isno record of change in MPOD over their study period. A final pointrelates to the sample sizes of the two studies, the investigation byKvansakul et al. being based on a placebo group of only five sub-jects and three groups of subjects receiving supplementation (con-taining three, five and five subjects respectively) and is thus notcomparable with the COMPASS trial, involving 121 subjects.
There are however, a number of plausible explanations for theabsence of any significant influence of MP augmentation on visualperformance in our study. Firstly, it should be noted that themajority of study participants exhibited average to high centralMPOD pre-supplementation. Indeed, only a small number of sub-jects (�24%) were found to have central MPOD (at 0.5� eccentric-ity) less than 0.30 at baseline. Importantly, it has been suggestedpreviously that MPOD levels greater than 0.30 might be superflu-ous to visual performance requirements (Reading & Weale, 1974),due to the non-linear nature of the effect of MP on vision. Fur-thermore, the increase in MPOD observed in the A group didnot become apparent until the final 12 month visit, and was rel-atively modest with an average increase of 0.11 ± 0.005 opticaldensity (at 0.5� eccentricity), and unlike the findings reportedby Trieschmann et al., subjects (in the A group) in the currentstudy with the lowest MP at baseline did not, in general, demon-strate the biggest increase in MPOD levels following supplemen-tation with the study formulation. Indeed, even after 12-monthsof supplementation with 12 mg of L per day, over 15% of subjectsin the A group retained central MPOD (at 0.5� eccentricity) valuesbelow 0.3 optical density. In other words, it is possible that theMP augmentation achieved in the current study was not sufficient(in an adequate number of subjects) to impact on visual perfor-mance, and that a greater increase in MPOD, particularly in thegroup with lowest baseline MPOD, might be required to elicitan improvement in visual performance. Also, as mentioned above,it is also likely that a significant number of subjects in the currentstudy already had (at baseline) sufficient MP for optimal,measurable, and appreciable visual performance (i.e. 75% ofsubjects in the A group had baseline MP values P 0.3 opticaldensity) and therefore may explain, at least in part, the failureof the current study to demonstrate an improvement in VPfollowing supplemental L.
In addition, the nature of the tests employed for visual perfor-mance testing in COMPASS also merits consideration and discus-sion. The investigators strategically chose to use tests that wereeither typically available in the average consulting room (to ensureapplicability of findings to clinical practice), or designed to repli-cate typical environmental conditions. As such, most of the testsdid not contain substantial amounts of short wavelength lightmaximally absorbed by MP. The typical office or home environ-ment (where the majority of us spend most of our time), doesnot have many short wave dominated light sources. Our resultsmight, therefore, suggest that subjects’ MP levels pre-supplemen-tation were sufficient for optimal visual performance in this typeof environment. Our results, therefore, cannot be extrapolated toshort wave dominated visual scenes, such as against the back-ground of a bright blue sky, which is difficult to replicate in an eco-logically valid way. Importantly, the changing nature of internaland device lighting systems, such as the increased use of LED sys-tems, and xenon car headlights, are extending our exposure toshort wave light sources, and may enhance the applicable rele-vance of MP for visual performance.
However, given that our study subjects showed an extensiverange of MP values, we considered it meaningful to compare VPand comfort measures for subjects with high MP (upper tertile)versus subjects with low MP (lower tertile). We made these com-parisons at baseline and also at V4. At V1, the subjects in the lowMP group (for central MP at 0.25�) were below 0.42 optical density,whereas subjects in the high MP group (for central MP at 0.25�)were above 0.59 optical density. At V4, the corresponding figuresfor low and high groups were 0.46 and 0.67 optical density. Sup-plementation with L, therefore, appears to have widened the gapin MP between the lower and upper tertiles. Of interest, at V4 wereport statistically significant differences in some important VPmeasures, between lower and upper MP tertile groups, which werenot present at V1.
The most significant finding is that of a �30% greater CS underhigh glare conditions in those with highest MPOD following sup-plementation. Interestingly, of all the tests employed in COMPASS,the glare source contained the most substantial amount of shortwave light (white LEDs used to generate glare contain a single‘‘blue’’ peak around 460 nm). These results therefore would seemto corroborate previous findings which suggest a role for MP inthe attenuation of glare disability (Stringham and Hammond,2007, 2008; Stringham et al., 2004), and furthermore would seemto extend those findings to suggest that MP augmentation is ben-eficial for visual performance under glare conditions, even underthe natural pupil conditions employed here. This finding andhypothesis is also supported by the results of the visual perfor-mance questionnaire. Subjects in the A group reported compara-tively, and statistically significantly, better visual performance fordaily visual tasks (including night driving against oncoming head-lights). Furthermore, in the tertile analysis, those with the highestMP reported comparatively, and statistically significantly, better,capacity to deal with sudden changes in illumination (light/darkadaptation).
In conclusion, we report that a significant increase in central MPfollowing L supplementation does not, in general, impact on VP inyoung normal subjects, and our pre-specified hypothesis that MPaugmentation would result in improved VP and/or comfort by12 months, in those randomized to the A arm, remains unproven.However, subjects with high MP following L supplementationdemonstrate visual benefits with respect to glare disability andmesopic CS. Further study into MP and its relationship with VP iswarranted to enhance our understanding of this pigment’s role.However, in order to investigate the impact of MP augmentationon visual performance, the findings of our study suggest that weshould direct our attention to a) subjects with low baseline central
J.M. Nolan et al. / Vision Research 51 (2011) 459–469 467

Author's personal copy
MP levels, b) subjects with suboptimal visual performance and c)subjects with symptoms of glare disability.
Grant information
Study supported by Bausch & Lomb Inc. and Enterprise Ireland,under the Innovation Partnerships Programme.
Acknowledgments
We would like to acknowledge Enterprise Ireland and theInnovation Partnership of Bausch & Lomb Inc. who supported thisresearch.
Appendix A. Supplementary material
Supplementary data associated with this article can be found, inthe online version, at doi:10.1016/j.visres.2010.12.016.
References
Algvere, P. V., Marshall, J., & Seregard, S. (2006). Age-related maculopathy and theimpact of blue light hazard. Acta Ophthalmologica Scandinavica, 84(1), 4–15.
Bartlett, H. E., & Eperjesi, F. (2008). A randomised controlled trial investigating theeffect of lutein and antioxidant dietary supplementation on visual function inhealthy eyes. Clinical Nutrition, 27(2), 218–227.
Beatty, S., Koh, H. H., Henson, D., & Boulton, M. (2000). The role of oxidative stress inthe pathogenesis of age-related macular degeneration. Survey of Ophthalmology,45(2), 115–134.
Bone, R. A., & Landrum, J. T. (2010). Dose-dependent response of serum lutein andmacular pigment optical density to supplementation with lutein esters. Archivesof Biochemistry and Biophysics.
Bone, R. A., Landrum, J. T., & Cains, A. (1992). Optical-density spectra of the macularpigment in vivo and in vitro. Vision Research, 32(1), 105–110.
Bone, R. A., Landrum, J. T., Guerra, L. H., & Ruiz, C. A. (2003). Lutein and zeaxanthindietary supplements raise macular pigment density and serum concentrationsof these carotenoids in humans. Journal of Nutrition, 133(4), 992–998.
Bone, R. A., Landrum, J. T., Hime, G. W., Cains, A., & Zamor, J. (1993). Stereochemistryof the human macular carotenoids. Investigative Ophthalmology and VisualScience, 34(6), 2033–2040.
Brown, E. D., Micozzi, M. S., Craft, N. E., Bieri, J. G., Beecher, G., Edwards, B. K., et al.(1989). Plasma carotenoids in normal men after a single ingestion of vegetablesor purified beta-carotene. American Journal of Clinical Nutrition, 49(6),1258–1265.
Carboni, G., Forma, G., Mutolo, M. G., Jennings, B. J., & Iannaccone, A. (2010). Cross-sectional correlations between macular pigment optical density (MPOD) andmeasures of macular function. Investigative Ophthalmology and Visual Science1293-A105. Ref Type: Abstract.
Chasan-Taber, L., Willett, W. C., Seddon, J. M., Stampfer, M. J., Rosner, B., Colditz, G.A., et al. (1999). A prospective study of carotenoid and vitamin A intakes andrisk of cataract extraction in US women. American Journal of Clinical Nutrition,70(4), 509–516.
Congdon, N., O’Colmain, B., Klaver, C. C., Klein, R., Munoz, B., Friedman, D. S., et al.(2004). Causes and prevalence of visual impairment among adults in the UnitedStates. Archives of Ophthalmology, 122(4), 477–485.
Connolly, E. E., Beatty, S., Thurnham, D. I., Loughman, J., Howard, A. N., Stack, J., et al.(2010). Augmentation of macular pigment following supplementation with allthree macular carotenoids: An exploratory study. Current Eye Research, 35(4),335–351.
Craft, N. E., Haitema, T. B., Garnett, K. M., Fitch, K. A., & Dorey, C. K. (2004).Carotenoid, tocopherol, and retinol concentrations in elderly human brain.Journal of Nutrition Health and Aging, 8(3), 156–162.
Dhalla, M. S., & Fantin, A. (2005). Macular photostress testing: Sensitivity andrecovery with an automated perimeter. Retina, 25(2), 189–192.
Dhalla, M. S., Fantin, A., Blinder, K. J., & Bakal, J. A. (2007). The macular automatedphotostress test. American Journal of Ophthalmology, 143(4), 596–600.
Engles, M., Wooten, B., & Hammond, B. (2007). Macular pigment: A test of the acuityhypothesis. Investigative Ophthalmology and Visual Science, 48(6), 2922–2931.
Fletcher, A. E., Bentham, G. C., Agnew, M., Young, I. S., Augood, C., Chakravarthy, U.,et al. (2008). Sunlight exposure, antioxidants, and age-related maculardegeneration. Archives of Ophthalmology, 126(10), 1396–1403.
Hammond, B. R., Jr., & Wooten, B. R. (2005). CFF thresholds: Relation to macularpigment optical density. Ophthalmic and Physiological Optics, 25(4), 315–319.
Hammond, B. R., Jr., Wooten, B. R., & Smollon, B. (2005). Assessment of the validityof in vivo methods of measuring human macular pigment optical density.Optometry and Vision Science, 82(5), 387–404.
Hammond, B. R., Wooten, B. R., & Snodderly, D. M. (1997). Density of the humancrystalline lens is related to the macular pigment carotenoids, lutein andzeaxanthin. Optometry and Vision Science, 74(7), 499–504.
Hemenger, R. P. (1982). Dichroism of the macular pigment and Haidinger’s brushes.Journal of the Optical Society of America, 72(6), 734–737.
Hirsch, J., & Curcio, C. A. (1989). The spatial resolution capacity of human fovealretina. Vision Research, 29(9), 1095–1101.
Hitchcock, E. M., Dick, R. B., & Krieg, E. F. (2004). Visual contrast sensitivity testing:A comparison of two FA.C.T. test types. Neurotoxicology and Teratology, 26(2),271–277.
Hohberger, B., Laemmer, R., Adler, W., Juenemann, A. G., & Horn, F. K. (2007).Measuring contrast sensitivity in normal subjects with OPTEC 6500: Influenceof age and glare. Graefes Archive for Clinical and Experimental Ophthalmology,245(12), 1805–1814.
Johnson, E. J., Hammond, B. R., Yeum, K. J., Qin, J., Wang, X. D., Castaneda, C., et al.(2000). Relation among serum and tissue concentrations of lutein andzeaxanthin and macular pigment density. American Journal of ClinicalNutrition, 71(6), 1555–1562.
Kassoff, A.The AREDS research group. (2001). A randomized, placebo-controlled,clinical trial of high-dose supplementation with vitamins C and E, beta carotene,and zinc for age-related macular degeneration and vision loss: AREDS report no.8. Archives of Ophthalmology, 119(10), 1417–1436.
Khachik, F., Bernstein, P. S., & Garland, D. L. (1997). Identification of lutein andzeaxanthin oxidation products in human and monkey retinas. InvestigativeOphthalmology and Visual Science, 38(9), 1802–1811.
Kvansakul, J., Rodriguez-Carmona, M., Edgar, D. F., Barker, F. M., Kopcke, W., Schalch,W., et al. (2006). Supplementation with the carotenoids lutein or zeaxanthinimproves human visual performance. Ophthalmic and Physiological Optics, 26(4),362–371.
Loane, E., Nolan, J. M., & Beatty, S. (2010). The respective relationships betweenlipoprotein profile, macular pigment optical density, and serum concentrationsof lutein and zeaxanthin. Investigative Ophthalmology and Visual Science, 51(11),5897–5905.
Loane, E., Kelliher, C., Beatty, S., & Nolan, J. M. (2008). The rationale and evidencebase for a protective role of macular pigment in age-related maculopathy.British Journal of Ophthalmology, 92(9), 1163–1168.
Loane, E., Stack, J., Beatty, S., & Nolan, J. M. (2007). Measurement of macular pigmentoptical density using two different heterochromatic flicker photometers.Current Eye Research, 32(6), 555–564.
Loughman, J., Akkali, M. C., Beatty, S., Scanlon, G., Davison, P. A., O’Dwyer, V., et al.(2010). The relationship between macular pigment and visual performance.Vision Research.
Loughman, J., Davison, P. A., Nolan, J. M., Akkali, M. C., & Beatty, S. (2010). Macularpigment and its contribution to visual performance and experience. Journal ofOptometry, 3(2), 74–90. Ref Type: Journal (Full).
Maoka, T., Arai, A., Shimizu, M., & Matsuno, T. (1986). The first isolation ofenantiomeric and meso-zeaxanthin in nature. Comparative Biochemistry andPhysiology B, 83(1), 121–124.
Nebeling, L. C., Forman, M. R., Graubard, B. I., & Snyder, R. A. (1997a). Changesin carotenoid intake in the United States: The 1987 and 1992 NationalHealth Interview Surveys. Journal of the American Dietetic Association, 97(9),991–996.
Nebeling, L. C., Forman, M. R., Graubard, B. I., & Snyder, R. A. (1997b). The impact oflifestyle characteristics on carotenoid intake in the United States: The 1987National Health Interview Survey. American Journal of Public Health, 87(2),268–271.
Nolan, J. M., O’Reilly, P., Loughman, J., Stack, J., Loane, E., Connolly, E., et al. (2009).Augmentation of macular pigment following implantation of blue light-filteringintraocular lenses at the time of cataract surgery. Investigative Ophthalmologyand Visual Science, 50(10), 4777–4785.
Nussbaum, J. J., Pruett, R. C., & Delori, F. C. (1981). Historic perspectives. Macularyellow pigment. The first 200 years. Retina, 1(4), 296–310.
O’Connell, E. D., Nolan, J. M., Stack, J., Greenberg, D., Kyle, J., Maddock, L., & Beatty, S.(2008). Diet and risk factors for age-related maculopathy. American Journal ofClinical Nutrition, 87(3), 712–722.
Perry, A., Rasmussen, H., & Johnson, E. J. (2009). Xanthophyll (lutein, zeaxanthin)content in fruits, vegetables and corn and egg products. Journal of FoodComposition and Analysis, 22(1), 9–15.
Reading, V. M., & Weale, R. A. (1974). Macular pigment and chromatic aberration.Journal of the Optical Society of America, 64(2), 231–234.
Rodriguez-Carmona, M., Kvansakul, J., Harlow, J. A., Kopcke, W., Schalch, W., &Barbur, J. L. (2006). The effects of supplementation with lutein and/orzeaxanthin on human macular pigment density and colour vision. Ophthalmicand Physiological Optics, 26(2), 137–147.
Roodenburg, A. J., Leenen, R., van het Hof, K. H., Weststrate, J. A., & Tijburg, L. B.(2000). Amount of fat in the diet affects bioavailability of lutein esters but not ofalpha-carotene, beta-carotene, and vitamin E in humans. American Journal ofClinical Nutrition, 71(5), 1187–1193.
Roth, H. L., Lora, A. N., & Heilman, K. M. (2002). Effects of monocular viewing andeye dominance on spatial attention. Brain, 125(Pt 9), 2023–2035.
Sloane, M. E., Ball, K., Owsley, C., Bruni, J. R., & Roenker, D. L. (1992). The visualactivities questionnaire: Developing an instrument for assessing problems ineveryday visual tasks. Technical digest, noninvasive assessment of the visualsystem, topical meeting of the optical society of America.
Sommerburg, O., Keunen, J. E. E., Bird, A. C., & van Kuijk, F. J. G. M. (1998). Fruits andvegetables that are sources for lutein and zeaxanthin: The macular pigment inhuman eyes. British Journal of Ophthalmology, 82(8), 907–910.
Stringham, J. M., Fuld, K., & Wenzel, A. J. (2004). Spatial Properties of Photophobia.Investigative Ophthalmology and Visual Science, 45(10), 3838–3848.
468 J.M. Nolan et al. / Vision Research 51 (2011) 459–469

Author's personal copy
Stringham, J. M., & Hammond, B. R. Jr., (2005). Dietary lutein and zeaxanthin:Possible effects on visual function. Nutrition Reviews, 63(2), 59–64.
Stringham, J. M., & Hammond, B. R. Jr., (2007). The glare hypothesis of macularpigment function. Optometry and Vision Science, 84(9), 859–864.
Stringham, J. M., & Hammond, B. R. (2008). Macular pigment and visualperformance under glare conditions. Optometry and Vision Science, 85(2), 82–88.
Stringham, J. M., Hammond, B. R., Nolan, J. M., Wooten, B. R., Mammen, A., Smollon,W., et al. (2008). The utility of using customized heterochromatic flickerphotometry (cHFP) to measure macular pigment in patients with age-relatedmacular degeneration. Experimental Eye Research, 87(5), 445–453.
Terzi, E., Buhren, J., Wesemann, W., & Kohnen, T. (2005). [Frankfurt-FreiburgContrast and Acuity Test System (FF-CATS). A new test to determine contrastsensitivity under variable ambient and glare luminance levels]. Ophthalmologe,102(5), 507–513.
Trieschmann, M., Beatty, S., Nolan, J. M., Hense, H. W., Heimes, B., Austermann,U., et al. (2007). Changes in macular pigment optical density and serumconcentrations of its constituent carotenoids following supplemental luteinand zeaxanthin: The LUNA study. Experimental Eye Research, 84(4),718–728.
Walls, G. L., & Judd, H. D. (1933). The intra-ocular colour-filters of vertebrates.British Journal of Ophthalmology, 17(12), 705–725.
Winkler, B. S., Boulton, M. E., Gottsch, J. D., & Sternberg, P. (1999). Oxidative damageand age-related macular degeneration. Molecular Vision, 5(32), 32.
Wooten, B. R., & Hammond, B. R. (2002). Macular pigment: Influences on visualacuity and visibility. Progress in Retinal and Eye Research, 21(2), 225–240.
Wooten, B. R., Hammond, B. R., Land, R. I., & Snodderly, D. M. (1999). A practicalmethod for measuring macular pigment optical density. InvestigativeOphthalmology and Visual Science, 40(11), 2481–2489.
J.M. Nolan et al. / Vision Research 51 (2011) 459–469 469