author's personal copy - itc.uji.es · carrier gas or ii) use of a carrier liquid (suspension...
TRANSCRIPT

This article appeared in a journal published by Elsevier. The attachedcopy is furnished to the author for internal non-commercial researchand education use, including for instruction at the authors institution
and sharing with colleagues.
Other uses, including reproduction and distribution, or selling orlicensing copies, or posting to personal, institutional or third party
websites are prohibited.
In most cases authors are permitted to post their version of thearticle (e.g. in Word or Tex form) to their personal website orinstitutional repository. Authors requiring further information
regarding Elsevier’s archiving and manuscript policies areencouraged to visit:
http://www.elsevier.com/copyright

Author's personal copy
Microstructure and photocatalytic activity of suspension plasma sprayed TiO2
coatings on steel and glass substrates
E. Bannier a,⁎, G. Darut b, E. Sánchez a, A. Denoirjean b, M.C. Bordes a, M.D. Salvador c,E. Rayón c, H. Ageorges b
a Instituto de Tecnología Cerámica - Asociación de Investigación de las Industrias Cerámicas, Universitat Jaume I, Av. Vicent Sos Baynat s/n, 12006 Castellón, Spainb SPCTS, UMR CNRS 6638, Université de Limoges, Faculté des Sciences et Techniques, 123 avenue Albert Thomas, 87060 Limoges, Francec Universidad Politécnica de Valencia, Instituto de Tecnología de Materiales, Camino de Vera s/n, 46022 Valencia, Spain
a b s t r a c ta r t i c l e i n f o
Article history:Received 7 March 2011Accepted in revised form 14 July 2011Available online 23 July 2011
Keywords:Photocatalytic coatingsSuspension plasma sprayingTiO2
Microstructure
In this study, TiO2 coatings were deposited by suspension plasma spraying (SPS) from a commercial TiO2
nanoparticle suspension on two different substrates: a standard stainless steel and a Pyrex glass. Coatingswere sprayed on both substrates with an F4-MB monocathode torch; a Triplex Pro tricathode torch was alsoused to spray coatings just on the stainless steel substrates. Spraying distance and cooling were varied.The anatase content in the coatings, determined by XRD, ranged from 32 to 72 wt.%. A significant amount ofanatase to rutile transformation was found to occur during cooling. Examination of the microstructurerevealed that the coating microstructure was bimodal, involving a non-molten region consisting mainly ofanatase nanoparticle agglomerates and a molten region. The glass substrate coatings displayed a segregatedphase distribution, particularly when the surface to be coated was cooled. Photocatalytic activity wasdetermined by a methylene blue test.The experimental data fitted well to a first-order kinetic. All the coatings exhibited high photocatalytic activityin comparison with that of a commercial sol–gel coating. However, unlike much of the previous research,photocatalytic activity did not correlate with the anatase content determined by XRD.
© 2011 Elsevier B.V. All rights reserved.
1. Introduction
Nanostructured coatings are drawing increased scientific attentionbecause of their potential enhancement of coating properties [1].In conventional plasma spraying, micrometre-sized feedstock pow-ders are injected within the plasma flow with a cold (i.e. roomtemperature) carrier gas. The decrease in particle size and weightfrom micro to nanoparticles requires an increase in particle injectionvelocity in order to keep the momentum quantity constant. As aresult, the gas carrier flow rate also needs be raised, leading todisruption of the plasma and to untreated particles. Generally, twopossible approaches can be used to manufacture nanostructuredcoatings: i) agglomeration of nanometre-sized particles into micro-metre-sized feedstock that can be injected conventionally using acarrier gas or ii) use of a carrier liquid (suspension plasma spraying,SPS) instead of a carrier gas. SPS differs significantly from conven-tional atmospheric plasma spraying since the suspension is fragmen-
ted into droplets and the liquid phase vaporised before the solidfeedstock is processed, leading to different interaction phenomenabetween plasma and particles, and to different thermal historiesduring spraying. The process has undergone extensive development,yielding nanostructured SOFC functional layers [2,3], thermal barriercoatings [4,5], wear resistant coatings [6], and photocatalytic layers[7]. Coatings with enhanced properties, in comparison with those ofcoatings obtained from conventional dry powders, have beenreported [8].
Heterogeneous photocatalysis is a process that enables completedegradation of pollutants in water and air. Titanium dioxide (TiO2) is,among semiconductors, the most widely used photocatalyst owing toits stability, non-toxicity, and relatively low cost.
Intense research in recent years has shown that thermal spraytechniques, especially atmospheric plasma spraying (APS) and highvelocity oxy-fuel spraying (HVOF), can be used to produce TiO2
coatings with effective photocatalytic activity [9,10]. This, togetherwith the inherent advantage of feeding nanoparticle suspensionsinstead of nanostructured powders into the plasma torch, as set outabove, has further raised interest in the preparation of photocatalyticTiO2 coatings by SPS [8,11].
A key issue throughout all this research has been the preservationof the largest possible quantity of anatase phase in the coating,because of the superior photocatalytical performance of anatase
Surface & Coatings Technology 206 (2011) 378–386
⁎ Corresponding author. Tel.: +34 964 64 24 24; fax: +34 964 34 24 25.E-mail addresses: [email protected] (E. Bannier), [email protected]
(G. Darut), [email protected] (E. Sánchez), [email protected](A. Denoirjean), [email protected] (M.C. Bordes), [email protected](M.D. Salvador), [email protected] (E. Rayón), [email protected](H. Ageorges).
0257-8972/$ – see front matter © 2011 Elsevier B.V. All rights reserved.doi:10.1016/j.surfcoat.2011.07.039
Contents lists available at ScienceDirect
Surface & Coatings Technology
j ourna l homepage: www.e lsev ie r.com/ locate /sur fcoat

Author's personal copy
compared to that of rutile. In fact, numerous papers have demon-strated the need to achieve aminimum anatase content in the coating,correlating anatase content with photocatalytic activity [12–14].However, controversy persists with regard to the factors that controlTiO2 phase (anatase versus rutile) distribution in the final layers. Amixture of anatase and rutile is always encountered, regardless of thenature and composition of the feedstock, while anatase and rutilecontents can vary widely [15–17].
Toma et al. [18] recently showed that titania coatings obtained bySPS of aqueous suspensions led to better photocatalytic layers, statingthat a minimum threshold of 15–20 vol.% anatase was needed toobtain significant pollutant degradation. A subsequent paper [19]reported that when the anatase ratio exceeded a maximum thresholdof 65 vol.%, the anatase content contributed less to photocatalysis.Other factors could play a role such as those related to the adsorbedspecies on the coating surface [20].
Using submicrometric rutile suspensions, Kozerski et al. [21]recently showed that the photocatalytic performance of the titaniadeposits did not correlate with the anatase content, while coatingsprincipally containing rutile were also photocatalytically active. Thatpaper also noted the need for further research in order to clarify therelationship between process variables and coating microstructure inregard to photocatalytic activity.
The present study was undertaken to prepare photocatalytic TiO2
coatings from aqueous nanoparticle suspensions by SPS. The impact ofcertain key plasma spraying conditions (such as spraying distance andcooling) on coating microstructure, phase distribution, and photocata-lytic activity was studied. Standard stainless steel and Pyrex glass wereused as substrates, the latter being tested in viewof the growing interestin photocatalytic glass-supported coatings for wastewater treatment.
2. Materials and methods
2.1. Materials
All layers were deposited from a commercial suspension of TiO2
nanoparticles (AERODISP 740X, Evonik Degussa GmbH, Germany).The main suspension characteristics, as given by the supplier, arelisted in Table 1.
TEM observations (H7100, Hitachi, Japan) of the nanoparticles inthis suspension confirmed their nanometre size (20–30 nm). XRDanalysis (D8 Advance, Bruker) indicated that they contained 90 wt.%anatase and 10 wt.% rutile.
Stainless steel (AISI 304 grade) and Pyrex glass were used assubstrates (25 mm diameter disks). The metal substrates werepolished up to SiC 4000 and both types of samples were cleanedwith ethanol before coating deposition.
2.2. Coating deposition
Coatings were deposited using two different plasma torches: anF4-MB monocathode torch (Sulzer Metco, Wolhen Switzerland) witha 6 mm internal diameter anode was used to coat both stainless steeland glass substrates, while a Triplex Pro tricathode torch (SulzerMetco, Wolhen Switzerland) with a 6.5 mm diameter segmentedanode was used to coat only steel substrates. The substrates were pre-heated (between 200 °C and 300 °C) to enhance coating adhesion.
As can be observed in Fig. 1, samples were mounted on a rotatingdevice and up to 6 samples were coated simultaneously. Thesuspensions were injected through a calibrated diaphragm of 150 μmaverage diameter. Suspension momentum density upon penetration inthe plasma flow was controlled by adjusting the pressure in thesuspension containers. The characteristics of the suspension feedingsystem have been described elsewhere [22]. For all coatings suspensionfeedrate was 23 ml min−1 (28.2 g min−1).
The main spraying parameters used for each sample, as well as thesample references, are given in Table 2. All coatingswere sprayedwitha similar plasma mass enthalpy. The effects of both spraying distanceand cooling were studied. Cooling was performed by spraying water(8 ml s−1) with compressed air (1 bar) on the surface to be coated,throughout the process. During deposition, the samples temperaturewas measured using a pyrometer. As a consequence of the holdergeometry (Fig. 1), the value measured using the pyrometer dependson both samples and holder temperatures. As holder and steelsubstrates display similar thermal conductivity, the temperaturemeasured should be closed to the real sample temperature. However,in the case of glass samples, the temperature could not be determinedaccurately as a consequence of the important thermal conductivitydifferences existing between glass substrate and metallic holder.
For comparison purposes, a commercial photocatalytic TiO2 sol–gelcoatingand threeAPS coatingswere alsodeposited. The commercial sol–gel layer was obtained by spraying two suspensions on the substrate: acolloidal primer suspension (X-clean PK 3033 P, Nano-X GmbH,Germany) and a TiO2 nanosuspension (X-clean PK 3033 F, Nano-XGmbH, Germany). After deposition the samples were thermally treatedat 400 °C. The main spraying parameters used to deposit the APScoatings are given in Table 3. A complete characterization of the Al2O3–
TiO2 nanostructured coatings has been published elsewhere [23].
2.3. Determination of phase composition
The nanoparticles present in the suspension feedstock and theresulting coatings were tested by X-ray diffraction (XRD) analysis, inorder to determine their crystalline phase compositions. Anatasecontent was quantified using the Rietveld method.
Table 1Nanosuspension main characteristics (according to supplier information).
Reference Supplier TiO2
content(wt.%)
pH Viscosity(mPa s)
Meanaggregatesize (nm)
Densityat 20 °C(g/cm3)
Aerodisp 740 X Evonik 40 5.0–7.0 b1000 b100 1.41Fig. 1. Suspension plasma spraying equipment.
379E. Bannier et al. / Surface & Coatings Technology 206 (2011) 378–386

Author's personal copy
The XRD diffractograms were obtained using a Bruker Theta–ThetamodelD8AdvancediffractometerwithCuKα radiation (λ=1.54183 Å).The generator settings were 45 kV and 30mA. The XRD data werecollected in a 2θ range of 5–90° with a step width of 0.015° and acounting time of 1.2 s/step. A VÅNTEC-1 detector was used.
In the case of the feeding nanoparticles, powder samples wereprepared by drying the suspension feedstock and milling the resultingmaterial in a pneumatic tungsten carbide ring mill to obtain agglomer-ates size below 40 μm [24]. The milled powder was subsequentlybackfilled into an appropriate specimen holder.
A quantitative phase analysis was conducted [25,26] and thecollected data were used in a Rietveld refinement [27,28]. The 4.2version of the DIFFRACplus TOPAS Rietveld analysis program was usedin this study, assuming a pseudo-Voight function to describe peakshapes. The refinement protocol included the background, scale factors,and instrument, as well as the sample lattice, profile, and textureparameters. The basic approach consists, first, of identifying all thecrystalline phases present in the sample and then inputting thecorresponding basic structural data. Finally, computer modelling isused to find the best fit to experimental patterns. An internal standard(fluorite) with a known concentration was introduced to analyse thepowder samples. Rwp (R-weighted pattern) and GOF (goodness-of-fit)parameters were calculated in order to evaluate the accuracy of results.
2.4. Observation of microstructure
Coating microstructure was investigated by scanning electronmicroscopy (SEM) using an FEI Quanta 200F field-emission gun-SEM,connected to an energy-dispersive X-ray microanalysis (EDX)instrument. SEM observations were performed on polished cross-sections of the different samples.
A HORIBA Jobin Yvon Raman spectrometer configured at 514.5 nmemission was used to characterise some coated sample cross-sections.The localisation of the analysis spot of the argon-ion laser was drivenby an optical microscope.
2.5. Characterisation of photocatalytic activity
The photocatalytic activity of the coatings was ascertained bystudying the decomposition of a 5 ppm methylene blue (MB) aqueoussolution under UV radiation. Irradiation was performed in a chamberusing a UV-lamp (λ=370 nm) with an intensity of 2.5 mW/cm2. The
coated samples (25 mm diameter disks) were immersed in a glassbeaker containing 25 ml of MB solution. MB solution absorbance wasmeasured at 664 nm wavelength, which is the maximum absorptionpeak ofMB, using a UV–visible spectrometer (Spectro SC, Labomed Inc.,USA). In order to allow theMB to be adsorbed on to the TiO2 surface, thetest pieceswere kept in contactwith the solution for 30 min in the dark,after which the MB concentration was determined. Afterwards, thesamples were continuously irradiated, a 6 ml volume being withdrawnafter 1, 2, 3, 5, 7, and 11 h of irradiation to determine the concentration.The solution was stirred before each sampling and the withdrawn testliquid was returned to the solution after UV measurement. A blanksample with no coating was tested to evaluate the influence of UVradiation on the decrease in MB concentration by photolysis.
3. Results and discussion
3.1. Sample temperature during deposition
Fig. 2 gives the evolution of the temperature during spraying ofsamples S1, S3 and S4. First, substrates were pre-heated using theplasma torch. When the temperature reaches about 300 °C, theaqueous suspension was introduced leading to a significant drop inboth plasma and sample temperatures. For selected spray conditions,the cooling was also turned on at the end of the pre-heating period.
Table 2Main spraying parameters and sample references.
Sample Substrate Torch Nozzle (mm) Ar (l/min) He (l/min) Arc intensity (A) Arc tension (V) Plasma mass enthalpy (MJ/kg) Spray distance (mm) Cooling
G1 Glass F4-MB 6 50 10 400 39 5.7 60 NoG2 Glass F4-MB 6 50 10 400 38 5.7 40 NoG3 Glass F4-MB 6 50 10 400 39 5.8 40 YesG4 Glass F4-MB 6 50 10 400 39 5.8 50 YesG5 Glass F4-MB 6 50 10 400 39 5.7 50 NoS1 Steel F4-MB 6 50 10 400 39 5.4 40 NoS2 Steel F4-MB 6 50 10 400 39 5.6 60 NoS3 Steel F4-MB 6 50 10 400 39 5.5 50 NoS4 Steel F4-MB 6 50 10 400 38 5.6 50 YesST1 Steel Triplex Pro 6.5 60 0 200 80 5.8 60 NoST2 Steel Triplex Pro 6.5 60 0 200 80 5.8 40 No
Table 3APS spraying parameters.
Coating Powder reference Powder supplier Torch Nozzle(mm)
Ar(l/min)
He(l/min)
H2
(l/min)Arc intensity(A)
Spray distance(mm)
APS-Al2O3 (conventional) METCO 105 SFP Sulzer Metco, Germany F4-MB 6 35 – 12 600 120APS-(Al2O3–13wt.%TiO2)(nanostructured)
NANOX S2613S Inframat advanced Materials, USA F4-MB 6 35 – 12 600 120
APS-TiO2 (nanostructured) NEOXID T101 nano MilliDyn, Finland F4-MB 6 40 20 – 600 120
Fig. 2. Evolution of the samples temperature during spraying.
380 E. Bannier et al. / Surface & Coatings Technology 206 (2011) 378–386

Author's personal copy
It can be observed that sample temperature is only slightlydependent on the spraying distance, whereas cooling leads tosignificantly lower temperature values during deposition.
3.2. Composition of the crystalline phases
3.2.1. Anatase contentXRD analysis along with Rietveld refinement revealed that all
deposited coatings consisted of mixtures of rutile and anatase (Fig. 3).It was found that the coatings contained between 32 and 72 wt.%anatase (Table 4). Moreover, suspension feedstock was sprayed withan F4-MB torch and the in-flight particles were collected in waterinstead of being allowed to impinge upon the substrate. The resultingpowder was dried and analysed by XRD, showing an anatase contentof 74 wt.% whereas the feedstock initially contains 90 wt.% anatase(Table 4, Fig. 4).
From the phase composition analysis, the following results may behighlighted:
▪ The anatase content was lower in the coatings than in the initialsuspension, which indicates phase transformation of titaniumdioxide during deposition.
▪ In-flight particles display lower rutile content than the coatings, asa consequence it may be assumed that much of the phasetransformation occurred after particle deposition.
▪ Cooling led to notably higher anatase content (Fig. 5).▪ Spraying distance had a major effect on coating crystalline phasecomposition: anatase content increased significantly with spray-ing distance (Fig. 6).
▪ The type of plasma torch affected the crystalline phase composi-tion. At similar spraying distance and plasma enthalpy, the layersdepositedwith the tricathode gun displayed lower anatase content(Fig. 6).
▪ Substrate nature had no notable influence on the phase compo-sition (Fig. 6).
3.2.2. Anatase to rutile phase transformation mechanismsIn order to obtain coatings with large amount of anatase, it is
generally considered that the plasma plume temperature must be low
Fig. 3. XRD patterns of coatings G1, S1, and ST1. The peaks labelled A and R correspond,respectively, to anatase and rutile phases.
Table 4Feedstock and coating characteristics.
Sample Thickness(μm)
Anatase(wt.%)
Rutile(wt.%)
Rietveld refinement
Rwp GOF
Suspension feedstock – 90 10 9.30 1.55In-flight particles – 74 26 9.98 1.78G1 15 59 41 15.68 2.52G2 29 38 62 11.18 1.82G3 28 69 31 14.43 2.43G4 15 72 28 16.83 2.75G5 39 46 54 11.50 1.87S1 45 37 63 10.61 1.73S2 23 59 41 14.15 2.49S3 32 46 54 10.70 1.70S4 14 68 32 15.52 2.95ST1 36 44 56 9.85 1.60ST2 55 32 68 11.24 1.76
Fig. 4. XRD patterns of the suspension feedstock nanoparticles (top) and of the in-flightparticles collected in water (bottom). The peaks labelled A and R correspond,respectively, to anatase and rutile phases.
Fig. 5. Effect of cooling on coating anatase content (glass substrate).
381E. Bannier et al. / Surface & Coatings Technology 206 (2011) 378–386

Author's personal copy
enough to avoid an excessive particles heating, which will promotethe phase transformation [29]. Indeed, it is commonly accepted thattransformation from anatase to rutile occurs at a temperature of about900 K [30].
Actually, the anatase found in the coatings may come fromunmolten particles, which retained the initial powder crystallinestructure [20], or from the nucleation of anatase frommelted particles[31], which explained that some anatase is found even when thesuspension feedstock is purely rutile [16,21]. After impingement ofthe molten particles onto the substrate, the anatase to rutiletransformation is promoted by the reheating of previously depositedlayers by successive passes of the torch [32].
In fact, from a thermodynamics point of view the recrystallisation ofanatase fromthe liquidphase ismore favourable, due to its lower surfaceenergy compared to rutile [30]. Then, anatase will transform to rutile,
whichdisplays a lowerGibbs free-energy. However, the anatase to rutiletransformation is reconstructive, whichmeans that it is time dependent[30]. As a consequence, a higher cooling rate of the coatings afterdeposition should reduce the formation of rutile, which is confirmed bythe results shown in Table 4: the coatings obtained using water cooling(samples G3, G4, and S4) yielded the highest anatase content.
It was also found that using the tricathode torch leads to loweranatase content (Table 4). In fact, the tricathode torch led to moreefficient heat transfer from the plasma to the particles and, though, toenhanced particle heating inside the plasma jet. As the particles reachhigher temperature, the driving force for anatase to rutile transfor-mation is increased leading to higher rutile content in the coating.
Several authors have reported that spraying distance has asignificant effect on anatase content [16,31]. The results obtained inthis study confirmed that the quantity of anatase to rutile transfor-mation decreased when the plasma torch was moved farther from thesample (Table 4). As the temperature of the samples is notsignificantly influenced by the spraying distance (Fig. 2), it may beassumed that the differences found in the crystalline structure are notmainly due to changes in the cooling rate. Yet several hypotheses mayexplain these results. First, spraying distance may influence theparticles velocity, leading to differences in splat flattening. Actually,Colmenares-Angulo et al. have shown that at higher impact velocity,the anatase content increased due to an enhancement in splatflattening and, though, to higher splat solidification rate [32]. As aresult, the amount of anatase to rutile transformation is reduced.Furthermore, Jaworski et al. have reported that, as spraying distanceaugments, the number of particles which resolidify before impactonto the substrate is increased [31]. The entrapment of such particlesinside the coatings might promote the formation of a higher amountof rutile [32]. Finally, as the spraying distance is increased, the flighttime in the plasma jet is longer, which gives more time for the anataseto rutile transformation to occur before impact on the substrate.
Fig. 6. Effect of spraying distance on coating anatase content (glass and steel substrates,without cooling).
Fig. 7. SEM micrographs of suspension plasma sprayed TiO2 coatings obtained on steel substrates with an F4-MB plasma gun: a) S1, b) S2, c) S3, and d) S4.
382 E. Bannier et al. / Surface & Coatings Technology 206 (2011) 378–386

Author's personal copy
3.3. Coating microstructure
Coating microstructure was observed by SEM (Figs. 7 to 10). Allcoatings were dense and the porosity measurable by optical orelectronic microscopy was negligible. In general, the coatingsconsisted of a bimodal microstructure characterised by the presenceof completely fused (light-coloured) regions and of non-molten(dark-coloured) regions consisting of agglomerated nanoparticles, asmay be observed in the high-magnification micrographs (Fig. 10).Such microstructures, characterised by a distribution of non-meltedand melted regions, have been previously reported in suspensionplasma sprayed coatings obtained from titania and other materialssuch as alumina [18]. The microstructure develops because, when thesuspension is injected into the plasma, the drops generated by thecontinuous jet break-up are accelerated in the plasma and disin-tegrated into smaller ones. At the same time, the water still present inthe droplets boils and evaporates: the resulting particles may thusbe heated, partly melted, or melted, yielding the end coating. The
resulting microstructure largely depends on the characteristics of thesuspension feedstock and the plasma feed system [21,29].
Anatase content determined by XRD seems to increase whenthe total area of non-molten regions augments. As a consequence,anatase phase is expected to occur mostly in the non-molten areas.However, part of the anatase may have crystallised from liquiddroplets and may, therefore, belong to the molten areas, as set outabove [16,32].
In the case of the steel substrate coatings, molten and non-moltenareas were quite intimately mixed. In contrast, segregation wasobserved in the glass substrate coatings, which led to an increase inthe non-molten areas from the deposit–substrate interface upward tothe outer deposit surface. This effect was particularly notable oncooled glass substrate (coatings G3 and G4 in Fig. 8), suggesting that ahigher cooling rate promotes the segregation. However, as samples G1and G2 presented the same type of microstructure, cooling is not theonly factor of influence. Further investigation will be needed in orderto fully understand the origin of the segregation.
Fig. 8. SEM micrographs of suspension plasma sprayed TiO2 coatings obtained on glass substrates with an F4-MB plasma gun: a) G1, b) G2, c) G3, d) G4, and e) G5.
Fig. 9. SEM micrographs of suspension plasma sprayed TiO2 coatings obtained on steel substrates with a Triplex Pro torch: a) ST2 and b) ST1.
383E. Bannier et al. / Surface & Coatings Technology 206 (2011) 378–386
Author's personal copy
Finally, coolingusually resulted indegradationof themicrostructure,leading to poorer adhesion and the presence of many defects, such ascracks. Such problems presumably stemmed from the presence of awaterfilmon the sample surface,whichhinderedparticle deposition. Asa result of differences in the holding systems used for the glass and steelsubstrates, the water film was much thicker in the case of the steelsubstrates, which probably explains the poor quality of coating S4(Fig. 7d). Finally, significant differences were noted in coating thickness(Table 4). In particular, on steel substrate the coating thicknessincreased when the spraying distance decreased and/or when thetricathode torchwas used, probably owing to higher spraying efficiency.
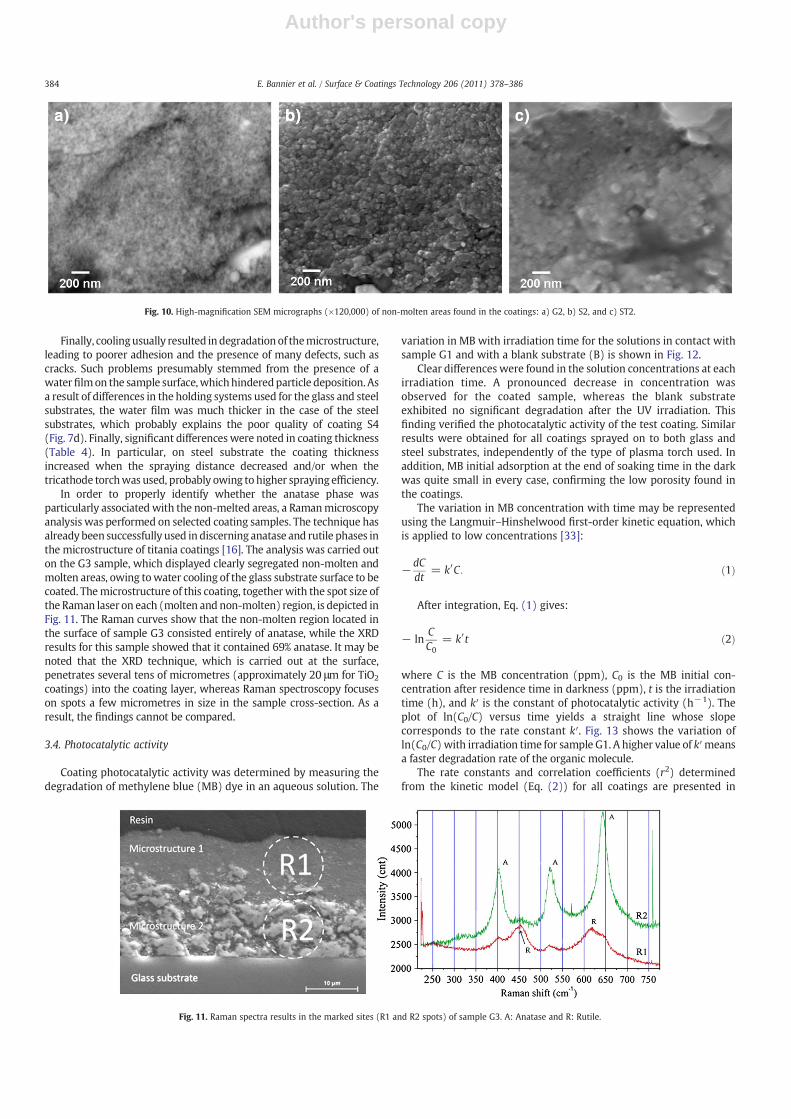
In order to properly identify whether the anatase phase wasparticularly associated with the non-melted areas, a Ramanmicroscopyanalysis was performed on selected coating samples. The technique hasalready been successfully used in discerning anatase and rutile phases inthe microstructure of titania coatings [16]. The analysis was carried outon the G3 sample, which displayed clearly segregated non-molten andmolten areas, owing towater cooling of the glass substrate surface to becoated. Themicrostructure of this coating, together with the spot size ofthe Raman laser on each (molten and non-molten) region, is depicted inFig. 11. The Raman curves show that the non-molten region located inthe surface of sample G3 consisted entirely of anatase, while the XRDresults for this sample showed that it contained 69% anatase. It may benoted that the XRD technique, which is carried out at the surface,penetrates several tens of micrometres (approximately 20 μm for TiO2
coatings) into the coating layer, whereas Raman spectroscopy focuseson spots a few micrometres in size in the sample cross-section. As aresult, the findings cannot be compared.
3.4. Photocatalytic activity
Coating photocatalytic activity was determined by measuring thedegradation of methylene blue (MB) dye in an aqueous solution. The
variation in MB with irradiation time for the solutions in contact withsample G1 and with a blank substrate (B) is shown in Fig. 12.
Clear differences were found in the solution concentrations at eachirradiation time. A pronounced decrease in concentration wasobserved for the coated sample, whereas the blank substrateexhibited no significant degradation after the UV irradiation. Thisfinding verified the photocatalytic activity of the test coating. Similarresults were obtained for all coatings sprayed on to both glass andsteel substrates, independently of the type of plasma torch used. Inaddition, MB initial adsorption at the end of soaking time in the darkwas quite small in every case, confirming the low porosity found inthe coatings.
The variation in MB concentration with time may be representedusing the Langmuir–Hinshelwood first-order kinetic equation, whichis applied to low concentrations [33]:
− dCdt
= k′C: ð1Þ
After integration, Eq. (1) gives:
− lnCC0
= k′t ð2Þ
where C is the MB concentration (ppm), C0 is the MB initial con-centration after residence time in darkness (ppm), t is the irradiationtime (h), and k′ is the constant of photocatalytic activity (h−1). Theplot of ln(C0/C) versus time yields a straight line whose slopecorresponds to the rate constant k′. Fig. 13 shows the variation ofln(C0/C) with irradiation time for sample G1. A higher value of k′meansa faster degradation rate of the organic molecule.
The rate constants and correlation coefficients (r2) determinedfrom the kinetic model (Eq. (2)) for all coatings are presented in
Fig. 10. High-magnification SEM micrographs (×120,000) of non-molten areas found in the coatings: a) G2, b) S2, and c) ST2.
Fig. 11. Raman spectra results in the marked sites (R1 and R2 spots) of sample G3. A: Anatase and R: Rutile.
384 E. Bannier et al. / Surface & Coatings Technology 206 (2011) 378–386

Author's personal copy
Table 5. In each case, the correlation coefficients were higher than0.988, indicating a reasonably good fit of the kinetic model to theexperimental data. A similar fit was found by Toma et al. [18] withsuspension plasma sprayed titania coatings, though the rate constantswere quite different owing to the different test conditions andchemical reagent used.
For comparison purposes, the k′ values were determined in thecase of a commercial photocatalytic TiO2 sol–gel coating and of 3atmospheric plasma sprayed coatings (Al2O3, Al2O3–13 wt.%TiO2 andTiO2). The k′ values detailed in Table 6 show that the photocatalyticactivity of the suspension plasma sprayed coatings prepared in thisstudy was almost twice that of the titania coating obtained from thedry powder, and even much higher than that of the commercial sol–gel coating. These results confirm the good photocatalytic perfor-mance of the suspension plasma sprayed TiO2 coatings.
The value of k′ versus anatase content of all the test coatings isplotted in Fig. 14. Unlike most previous research, no correlation was
observed between both variables. However, this finding was to someextent expected since, as indicated above, the amount of anatasephase determined by XRD did not suitably represent the amount ofanatase phase at the coating surface. The lack of linear correlationbetween anatase content and photocatalytic activity was alreadyreported by Toma et al. [19]. These authors demonstrated the need toconsider other factors, such as coating surface hydroxylation, theamount and binding strength of the bonded water, or other adsorbedspecies on the coating surface, in order to explain the photocatalyticactivity of suspension plasma sprayed coatings with high anatasecontent. Kozerski et al. [21] recently confirmed this lack of correlationand demonstrated the photocatalytic activity of suspension plasmasprayed titania coatings that consisted mainly of rutile. All theseresults underline the role of the surface in photocatalytic activity andthe need, therefore, to physically and chemically analyse the coatingsurface and the interaction between the surface and the environment.Different coatings are currently being analysed by IR and XPS with aview to better understanding this issue.
4. Conclusions
TiO2 coatings were prepared by suspension plasma spraying froma commercial TiO2 nanoparticle suspension using two differentsubstrates (a standard stainless steel and a Pyrex glass), modifyingspraying distance, cooling, and type of plasma-torch.
A large amount of anatase was obtained, ranging from 32 to72 wt.%. The nature of the substrate was found to have no notableinfluence on anatase content. In contrast, the type of plasma torchsignificantly affected the resulting amount of anatase. Sprayingdistance, as well as cooling, had a major effect on coating crystallinephase composition: anatase content increased significantly with bothcooling and spraying distance.
In general, the resulting coatings displayed a bimodal microstruc-ture characterised by the presence of completely fused regions, aswell as of non-molten regions comprising agglomerated anatasenanoparticles. The anatase phase was mostly found in the non-moltenareas. In the coatings sprayed on steel substrates, themolten and non-molten areas were quite intimately mixed, whereas segregation was
Fig. 12. Variation of MB concentration with UV irradiation time for solutions in contactwith the G1 coating and with a blank sample.
Fig. 13. Variation of ln(C0/C) with irradiation time for sample G1.
Table 5Photocatalytic rate constants and correlation coefficients of the coatings.
Sample Rate constant (10−2 h−1) r2
G1 12.5 0.991G2 13.2 0.989G3 15.0 0.990G4 11.8 0.998G5 12.2 0.988S1 15.0 0.992S2 11.2 0.990S3 13.7 0.992S4 14.0 0.990ST1 13.5 0.991ST2 17.1 0.989
Table 6Photocatalytic rate constants of three APS coatings and one commercial sol–gel coating,obtained elsewhere by the authors.
Sample Rate constant (10−2 h−1)
APS-Al2O3 0.5APS-(Al2O3–13wt.%TiO2) 2.4APS-TiO2 7.3Commercial TiO2 sol–gel 5.8
Fig. 14. Effect of anatase content (wt.%) on coating photocatalytic activity.
385E. Bannier et al. / Surface & Coatings Technology 206 (2011) 378–386

Author's personal copy
observed in the case of the glass substrate coatings, particularly whenthe glass surface to be coated was cooled.
Coating photocatalytic activity was determined by measuring thedegradation of methylene blue (MB) dye in an aqueous solution. Thestudied first-order kinetic model exhibited a reasonably good fit to theexperimental data for all test coatings. The values of the kineticconstant for these coatings were, in every case, much higher than thatfor a commercial sol–gel coating. However, unlike most previousresearch, photocatalytic activity was not observed to correlate withthe anatase content determined by XRD.
Acknowledgements
This work has been supported by the Spanish Ministry of Scienceand Education (MAT2009-14144-C03-01), by the Spanish Ministry ofScience and Innovation (PID-600200-2009-5) and by the EuropeanCommission in the frame of the Interreg IV B Sudoe programme(Eliare: SOE1/P1/F169).
References
[1] M. Gell, Mater. Sci. Eng. A 204 (1995) 246.[2] P. Fauchais, R. Etchard-Salas, C. Delbos, M. Tognonvi, V. Rat, J.F. Coudert, T.
Chartier, J. Phys. D Appl. Phys. 40 (2007) 2394.[3] D. Waldbilig, O. Kesier, Z. Tang, A. Burgess, in: B.R. Marple, et al., (Eds.), Thermal
Spray: Global Coating Solutions, ASM International, Materials Park [OH], 2007,p. 677.
[4] A.D. Jadhav, N.P. Padture, Surf. Coat. Technol. 202 (2008) 4976.[5] J. Oberste-Berghaus, J.G. Legoux, C. Moreau, J. Therm. Spray Technol. 17 (2008) 91.[6] J. Oberste-Berghaus, B.R. Marple, C. Moreau, J. Therm. Spray Technol. 15 (2006)
676.[7] L. Pawlowski, Surf. Coat. Technol. 202 (2008) 4318.[8] L. Pawlowski, Surf. Coat. Technol. 203 (2009) 2807.[9] Zeng Yi, Wu. Juntao Li, Jianrong Wang Wei, Soo Wohn Lee, Ceram. Int. 34 (2008)
351.[10] G. Bolelli, V. Cannillo, R. Gadow, A. Killinger, L. Lusvarghi, J. Rauch, Surf. Coat.
Technol. 203 (2009) 1722.
[11] F.-L. Toma, G. Bertrand, D. Klein, C. Meunier, S. Begin, J. Nanomater. (2008) http://www.hindawi.com/journals/jnm/2008/384171.html [Visited: 2010-12-02].
[12] F.-L. Toma, D. Sokolov, G. Bertrand, D. Klein, C. Coddet, C. Meunier, J. Therm. SprayTechnol. 15 (2006) 576.
[13] X.Y. Wang, Z. Liu, H. Liao, D. Klein, C. Coddet, Thin Solid Films 451–452 (2004) 37.[14] L. Toma, N. Keller, G. Bertrand, D. Klein, C. Coddet, Int. J. Photoenergy 5 (2003) 141.[15] J. Colmenares-Angulo, S. Zhao, C. Young, A. Orlov, Surf. Coat. Technol. 204 (2009)
423.[16] H. Podlesak, L. Pawlowski, J. Laureyns, T. Jaworski, T. Lampke, Surf. Coat. Technol.
202 (2008) 3723.[17] E. Bemporad, G. Bolelli, V. Cannillo, D. de Felicis, R. Gadow, A. Killinger, L.
Lusvarghi, J. Rauch, M. Sebastiani, Surf. Coat. Technol. 204 (2010) 3902.[18] F.-L. Toma, L.-M. Berger, C.C. Stahr, T. Naumann, S. Langner, J. Therm. Spray
Technol. 19 (2010) 262.[19] F.-L. Toma, L.-M. Berger, D. Jacquet, D. Wicky, I. Villaluenga, Y.R. de Miguel, J.S.
Lindeløv, Surf. Coat. Technol. 203 (2009) 2150.[20] F.-L. Toma, G. Bertrand, S. Begin, C. Meunier, O. Barres, D. Klein, C. Coddet, Appl.
Catal. B Environ. 68 (2006) 74.[21] S. Kozerski, F.-L. Toma, L. Pawlowski, B. Leupolt, L. Latka, L.-M. Berger, Surf. Coat.
Technol. 205 (4) (2010) 980.[22] R. Etchart-Salas, V. Rat, J.F. Coudert, P. Fauchais, N. Caron, K. Wittmann Teneze, S.
Alexandre, J. Therm. Spray Technol. 16 (5–6) (2007) 857.[23] E. Sánchez, E. Bannier,M. Vicent, A.Moreno,M.D. Salvador, V. Bonache, E. Klyatskina,
A.R. Boccaccini, Int. J. Appl. Ceram. Technol. (2010), doi:10.1111/j.1744-7402.2010.02547.x.
[24] E. Burkhe, R. Jenkins, D.K. Smith (Eds.), A Practical Guide for the Preparation ofSpecimens for X-ray Fluorescence and X-ray Diffraction Analysis, Wiley, NewYork, 1998, p. 171.
[25] A.L. Ortiz, F. Sánchez-Bajo, F.L. Cumbrera, F. Guiverteau, Mater. Lett. 49 (2001)137.
[26] A.L. Ortiz, F. Sánchez-Bajo, N.P. Padture, F.L. Cumbrera, F. Guiverteau, J. Eur. Ceram.Soc. 21 (2001) 1237.
[27] R.E. Young (Ed.), The Rietveld Method, University press, Oxford, 1996.[28] H.M. Rietveld, J. Appl. Crystallogr. 2 (1969) 65.[29] F.L. Toma, G. Bertrand, D. Klein, C. Coddet, C. Meunier, J. Therm. Spray Technol. 15
(2006) 587.[30] D.A.H. Hanaor, C.C. Sorrell, J. Mater. Sci. 46 (2011) 855.[31] R. Jaworski, L. Pawlowski, F. Roudet, S. Kozerski, A. le Maguer, J. Therm. Spray
Technol. 17 (2008) 73.[32] J.R. Colmenares-Angulo, V. Cannillo, L. Lusvarghi, A. Sola, S. Sampath, J. Mater. Sci.
44 (2009) 2276.[33] A. Houas, H. Lachleb, M. Ksibi, E. Elaloui, C. Guillard, J.M. Herrmann, Appl. Cat. B
Environ. 31 (2001) 145.
386 E. Bannier et al. / Surface & Coatings Technology 206 (2011) 378–386