author's personal copy - ou
TRANSCRIPT
This article appeared in a journal published by Elsevier. The attachedcopy is furnished to the author for internal non-commercial researchand education use, including for instruction at the authors institution
and sharing with colleagues.
Other uses, including reproduction and distribution, or selling orlicensing copies, or posting to personal, institutional or third party
websites are prohibited.
In most cases authors are permitted to post their version of thearticle (e.g. in Word or Tex form) to their personal website orinstitutional repository. Authors requiring further information
regarding Elsevier’s archiving and manuscript policies areencouraged to visit:
http://www.elsevier.com/copyright

Author's personal copy
Hydrodeoxygenation of m-cresol over gallium-modified beta zeolite catalysts
Artit Ausavasukhi 1, Yi Huang, Anh T. To, Tawan Sooknoi ⇑, Daniel E. Resasco ⇑School of Chemical, Biological and Material Engineering, University of Oklahoma, Norman, OK 73019, USA
a r t i c l e i n f o
Article history:Received 25 November 2011Revised 1 March 2012Accepted 3 March 2012Available online 18 April 2012
Keywords:Ga-doped HBEAm-CresolDeoxygenationSurface pool mechanism
a b s t r a c t
Ga-modified H-Beta (Ga/HBEA) zeolites were evaluated and compared to other Ga-containing catalystssupported on SiO2 and ZSM-5 (MFI) for the hydrodeoxygenation of m-cresol, a model compound repre-sentative of lignin-derived phenolics. The products include toluene, benzene, xylene, light hydrocarbons,as well as phenol and other oxygenated compounds. The appearance of bicyclic compounds suggests thatthe formation of a ‘‘surface pool’’ of oxygenated intermediates may play a role in the reaction pathway.The yield of toluene, a desirable deoxygenated product, increases with reaction temperature, space time(W/F), Ga content, and H2 partial pressure and depends on the type of support used (Ga/HBEA > HM-FI� Ga/SiO2). The deoxygenation activity of these catalysts seems to depend on the ability of the zeoliteto stabilize specific Ga species, for which HBEA is more effective than HMFI and much more than SiO2.
� 2012 Elsevier Inc. All rights reserved.
1. Introduction
Fast pyrolysis is a potential platform for biomass conversionwith a number of techno-economic advantages over other pro-cesses [1–7]. However, the (bio-oil) obtained by this process in-cludes a complex mixture of oxygen-rich compounds withcarbonyl, carboxyl, methoxy, and hydroxyl functional groups thatare not suitable for transportation fuels [8–10]. The high oxygencontent of bio-oil makes it thermally and chemically unstable, cor-rosive, and immiscible with hydrocarbons. Therefore, upgrading ofbio-oils to fuels necessarily involves deoxygenation [11–15].
Deoxygenation of bio-oil has been typically attempted by usingmetal-catalyzed hydrotreating [16–19]. It is well known that tran-sition metals are highly active for reactions involving hydrogen(hydrogenation/dehydrogenation and hydrogenolysis). An alterna-tive family of catalysts that can promote hydrodeoxygenation un-der less severe conditions is that of Ga-doped zeolites. Thesecatalysts are known to exhibit relatively high activity for dehydro-genation and aromatization of light alkane [20–25].
It has been shown that depending on the specific zeolite used asa support, its pretreatment, and loading, Ga may be present in dif-ferent forms. They include (a) gallium oxide, typically appearing inaggregated form on the external zeolite surface, (b) small particlesoccluded in the zeolite micropores, and (c) cationic forms, such asoxidic GaO+, reduced Ga+, or GaH2
+ species [26–30]. It is expected
that the electro#132;philic nature of such cationic species may en-hance the interaction of the catalyst with oxygenated compounds.This enhanced interaction should lead to higher deoxygenationactivity in the presence of hydrogen.
In fact, in a recent study, we have shown that Ga-modified HMFIis an effective catalyst for the hydrodeoxygenation of benzaldehyde[31]. In this work, m-cresol has been chosen as a model oxygenatedcompound, representing the many phenolics deriving from thepyrolysis of the lignin fractions in biomass [32]. Ga-doped zeolitecatalysts (HBEA and HMFI) and silica-supported Ga were tested ashydrodeoxygenation catalysts for the conversion of m-cresol. Differ-ent reaction conditions (space time, type of carrier gas, and reactiontemperature) have been investigated in a continuous-flow reactor.Temperature-programmed techniques were used to elucidate thenature of the active species and infer possible reaction pathways.
2. Experimental
2.1. Catalyst preparation and characterization
An HBEA zeolite (CP814E, Si/Al � 12.5, from Zeolyst) wasimpregnated with aqueous solutions of Ga(NO3)3 to obtain a rangeof Ga loading (1–6 wt.%). After impregnation, the samples were cal-cined at 550 �C for 4 h in flow of dry air. Elemental analysis by ICPwas conducted to determine the exact compositions (see Table 1).For comparison, two additional samples with 3 wt.% Ga loadingwere prepared by the impregnation of HMFI (from Sud-ChemieAG, Si/Al � 45) and silica (PPG, Hi-Sil 210), respectively.
Temperature-programmed reduction (TPR) was carried out in aflow system connected to a TCD detector. Prior to the TPR, thesample was heated in dry air for 1 h (30 mL/min) to 550 �C andthen cooled to 50 �C. During the subsequent TPR, H2 consumption
0021-9517/$ - see front matter � 2012 Elsevier Inc. All rights reserved.http://dx.doi.org/10.1016/j.jcat.2012.03.003
⇑ Corresponding authors. Permanent address: Department of Chemistry, Facultyof Science, King Mongkut’s Institute of Technology Ladkrabang, Bangkok 10520,Thailand (T. Sooknoi).
E-mail addresses: [email protected] (T. Sooknoi), [email protected] (D.E. Resasco).1 Permanent address: Program in Applied Chemistry, Rajamangala University of
Technology Isan, Nakhon Ratchasima 30000, Thailand.
Journal of Catalysis 290 (2012) 90–100
Contents lists available at SciVerse ScienceDirect
Journal of Catalysis
journal homepage: www.elsevier .com/locate / jcat

Author's personal copy
was recorded as a function of temperature in flow of 2% H2/Ar(30 mL/min) at a linear heating rate of 10 �C/min.
To quantify the BrØnsted acidity of the samples, temperature-programmed desorption of i-propylamine (IPA-TPD) was conductedin a flow system connected to a mass spectrometer (MS). In eachmeasurement, 20 mg of sample was pretreated in flow of He at550 �C. Alternatively, a few samples were pretreated in flow of H2
at 550 �C for 2 h. After the pretreatment, the sample was cooled inHe to room temperature and consecutive pulses of i-propylamine(IPA) were injected onto the sample until saturation (as measuredin the MS) was reached. The excess IPA was removed by flowingHe. When a constant signal was achieved in the MS, the samplewas heated to 900 �C at a rate of 10 �C/min. The mass peaks usedto identify the various desorption products were as follows: i-propyl-amine (m/z = 44), propylene (m/z = 41), and ammonia (m/z = 17). Theamount of desorbed IPA was simultaneously calibrated with 2 mLpulses of 2% propylene in He, and the BrØnsted acidity was then cal-culated following the method described by Gorte et al. [33].
2.2. Catalytic activity measurements
The activity of the different catalysts for m-cresol conversionwas evaluated on a continuous-flow tubular packed-bed reactor.In each run, a stream of 30 mL/min He (or H2), regulated by a massflow controller and saturated at 20 �C with m-cresol vapor, wasused as a feed. The products were periodically collected andanalyzed by online gas chromatography (GC). The range of reactionconditions used for these measurements was as follows:400–550 �C; 1 atm; He or H2 carrier gas; space time (W/F) 2–22 h.
In addition to the measurements taken in the continuous flowmode, a micropulse reactor was employed to test the amountand reactivity of surface species trapped inside the cages of thezeolite. In these experiments, the reactor was loaded with0.020 g of catalyst diluted in inert material to get a bed length of20 mm. As a pretreatment, the catalyst was exposed to H2 (30 cc/min) at 450 �C for 2 h, then to He (60 cc/min), which was used asthe carrier gas for the pulses of 2.3 lmol m-cresol. The fraction ofm-cresol retained by the catalyst in each pulse was measured byan FID detector directly connected at the reactor outlet. Subse-quently, pulses of H2 were sent over the catalyst containing thetrapped species. The analysis of the products evolved from thesepulses was conducted in a GC/FID. During the time delay betweenthe injection of m-cresol and the H2 pulses, the catalyst was keptunder a 60 cc/min He stream. Alternatively, direct analysis of theHe stream coming out of the reactor was also performed at a giventime after the m-cresol injection to determine what productsevolve in the absence of added H2.
2.3. Temperature-programmed decomposition and desorption (TPDD)after reaction
The following TPDD experiment was conducted to characterizethe species left on the catalyst surface during reaction. After a
typical reaction run over the Ga/HBEA catalyst, the reactor wasswitched to a flow of He and quickly cooled down to 100 �C.Subsequently, a TPDD was conducted by increasing the tempera-ture from 100 to 900 �C with a heating rate of 10 �C/min, underH2 as a carrier gas, while monitoring the intensity of the followingmasses (m/z) in a mass spectrometer: 15 (methane), 18 (water), 27,41, 56 (hydrocarbons), 78 (benzene), 91 (toluene), 94 (phenol), and168 (bicyclic compounds).
3. Results
3.1. Catalyst characterization
The characteristics of the catalyst samples, including measuredSi/Al ratio, wt.% Ga loading, and BET surface area, are summarizedin Table 1. The observed drop in BET area with increasing Ga load-ing is not very pronounced, indicating that the extent of poreblocking caused by the Ga species was not significant.
The TPR profiles for the five calcined catalyst samples are com-pared in Fig. 1. For the Ga/HBEA zeolites with low and moderatelylow Ga loadings, a Gaussian deconvolution of the profiles revealsthe presence of several contributions, as previously observed[34]. A single low-temperature reduction peak (�550 �C), presentin all the samples, is typically assigned to the reduction in well-dispersed Ga species such as GaO+ species or small Ga2O3 particlesinteracting with the zeolite. At higher temperatures, a series ofreduction peaks (�650–750 �C) are observed. Their position anddistribution depend on the Ga content. They are generally attrib-uted to bulk-like Ga2O3 particles, separated from or loosely sup-ported on the zeolite matrix. By increasing the Ga loading, thedistribution of these peaks shifted to higher temperatures, indicat-ing that, at higher concentrations, the Ga species can furtheragglomerate into larger Ga2O3 clusters, which are more difficult
Table 1Chemical composition and surface area of catalyst samples.
Catalyst Si/Ala Ga loading (wt.%)a Surface area (m2/g) Density of acid sitesb (mmol/g)
HBEA 11 – 615 1.20 (1.4)c
IGa/HBEA 11 1.0 590 0.943Ga/HBEA 11 2.9 580 0.666Ga/HBEA 11 5.9 570 0.593Ga/SiO2 – 2.9 370 –3Ga/HMFI 45 2.8 510 –
a Elemental analysis for Si, Al, and Ga by ICP.b As measured by TPD of I PA.c Theoretical acid density calculated from Si/Al ratio.
300 400 500 600 700 800 900
0
500
1000
1500
2000
2500
3000
3500
3Ga/SiO2
3Ga/HZSM-5
3Ga/HBeta
6/Ga/HBeta
TCD
sig
nal (
A.U
.)
Temperature (oC)
1Ga/HBeta
Fig. 1. TPR profiles of (a) 1 Ga/HBEA, (b) 3Ga/HBEA, (c) 6 Ga/HBEA, (d) 3Ga/HZSM-5,(e) 3Ga/SiO2 after calcination at 550 �C.
A. Ausavasukhi et al. / Journal of Catalysis 290 (2012) 90–100 91

Author's personal copy
to reduce and are expected to be preferentially located on the outersurface of the zeolite [34].
Likewise, the 3Ga/HMFI (Si/Al � 45) shows a reduction behaviorsimilar to that of the 3Ga/HBEA sample, with several reductionsteps in positions similar to those observed with the Beta zeolite.By contrast, the silica support does not result in a good dispersionof Ga, as evidenced by the appearance of a single broad reductionpeak at very high temperature, which can be ascribed to large gal-lium oxide particles. The lack of any reduction near 550�C indicatesthe absence of dispersed Ga species, typically observed on the zeo-lite samples.
The acidity of the HBEA and Ga/HBEA catalysts was determinedby the IPA-TPD method [33], and the results are summarized inFig. 2. The evolution of ammonia and propylene via Hofmann elim-ination takes place at �350 �C and provides a direct measurementof the number of bridging BrØnsted acid sites („SiAOHAAl„),strong enough to catalyze this reaction. The densities of BrØnstedacid sites calculated by this method for the different catalysts areincluded in Table 1. A noticeable decrease in the density ofBrØnsted acid sites is observed on the H2-treated catalysts withincreasing loadings of Ga. This trend supports previous suggestionsthat reduced Ga species (i.e., Ga+) act as exchangeable cations andreplace H+ BrØnsted sites [30,31,35]. One can compare in Fig. 3 thelarge relative drop in acid density caused by the addition of Gacompared to the much smaller relative drop in BET surface area.It is clear that the loss of acid density is not due to pore blocking,but rather by the cation exchange.
The observed decrease in acid sites seems to level off at high Galoadings. That is, the drop in the number of acid sites for the 6Ga/HBEA zeolite is about the same as that for the 3Ga/HBEA, whichonly has half as much Ga. To explain this trend, we realize that the
latter has most of the Ga species in a high state of dispersion, whilethe former has a large fraction of the Ga species forming largeoxide aggregates outside the zeolite. Therefore, it is reasonable thatthe exchange of acid sites should be less effective at higher Galoadings. At the same time, the IPA-TPD shows that the high-Ga-loading zeolite (6 Ga/HBEA) generates new sites that can onlydecompose IPA at high temperatures (>450 �C). These additionalsites with relatively low acid strength have previously been as-signed to GaOH species [30,31,35] and may appear only at highGa loadings.
0.0
1.0x10⁻⁸
2.0x10⁻⁸
3.0x10⁻⁸
4.0x10⁻⁸
5.0x10⁻⁸
Ammoniai-Propylene
MS
sign
al (A
.U.)
Propylene
0.0
1.0x10⁻⁸
2.0x10⁻⁸
3.0x10⁻⁸
4.0x10⁻⁸
5.0x10⁻⁸
Ammoniai-Propylamine
MS
sign
al (A
.U.)
Propylene
0.0
1.0x10⁻⁸
2.0x10⁻⁸
3.0x10⁻⁸
4.0x10⁻⁸
5.0x10⁻⁸
Propylenei-Propylamine
MS
sign
al (A
.U.)
Ammonia
100 200 300 400 500 600 700 800 900100 200 300 400 500 600 700 800 900
100 200 300 400 500 600 700 800 900100 200 300 400 500 600 700 800 900
0.0
1.0x10⁻⁸
2.0x10⁻⁸
3.0x10⁻⁸
4.0x10⁻⁸
5.0x10⁻⁸
Ammonia
i-Propylamine
MS
sign
al (A
.U.)
Temperature (oC)
Propylene
(a) (b)
(c) (d)
Temperature (oC)
Temperature (oC)Temperature (oC)
Fig. 2. IPA-TPD of (a) HBEA, (b) red-1 Ga/HBEA⁄, (c) red-3Ga/HBEA⁄, (d) 6 Ga/HBeta⁄. ⁄The Ga-supported zeolite was firstly reduced with H2 at 550 �C for 2 h and then cooleddown to 40 �C under He. Saturation of i-propylamine was carried out at 40 �C. The temperature was raised to 900 �C with 10 �C/min under He.
Rat
io R
elat
ive
to B
are
HBE
A
Ga Loading (wt %)
0.25
0.5
0.75
1
0 2 4 6 8
BET surface area
Acid density
Fig. 3. Effect of Ga loading on relative surface area and acid density as compared toHBEA.
92 A. Ausavasukhi et al. / Journal of Catalysis 290 (2012) 90–100

Author's personal copy
The reported size of the primary crystals observed by SEM beforeGa impregnation is about 20–40 nm for HBEA (Zeolyst, CP814E) andabout 50 nm for HMFI (Sud-Chemie, Si/Al = 45) [36]. We have con-ducted SEM and XRD analysis of the 3Ga/HBEA and 3Ga/HMFI (seeFigs. 4a and b). Neither the crystallite size nor the crystallinityshows any significant change upon the incorporation of Ga.
3.2. Catalytic activity
The distribution of products obtained from m-cresol conversionin H2 over 3Ga/HBEA at 400 �C is shown in Fig. 5 as a function ofspace time (W/F). A rapid increase in the yields of phenol and hea-vier phenolic compounds (i.e., bicyclic or oligocyclic substituted
phenolics) can be observed when increasing in space time (W/F)up to about 6 h. A further increase in W/F results in the decreasein both phenol and oxygenated compounds, while C1, C2AC6hydrocarbons, benzene, toluene, and xylene slowly increase. Theobserved evolution of products with W/F indicates that toluene isnot a primary product and that CAOH hydrogenolysis of m-cresolto toluene does not occur to a significant extent. The pronounceddrop in the yield of the oxygenated compounds observed at inter-mediate W/F indicates that these heavier compounds tend to behydrogenolyzed/decomposed into lighter hydrocarbons as thespace time increases. Also, the gradual decline in yield of phenolafter W/F = 6 suggests that phenol can be slowly deoxygenated tohydrocarbons at longer space times.
Fig. 4a. SEM images of the 3Ga/HZSM5 (left) and 3Ga/HBeta (right) after calcination.
Fig. 4b. XRD analysis of the 3Ga/HZSM5 and 3Ga/HBeta catalysts compared to their corresponding bare H-zeolite.
A. Ausavasukhi et al. / Journal of Catalysis 290 (2012) 90–100 93

Author's personal copy
As illustrated in Table 2, a very different behavior is observed inthe absence of hydrogen. Not only the overall m-cresol conversionwas lower when using He as a carrier gas instead of H2, but also theproduct distribution was very different. While under H2 deoxygen-ated hydrocarbons (i.e., benzene, toluene, and xylene) were domi-nant at high W/F, they were much less important under He at anyW/F. Likewise, a significant effect of the carrier gas was observed inthe toluene/benzene ratio, which was much higher and stable un-der H2 than under He (see Fig. 6). It seems that, under H2, the CAObond cleavage to form toluene is relative faster than the dealkyla-tion (CAC cleavage) to form benzene. Without H2, the toluene/ben-zene ratio was initially about one but increased as the catalystdeactivated.
The presence of H2 also has a marked effect on catalyst stability.A rapid deactivation of the catalyst is observed in the absence ofH2, suggesting that high MW intermediates are retained underHe carrier gas, but they may be removed in the form of lighterproducts over the Ga-modified catalysts in the presence of H2.
The increase in Ga loading had an impact on product distribu-tion. As shown in Table 3, when compared at the same overall con-version and temperature, the increase in Ga content under H2
resulted in a parallel increase in the production of deoxygenatedaromatics at the expense of the high MW oxygenated compounds.It is expected that the CAC and CAO hydrogenolysis activity pro-vided by the incorporation of Ga in the HBEA zeolite results in en-hanced formation of benzene, toluene, and methane viahydrogenolysis. Since the density of Brønsted sites decreases withthe addition of Ga, we might expect a decrease in cresol conversionas the Ga loading increases. However, as shown in Table 3, theoverall conversion does not vary as Ga loading increases from1 wt.% to 6 wt.%. The absence of conversion drop may indicate thatwhile the addition of Ga reduces Brønsted sites, it may generate Le-wis acid sites GaO+ or Ga+, which can still activate cresol at com-parable rate. The greatest effect of the addition of Ga is in a drasticincrease in the selectivity toward hydrogenolysis products, tolueneand benzene, a reaction that is catalyzed by Ga species. At the sametime, the selectivity to the heavier oxygenated compounds is
0 5 10 15 20 250
10
20
30
40
50
60
70
% Y
ield
W/F (h)
m-Cresol Feed
Fig. 5. Effect of W/F over 3Ga/HBeta. Product yield: (j) methane, (d) benzene, (N)toluene, (.) xylene, (h) other hydrocarbons, (s) phenol, (D) oxygenated com-pounds. Reaction conditions: Catalyst = 3Ga/HBeta, W/F = 1.9–21.9 h, Reactiontemperature = 400 �C, Carrier gas = H2, Pressure = 1 atm.
Table 2Effect of carrier gas.
Reaction condition Initial 6 h on stream
H2 He H2 He
% Conversion 84.52 74.25 79.08 37.84
% YieldMethane 2.30 0.36 1.67 0.11Benzene 10.67 12.89 7.33 0.88Toluene 23.54 14.03 16.44 1.82Xylene 10.04 2.56 6.45 0.25Other hydrocarbon 1.87 3.37 1.36 0.68Phenol 14.07 22.55 15.72 12.33Oxygenated compound 22.03 18.49 30.09 21.78Total yield 84.52 74.25 79.08 37.84
% SelectivityMethane 2.72 0.49 2.12 0.28Benzene 12.62 17.36 9.27 2.32Toluene 27.85 18.90 20.80 4.80Xylene 11.88 3.45 8.16 0.67Other hydrocarbon 2.22 4.54 1.72 1.79Phenol 16.65 30.36 19.88 32.58Oxygenated compound 26.06 24.90 38.06 57.56Total selectivity 100.00 100.00 100.00 100.00
Toluene/benzene ratio 2.21 1.09 2.24 2.07
Reaction condition: Catalyst = 3Ga/HBeta, W/F = 6.3 h,Reaction temperature = 450 �C, carrier gas = H2 or He, pressure = 1 atm.
0 1 2 3 4 5 630
40
50
60
70
80
90
Toluene/Benzene ratio under He
Toluene/Benzene ratio under H2
Conversion of m-cresol under He
TOS (h)
% C
onve
rsio
n
Conversion of m-cresol under H2
1
2
3
Toluene/Benzene ratio
Fig. 6. Effect of carrier gas Reaction conditions: Catalyst = 3Ga/HBeta, W/F = 6.3 h,Reaction temperature = 450 �C, Carrier gas = H2 or He, Pressure = 1 atm.
94 A. Ausavasukhi et al. / Journal of Catalysis 290 (2012) 90–100

Author's personal copy
significantly reduced, indicating that these products are not onlyproduced less by the reduction in Brønsted site density, but alsomore effectively hydrogenolyzed by the Ga species. To make amore direct comparison, we included in Table 3 the product distri-bution on the HBEA catalyst at the same overall conversion. It isclear that without Ga, the zeolite produces only small amountsof toluene or benzene, but mostly phenol and condensationcompounds.
As shown in Fig. 7, increasing the reaction temperature in the400–550 �C range not only shows a clear increase in m-cresol con-version over 3Ga/HBEA, but also causes significant changes inproduct distribution. The selectivity to methane, C2AC6 hydrocar-bons, benzene, toluene, and xylene increased with temperature,while that to phenol and oxygenated compounds decreased. Infact, this should be the expected trend if, as proposed, the deoxy-genated compounds derive from CAO and CAC hydrogenolysis ofphenol and other oxygenated compounds. These reactions haverelatively high activation energies.
Table 4 compares the product yields obtained over the differentcatalysts under the same reaction conditions (i.e., W/F = 6.3 h,
450 �C, under H2 flow). Clearly, the Ga/HBEA is the most active cat-alyst among those investigated in this work. For the same Ga load-ing, Ga/HBEA is more active than Ga/HMFI and much more thanGa/SiO2.
The observed difference in the activity of the two zeolites ismost likely related to their different structure. Diffusion of a ratherbulky molecule such as m-cresol may be more inhibited within therestricted pores of ZSM-5 than in the larger pores of Beta zeolite. Asmentioned above, while the crystallite sizes of the two zeolites arenot identical, they are very close. The SEM and XRD data in Figs. 4aand b show that the impregnation with Ga and subsequent calcina-tion do not result in crystallinity changes or changes in crystallitesize. At the same time, BET measurements show that there are nosignificant losses in pore volume. Therefore, the transport of reac-tants and particularly the observed differences in activity betweenMFI- and BEA-supported catalysts are probably more affected bythe zeolite pore size than by the size of the crystallites.
The reason for low conversion and low selectivity to light aro-matics obtained on Ga/SiO2 may be twofold. First, silica is not aneffective support for stabilizing highly dispersed Ga species (seeTPR results). Second, silica does not contain any significant acidity,which seems to play a role in the conversion of cresol, as evidencedby the relatively high activity exhibited by the Ga-free zeolites(HBEA and HMFI).
3.3. Temperature-programmed decomposition and desorption (TPDD)after reaction
After a period of 6 h under reaction conditions (m-cresol/H2),the decomposition/desorption of the species left on the surface ofthe 3Ga/HBEA catalyst was conducted by first cooling the catalystin He to 100 �C and then linearly increasing the temperature to900 �C under the flow of H2. As shown in Fig. 8a, the evolution oflight aromatics, namely benzene (m/z = 78) and toluene (m/z = 91), was significant in the 250–450 �C range, together with lighthydrocarbons, namely methane (m/z = 15) and other hydrocarbons(m/z = 27, 41, 56). Above 550 �C, small amounts of high m/z ionfragments (m/z = 168) were observed. These heavy fragments aresuggested to arise from bicyclic oxygenates, which most probablyresult from cracking of a surface pool of oxygenated compounds.This cracking (or hydrogenolysis) is accompanied by a significantH2 consumption and production of water (see Fig. 8b).
3.4. Pulse experiments
To quantify the fraction of m-cresol that gets trapped inside thezeolite at 450 �C, a series of m-cresol pulses were injected into theHe carrier gas of the H2-pretreated 3Ga/HBEA catalyst. Fig. 9 showsthe area count from the FID signal observed at the reactor outlet fora series of 2.3 lmol m-cresol pulses injected over a 20-mg catalystbed. The graph compares the observed signal after the reactor withthat observed when the pulses are sent through the bypass. Toshow more meaningful numbers, the signal is converted to equiv-alent lmols of m-cresol. The important conclusion from this exper-iment is that it is demonstrated that the Ga/HBEA catalyst traps alarge fraction of the m-cresol passing through the bed. As morepulses are sent and the catalyst deactivates due to this irreversibleadsorption, the amount of species trapped decreases.
Next, to determine whether these trapped species (or surfacepool) are reactive intermediates or just deactivating (coke) depos-its, we have sent pulses of H2 over the same sample after connect-ing the reactor outlet to a GC/FID. The results are summarized inTable 5. Interestingly, no products were evolved upon sending apulse of H2 over the sample that was exposed to the entire seriesof 17 pulses, indicating that this sample was completely deacti-vated. By contrast, with one m-cresol injection, the amount of
Table 3Effect of Ga content in the catalyst.
Betazeolite H H 1Ga/H 3Ga/H 6Ga/HTemperature (�C) 450 400 400 400 400
% Conversion 70.45 55.51 70.76 70.56 71.64
% YieldMethane 0.70 0.87 1.43 1.32 1.55Benzene 0.80 0.68 3.24 3.45 6.12Toluene 1.59 2.90 8.74 9.45 21.67Xylene 0.54 1.38 3.56 3.20 5.40Other hydrocarbon 2.45 2.83 3.75 3.30 4.80Phenol 18.22 32.00 19.76 23.61 24.66Oxygenated compound 46.16 14.83 30.28 26.23 7.44Total yield 70.45 55.51 70.76 70.56 71.64
% SelectivityMethane 0.99 1.58 2.02 1.87 2.17Benzene 1.14 1.23 4.58 4.89 8.54Toluene 2.25 5.23 12.35 13.39 30.25Xylene 0.76 2.49 5.03 4.54 7.53Other hydrocarbon 3.47 5.10 5.30 4.67 6.70Phenol 25.86 57.65 27.93 33.45 34.42Oxygenated compound 65.51 26.71 42.79 37.18 10.39
Total selectivity 100.00 100.00 100.00 100.00 100.00
Reaction condition: W/F = 6.3 h,Reaction temperature = 400 and 450 �C, carrier gas = H2, pressure = 1 atm.
350 400 450 500 550 6000
20
40
60
80
100
% C
onve
rsio
n an
d %
Yie
ld
Temperature (oC)
conversion
Fig. 7. Effect of temperature yield of (d) methane, (N) benzene, (.) toluene, (h)xylene, (s) other hydrocarbons, (D) phenol, () oxygenates compounds Reactionconditions: Catalyst = 3Ga/HBeta, W/F = 6.3 h, Reaction temperature = 400–550 �C,Carrier gas = H2, Pressure = 1 atm.
A. Ausavasukhi et al. / Journal of Catalysis 290 (2012) 90–100 95

Author's personal copy
products evolved upon sending a subsequent pulse of H2 was sig-nificant, but depended on the time that passed between the m-cre-sol pulse and the subsequent H2 pulse.
It is important to point out that evolution of deoxygenatedproducts was observed even in the absence of added H2. That is,when the He stream leaving the reactor was analyzed 5 min afterthe m-cresol injection, benzene, toluene, and xylenes were ob-served. This product formation suggests that the species trappedinside the zeolite continue reacting under He flow. However, it ap-pears that after 45 min, the surface species either reacted com-pletely or transformed into more refractory surface species sinceno further product evolution occurred. The results obtained withH2 pulses indicate that the latter is true. That is, while 60 min afterthe m-cresol injection no product evolution was seen in He, theydid appear when we sent a H2 pulse.
Similarly, as also shown in Table 5, sending a first pulse of H2
5 min after m-cresol injection also yielded the same type of aro-matic products, but in significantly larger amounts than seen atthe reactor outlet without the addition of H2. Moreover, when asecond H2 pulse was sent 50 min after the first one, aromatic prod-ucts were still evolved. These interesting results indicated that the
Table 4Effect of support material.
Type of catalyst 3Ga/H Beta 3Ga/Silica 3Ga/H ZSM-5 H ZSM-5
% Conversion 82.78 4.49 40.32 41.69
% YieldMethane 2.25 0.78 0.34 1.50Benzene 10.45 0.15 1.24 1.24Toluene 23.06 0.32 8.90 2.00Xylene 9.84 0.00 0.86 0.00Other hydrocarbon (C2AC6) 1.83 0.00 0.90 1.50Phenol 13.78 2.82 19.91 23.90Oxygenated compound 21.57 0.41 8.18 11.55
Total yield 82.78 4.49 40.32 41.69
% SelectivityMethane 2.72 17.45 0.84 3.60Benzene 12.62 3.40 3.08 2.97Toluene 27.85 7.19 22.06 4.80Xylene 11.88 0.00 2.13 0.00Other hydrocarbon (C2AC6) 2.22 0.00 2.23 3.60Phenol 16.65 62.88 49.38 57.34Oxygenated compound 26.06 9.08 20.29 27.70
Total selectivity 100.00 100.00 100.00 100.00
Reaction condition: Catalyst = 3Ga/HBeta, 3Ga/Silica, 3Ga/HZSM-5, and HZSM-5, W/F = 6.3 h, reaction temperature = 450 �C, carrier gas = H2, pressure = 1 atm.
100 200 300 400 500 600 700 800 900 10000.0
1.0x10⁻²
2.0x10⁻²
3.0x10⁻²
4.0x10⁻²
5.0x10⁻²
6.0x10⁻²
7.0x10⁻²
m/z = 168
m/z = 94
m/z = 91
m/z = 78
m/z = 56
m/z = 41
m/z = 27
MS
sign
al (A
.U.)
Temperature (oC)
m/z = 15
Fig. 8a. TPD of 3Ga/HBeta after m-cresol conversion at 400 �C.
200 300 400 500 600 700 800 900
-1.0
-0.8
-0.6
-0.4
-0.2
0.0
0.2
0.4m/z = 18
MS
sign
al (A
.U.)
Temperature (oC)
m/z = 2
Fig. 8b. TPD of 3Ga/HBeta after m-cresol conversion at 400 �C.
0
0.2
0.4
0.6
0.8
1
1.2
1.4
0 5 10 15 20
tota
l out
put (
mic
ro m
ol)
m-cresol pulse No.
Fig. 9. Total output, expressed as m-cresol equivalent, from 17 consecutive pulsesof 2.3 lmol m-cresol sent over a 20-mg 3Ga/HBEA catalyst at 450 �C.
96 A. Ausavasukhi et al. / Journal of Catalysis 290 (2012) 90–100
Author's personal copy
presence of added H2 indeed enhances the deoxygenation reactionof the trapped phenolic species, which are unreactive under He.
4. Discussion
Although phenol is the dominant product at low space times, itis not necessarily a primary product formed by direct CAC hydrog-enolysis of m-cresol to phenol. If that were the case, methaneshould be produced in equimolar amounts. Therefore, direct deal-kylation may only provide a small fraction of the total phenol ob-served. Alternatively, since m-cresol readily adsorbs on the surfaceof the catalyst, it is possible that a major fraction of the feed getsstrongly adsorbed inside the zeolite, forming a ‘‘surface pool’’ ofoxygenated species [31]. Similar formation of a surface pool of oxy-genates and/or aromatic species trapped inside the nanocages ofthe zeolite has been proposed to play an important role in deter-mining the product distribution for several zeolite-catalyzed reac-tions such as MTG [37–40], aromatic disproportionation [41,42],and alkane aromatization [43].
As shown in the TPDD experiments described above, thesetrapped species can subsequently decompose via cracking orhydrogenolysis at the relatively high temperatures of the experi-ments to the observed products. In this case, a surface pool of
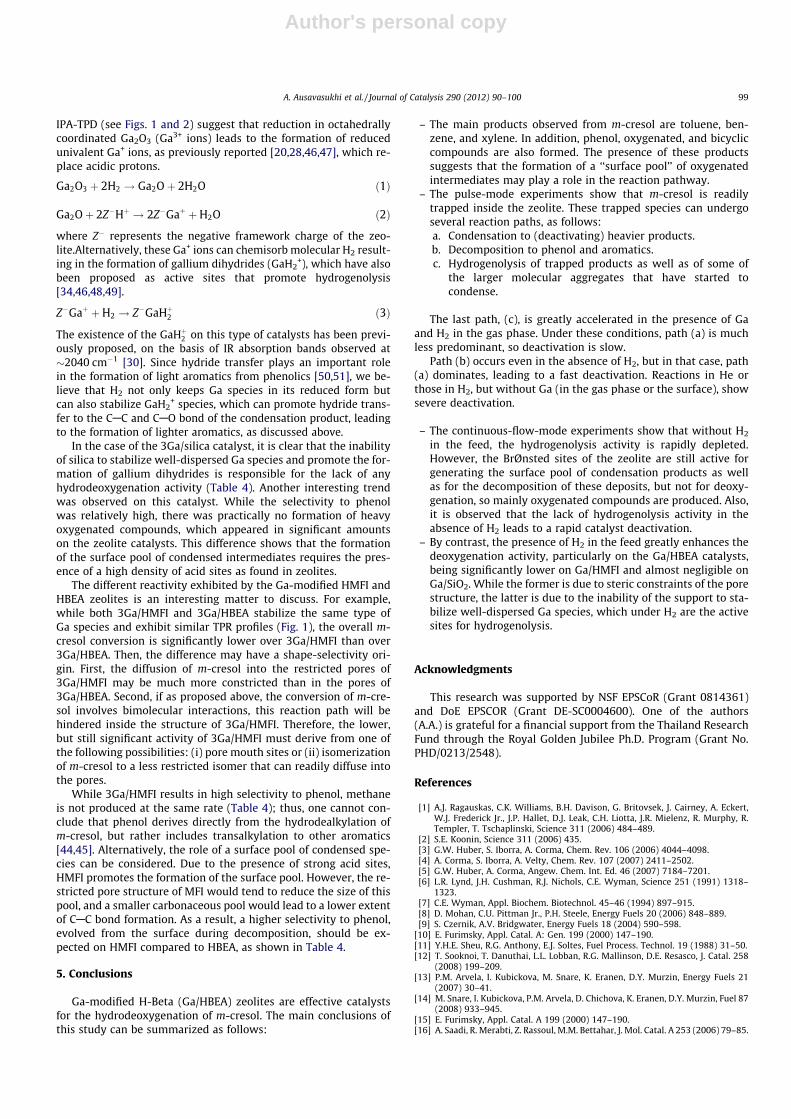
oxygenates would be the primary precursors for phenol and theobserved heavy oxygenated compounds. They can also be hydro-deoxygenated, producing the observed light aromatics (benzene,toluene, xylene) and light hydrocarbons (C2AC6 hydrocarbons).As the surface pool intermediate accumulates on the surface, directdealkylation of the feed (cresol) is further suppressed, leading tothe observed decrease in the methane/phenol molar ratio withtime on stream (Table 3). By contrast, as recently shown [44,45],acidic zeolites are very effective to catalyze the transalkylation ofphenolics and other oxygenated aromatics. Therefore, one can ex-pect that the methyl group from m-cresol can be transferred to an-other aromatic molecule instead of forming methane. In addition,at higher space time, phenol may re-adsorb and undergo furthersurface condensation in a manner similar to that described form-cresol. This phenomenon was confirmed in a separate experi-ment using phenol as a feed (not shown) over 3Ga/HBEA, whichgave products similar to those observed from m-cresol (i.e., ben-zene, toluene, xylene, and oxygenated compounds). Scheme 1summarizes the possible products and reaction pathways fromm-cresol.
One expects that direct cleavage of CAC and CAO bonds doesnot occur in the absence of hydrogen. However, as shown in Table5, hydrogenolysis (deoxygenated) products are observed for a shorttime after injection of m-cresol without added H2. As we have
Table 5Products evolved at 450 �C from the 3Ga/HBEA catalyst upon the injection of 2.3 lmoles of m-cresol followed by H2 pulses (or not). The time delay indicates the period of timethat passed between the m-cresol injection and the subsequent injection of H2 pulse or direct analysis in He, without H2. During this time, the catalyst was under He flow.
m-cresol exposure (no. of injections) Time delay in He (min) H2 pulse sent (0.5 cc) Benzene Toluene Xylenes Total products
17 60 Yes 0.0000 0.0000 0.0000 0.00001 60 Yes 0.0055 0.0032 0.0000 0.00871 5 Yes 0.15 0.18 0.03 0.361 55 Yes 0.0039 0.0030 0.0000 0.00691 5 Noa 0.10 0.13 0.02 0.261 45 Noa 0.0000 0.0000 0.0000 0.0000
a Direct GC analysis of products in the He stream, without H2 added.
Scheme 1. Reaction pathway for the conversion of m-cresol to aromatics, phenol, and trapped surface species.
A. Ausavasukhi et al. / Journal of Catalysis 290 (2012) 90–100 97

Author's personal copy
previously shown [31], the Ga/zeolite catalysts are able to retainhydrogen from a reductive pretreatment, forming Z�GaH2
+ species,which themselves react with the trapped surface species formingthe observed aromatics. However, this is a temporary effect thatdisappears after a few minutes in the absence of added hydrogen.
Hence, under He stream, the surface pool of intermediatesquickly accumulates and turns into irreversible deposits that leadto coke. While decomposition of the pool leads to the formation ofphenol and larger phenolic compounds during some time onstream, a rather rapid catalyst deactivation is observed (Fig 5). Thatis, H2 plays an important role in the formation of products via boththe direct CAC hydrogenolysis of m-cresol and the hydrogenation/hydrogenolysis of the surface pool intermediates. In particular,when H2 is present, the surface pool intermediates can be removedby hydrogenolysis to lighter aromatic products (benzene and
toluene), improving the catalyst stability. The balance betweenthese competing reaction pathways determines whether the cata-lyst shows stability or deactivates quickly, as described in Scheme 2.
The variation in activity with Ga loading deserves further dis-cussion. It is clear that the yield of light aromatics increased withthe Ga content, while the yield of oxygenated compounds de-creased (Table 4). The high hydrogenolysis activity of Ga is respon-sible for this trend, which is also observed at higher reactiontemperatures (Fig. 7). Higher temperatures facilitate the decompo-sition/hydrogenolysis of the surface pool intermediates, leavingmore available active sites for consecutive m-cresol adsorptionand conversion.
As discussed in our previous study [31], the Ga active sites thatcatalyze the hydrogenolysis of the condensation products of thesurface pool are Ga species, only generated under H2. TPR and
Scheme 2. Possible pathways for the formation of condensed oxygenates that lead to deactivation in parallel to hydrodeoxygenation via formation of GaH2+species, with
hydrogenolysis activity.
98 A. Ausavasukhi et al. / Journal of Catalysis 290 (2012) 90–100
Author's personal copy
IPA-TPD (see Figs. 1 and 2) suggest that reduction in octahedrallycoordinated Ga2O3 (Ga3+ ions) leads to the formation of reducedunivalent Ga+ ions, as previously reported [20,28,46,47], which re-place acidic protons.
Ga2O3 þ 2H2 ! Ga2Oþ 2H2O ð1Þ
Ga2Oþ 2Z�Hþ ! 2Z�Gaþ þH2O ð2Þ
where Z� represents the negative framework charge of the zeo-lite.Alternatively, these Ga+ ions can chemisorb molecular H2 result-ing in the formation of gallium dihydrides (GaH2
+), which have alsobeen proposed as active sites that promote hydrogenolysis[34,46,48,49].
Z�Gaþ þH2 ! Z�GaHþ2 ð3Þ
The existence of the GaHþ2 on this type of catalysts has been previ-ously proposed, on the basis of IR absorption bands observed at�2040 cm�1 [30]. Since hydride transfer plays an important rolein the formation of light aromatics from phenolics [50,51], we be-lieve that H2 not only keeps Ga species in its reduced form butcan also stabilize GaH2
+ species, which can promote hydride trans-fer to the CAC and CAO bond of the condensation product, leadingto the formation of lighter aromatics, as discussed above.
In the case of the 3Ga/silica catalyst, it is clear that the inabilityof silica to stabilize well-dispersed Ga species and promote the for-mation of gallium dihydrides is responsible for the lack of anyhydrodeoxygenation activity (Table 4). Another interesting trendwas observed on this catalyst. While the selectivity to phenolwas relatively high, there was practically no formation of heavyoxygenated compounds, which appeared in significant amountson the zeolite catalysts. This difference shows that the formationof the surface pool of condensed intermediates requires the pres-ence of a high density of acid sites as found in zeolites.
The different reactivity exhibited by the Ga-modified HMFI andHBEA zeolites is an interesting matter to discuss. For example,while both 3Ga/HMFI and 3Ga/HBEA stabilize the same type ofGa species and exhibit similar TPR profiles (Fig. 1), the overall m-cresol conversion is significantly lower over 3Ga/HMFI than over3Ga/HBEA. Then, the difference may have a shape-selectivity ori-gin. First, the diffusion of m-cresol into the restricted pores of3Ga/HMFI may be much more constricted than in the pores of3Ga/HBEA. Second, if as proposed above, the conversion of m-cre-sol involves bimolecular interactions, this reaction path will behindered inside the structure of 3Ga/HMFI. Therefore, the lower,but still significant activity of 3Ga/HMFI must derive from one ofthe following possibilities: (i) pore mouth sites or (ii) isomerizationof m-cresol to a less restricted isomer that can readily diffuse intothe pores.
While 3Ga/HMFI results in high selectivity to phenol, methaneis not produced at the same rate (Table 4); thus, one cannot con-clude that phenol derives directly from the hydrodealkylation ofm-cresol, but rather includes transalkylation to other aromatics[44,45]. Alternatively, the role of a surface pool of condensed spe-cies can be considered. Due to the presence of strong acid sites,HMFI promotes the formation of the surface pool. However, the re-stricted pore structure of MFI would tend to reduce the size of thispool, and a smaller carbonaceous pool would lead to a lower extentof CAC bond formation. As a result, a higher selectivity to phenol,evolved from the surface during decomposition, should be ex-pected on HMFI compared to HBEA, as shown in Table 4.
5. Conclusions
Ga-modified H-Beta (Ga/HBEA) zeolites are effective catalystsfor the hydrodeoxygenation of m-cresol. The main conclusions ofthis study can be summarized as follows:
– The main products observed from m-cresol are toluene, ben-zene, and xylene. In addition, phenol, oxygenated, and bicycliccompounds are also formed. The presence of these productssuggests that the formation of a ‘‘surface pool’’ of oxygenatedintermediates may play a role in the reaction pathway.
– The pulse-mode experiments show that m-cresol is readilytrapped inside the zeolite. These trapped species can undergoseveral reaction paths, as follows:a. Condensation to (deactivating) heavier products.b. Decomposition to phenol and aromatics.c. Hydrogenolysis of trapped products as well as of some of
the larger molecular aggregates that have started tocondense.
The last path, (c), is greatly accelerated in the presence of Gaand H2 in the gas phase. Under these conditions, path (a) is muchless predominant, so deactivation is slow.
Path (b) occurs even in the absence of H2, but in that case, path(a) dominates, leading to a fast deactivation. Reactions in He orthose in H2, but without Ga (in the gas phase or the surface), showsevere deactivation.
– The continuous-flow-mode experiments show that without H2
in the feed, the hydrogenolysis activity is rapidly depleted.However, the BrØnsted sites of the zeolite are still active forgenerating the surface pool of condensation products as wellas for the decomposition of these deposits, but not for deoxy-genation, so mainly oxygenated compounds are produced. Also,it is observed that the lack of hydrogenolysis activity in theabsence of H2 leads to a rapid catalyst deactivation.
– By contrast, the presence of H2 in the feed greatly enhances thedeoxygenation activity, particularly on the Ga/HBEA catalysts,being significantly lower on Ga/HMFI and almost negligible onGa/SiO2. While the former is due to steric constraints of the porestructure, the latter is due to the inability of the support to sta-bilize well-dispersed Ga species, which under H2 are the activesites for hydrogenolysis.
Acknowledgments
This research was supported by NSF EPSCoR (Grant 0814361)and DoE EPSCOR (Grant DE-SC0004600). One of the authors(A.A.) is grateful for a financial support from the Thailand ResearchFund through the Royal Golden Jubilee Ph.D. Program (Grant No.PHD/0213/2548).
References
[1] A.J. Ragauskas, C.K. Williams, B.H. Davison, G. Britovsek, J. Cairney, A. Eckert,W.J. Frederick Jr., J.P. Hallet, D.J. Leak, C.H. Liotta, J.R. Mielenz, R. Murphy, R.Templer, T. Tschaplinski, Science 311 (2006) 484–489.
[2] S.E. Koonin, Science 311 (2006) 435.[3] G.W. Huber, S. Iborra, A. Corma, Chem. Rev. 106 (2006) 4044–4098.[4] A. Corma, S. Iborra, A. Velty, Chem. Rev. 107 (2007) 2411–2502.[5] G.W. Huber, A. Corma, Angew. Chem. Int. Ed. 46 (2007) 7184–7201.[6] L.R. Lynd, J.H. Cushman, R.J. Nichols, C.E. Wyman, Science 251 (1991) 1318–
1323.[7] C.E. Wyman, Appl. Biochem. Biotechnol. 45–46 (1994) 897–915.[8] D. Mohan, C.U. Pittman Jr., P.H. Steele, Energy Fuels 20 (2006) 848–889.[9] S. Czernik, A.V. Bridgwater, Energy Fuels 18 (2004) 590–598.
[10] E. Furimsky, Appl. Catal. A: Gen. 199 (2000) 147–190.[11] Y.H.E. Sheu, R.G. Anthony, E.J. Soltes, Fuel Process. Technol. 19 (1988) 31–50.[12] T. Sooknoi, T. Danuthai, L.L. Lobban, R.G. Mallinson, D.E. Resasco, J. Catal. 258
(2008) 199–209.[13] P.M. Arvela, I. Kubickova, M. Snare, K. Eranen, D.Y. Murzin, Energy Fuels 21
(2007) 30–41.[14] M. Snare, I. Kubickova, P.M. Arvela, D. Chichova, K. Eranen, D.Y. Murzin, Fuel 87
(2008) 933–945.[15] E. Furimsky, Appl. Catal. A 199 (2000) 147–190.[16] A. Saadi, R. Merabti, Z. Rassoul, M.M. Bettahar, J. Mol. Catal. A 253 (2006) 79–85.
A. Ausavasukhi et al. / Journal of Catalysis 290 (2012) 90–100 99

Author's personal copy
[17] G.F. Santori, M.L. Casella, O.A. Ferretti, J. Mol. Catal. A 186 (2002) 223–239.[18] P. Dana, Z. Petr, B. Martina, C. Libor, C. Jiri, Appl. Catal. A 332 (2007) 56–64.[19] A. Saadi, Z. Rassoul, M.M. Bettahar, J. Mol. Catal. A 164 (2000) 205–216.[20] J.A. Biscardi, E. Iglesia, Catal. Today 31 (1996) 207–231.[21] G.J. Buckles, G.J. Hutchings, Catal. Today 31 (1996) 233–246.[22] V.I. Hart, M.B. Bryant, L.G. Butler, X. Wu, K.M. Dooley, Catal. Lett. 53 (1998)
111–118.[23] B.S. Kwak, W.M.H. Sachtler, W.O. Haag, J. Catal. 149 (1994) 465–473.[24] B.S. Kwak, W.M.H. Sachtler, J. Catal. 145 (1994) 456–463.[25] A. Montes, G. Giannetto, Appl. Catal. A 197 (2000) 31–39.[26] P. Meriaudeau, C. Naccache, J. Catal. 157 (1995) 283–288.[27] P. Meriaudeau, G. Sapaly, G. Wicker, C. Naccache, Catal. Lett. 27 (1994) 143–148.[28] G.L. Price, V. Kanazirev, J. Catal. 126 (1990) 267–278.[29] V. Kanazirev, G.L. Price, K.M. Dooley, Stud. Surf. Sci. Catal. 69 (1991) 277–285.[30] V.B. Kazansky, I.R. Subbotina, R.A. van Santen, E.J.M. Hensen, J. Catal. 227
(2004) 263–269.[31] A. Ausavasukhi, T. Sooknoi, D.E. Resasco, J. Catal 268 (I) (2009) 68–78.[32] Z. Ji-Lu, J. Anal. Appl. Pyrol. 80 (2007) 30–35.[33] T.J. Gricus Kofke, R.J. Gorte, G.T. Kokotailo, W.E. Farneth, J. Catal. 115 (1989)
265–272.[34] I. Nowak, J. Quartararo, E.G. Derouane, J.C. Vedrine, Appl. Catal. A 251 (2003)
107–120.[35] P. Meriaudeau, C. Naccache, Appl. Catal. 73 (1991) L13–L18.
[36] S. Svelle, P.O. Rønning, S. Kolboe, J. Catal. 224 (2004) 115–123.[37] F.C. Patcas, J. Catal. 231 (2005) 194–200.[38] M. Bjørgen, U. Olsbye, D. Petersen, S. Kolboe, J. Catal. 221 (2004) 1–10.[39] M. Seiler, W. Wang, A. Buchholz, M. Hunger, Catal. Lett. 88 (2003) 187–191.[40] W. Song, H. Fu, J.F. Haw, J. Am. Chem. Soc. 123 (2001) 4749–4754.[41] N.R. Meshram, S.G. Hegde, S.B. Kulkarni, P. Ratnasamy, Appl. Catal. 8 (1983)
359–367.[42] V. Mavrodinova, M. Popova, Catal. Commun. 6 (2005) 247–252.[43] E. Iglesia, J.E. Baumgartner, G.L. Price, J. Catal. 134 (1992) 549–571.[44] Xinli. Zhu, Richard G. Mallinson, Daniel E. Resasco, Appl. Catal. A 379 (2010)
172–181.[45] X. Zhu, L.L. Lobban, R.G. Mallinson, D.E. Resasco, J. Catal. 281 (2011) 21–29.[46] K.M. Dooley, C. Chang, G.L. Price, Appl. Catal. A 84 (1992) 17–30.[47] G.D. Meitzner, E. Iglesia, J.E. Baumgartner, E.S. Huang, J. Catal. 140 (1993) 209–
225.[48] G.S. Pokrovski, J. Schott, J.L. Hazemann, F. Farges, O.S. Pokrovsky, GeoChimi.
Cosmochimi. Acta. 66 (2002) 4203–4220.[49] E.S. Shpiro, D.P. Shevchenko, O.P. Tkachenko, R.V. Dmitriev, Appl. Catal. 107
(1994) 147–164.[50] T. Prasomsri, R.E. Galiasso-Tailleur, W.E. Alvarez, T. Sooknoi, D.E. Resasco, Appl.
Catal. A 389 (2010) 140–146.[51] T. Prasomsri, A.T. To, S. Crossley, W.E. Alvarez, D.E. Resasco, Appl. Catal. B:
Environ. 106 (2011) 204–211.
100 A. Ausavasukhi et al. / Journal of Catalysis 290 (2012) 90–100