author's personal copy - sands lab
TRANSCRIPT

This article appeared in a journal published by Elsevier. The attachedcopy is furnished to the author for internal non-commercial researchand education use, including for instruction at the authors institution
and sharing with colleagues.
Other uses, including reproduction and distribution, or selling orlicensing copies, or posting to personal, institutional or third party
websites are prohibited.
In most cases authors are permitted to post their version of thearticle (e.g. in Word or Tex form) to their personal website orinstitutional repository. Authors requiring further information
regarding Elsevier’s archiving and manuscript policies areencouraged to visit:
http://www.elsevier.com/copyright

Author's personal copy
Efficient application identification and the temporaland spatial stability of classification schema
Wei Li a,*, Marco Canini b,1, Andrew W. Moore a, Raffaele Bolla b
a Computer Laboratory, University of Cambridge, Cambridge, United Kingdomb DIST, University of Genoa, Genoa, Italy
a r t i c l e i n f o
Article historyAvailable online 11 December 2008
Keywords:Traffic classificationApplication identificationDeep-packet inspectionMachine learningTemporal decaySpatial stability
a b s t r a c t
Motivated by the importance of accurate identification for a range of applications, thispaper compares and contrasts the effective and efficient classification of network-basedapplications using behavioral observations of network-traffic and those using deep-packetinspection.
Importantly, throughout our work we are able to make comparison with data possessingan accurate, independently determined ground-truth that describes the actual applicationscausing the network-traffic observed.
In a unique study in both the spatial-domain: comparing across different network-loca-tions and in the temporal-domain: comparing across a number of years of data, we illus-trate the decay in classification accuracy across a range of application–classificationmechanisms. Further, we document the accuracy of spatial classification without trainingdata possessing spatial diversity.
Finally, we illustrate the classification of UDP traffic. We use the same classificationapproach for both stateful flows (TCP) and stateless flows based upon UDP. Importantly,we demonstrate high levels of accuracy: greater than 92% for the worst circumstanceregardless of the application.
� 2008 Elsevier B.V. All rights reserved.
1. Introduction
Network-security, accounting, traffic engineering, andnew class-of-service offerings – each is an example of anetwork-service facility that is made possible by the accu-rate identification of network-based traffic. Another exam-ple of the need for accurate identification would be thedesire of some Internet Service Providers to cope withthe continual rise of peer-to-peer (P2P) usage by throttlingnetwork-traffic identified as P2P file-downloading. The
challenges posed for organizations faced with the develop-ment of new types of network usage focuses attention onthe use of application–identification and the need to doso accurately.
In this paper, we explore the effective and efficient clas-sification of network-based applications using only the ob-served network-traffic. We conduct a four-way comparisonof application–identification methods: contrasting com-mon industry-standard methods such as known port num-bers and deep-packet inspection with Naïve Bayes and theC4.5 decision tree method.
We conduct an assessment of our method using realtraffic collected over a number of years on two differentsites. This enables both assessment of the individual accu-racy and, more usefully, the temporal and spatial stabilityof our models. The temporal stability measures how accu-rately traffic is being identified for each period, therebyrevealing how accurate a method will remain over time.
1389-1286/$ - see front matter � 2008 Elsevier B.V. All rights reserved.doi:10.1016/j.comnet.2008.11.016
* Corresponding author. Tel.: +44 (0) 1223 763 500; fax: +44 (0) 1223334678.
E-mail addresses: [email protected] (W. Li), [email protected](M. Canini), [email protected] (A.W. Moore), [email protected] (R. Bolla).
1 This work was done while the author was visiting the ComputerLaboratory, University of Cambridge.
Computer Networks 53 (2009) 790–809
Contents lists available at ScienceDirect
Computer Networks
journal homepage: www.elsevier .com/locate /comnet

Author's personal copy
The spatial stability describes how models will performacross different sites. Both assessments serve to provideinsight into what is required to build models that willremain accurate regardless of such time and locationheterogeneity.
1.1. Motivation
Traffic classification remains a fundamental problem inthe network community. As noted above, this supportsnumerous network activities from network management,monitoring and Quality-of-Service, to providing trafficmodels and data for simulation, forecast and application-specific investigations.
However, the continual growth in the diversity of appli-cations, number of hosts and traffic volume on the Internethas been a challenge for methods to classify network-traf-fic according to the applications. The level of continuousdevelopment is only predicted to continue to grow.
Despite a number of approaches on traffic classificationin the past, for example [1–6], the problem continues to bea significant challenge. In large part this is because:
(1) Internet traffic is not easily classified using the stan-dard International Assigned Number Authority(IANA) port number list [7]. Emerging applicationsand proxies often avoid the use of standard portnumbers.
(2) Further, port numbers and protocol signatures maybe insufficient to determine the actual application.There is, in principle, no rigid bound between appli-cations and the underlying protocols. For example,applications such as MSN Messenger, BitTorrentand Gnutella may explicitly use the HTTP protocoland port 80; while Skype clients may operate serverson ports 80 and 443.
(3) There is a growing proportion of encrypted orencapsulated traffic. Examples include SOCKS prox-ies, VPN and VPN-like solutions, tunneling andapplications that encapsulate data using a differentprotocol (e.g., GetByMail [8]). Encapsulation willchange the patterns in the original protocol, whilepacket encryption renders the payload-inspectionmechanisms unusable.
1.2. Classification of network-based applications
While relevant to all classification work, a discussion ofthe precise nature of classification and the many applica-tions of classification is beyond the scope of this paper.However, we feel it appropriate to mention that the classi-fication may take a variety of forms – often related to howthe class information is being used.
The uses of classification systems may also have differ-ent requirements dependent upon different fidelity of re-call (different numbers of classes) and different levels ofprecision. An operation-console system may be tolerantof a 10% error rate but a scheme for application-differentialbilling may need a large number of classes and a highprecision.
A motivation of this work is the classification of net-work application traffic into discrete application categoriesin a real-time environment. Our specific underlying moti-vations for such classification is to (a) monitor the applica-tion-mix in the traffic using a low-overhead (payload-less)mechanism, (b) enable application-specific handling oftraffic, and to (c) derive application-specific traffic modelsand study the impact of each type of application on thenetwork.
Further, we focus on application categories instead of aparticular protocol or application. This is because: (a) aprotocol only implements the design of an applicationbut is not bounded by it. One can design a range of networkprotocols that implement the same functionality. HTTPprotocol is an example of this where people use HTTP asa transport service for many different purposes; and (b)there is ample opportunity for change and adaptation inthe specific details of an application over time. There existsconsiderable variety among both the different implemen-tations of an application and variety across the differentprotocol behaviors that may be used within an application.However, it is our assertion that an application exhibits abehavior or family of behaviors that are specific, and recog-nizable, irrespective of the implementation specifics. It isnot desirable to be specific about each protocol or eachapplication since they may change in popularity, designor simply disappear from use. Instead, we categorize eachapplication into a modest number of related classes, whichcan cover all the Internet traffic according to the applica-tion’s purpose (e.g., classify to CHAT rather than to‘‘GoogleTalk”). We hope the classifiers and the models thusabstracted from the traffic will capture the inherent natureof the types of applications, and exhibit both a high level ofaccuracy and a predictable level of stability over time.
In our classification scheme, the basic object is a flowdefined as a bi-directional session between two hosts un-iquely identified by the IP five-tuple {protocol (UDP orTCP), client-IP, server-IP, client-Port and server-Port}.TCP, being connection-oriented, cleanly defines the begin-ning and end of flow. A flow may be further delineatedbased upon which end is server or client: observation ofthe SYN packet is sufficient to determine this. For UDPthere is no specific demarcation for the start and end of aflow. A timeout mechanism, like that of Cisco NetFlow, isused to provide boundaries for flows based on the statelessUDP protocol or for flows of TCP where explicit flow-startor termination is not observed.
We define a number of mutual-exclusive applicationcategories, such as WEB-browsing, BULK transfer, MAILactivities, etc. The first column of Table 4 reports the fulllist of categories. This kind of taxonomy has been previ-ously used in [7,9]. It has been updated following the risein popularity or emergence of new application types suchas Voice-over-IP (VoIP) and instant messaging. It is in-tended that every network application would fall intoone of the categories. Our goal is to be able to label eachflow with the category of the application to which it be-longs. The label will depend only upon the actual applica-tion that generates the traffic: for example, a flow carryingan advertisement used by Napster would be labeled as P2P,even though it may use the HTTP protocol.
W. Li et al. / Computer Networks 53 (2009) 790–809 791

Author's personal copy
1.3. Contributions
This paper provides a number of unique contributions:
� We conduct a comparison among a number of classifica-tion schemes. Significantly, we only use data where wehave already established the ground-truth: the actualapplications causing the network-traffic observed.
� We train accurate models from data with a high-confi-dence ground-truth and an efficient, small, feature setderived from the reduction of a large flow feature listusing a sophisticated feature selection mechanism.
� We demonstrate the use of sub-sampling using start-of-flow to enable online classification; further, we demon-strate that the resultant online classification method hashigh accuracy.
� We carry out a unique temporal and spatial stabilitystudy on the four classification methods using data col-lected over a 4-year period and from two different sites.
� In contrast with much of the past work we examine theuse of multiple-application classifiers for both statefulflows (TCP) and stateless flows based upon UDP.
� We document the computational complexity and mea-sure the costs within the classification pipeline.
2. Network-traffic data
We examine network-data from two different sites.These two sites are both research-centric but conduct re-search in very different disciplines and are located in twodifferent countries. We refer to these two different sitesas Site A and Site B. Each of Site A and Site B have over athousand local users from a population of researchers,administrators and technical support staff. From Site A,we use 3-day-long data-sets taken on 3 weekdays in2003, 2004, and 2006 (denoted as Day1, Day2, and Day3,respectively). From Site B, we use one data-set recorded
on a weekday in late 2007 (denoted as SiteB). In both casesthe sites are connected to the Internet via a Gigabit Ether-net link. Each data-set captures full-duplex traffic at thesite border to the Internet.
For this paper, we selected 10 non-overlapping, ran-domly distributed periods, each approximately 30 minlong, from each of Day1 and Day2. We also randomly se-lected two 30 min periods from Day3, and a 30 min periodfrom SiteB. Table 1 summarizes the data-sets volumebreakdown by IP protocol type.
Further, as the TCP protocol semantic allows for a pre-cise definition of start and end of a flow, we concentrateupon complete TCP flows: those for which both the SYNhandshake and FIN handshake packets are observed – thuswe avoid the bias from flows which have started before theselected period. We recognize the incomplete flows haveincluded a number of long flows (e.g., FTP downloads)however, we are confident the use of such censored datahas not overly impacted our comparisons due to the smallamount of total data by packet or byte that it represents.We also observe that incomplete TCP flows are often com-posed of various kinds of scans and unsuccessful connec-tion attempts resulting in single SYN packets and nopayload data. This is a common phenomena in the Internet,part of what may be referred to as the Internet BackgroundRadiation and is well described in [10].
Table 2 lists the durations and workload dimensions ofour data-sets for complete TCP traffic and UDP traffic.
TCP traffic constitutes the great majority of the traffic inour data-sets, thus in the following we focus upon TCP traf-fic to investigate the classification schemes. We show inSection 4.6 the classification of UDP traffic using similartechniques as those introduced for TCP.
2.1. Traffic features
A feature is a descriptive statistic to characterize an ob-ject; and, ideally, each object exhibits different feature val-ues depending on the category to which it belongs. Basedon the features, models can be established using machinelearning techniques.
The features of a flow that we use for classification arecompletely derived from the packet headers: UDP, TCP andIP. These features describe the general behavior of a flow,for example, the size of transferred data in either direction,the packet size and inter-arrival time distributions, entro-py in the flow, and the first 10 components by FFT of pack-et inter-arrival times. Features include some higher levelheuristics such as the data exchange behavior in forms of
Table 1Data-set volume breakdown by IP protocol type.
Data-set Packets (%) Bytes (%)
TCP UDP Other TCP UDP Other
Day1 93.49 1.60 4.91 98.18 0.72 1.10Day2 97.87 1.59 0.55 99.33 0.42 0.25Day3 96.91 2.19 0.90 98.16 1.44 0.41SiteB 91.22 8.24 0.54 97.94 1.97 0.09
Table 2General workload dimensions of our data-sets.
Data-set Duration Flows Packets Bytes
TCP Day1 10 � 30 min 377 K 42 M 31 GBDay2 10 � 30 min 175 K 35 M 28 GBDay3 2 � 30 min 260 K 30 M 18 GBSiteB 1 � 30 min 250 K 11 M 7.1 GB
UDP Day1 1 � 30 min 25 K 197 K 41 MBDay3 1 � 30 min 46 K 592 K 242 MBSiteB 1 � 30 min 774 K 1.6 M 180 MB
792 W. Li et al. / Computer Networks 53 (2009) 790–809

Author's personal copy
flow-idle, keep-alive, interactive, or transferring data fromone end to the other. The complete feature set is fullydescribed in [11], and a sample of features is listed in Table3.
Fig. 1 shows how different types of service exhibit dif-ferent behavior in two groups each of two features: (1) var-iance of total bytes in packets (client to server) by the totalnumber of bytes sent in the initial window (client to ser-ver), and (2) count of packets with PUSH flag set in theTCP header (server to client) by minimum segment size(client to server). There is a clear opportunity to discrimi-nate between the flows of each application class using acombination of these features.
Collecting each feature from live traffic is associatedwith a computational cost equal or less than Oðn� log2nÞ,and a memory footprint equal or less than OðnÞ, where nis the number of packets in a flow used for extracting thefeature. The total cost of collecting K features is boundedby OðK � n� log2nÞ.
In order to improve the classifier performance and toreduce the computational cost of the classification work-flow, we select a feature subset. The selection criterionchooses features that are most relevant for the discrimina-tion of application classes while having the minimumredundancy with respect to each other. This feature-reduc-tion process is fully described in the Section 3.5.
We apply a correlation-based filtering mechanism toeach of the 10 Day1 periods. We observe that the featuresubsets selected by the algorithm possess moderately goodstability, and we manually pick 12 features which appearin at least one third of the feature subset. Table 3 gives alist of the feature subset. The selection-criteria here is toidentify the best-possible feature set which is both stableover time and independent of the location in the network.The feature subset are almost entirely dependent upon theactual applications on the end-hosts. Thus any classifica-tion model is able to maintain its accuracy over time andbe applied in different network-locations.
Without using the IANA port list or any prior knowledgeof port-application mapping, we still use port numbers astwo of the features in the feature subset. As our classifiersare built upon pre-classified data – for which we know theground-truth – the port number features used in the finalclassifier will maintain the association (as actually ob-
served) between pre-classified application classes and portnumbers.
2.2. Ground-truth
Ground-truth information is fundamental when assess-ing traffic classification mechanisms and to provide trust-worthy results. Therefore, we have given significantattention to obtaining accurate ground-truth for our com-parison data-sets. Every flow in each data-set has been la-beled with a corresponding application category. This isdone using a (human) supervised semi-automated, heuris-tic-based, data verification process. The process is detailedin [12] however, we provide an overview of the process inthis section. The use of a supervised, semi-automated, pro-cedure does not replace the manual verification processbut supplements it – allowing identification of theground-truth without sacrificing confidence.
The procedures for the computation of ground-truth arebased upon a variety of sources of the information abouteach flow. However, as detailed below, none of thesepieces of information are used in isolation – cross-valida-tion forms a critical part in the establishment of ground-truth. Without enumerating the derivative information:multiple-flow behavior or host-rôles, base sources of datainclude (in no particular order):
� packet payload contents,� well-known port numbers,� well-known host names and addresses (e.g., ftp.ker-
nel.org), and� background information about particular users, hosts,
and specific application behavior, e.g., P2P-networks.
We observed that flows belonging to the same serviceor application often share a subset of the IP five-tuple,notably, the {DstIp,DstPort}, {SrcIp,DstIp}, and {SrcIp,Src-Port} sub-tuples. Such an observation allows us to con-sider2 that flows bearing the same sub-tuples may belong
Table 3Properties of the subset of TCP features selected using a five-packet observation window. SU is the symmetrical uncertainty measurement, as fully described inSection 3.5.
Abbreviation Description SU Memoryoverhead
Computationalcomplexity
push_pkts_serv Count of all packets with push bit set in TCP header (server to client) 0.3165 O(1) O(n)init_win_bytes_clnt The total number of bytes sent in initial window (client to server & server to
client)0.2070 O(1) O(1)
init_win_bytes_serv 0.3422 O(1) O(1)avg_seg_size_serv Average segment size: data bytes divided by # packets (server to client) 0.3390 O(1) O(n)IP_bytes_med_clnt Median of total bytes in IP packet (client to server) 0.2011 O(n) Oðn� log2nÞact_data_pkt_clnt Count of packets with at least 1 byte of TCP data payload (client to server) 0.1722 O(1) O(n)data_bytes_var_serv Variance of total bytes in packets (server to client) 0.2605 O(n) O(n)min_seg_size_clnt Minimum segment size observed. (client to server) 0.2131 O(1) O(n)RTT_samples_clnt Total numbers of RTT samples found (client to server), see also [11] 0.2434 O(1) O(n)push_pkts_clnt Count of all packets with push bit set in TCP header (client to server) 0.2138 O(1) O(n)serv_port Server port 0.8378 O(1) O(1)clnt_port Client port 0.0760 O(1) O(1)
2 We re-iterate that this process relies on heavy human-supervision. Forexample, human-supervision takes the form of verification/confirmation ofa sample of flows that such inferences are true and valid.
W. Li et al. / Computer Networks 53 (2009) 790–809 793

Author's personal copy
to the same service or application. With this, the traffic canbe classified at a high level of aggregation, which may signif-icantly accelerate the process. The consistency between theapplication label and the sub-tuples was validated using twoday-long traces which have been previously classified withthe methodology described in [7], and using several seg-ments of new hand-classified data. The assumption holdsfor most cases with the exception of (1) tunneled traffic(e.g., VPN or SOCKS proxies), (2) multiple applications be-tween a server and a client (e.g., a server operating both mailand web services), and (3) HTTP traffic where the HTTP pro-tocol is used to relay non-web traffic (e.g., BitTorrent signal-ing traffic). Aside from a VPN subsystem where theapplication was independently established, we did not ob-serve other tunneled traffic in our data. However, in the fu-ture such traffic that could be grouped into its own category.For (2), we observe that the {SrcIp,DstIp} sub-tuple can com-plement the {DstIp,DstPort} sub-tuple after the latter hasbeen used to identify standard services. We addressed (3)by verifying (through manually derived signatures) all HTTPrequests and responses to find out what type of content theycarry and what kind of applications have been causing them.This process was documented in [13].
A set of payload signatures (derived from l7-filter [14])was used to provide an initial indication of an applicationbased upon its packet content. Extensive tests were carriedout to evaluate the signatures based on previously hand-classified data against several segments of new data. Theseresults allowed us to tune the signature set making it capa-ble of identifying 35 of the most popular protocols. Ofcourse, the signatures only provide one piece of evidencethat needs to be cross-validated within the process thatdetermines the ground-truth.
The verification process is accelerated by exploiting anumber of heuristic rules (e.g., tuple-based rules), and byworking upon larger traffic aggregations (e.g., servicesrather than individual flows) whenever possible. However,we followed the principle of making decisions only withvery high-confidence, e.g., when superior evidence from
two or more mutually independent information sourcesare validated.
Firstly, we consider whether the signature matching re-sults for a specific server:port appear to be strongly consis-tent, in which case we can reasonably assume that we haveidentified a particular service on that server:port. Severalcriteria are used to quantitatively justify the consistency:thresholds are specified to guarantee that at least a certainpercentage of flows as well as a minimum number of flowshave matched a specific signature. Additionally, only anexclusive subset of signatures is allowed to have matchedthe flows. This avoids situations where, for example, HTTPcaused by BitTorrent is labeled as web traffic. We appliedthis heuristic widely and particularly for those applicationswith a well-established signature.
Based on the assumption that flows between the sameIP addresses pair may be due to the same application, wecan verify such situations as FTP traffic between two hostsor HTTPS traffic as in many cases a web server runs bothstandard and secure HTTP services. We derived similarheuristics for streaming and VoIP applications. For exam-ple, RTSP appears within a TCP control channel while thedata are relayed on a unidirectional UDP stream. Also, aVoIP application may use a SIP session and a bi-directionalUDP stream.
A great amount of information can be inferred from thehost names. We base further heuristics on accumulatedknowledge about particular popular services (e.g., Google,MSN, eBay): for example, we may have a heuristic thatindicates HTTPS traffic to MSN servers is due to MSN mes-senger clients instead of browsers.
Finally, we consider the behavioral characteristics ofhosts due to overlay networks (subject to additional verifi-cation). This is particularly useful for the identification ofP2P traffic. Although a counter-example to this rule is thatSMTP traffic has a strong P2P-like behavior: SMTP serversmay act as both the recipients and the senders of emails.The assumption is that if a host is an SMTP server, all theflows generated from this host towards port 25 are mail
102 103100
101
102
103
104
Median of IP data bytes (server to client)The
num
ber o
f byt
es in
initi
al w
indo
w (c
lient
to s
erve
r)
Web−browsingMailBulk (ftp)AttackPeer−2−PeerDatabaseMultimediaServicesInteractive
100 101 102 103 104 105 106100
101
102
103
104
Variance of total bytes in packets (client to server)Tota
l num
ber o
f byt
es s
ent i
n in
itial
win
dow
(clie
nt to
ser
ver)
Web−browsingMailBulk (ftp)AttackPeer−2−PeerDatabaseMultimediaServicesInteractive
Fig. 1. Scattered plot of 5000 random selected samples from Day1.
794 W. Li et al. / Computer Networks 53 (2009) 790–809

Author's personal copy
traffic. In general, this heuristic is applicable for P2P trafficas long as the information about the port number can beutilized,3 and the assumption of the heuristic can be vali-dated. We applied this heuristic to verify a large numberof eDonkey and BitTorrent flows on port 4662 and 6881,respectively. Additionally, for P2P applications that userandom port numbers, we started from an initial set ofidentified peers and identified new peers that are con-tacted by previously known peers. For example, initial Sky-pe participants were identified using the information ofcentralized login servers, and new Skype nodes could beinferred by considering the hosts reached by a number of(e.g., at least three) known Skype peers.
We show the application category breakdown of TCPtraffic for each data-set in Table 4. As noted above, themeta-classes described in this table aggregate a numberof specific applications – a full application breakdown isprovided in [12] – although WEB deserves special com-ment. Throughout our work we refer to the applicationclass as meaning web-browsing alone. It is worth reiterat-ing that this class of traffic does not refer to data moved viaHTTP, nor to non-browser applications (such as a webmailserver providing data to Outlook – such data would beclassified as MAIL).
3. Classification methodologies
Several methods exist for classifying network-trafficand all of them fall into two broad classes: deterministic(hard) and probabilistic (soft) classification. As the namesuggests, deterministic classification assigns data pointsto one of several mutually exclusive traffic classes. This isdone by considering some metric that defines the distancebetween data points and by defining the class boundaries.On the other hand, probabilistic classification method clas-sifies data by assigning it a per-class membership-proba-bility. The per-class membership-probability may be
based on an artificial allocation of probabilities or be basedupon a priori experience. For example after trying to clas-sify a flow using this method, it could be observed thatwith a probability of 0.8 this flow belongs to the MAILclass, with probability 0.1 to WEB class and with probabil-ity 0.1 to BULK class. Class assignment is done by consider-ing the class with the largest probability. In the example,the flow will then be considered a member of the MAILclass.
In this paper, we document four methods for network-traffic classification. Two methods: port number and L7, aclassifier based upon deep-packet inspection, are bothdeterministic. Two alternatives: Naïve Bayes and the useof a C4.5 are probabilistic in nature.
We primarily focus on using C4.5 to capitalize on thefollowing properties of the decision tree algorithm:
(1) Sufficient accuracy. It is suggested in [6] that C4.5 isamong the most accurate methods for the problemof traffic classification. Further, we find it the mostaccurate one in a range of most popular supervisedlearning algorithms, using our particular featureset and observation window setup.
(2) Extremely low computational cost for classification.Its classification process only involves several condi-tional statements, which is the simplest form that aclassifier can be. This property ideally supports timeand resource-critical tasks such as real-time applica-tion operations.
Alongside the two probabilistic classification schemes,we also utilize a feature-reduction mechanism: the FastCorrelation-Based Filter. This mechanism allows us to sig-nificantly reduce the computational cost in collecting thefeatures and also helps to overcome the overfitting prob-lem in each of the probabilistic schemes.
We also note that our traffic classification work reliesupon the aggregation of packets into flows based uponthe IP five-tuples. We are aware of sophisticated datastructure and algorithm work such as [15]. Further, workin [16] shows that minimal hardware can permit tractable
Table 4Composition of TCP traffic in our data-sets. Applications shown are examples only. ‘‘–” denotes no traffic present.
Class By flows (%)/packets (%)/bytes (%) Applications
Day1 Day2 Day3 SiteB
WEB 84.558/22.529/29.438 80.198/16.383/17.623 84.077/27.381/25.456 85.557/70.876/69.456 Web browsers, web applicationsMAIL 8.682/6.777/7.904 9.384/1.884/1.763 1.530/0.867/0.811 4.377/7.506/6.683 IMAP, POP, SMTPBULK 3.800/69.483/60.569 6.146/80.850/79.372 2.058/67.201/69.881 0.223/8.310/11.905 FTP, wgetATTACK 0.787/0.084/0.132 0.562/0.016/0.002 0.013/0.002/0.001 1.614/0.578/0.075 Port scans, worms, viruses, sql
injectionsCHAT –/ –/ – –/ –/ – 0.025/0.013/0.004 0.204/0.195/0.059 MSN Messenger, Yahoo IM, JabberP2P 0.589/0.331/0.567 1.572/0.548/0.777 8.571/0.745/0.433 7.188/10.455/9.735 Napster, Kazaa, Gnutella, eDonkey,
BitTorrentDATABASE 0.862/0.387/0.703 1.483/0.253/0.400 3.531/3.589/3.196 –/ –/ – MySQL, dbase, OracleMULTIMEDIA 0.137/0.112/0.196 0.002/0.000/0.000 0.007/0.105/0.145 0.004/0.165/0.232 Windows Media Player, Real, iTunesVOIP –/ –/ – –/ –/ – 0.036/0.018/0.002 0.420/0.483/0.169 SkypeSERVICES 0.555/0.135/0.194 0.633/0.026/0.009 0.027/0.003/0.000 0.187/0.078/0.041 X11, DNS, IDENT, LDAP, NTPINTERACTIVE 0.027/0.156/0.285 0.021/0.040/0.053 0.124/0.076/0.071 0.128/1.261/1.552 SSH, TELNET, VNC, GotoMyPCGAMES 0.002/0.006/0.013 –/ –/ – –/ –/ – 0.060/0.027/0.007 Microsoft Direct PlayGRID –/ –/ – –/ –/ – –/ –/ – 0.037/0.066/0.084 Grid computing
3 We observed that many P2P nodes still use the well-known portnumbers.
W. Li et al. / Computer Networks 53 (2009) 790–809 795

Author's personal copy
implementation for handling 10 Gigabit/s live traffic.While not within the scope of this paper, such approachescombined with our methodology would effectively yield aline-rate, real-time traffic classification solution.
3.1. Port number
The port-based method relies on the use of well-knownports: the server port number may be used to identify traf-fic associated with a particular application.
This method sees common use as state of the art inmany operational environments and requires access onlyto the part in the packet header that contains the portnumbers.
As illustrated in Fig. 2, one should note that the serverport number is not equivalent to the destination port num-ber of the packets. They coincide only for packets sent inthe client to server direction. For example, the destinationport number is 80 for a packet directed to a Web server,while the source port number is 80 for a packet sent froma Web server. However, port-based classification uses theserver port number which is determined by observingthe first packet of a flow in the client to server direction.
In this paper, we use a list of well-known ports derivedfrom the official port assignments established by IANA. Inparticular, we consider only the official ports for port num-bers 61023. In this subset only 35 distinct ports appear inour traffic traces, and for just 16 of them the traffic is actu-ally using the protocol associated to the official portassignment.
3.2. Deep-packet inspection
The deep-packet inspection (DPI) method examineswhether a flow carries a well-known signature or followswell-known protocol semantics. Such operations areaccompanied by higher complexity and may require accessto more than a single packet’s payload. According to Mooreand Papagiannaki [7], specific flows may be classified pos-itively from their first packet (with payload data) alone.Nonetheless, other flows may need to be examined in moredetail and a positive identification may only be feasibleonce up to 1 KByte of payload data has been observed.
Signatures can be obtained from protocol specifications.This is relatively easy for open and published protocols.However, proprietary protocols are often neither opennor published, thus signatures must be derived from re-verse engineering of the protocols (e.g. [17]). Such a pro-
cess is arguably going to produce signatures that do notfully capture the underlying protocol semantics, yieldinginaccurate estimates of the traffic associated with thoseprotocols.
Aside from the need for payload access, a major draw-back of the payload-inspection method is that it cannothandle traffic with encrypted payloads. This has becomeincreasingly problematic as common and increasingly pop-ular applications turn to the use of encryption to evadedetection by deep-packet inspection techniques.
To classify the traffic in our traces we use the identifica-tion mechanisms of the open source DPI tool l7-filter [14].Because this tool is not intended as an offline, trace pro-cessing tool (it is intended to be deployed as part of the Li-nux iptables firewall for traffic shaping purposes), we use auser-space version of this tool [18]. We refer to this offlineversion as L7. This classifier re-assembles the data contentof a flow and identifies the application via pattern match-ing using regular expressions. A flow is marked as identi-fied as soon as a known pattern is found in at least oneof its directions. Only the first 10 packets of each floware considered.
3.3. Naïve Bayes with kernel estimation
In order to describe Naïve Bayesian classification it isuseful to consider a data sample x ¼ ðx1; . . . ; xnÞ. This is arealization of X ¼ fX1; . . . ;Xng such that each random var-iable Xi is described by m attributes fA1; . . . ;Amg (referredto as features) that can take numeric or discrete values.Xi ¼ ðAðiÞ1 ; . . . . . . ;AðiÞm Þ
T is then a random vector. As an exam-ple, for Internet traffic, AðiÞj may represent the mean inter-arrival time of packets in the flow i.
Assume now that there are k known classes of interest.Let C ¼ fc1; . . . ; ckg represent the set of all known classes.For each observed instance xi in x, there is a known map-ping C : x! C representing the membership of instancexi to a particular class of interest. The notation CðxiÞ ¼ cj
stands for ‘‘the instance xi belongs to the class cj”.Bayesian statistical conclusions about the class cj of an
unobserved flow y are based on probability conditionalon observing the flow y. This is called the posterior proba-bility and is denoted by pðcjjyÞ. The Bayes rule gives a wayof calculating this value:
pðcjjyÞ ¼pðcjÞf ðyjcjÞPcj
pðcjÞf ðyjcjÞ; ð1Þ
where pðcjÞ denotes the probability of obtaining class cj
independently of the observed data (prior distribution),f ðyjcjÞ is the distribution function (or the probability of ygiven cj) and the denominator acts as a normalizingconstant.
The goal of the supervised Bayes classification problemis to estimate f ðyjcjÞ, j ¼ 1; . . . ; k given some training set x.To do that, Naïve Bayes makes certain assumptions onf ð�jcjÞ such as the independence of Ais as well as the stan-dard Gaussian behavior of them. The problem is then re-duced to simply estimating the parameters of theGaussian distribution and the prior probabilities of cjs. Infact, Naïve Bayes is also capable of dealing with discrete
SOURCE DESTINATION
CLIENT SERVER
ADDRESSPORT
CLIENT IP SERVER IPCLIENT PORT SERVER PORT
SOURCE DESTINATIONADDRESSPORT
CLIENT IPSERVER IPCLIENT PORTSERVER PORT
Fig. 2. Relationship between client and server and source and destinationport numbers.
796 W. Li et al. / Computer Networks 53 (2009) 790–809

Author's personal copy
random features, which could represent the state of someflag of a flow, by treating them independently and usingthe frequencies of occurrences to estimate f ð�jcjÞ,j ¼ 1; . . . ; k.
3.4. C4.5 Decision tree
C4.5 is well-known as a discriminative decision treealgorithm where the classification will be definitive (to as-sign each data point one of the mutual-exclusive classes).
Input to C4.5 consists of a collection of training cases,each having a tuple of values for a fixed set of featuresF ¼ F1; F2; . . . ; Fk and a class. A feature Fa can be describedas continuous or discrete according to whether its valuesare numeric or nominal. The class C is discrete and has val-ues C1;C2; . . . ;Cx.
The goal is to learn, from the training cases, a function
DOMðA1Þ � DOMðA2Þ � � � � � DOMðAkÞ ! DOMðCÞ;
that maps from the feature values to a predicted class.As such the decision tree is a recursive structure where:
� a leaf node is labeled with a class value, or� a test node that has two or more outcomes, each linked
to a subtree.
To classify an object using C4.5, imagine the object to beclassified is initially at the top (root) of the tree. The objectwill go iteratively into a subtree as below, until it reaches aleaf node:
� if it is at a leaf node, the label associated with that leafbecomes the predicted class;
� if it is at a test node, when the outcome of the test isdetermined, it is moved to the top of the subtree for thatoutcome.
When training a model, the C4.5 learner uses informa-tion gain ratio to decide which feature goes into a testnode. The information gain ratio is defined as the normal-ized information gain (2), which is based on the entropy (5)of the random variables. It measures the correlation be-tween two random variables: a feature and a class labelin this case.
Given discrete random variables X and Y:
GAINRATIOðXjYÞ ¼ HðXÞ � HðXjYÞHðXÞ ; ð2Þ
IGðXjYÞ ¼ HðXÞ � HðXjYÞ; ð3Þ
where
HðXjYÞ ¼ �X
j
pðyjÞX
i
pðxijyjÞlog2pðxijyjÞ; ð4Þ
and
HðXÞ ¼ �X
xi
pðxiÞlog2pðxiÞ; ð5Þ
where pðxiÞ ¼ P½X ¼ xi�, pðyjÞ ¼ P½Y ¼ yj� and pðxjjxjÞ ¼P½X ¼ xijY ¼ yj�.
In principle, the learner iteratively looks for the bestfeature to partition the data points in a node. The one with
highest information gain ratio will be used to make thedecision in the node. The division continues until the nodebecomes a leaf node, or the number of training data pointsin the node is smaller than a given number.
Moreover, C4.5 has incorporated a large number ofimprovements such as error-reduced pruning, avoidingover-fitting, and dealing with missing values. We referthe reader to Quinlan [19] for further information.
3.5. Feature-space reduction
We use the Fast Correlation-Based Filter (FCBF) of Yuand Liu [20] along with a variation of a wrapper methodin determining the value of the threshold (described laterin this section). The FCBF filter method performs verywell in improving the performance of Naïve Bayes whencontrasted with other related techniques [20].
The correlation measure used in FCBF is based on thesymmetrical uncertainty. Using Eqs. (3) and (5), symmetri-cal uncertainty is defined in the following way:
SUðX; YÞ ¼ 2IGðXjYÞ
HðXÞ þ HðYÞ
� �: ð6Þ
Symmetrical uncertainty takes values in [0,1], where thevalue 1 means that the knowledge of either X or Y can in-duce the other, while 0 suggests that features X and Y arewholly independent. At this point, Eq. (6) has only been de-fined for nominal feature values,4 therefore FCBF will dis-cretize continuous features before the core analysis [20].
The FCBF algorithm selects good features via a twostage process by identifying:
� the relevance of a feature, and� the redundancy of a feature with respect to other
features.
To describe these concepts mathematically, let C denotethe random variable of traffic classes taking values in C.Further, let SUi;c and SUi;j denote the value of the symmet-ric uncertainty between Ai and C and between Ai and Aj,respectively. A feature Ai is believed to be relevant ifSUi;c P d, where d is some threshold value to be deter-mined by the user.
Identification of redundancy is often done by comput-ing the pairwise cross-correlations between features. How-ever, Yu and Liu [20] note that this method is quitecomputationally expensive and so the solution they pro-pose considers SU values, because symmetrical uncertaintycaptures pairwise cross-correlation information. As a re-sult, FCBF works in the following way. Initially, SUj;c ,1 6 j 6 m are calculated and features are ordered indescending order according to the values of SU. A set S iscreated, containing Ajs that satisfy SUj;c P d. Then, the fea-ture with the largest SUj;c (call it Ap) is compared to SUj;q,where Aq 2 S n Ap. If SUj;q P SUp;c , the feature Aq is consid-ered redundant and is therefore removed from S. The pro-cedure is repeated for all Ap’s in S. The complexity of thisalgorithm is Oðnm log mÞ.
4 Although it is possible to define it for continuous random variables, theestimation of probabilities is then much harder.
W. Li et al. / Computer Networks 53 (2009) 790–809 797

Author's personal copy
At last, the question arises as to how to determine theoptimal value of the threshold d. To overcome this diffi-culty, we use a wrapper method based upon the NaïveBayes algorithm, i.e. computational results of the NaïveBayes algorithm will be used to estimate the optimal valueof the threshold. This approach has the goal of maximizingsome measure of accuracy (e.g., percentage of correctlyclassified flows). The advantage of this approach is that itis less computationally expensive than the ‘‘forward selec-tion” or ‘‘backward elimination”, since only m cases areneeded to be checked compared to 2m � 1. In addition, thismethod significantly improves the predictive capability ofNaïve Bayes technique, and may also improve the accuracyof other machine learning mechanisms.
The following procedure is used to identify the bestnumber of features to be used for a particular training set:
(1) All features are ranked in order of importance as cal-culated by the FCBF method.
(2) We now wish to identify the most valuable features;to do this an independent set of test data is chosenand it is used to evaluate the performance of NaïveBayes classifier trained on different number offeatures.
(3) We train Naïve Bayes on the training set with n,where n 2 1 . . . m (recall m is the total number of fea-tures) and evaluate the resulting classifier on thetest set.
(4) Finally, we select the optimum value for n such thatit provides maximum classification accuracy whileminimizing the total number of features required.
This algorithm uses both filter and wrapper methods todetermine the optimal set of features [21].
4. Results and discussion
Using information collected from the first several pack-ets of the flow, we aim at building real-time classificationmodels. These models are trained offline due to the needof hand-classified ground-truth data. The testing phasehowever, can be automated and involves the followingthree-phase pipeline:
(1) grouping packets into flows,(2) calculating features from the flows, and(3) classifying the flows using the features and labeling
the flows.
Apart from accuracy, there are two further objectives inthe design of such a classification system:
Latency. Firstly, for certain tasks such as application-spe-cific routing, monitoring or anomaly detection,it is desirable for the latency prior to identifyinga flow be as low as possible.
Overhead. Both the memory footprint in aggregating thepackets and the computational complexity incalculating features increase proportionallywith the number of packets in each flow object.
Thus it behooves an architect to minimize thequantity of link-data required. Collecting allpackets of live traffic on a high-speed link willquickly exhaust the memory space for any com-modity hardware. However, by keeping fewerpackets of a flow in the memory, the systemwill be able to exchange a small error for ahigher throughput, thereby enabling the classi-fication systems’ operation on a high-speedlink.
4.1. Observation window
Theoretically, a flow classifier will be more accuratewhen given more relevant information collected from eachflow. However, the latency and computational overheadsin collecting features will increase in proportion to theobservation window size. This observation window maybe bounded in time, in the total number of packets, or both.
To provide a reasonable trade between accuracy, la-tency and throughput, one can choose to limit the numberof packets at the beginning of a flow from which to collectthe set of features. Formally, we define an observationwindow as a fixed window of a given number of packetsfrom the first packet in a flow (i.e., a SYN packet). Forexample, the feature ‘‘average payload bytes” is calculatedusing the sum of payload bytes in these packets divided bythe number of packets seen in the observation window.
To demonstrate how one might attend the accuracy/la-tency/throughput trade-off and to evaluate the perfor-mance of such a classification mechanism, we use asubset of 12 features and the C4.5 algorithm to identifyan appropriate observation window size. When collectingfeatures we also use a 15 s timeout alongside the limit onthe number of packets, that is, the observation window ter-minates when either the number of packets sums to thewindow size or the timeout occurs.
The classifier accuracy for different observation windowsizes varying from 4 to 10 is shown in Fig. 3. For these re-sults and in common throughout this work, we performour C4.5 and Naïve Bayes evaluations using the Weka[22] toolkit.
4 5 6 7 8 9 1099.6
99.65
99.7
99.75
99.8
99.85
99.9
99.95
Packet limit of the observation window (packets)
Cor
rect
ly c
lass
ified
flow
s %
Day1Day2Day3
Fig. 3. Relationship between accuracy and packet-limit using C4.5.
798 W. Li et al. / Computer Networks 53 (2009) 790–809

Author's personal copy
For all data-sets, the accuracy achieves a high valuewith a window size of five packets. The accuracy is compa-rable to the accuracy of using complete flows or largerobservation windows. This indicates that the behaviorshown in the first five packets contains rich informationto classify the flows.
The idea of early flow ‘‘fingerprinting” is also used byBernaille et al. [1] where they use a feature set composedof the sizes and directions of the first four data packets ofeach flow. In comparison, our method collects more infor-mation from fewer packets: our five observed packets in-clude the three start-of-flow packets common at thebeginning of each TCP flow. This results in lower overheadsand lower latency for our methods. We choose a windowsize of five packets for the results presented in the rest ofthis paper.
4.2. Methodology
In Section 4, we show both a range of results and com-parisons. These comprise:
(1) a 4-way accuracy comparison between the classifi-cation methods (Table 5),
(2) per-class accuracy on Day1, Day2, Day3, and SiteB,for C4.5 algorithm (Table 6),
(3) a 4-way general accuracy comparison between thetemporal decay property of classification methods(Figs. 4–6),
(4) per-class temporal decay between Day1-Day2,Day1-Day3, and Day2-Day3, for C4.5 algorithm(Table 7),
(5) a 4-way comparison between the spatial stability ofclassification methods with cross-site (Table 8) andmulti-site (Table 10) training on Day3 and SiteBdata-sets, along with per-class accuracy for C4.5algorithm (Tables 9 and 11),
(6) a 4-way accuracy comparison on UDP traffic (Table14), with detailed per-class results (Table 15) andtemporal and spatial stability (Tables 16 and 17),and
(7) a comparison of training and testing time betweenC4.5, Naïve Bayes and L7 methods (Table 18).
To evaluate the accuracy of the classifier on the sameday and same site (Section 4.3), for each flow we randomlyplace it into one of two data-sets (for example, with a prob-ability of 0.5 to create comparable-sized data-sets). Onedata-set serves as training set and the other data-set astesting set. We can repeat the division of data-sets usinga different seed for the random-number generator This al-lows a repeating of the process as many times as required,
Table 5Overall accuracy comparison across four classification methods.
Data-set C4.5 Naïve Bayes IANA ports L7 signature set (2008) L7 signature set (2003)
Day1 % flows 99.807 ± 0.021 96.663 ± 0.064 95.29 88.93 72.27% packets 99.711 ± 0.026 82.050 ± 0.093 34.25 30.18 27.13% bytes 99.714 ± 0.025 83.911 ± 0.091 31.72 27.66 25.89
Day2 % flows 99.895 ± 0.012 95.845 ± 0.066 91.79 87.63 70.63% packets 99.886 ± 0.013 86.152 ± 0.089 23.96 23.39 21.24% bytes 99.884 ± 0.013 86.341 ± 0.088 16.21 16.31 15.39
Day3 % flows 99.937 ± 0.010 98.301 ± 0.049 84.66 78.03 60.14% packets 99.843 ± 0.016 80.930 ± 0.095 21.07 19.94 17.93% bytes 99.842 ± 0.016 80.203 ± 0.107 17.55 16.51 16.22
SiteB % flows 99.665 ± 0.021 97.630 ± 0.055 89.67 94.28 56.08% packets 99.441 ± 0.029 94.570 ± 0.068 79.39 86.61 57.87% bytes 99.422 ± 0.033 93.700 ± 0.077 77.53 84.59 61.13
Table 6Per-class accuracy for online classification using C4.5.
Class Day1 Day2 Day3 SiteB
Precision (%) Recall (%) Precision (%) Recall (%) Precision (%) Recall (%) Precision (%) Recall (%)
WEB 99.878 99.945 99.985 99.989 99.955 99.992 99.771 99.962MAIL 99.954 99.982 99.642 99.648 99.899 99.899 99.862 99.871BULK 99.003 99.654 99.861 99.880 99.627 99.794 97.830 97.478ATTACK 95.845 81.668 94.147 94.529 60.000 8.571 99.950 99.751CHAT – – – – 95.313 92.424 96.056 81.818P2P 96.456 96.595 99.201 98.914 99.892 99.861 99.204 99.154DATABASE 99.892 99.463 99.808 99.693 99.967 99.978 – –MULTIMEDIA 97.206 98.185 0.0 0.0 100.0 94.737 100.0 72.727VOIP – – – – 88.095 79.570 90.523 87.920SERVICES 100.0 99.502 99.641 99.910 100.0 45.714 71.823 27.957INTERACTIVE 100.0 100.0 97.222 97.222 100.0 99.071 97.792 97.792GAMES 100.0 40.000 – – – – 100.0 100.0GRID – – – – – – 96.875 100.0
W. Li et al. / Computer Networks 53 (2009) 790–809 799

Author's personal copy
for example, in the computation of standard deviation orconfidence intervals.
The accuracy figures represent an average of eachexperiment conducted where each experiment accuracyfigure is the total number of correctly identified flows di-vided by the total number of flows within that particulardata-set.
To evaluate the temporal stability (Section 4.4), we trainthe model using the Day1 (2003) and Day2 (2004) data-sets, and test the model on each of Day2 and Day3 data-sets. Recall that Day2 and Day3 were collected in 2004and 2006, respectively.
To evaluate the spatial stability (Section 4.5), we firsttrain the model using a subset of each of the Day3 and Si-teB data-sets. We then validate each model against theremaining data-set from that site.
To create a multi-site model we combine one half ofeach of the Day3 and SiteB data-sets to use as a trainingset producing the multi-site model. We evaluate this mod-el on the remaining half of each data-set. Using the same(random) mechanism as above, this process is repeatedto obtain standard deviation and confidence intervals. Inthis way the results show the overall accuracy for bothhalves for Day3 and SiteB, respectively. This representsthe spatial stability of the multi-site model on specific, dif-ferent data-sets.
It is important to note that in each case, there is nooverlap between the training set and the testing set – wedo not test the accuracy on the same data as was used to
train the model. Further, each of the experiments is re-peated multiple times using multiple different random-number seeds to divide data-sets into different trainingsets and testing sets. In each case we present the overallaccuracy along with confidence intervals where these aresignificant.
The following metrics are used to quantify the accuracyof classification models:
� Overall Accuracy – the percentage of correctly classifiedinstances over the total number of instances,
� Precision – the number of class members classified cor-rectly over the total number of instances classified asclass members for a given class, and
� Recall – the number of class members classified correctlyover the total number of class members for a given class.
4.3. Classification accuracy (same site, same day)
In this subsection, we present results contrasting theoverall accuracy across four classification methods: C4.5,Naïve Bayes, IANA port numbers and L7 signatures. The re-sults are shown in Table 5. Note that C4.5 and Naïve Bayesclassifiers are using the features computed with the five-packet observation window; instead, for ideal effective-ness, L7 classifier is searching the payload content forknown signatures in up to the first 10 data packets of aflow.
Day1:2003 Day2:2004 Day3:200660
65
70
75
80
85
90
95
100
Dataset: Year
Cor
rect
ly C
lass
ified
Flo
ws
%
C4.5Naive Bayes+Kernel Est.Port NumbersL7 Signature Set (2008)L7 Signature Set (2003)
Fig. 4. A 4-way accuracy comparison of correctly classified flows for Day1vs. Day2 and Day1 vs. Day3.
Day1:2003 Day2:2004 Day3:200610
20
30
40
50
60
70
80
90
100
Dataset: Year
Cor
rect
ly C
lass
ified
Pac
kets
%
C4.5Naive Bayes+Kernel Est.Port NumbersL7 Signature Set (2008)L7 Signature Set (2003)
Day1:2003 Day2:2004 Day3:200610
20
30
40
50
60
70
80
90
100
Dataset: Year
Cor
rect
ly C
lass
ified
Byt
es %
C4.5Naive Bayes+Kernel Est.Port NumbersL7 Signature Set (2008)L7 Signature Set (2003)
Fig. 5. A 4-way accuracy comparison of correctly classified packets and bytes for Day1 vs. Day2 and Day1 vs. Day3.
Day2: 2004 Day3: 200670
75
80
85
90
95
100
Cor
rect
ly C
lass
ified
Tra
ffic
%
Dataset: Year
C4.5: by flowsC4.5: by packetsC4.5: by bytesNaive Bayes: by flowsNaive Bayes: by packetsNaive Bayes: by bytes
Fig. 6. Accuracy comparison of correctly classified flows, packets andbytes for Day2 vs. Day2 compared with Day2 vs. Day3.
800 W. Li et al. / Computer Networks 53 (2009) 790–809

Author's personal copy
It is well-known that the port-based classifier is likelyto lead to inaccurate estimates of the amount of traffic car-ried by different applications given that certain protocols,such as HTTP, are frequently used to relay other types oftraffic, e.g., MSN Messenger over HTTP, whereas other pro-tocols make use of parallel connections which use dynam-ically assigned port numbers, e.g., FTP transfers in PASVmode. In addition, emerging services typically avoid theuse of well-known ports, e.g., some P2P applications, whileother popular applications deliberately use well knowports to masquerade their traffic through firewalls, e.g.,Skype. These have led to only 31% of byte accuracy inDay1 and further 16% and 17% byte accuracy in Day2 andDay3, respectively.
The general performance of payload signature matchingis even worse because (a) even the most up-to-date signa-ture set is by far not enough to cover all the applications,(b) some of the signatures do not match sufficiently wellwhile (c) others are significantly over-matching.
Compared to conventional port-based and signature-based classifiers, the overall accuracy of our method ismuch higher in terms of flows, packets and bytes. To fullydescribe its performance, Table 6 details the per-class per-formance for each application class. The accuracy is high(>99%) for the major application classes. However, becausethe classifier tends to converge towards the highest overallaccuracy, classes containing a small number of membersmay present a lower accuracy as the class distribution ofthe training data-set is not uniform.
Also, some of the classes are presumably more difficultthan others. The ATTACK class comprises of a variety ofmalicious activities targeting different vulnerabilities. Thiscomplex variety leads to a number of false predictions toand from other classes, e.g., some of them are classifiedas WEB in Day1 and Day3, while in Day2 some MAIL flowsare classified as ATTACK. However, the results show thatthese models may still achieve either good precision orgood recall for ATTACK class within Day1, Day2 and SiteB.
Ideally, the accuracy obtained by two-fold cross-valida-tion in the same data-set can be an indication of accuracyfor classifying the traffic of the same day or in a short per-iod after the model is built.
We are also interested in seeing how the classifier de-cays over time, which is presented in the next subsection;and how the classifier performs on a totally different net-work or across various networks, which is presented inSection 4.5.
Table 7Per-class accuracy temporal stability for online classification uing C4.5.
Class Day1 vs. Day2 Day1 vs. Day3 Day2 vs. Day3
Precision (%) Recall (%) Precision (%) Recall (%) Precision (%) Recall (%)
WEB 99.917 99.868 99.851 99.713 99.941 99.866MAIL 94.362 100.0 99.606 88.914 100.0 87.934BULK 83.545 99.259 35.101 92.543 86.623 97.178ATTACK 0.0 0.0 0.0 0.0 0.0 0.0CHAT – – 0.0 0.0 0.0 0.0P2P 92.690 97.791 96.219 99.578 98.471 98.856DATABASE 96.893 19.148 51.741 4.531 100.0 99.967MULTIMEDIA 0.0 0.0 0.0 0.0 0.0 0.0VOIP – – 0.0 0.0 0.0 0.0SERVICES 99.541 97.570 43.750 30.000 4.636 30.000INTERACTIVE 97.222 97.222 100.0 8.050 100.0 8.050
Table 8Accuracy of models trained from one site and applied to each other site, between Day3 (2006, Site A) and SiteB (2007, Site B).
Model:data-set C4.5 Naïve Bayes IANA ports L7 signature set (2008)
Day3:SiteB % flows 94.466 ± 0.095 89.821 ± 0.122 89.67 94.28% packets 93.294 ± 0.103 84.417 ± 0.263 79.39 86.61% bytes 94.035 ± 0.094 84.725 ± 0.394 77.53 84.59
SiteB:Day3 % flows 95.790 ± 0.080 84.454 ± 0.149 84.66 78.03% packets 94.967 ± 0.086 73.226 ± 0.337 21.07 19.94% bytes 95.345 ± 0.082 73.162 ± 0.340 17.55 16.51
Table 9Per-class accuracy of C4.5 models trained from one site and applied to eachother site.
Class Day3:SiteB SiteB:Day3
Precision (%) Recall (%) Precision (%) Recall (%)
WEB 98.586 99.748 99.917 99.526MAIL 99.697 99.981 91.270 99.346BULK 11.307 91.172 37.421 98.206ATTACK 0.000 0.000 0.000 0.000CHAT 50.629 63.636 91.379 80.303P2P 88.610 58.355 98.172 99.520DATABASE – – 0.000 0.000MULTIMEDIA 0.578 90.909 100.000 94.737VOIP 33.019 26.845 3.022 11.828SERVICES 0.079 0.430 0.333 1.429INTERACTIVE 52.917 80.126 17.266 7.430GAME 0.000 0.000 – –GRID 0.000 0.000 – –
W. Li et al. / Computer Networks 53 (2009) 790–809 801
Author's personal copy
4.4. Temporal decay of model accuracy
In Section 3, we note that each classification scheme in-volves the creation of a model that provides an identifica-tion of each network-based application. Such models maybe the table of port numbers relating to (groups of) appli-cations, the signature set for specific applications, or theprobabilistic priors grouping flow features as used by ma-chine learning algorithms. In each case a model will definehow traffic is classified.
With changing applications and network-host behavior,the accuracy of such a model for traffic classification willchange over time, as we illustrate in the following for sev-eral different methods.
We study the temporal decay of the model accuracy byapplying the models created from Day1 and Day2 data-setsto classify the Day2, Day3 and Day3, respectively. The gapbetween Day1 and Day2 is 1 year (2003–2004), in whichthe variety of application and composition of traffic didnot change significantly; whereas between Day2 andDay3 it is roughly 2 years (2004–2006) when there is a riseon the number of different applications (e.g., more kinds ofP2P clients, web applications, instant messengers andVoice-over-IP clients). The composition of traffic also chan-ged accordingly.
Figs. 4 and 5 show a 4-way comparison of the decay ofthe overall accuracy from 2003, 2004 to 2006 for correctlyclassified flows, and packets and bytes, respectively. Weused the same IANA port number list as before, but addedan old version of L7 signature set (September 2003) along-side the most up-to-date L7 signature set. The two signa-ture sets would represent the decay of signature-basedmechanisms under different assumptions. Besides those,we show the results using C4.5 and Naïve Bayes modelsbuilt upon the Day1 data-set to classify Day2 and Day3traffic.
It is shown that while conventional classifiers such asport-based and signature-based degrade by around 5% offlow accuracy each year, the C4.5 classifier has only a decayof less than 2% each year in all three measures of flows,packets and bytes. The standard deviation in the resultsis relatively small. For example, the standard deviation ofC4.5 Day1 vs. Day3 is 0.079 and Naïve Bayes Day1 vs.Day3 is 0.130. These values are invisible in the resolutionof the figure therefore the error bar is not shown.
Further, Fig. 6 shows a comparison Day2 vs. Day2 andthen Day2 vs. Day3. From this we can see the decay ofC4.5 and Naïve Bayes classifiers, between 2004 and 2006.Results are given in terms of flows, packets and bytes.
The error bar is not shown due to the same reason as de-scribed above. It is clear that there is significant decay inthe quality of classification provided by the Naïve Bayes– still better than the L7 and port methods (Fig. 4) but sig-nificant nonetheless. In contrast the C4.5 loses less than 3%of accuracy for all metrics.
Finally, Table 7 presents the precision and recall valuesof the results using C4.5.
Most of the classes are very accurate from 2003 to 2004,and many classes are still very accurate from 2003 to 2006and from 2004 to 2006, e.g., WEB, MAIL, BULK and P2P.
We also observe that in certain cases the precision is sig-nificantly higher than recall. This indicates that some newtypes of applications of this class may have emerged duringthis period. These applications are difficult to be recognizedby the model trained using an earlier data-set. For example,a reason for the recall of MAIL class losing 11% accuracy isthat more mail servers tunnel IMAP communicationsthrough SSL in Day2 and Day3. Moreover, we can see thatdifferent database management system servers on the siteincreased between year 2003 and 2004: the recall is lowfor Day1 vs. Day2 and Day1 vs. Day3, while nearly all thedatabase flows are correctly identified in Day2 vs. Day3.Similarly, it also failed to identify the network monitoringapplications built upon HTTP (they are categorized intoSERVICES) and several remote control applications in theINTERACTIVE class, such as PCAnywhere and GotoMyPCthat appeared between 2004 and 2006. The CHAT and VOIPtraffic are not successfully classified because these classesdo not even exist in the training sets. This observation alsoraises an interesting problem of how to identify a wholenew class of traffic which is previously unobserved. Fur-ther, poor temporal stability is shown for ATTACK as themalicious traffic is of totally different types in the trainingand testing data-sets.
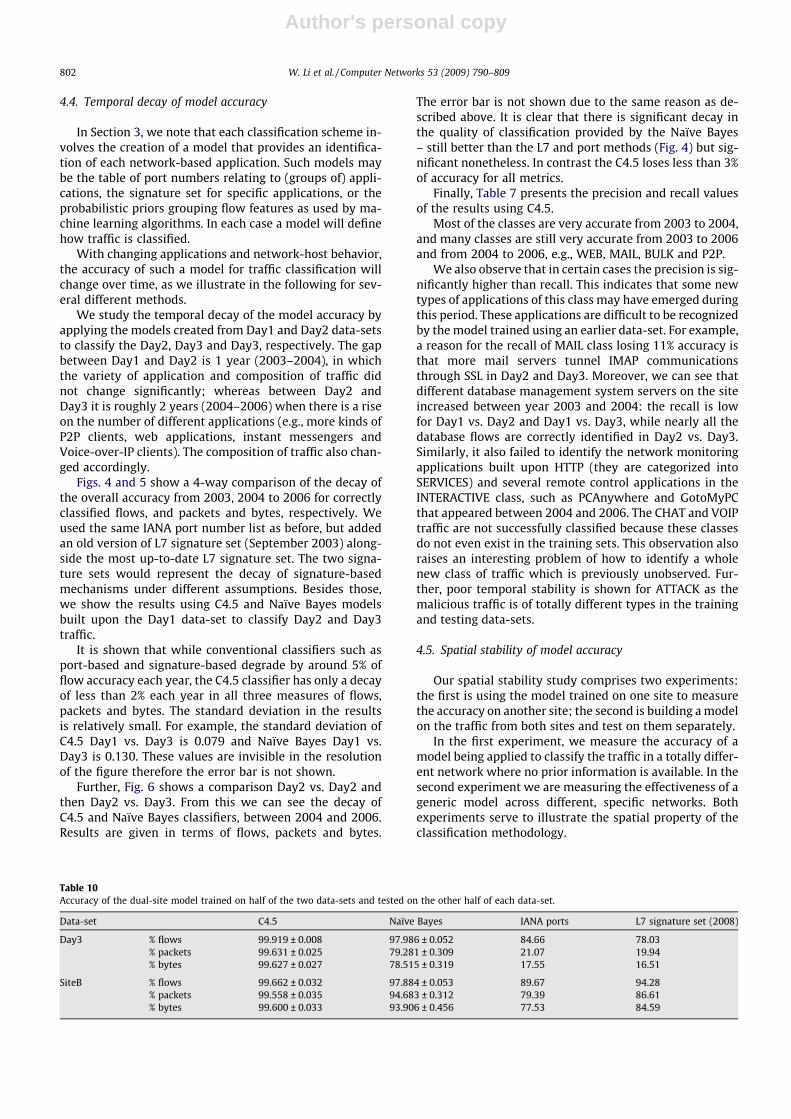
4.5. Spatial stability of model accuracy
Our spatial stability study comprises two experiments:the first is using the model trained on one site to measurethe accuracy on another site; the second is building a modelon the traffic from both sites and test on them separately.
In the first experiment, we measure the accuracy of amodel being applied to classify the traffic in a totally differ-ent network where no prior information is available. In thesecond experiment we are measuring the effectiveness of ageneric model across different, specific networks. Bothexperiments serve to illustrate the spatial property of theclassification methodology.
Table 10Accuracy of the dual-site model trained on half of the two data-sets and tested on the other half of each data-set.
Data-set C4.5 Naïve Bayes IANA ports L7 signature set (2008)
Day3 % flows 99.919 ± 0.008 97.986 ± 0.052 84.66 78.03% packets 99.631 ± 0.025 79.281 ± 0.309 21.07 19.94% bytes 99.627 ± 0.027 78.515 ± 0.319 17.55 16.51
SiteB % flows 99.662 ± 0.032 97.884 ± 0.053 89.67 94.28% packets 99.558 ± 0.035 94.683 ± 0.312 79.39 86.61% bytes 99.600 ± 0.033 93.906 ± 0.456 77.53 84.59
802 W. Li et al. / Computer Networks 53 (2009) 790–809

Author's personal copy
4.5.1. Training on one site and testing on anotherThe accuracy shown here is for models trained on Day3
and SiteB, respectively, and applied to test the accuracy onthe other data-set. Table 8 compares the model accuracywith L7 and port numbers. The results under ‘‘Day3:SiteB”is using Day3 as training set and SiteB as testing set; the re-sults under ‘‘SiteB:Day3” is using SiteB as training set andDay3 as testing set.
Since the majority of traffic at SiteB is web-browsingtraffic and the HTTP signature works relatively well, theL7-signatures yield good results. However, in all cases theresult using C4.5 is advantageous compared with othermethodologies. Notably, the Day3 C4.5 model shows betterresults in terms of flows, packets and bytes on SiteB whichis from a totally different network 19 months later.
Table 9 reports the results for each application classusing C4.5. Several major classes, namely WEB, MAIL, BULKand MULTIMEDIA have shown outstanding recall values onboth directions; this means the model is very effective formost traditional services. However, we notice that thereare drops in some other traffic classes:
� ATTACK: because of the difference in both location andtime, the attack traffic in the two data-sets are totallyof different types, which caused that none of the modelscan identify the ATTACK traffic in the other data-set.5
� P2P: the identification is highly accurate from SiteB toDay3, but it drops to 58% when using Day3 model to teston SiteB. As a matter of fact, we have only found nineinternal hosts in Day3 running a P2P application (Gnu-tella, eDonkey or Azureus). However in SiteB data-setthere were 30 internal hosts and the variety of the cli-ents are larger (eDonkey, BitTorrent, DirectConnect, Jol-tid, Gnutella and Pando) and are probably of newerversions. Further to our knowledge, a major part of SiteA is running a firewall that severely throttles P2P traffic.Such throttling produced a lot of failed attempts for con-nection, which may lead to some skewness in the model.
� DATABASE and GRID: there is no networked databasetraffic in SiteB data-set, which caused the failure in iden-tifying them in Day3 data-set. Similarly, there is no Gridcomputing traffic in Day3 data-set which caused thefailure in identifying them in SiteB data-set.
� VOIP: neither of the two data-sets have many samples ofSkype flows in TCP. Also, the result is not ideal due to thedifferent Skype versions (version 2 in Day3 data-set andversion 3 in SiteB data-set).
� SERVICES: this class comprises of only a small amount offlows, and in Day3 data-set many of them is networkmonitoring traffic over HTTP. This leads to a number offalse negatives and false positives on both ways.
� INTERACTIVE: this class incorporates ssh connectionsand also several remote access software, e.g. Got-oMyPC/expertcity. While ssh is easier to identify frompacket stream behavior, the INTERACTIVE traffic in thetwo traces are significantly different in their behavior.
4.5.2. Multi-site trainingNow we evaluate the model trained with combined
data from two different sites. In this experiment, a half ofeach data-set is randomly selected and combined togetheras the training set to train the model. Then the model istested on the other half of each data-set.
Table 10 shows the overall accuracy comparison andTable 11 shows detailed per-class accuracy on each data-set. The resultant accuracy only slightly decreases in com-parison to models trained specifically for a given site. Thisindicates that there is very little conflict when combiningthe data-sets in order to train a model for multiple sites;and the features, as we discussed before, are faithfully rep-resenting the behavior of the applications rather than spe-cific networks or different situations in the networkcommunication.
Most of the classes are very accurate except for a fewclasses which only have a very small number of flows. Thisis because the classifier tends to converge toward higheroverall accuracy during training, and the number of sam-ples in these classes might be insufficient to build a goodmodel. There are methods to trade-off between the accu-racy of a certain class with the overall accuracy, and we re-fer readers to related machine learning literature.
4.6. UDP classification accuracy and stability
Although in recent years the UDP traffic has not in-creased too much in the proportion of total traffic volume,we have seen a significantly increased variety of applica-tions over UDP, such as VoIP communications, multimediaapplications, P2P file-downloading and networked games.Accordingly there is an increasing need to understandand technically support such variety of applications.
For this study, we selected three 30 min traces of UDPtraffic from Day1, Day3 and SiteB, respectively (as detailedin Section 2). All the three traces are collected at around10:30 AM of a weekday.
Since the UDP flows do not maintain a state machine asin TCP, we use an inactivity time-out. We elect to use thedefault inactivity time-out of Cisco Netflow to aggregatethe flows, with the time-out value set to be 60 s. We
Table 11Per-class accuracy of C4.5 dual-site model trained on half of the two data-sets and tested on the other half of each data-set.
Class Day3 SiteB
Precision (%) Recall (%) Precision (%) Recall (%)
WEB 99.964 99.982 99.746 99.968MAIL 99.924 99.949 99.963 99.862BULK 99.663 99.495 96.654 98.919ATTACK 29.411 14.285 99.626 99.825CHAT 94.736 81.818 97.852 81.028P2P 99.668 99.887 99.314 98.964DATABASE 99.923 99.934 – –MULTIMEDIA 100.0 94.736 90.909 90.909VOIP 80.303 56.989 89.509 89.166SERVICES 71.428 50.000 72.992 21.505INTERACTIVE 99.047 96.594 97.763 96.530GAME – – 99.337 100.0GRID – – 95.876 100.0
5 In Day3 data-set the ATTACK class contains a small number of flows bySQL injection over HTTP while in SiteB data-set it contains traffic generatedby botnets and a MS-RPC worm.
W. Li et al. / Computer Networks 53 (2009) 790–809 803

Author's personal copy
acknowledge this may not be the ideal value for all types oftraffic and would suggest that a multiple time-resolutionapproach: using several different time-out values, wouldmake interesting future work.
The ground-truth in the UDP data-sets is derived in asimilar way as in the TCP data-sets. The actual applicationbreakdown in the UDP data-sets is shown in Table 12, com-prising of six major classes.6
Following the approach described in Section 4.2, a ma-chine learning approach is applied to classify the UDP traf-fic. Like the TCP traffic, we use an observation window thatlimits us to the first five packets.
As the UDP header contains different information fromthe TCP header, it is necessary to select a different featureset for UDP. Therefore, a complete set of features similar tothe TCP feature set (with the TCP-specific ones removed
and a few others changed) are collected and then, applyingthe FCBF-based approach described in Section 3.5, we se-lect an optimal subset of features. The resultant featureset contains nine features and is shown in Table 13 below.
Table 14 compares the overall classification accuracyacross the classification methodologies: C4.5 and NaïveBayes using five-packet observation window, IANA portnumbers and L7 signatures, using the same criteria as inprevious Table 5. It shows that C4.5 achieves very goodaccuracy and works far better than IANA port numbersand L7-signatures.
Table 15 shows the precision and recall results for eachclass in each data-set. Most of classes approach 100% recalland precision, except two minor classes in SiteB with onlyfew instances, which are probably too small to be effec-tively modeled.
We further evaluate the temporal and spatial perfor-mance of the UDP classifier and the results are shown inTable 16.
Table 12Composition of UDP traffic in our data-sets. Applications shown are only examples for demonstration. ‘‘–” denotes non-existing traffic.
Class By flows (%)/packets (%)/bytes (%) Applications
Day1 Day3 SiteB
ATTACK 10.554/1.510/0.987 14.933/1.158/1.843 42.433/20.305/15.963 Port scans, ms-sql wormsSERVICES 88.889/76.807/62.740 57.073/25.167/14.084 11.968/26.532/26.339 DNS, LDAP, NTP, SNMP, middlewareP2P 0.036/0.022/0.007 13.861/28.109/23.862 7.062/7.560/7.280 Kazaa, Gnutella, eDonkey, BitTorrentMULTIMEDIA 0.522/21.661/36.266 1.268/42.521/59.498 0.000/0.396/2.287 Windows Media Player, RealmediaVOIP –/ –/ – 12.865/3.045/0.712 38.536/44.482/45.297 SkypeGAME –/ –/ – –/ –/ – 0.001/0.726/2.830 Second Life
Table 13Properties of the subset of UDP features selected using five-packet observation window. SU is the symmetrical uncertainty measurement, as fully described inSection 3.5.
Abbreviation Description SU Memoryoverhead
Computationalcomplexity
num_pkts Number of packets seen on both directions 0.3333 O(1) O(n)min_pbyte_clnt Minimum payload bytes seen (client to server) 0.3897 O(1) O(n)min_pbyte_serv Minimum payload bytes seen (server to client) 0.4114 O(1) O(n)max_pbyte_clnt Maximum payload bytes seen (client to server) 0.4032 O(1) O(n)max_pbyte_serv Maximum payload bytes seen (server to client) 0.3803 O(1) O(n)ini_pbyte_clnt Payload bytes sent from client to server before the first packet coming
back0.3353 O(1) O(n)
max_csct_pkts_clnt Maximum number of consecutive packets (client to server) 0.3064 O(1) O(n)serv_port Server port 0.6424 O(1) O(1)clnt_port Client port 0.3676 O(1) O(1)
Table 14Overall accuracy comparison across four classification mechanisms.
Data-set C4.5 Naïve Bayes IANA ports L7 signature set (2008)
Day1 % flows 99.956 ± 0.011 86.879 ± 0.208 88.91 73.43% packets 99.969 ± 0.010 88.567 ± 0.163 79.44 72.55% bytes 99.977 ± 0.010 90.529 ± 0.157 64.38 59.58
Day3 % flows 99.627 ± 0.034 97.812 ± 0.077 56.44 65.97% packets 98.745 ± 0.043 94.389 ± 0.101 18.54 20.03% bytes 94.750 ± 0.069 95.121 ± 0.098 5.28 5.66
SiteB % flows 99.889 ± 0.019 97.964 ± 0.075 10.50 53.15% packets 99.052 ± 0.036 96.224 ± 0.101 22.96 71.30% bytes 98.937 ± 0.037 92.250 ± 0.100 23.35 72.34
6 In theory there may also be instant messengers traffic (CHAT class) overUDP, but it is not found in these traces.
804 W. Li et al. / Computer Networks 53 (2009) 790–809

Author's personal copy
The temporal study indicates that the diversity andvariety of applications over UDP have significantly in-creased between Day1 and Day3. The traditional services:DNS, NTP, SNMP and Windows Media Player traffic are cor-rectly identified. However, the new types of attacks, P2Pfiledownloading and VoIP applications are not able to beidentified using the previous model.
Despite the fact that the Day3 and SiteB UDP data-setsare highly different in the traffic composition and theapplication-set, most of the classes are correctly identified.The result for the P2P class is lower than SERVICES andVOIP due to the different application variety on eachdata-set and the impact from firewall policies in Day3.Also, there are only two multimedia flows in SiteB whichis insufficient to build the model to classify the MULTIME-DIA traffic in Day3.
Finally, a multi-site model is trained using combinedUDP data from two different sites. A half of each data-set
is randomly selected and combined together as the train-ing set to train the model. Then the model is tested onthe other half of each data-set. As shown in Table 17,
Again the result is much better than applying the modelfrom one site to the other. A very small decrease is seen incomparison to models trained specifically for a given site.However, the overall accuracy is still very good, and the re-call value of some classes such as VOIP and MULTIMEDIAin SiteB data-set have even improved, probably becausethe additional training samples from Day3 complementedthose from SiteB.
4.7. Complexity and memory footprint
The cost in the online classification pipeline can be bro-ken down into three parts. Suppose we drop the later pack-ets of a flow after classification of the flow. Then if wedenote M as total flows currently in the memory and n as
Table 15Per-class accuracy for UDP classifier using C4.5.
Class Day1 Day3 SiteB
Precision (%) Recall (%) Precision (%) Recall (%) Precision (%) Recall (%)
ATTACK 99.772 99.924 99.782 100.0 99.994 100.000SERVICES 99.996 99.964 99.905 99.958 99.930 99.923P2P 100.0 88.889 99.115 98.601 99.147 99.332MULTIMEDIA 97.015 100.0 97.789 98.797 0.0 0.0VOIP – – 98.950 98.916 99.896 99.859GAME – – – – 0.0 0.0
Table 16Per-class and general accuracy for temporal and spatial evaluation of the UDP models trained with C4.5.
Class Temporal Spatial
Day1 vs. Day3 Day3:SiteB SiteB:Day3
Precision (%) Recall (%) Precision (%) Recall (%) Precision (%) Recall (%)
ATTACK 36.493 22.053 99.986 96.516 99.965 81.465SERVICES 72.221 99.862 95.366 96.577 99.200 99.501P2P 24.625 1.289 67.106 63.018 68.973 86.469MULTIMEDIA 10.204 92.955 0.256 50.000 0.0 0.0VOIP 0.0 0.0 91.225 95.252 84.958 87.519GAME – – 0.0 0.0 – –
Overall flows (%) 61.428 ± 0.358 92.149 ± 0.157 93.670 ± 0.144Overall packets (%) 70.086 ± 0.298 52.955 ± 0.375 92.553 ± 0.148Overall bytes (%) 65.275 ± 0.334 36.772 ± 0.434 89.725 ± 0.161
Table 17Per-class and general accuracy of the dual-site model trained on half of the two UDP data-sets and tested on the other half of each data-set.
Class Day3 SiteB
Precision (%) Recall (%) Precision (%) Recall (%)
ATTACK 99.971 100.0 99.989 99.995SERVICES 99.939 99.958 99.912 99.917P2P 98.449 97.768 99.221 99.270MULTIMEDIA 99.648 97.251 7.143 50.000VOIP 97.767 98.611 99.884 99.864GAME – – 0.0 0.0
Overall flows (%) 99.453 ± 0.043 99.884 ± 0.019Overall packets (%) 98.150 ± 0.324 98.937 ± 0.101Overall bytes (%) 97.815 ± 0.500 95.888 ± 0.572
W. Li et al. / Computer Networks 53 (2009) 790–809 805

Author's personal copy
the number of packets in the observation window, then thetotal computational overhead would comprise all the fol-lowing (also note that roughly M has a linear relationshipwith n):
(1) For capturing packet headers and aggregating pack-ets into flows, there will be a memory footprint ofOðMÞ to store M flows in the memory and computa-tional complexity of at least Oðlog2MÞ for eachpacket captured to find the flow it belongs to.Assuming M is proportional to n, for each flow, thecomplexity in aggregating the packets is roughlyOðn� log2nÞ.
(2) For feature collection and calculation of each flow,different features in the complete set would cause amemory footprint varied from Oð1Þ to OðnÞ and com-putational complexity varied from Oð1Þ toOðn� log2nÞ. Roughly, the total cost of feature collec-tion of one flow would have a super-linear relation-ship with the number of features in the feature set.
(3) Presuming C4.5 is being used as the classifier, forclassification of each flow, the computational com-plexity in the classifier is equal to the average depthof the decision tree, which is similar to the complex-ity of simple port-based rule-sets.
Clearly, we know from the cost breakdown above, as thecomplexity of the classifier is O(1), the bottleneck in thispipeline may be in reassembling the flows and calculatingthe features, instead of the calculations in the classifier.However, the total cost of classifying a flow can bebounded within Oðn� log2nþ n� KÞ where n is the num-ber of packets in the observation window and K is thenumber of features collected. Such cost is considerablylower than a flow-based string signature matching systemwhen n and K are both small.
Besides the complexity analysis, empirical results onthe CPU time required for training and testing are providedbelow.
4.7.1. CPU time resultsThe experiments are run on a Dell Poweredge 2850
equipped with 2 Intel Xeon 3.5 GHz CPU and 4 GB ofRAM. L7 signature matching and feature collection areimplemented in C++, whereas the training and testing ofthe machine learning models are performed using theWeka toolkit.
The CPU times are evaluated using data-sets on threedifferent scales: (1) one-tenth of a 30-min trace (2476flows), (2) one 30-min trace (23,810 flows), and (3) ten30-min traces (377,000 flows).
Three different classification methods: C4.5, NaïveBayes and L7 are separately executed on these data-sets.The time in offline training, online feature collection andclassification are measured separately for each of the ma-chine learning approaches, whereas for L7 we measurethe time spent in classification alone. For each result of ma-chine learning methods, we classify each data-set using themodel trained from a data-set of the same time scale. Eachexperiment is repeated 10 times. Table 18 lists the CPUtimes normalized by the number of flows in the data asthe size of the trace varies, along with the standard devia-tions. The time for aggregating packets into flows is in-cluded in ‘‘online feature collection/classification”.
The offline training time is less relevant to the onlineclassifier performance: it shows how long it takes for themodel to be built up using a certain data-set size.
The feature collection time for machine learning algo-rithms, and the classification time for L7 are both nearlyconstant when normalized. However, the feature collectiontime is about one-third of the time spent in signaturematching by L7 (both implementations are not optimized).The classification time using C4.5 is very low: 13 ls perflow for the largest data-set. Recall that the average com-putation needed in a C4.5 decision tree is the averagedepth of the tree. As the size of the training set increases,the average tree-depth in all our models remains between4 and 5, due to the effective pruning process of this algo-rithm. And so the normalized classification time should re-main constant.7 In contrast, the normalized classificationtime is not constant for Naïve Bayes with kernel estimationas the CPU time grows from 610 ls per flow (1/10 data-set)to 4276 ls per flow (10 data-sets). It is determined thattraining on larger data-sets results in a higher complexityof the model.
5. Related work
The challenge in classifying the Internet traffic hasaroused an ever-widening interest – whether among usersconcerned about their data, network-operators and nationskeen to embargo certain applications [23], or for research-ers wanting to further their understanding [24]. There hasbeen a rich literature that drafted a range of proposals andconducted a number of preliminary experiments to ad-dress this interest.
Table 18Comparison of training and testing times between C4.5, Na Bayes and L7 schemes.
Data-set size C4.5 Naïve Bayes L7
Offline training time (ls) 1/10 186.06 ± 25.66 103.74 ± 20.49 –1 130.20 ± 8.19 24.65 ± 1.97 –10 337.71 ± 2.88 32.28 ± 0.53 –
Online feature collection/classification (ls) 1/10 673 ± 49/67.79 ± 11.09 673 ± 49/610.25 ± 40.43 1666 ± 701 692 ± 101/19.36 ± 1.05 692 ± 101/1331.8 ± 13.76 1540 ± 19810 540 ± 8/13.73 ± 0.34 540 ± 8/4276.7 ± 375.76 1814 ± 63
7 However, there is a non-negligible model-loading time in our exper-iments, which leads to higher normalized values for smaller data-sets. Thenormalized value for the largest data-set is closest to the actual cost in theclassification.
806 W. Li et al. / Computer Networks 53 (2009) 790–809

Author's personal copy
The work in [7] quantitatively addressed the problemfor conventional classification methods based on portnumbers to effectively deal with current Internet traffic.It also described a content-based work to obtain theground-truth application information for each flow in thetraffic.
Traditionally another type of solution came from theintrusion detection community, examples of this includeSnort [25] and Bro [26]. Each of these systems can identifythe application layer protocols through the use of contentsignatures or connection patterns. The L7-filter, the deep-packet inspection filter described in [14], is a signaturematching system able to identify the application layer pro-tocols so as to enable per-application traffic managementwithin the scope of the Linux iptables system.
There have been a number of previous works on sta-tistical characterization and classification of differentapplication traffic. Fundamental to these are papers tocharacterize a network flow using a different variety offeatures to describe its behavior [27,11]. Their contribu-tion provides an exploration of the different features ofapplication traffic. Such rich sets of features allow us toconsider the ability to perform behavior-based classifica-tion by providing the input parameters for traffic classifi-cation for a range of classification approaches as well asinputs to application-specific modeling and simulation.
Meanwhile, several ground-breaking approachesemerged for classification of current Internet traffic. Rou-ghan et al. [9] proposed a method, representing a trafficflow with some features (referred to as ‘‘descriptors”) suchas packet size and connection duration. They applied twosupervised learning techniques (k-NN and LDA) to definethe relationship between different values of these descrip-tors and different Class-of-Service (CoS) categories. How-ever, in common with a number of authors of the time,Roughan et al. created ground-truth data using IANA portnumbers as a criteria, i.e., 80 = HTTP, 25 = SMTP, 22 = SSH.Alongside this overloading of the port information there isan assumption about the conventional protocol-applicationmapping such as HTTP = web browser, a mapping which isnow demonstrated as wrong. In Section 2, we summarizethe process by which we calculate ground-truth informa-tion; by making heavy use of manual verification our pro-cess breaks that protocol-application mapping and placesno direct reliance on port number information.
Another interesting approach by Li et al. [28] used a sig-nificant number of machines to create a known, albeit arti-ficial ground-truth. We acknowledge the great effort of theauthors however, their approach can only serve to compli-ment the capture of spatial heterogeneity among differentnetworks and sites, as we have done in this paper.
In a precursor of this paper, Moore and Zuev in [5] pre-sented a statistical approach to classify the traffic into dif-ferent types of services. A Naïve Bayes classifier, combinedwith kernel estimation and a correlation-based filteringalgorithm, was used to solve the classification problemon offline TCP traces. The resulting accuracy of up to 96%demonstrated the discriminative power of a combinationof 12 flow-behavior features with a classical machinelearning algorithm. Li and Moore [29] extend this withthe application of the C4.5 algorithm and the use of an
‘‘observation window”: to limit the total number of re-quired packets from the beginning of each flow. Theseextensions allowed them to build an increased accuracywhile also enabling online (real-time) classification. Incontrast with the earlier work of Moore and Zuev, we havealso focused upon algorithms that return high accuracyand lend themselves to use in real-time.
Williams et al. [6] carried out a comparison of fivewidely utilized machine learning algorithms for the taskof traffic classification. Among these algorithms, Ada-Boost+C4.5 was demonstrated with the highest accuracy.Intended only as a guidebook for algorithms, their featureset is relatively unsophisticated, containing only packetlengths, total bytes, total packets, inter-arrival times, flowduration and protocol. While a small feature set hascomputation and storage advantages we demonstrate inSection 4 that by considering a much wider range of fea-tures, and then minimizing the feature set on the basis ofquality of information, computation and storage advanta-ges can be maintained while accuracy and effectivenessis improved.
Bernaille et al. [1] presented an approach to identifyapplications using start-of-flow information. The authorsutilized the packet size and direction of the first four datapackets in each flow as the features with which theytrained Gaussian and Hidden Markov Models, respectively.These models achieved 98.7% overall accuracy when as-sisted by an expanded port number list, and 93.7% overallaccuracy using simple prediction heuristics. The authorshave further extended their work for the identification ofencrypted traffic in [30].
There have been a number of works that attempted thesame problem with different machine learning algorithmsand feature set such as unsupervised clustering [4,31] andmaximum likelihood with the first order Markov chain forthe state space of TCP control packet of a TCP connection[3]. A recent statistical-fingerprinting mechanism was pro-posed by the authors of Crotti et al. [2]. This work includesthe description of features (described as application-fin-gerprints) and included the size of the IP packets, the in-ter-arrival time and the order of the packets seen on thelink. While useful in some circumstances, without extrawork, such mechanism are not best suited to the classifica-tion of the majority of Internet applications. In contrast, inSection 3, we present results from a group of general-pur-pose classification systems.
Differing from the per-flow classification approaches,other work utilizes information retrieved from a higher le-vel of traffic aggregation – the end-host. Karagiannis et al.[32] combined information from multiple levels such asthe interaction between hosts on the host level, protocolusage and per-flow average packet size on the flow level.The results show an ability of classifying 80–90% of thetraffic with 95% accuracy. In [33] the authors present a re-lated mechanism to profile user-activity and the behaviorsof the end-hosts, as well as an analysis of the dynamiccharacteristics of host behaviors.
Notably there is also a lot of work focused on specifickinds of traffic or applications of interest. For example,Bonfiglio et al. [17] showed an interesting approach specif-ically intended to identify Skype traffic by recognizing spe-
W. Li et al. / Computer Networks 53 (2009) 790–809 807

Author's personal copy
cial characteristics of Skype and Voice-over-IP traffic.While a number of papers have been published focussingon the identification of P2P applications: Karagianniset al. [34] effectively identified P2P traffic using severalsources of information taken from the IP-tuple connectiongraph. Further, Constantinou and Mavrommatis [35] pro-posed a way to identify P2P activities through the observa-tion of the connection graph property and the client–serverproperty of an end-host.
6. Conclusion
Motivated by the importance of accurate identificationfor a range of applications, we have explored the effectiveand efficient classification of network-based applicationsusing only the observed network-traffic.
We presented results of a comparison of a number ofclassification schemes. Significantly, we only used datafor which we have established the ground-truth: the actualapplications causing the network-traffic observed. Despitethe burden of computing accurate ground-truth, we sum-marize a method we have used to accurately assess manyhundreds of Gigabytes of raw data.
We demonstrated the accurate training of models fromdata with a high-confidence ground-truth and the use of anefficient, small, feature set derived from the reduction of alarge flow feature list using a sophisticated feature selec-tion mechanism. In combination with a small feature list,we further show the return of good results with the useof sub-sampling based upon a limited observationwindow. We conclude the combination of an observa-tion-window and the machine learning method (C4.5) istransformative: enabling this approach to make a real im-pact in online, real-time, classification applications.
We have documented a unique study in both the tem-poral and spatial domains: comparing classification perfor-mance across several years at one location and acrossseveral locations. These results are unequivocal in demon-strating the effectiveness of C4.5 mechanisms, the brittle-ness of packet-content methods and the need for samplesof traffic from multiple sites to provide accurate multi-siteclassification.
We demonstrated the computational complexity andmeasured the costs within the classification pipeline, not-ing the non-linear trade-offs incurred by some methods,the limitations of deep-packet inspection, and the needfor observation-window based mechanisms.
Finally, while some past publications had investigatedUDP traffic classification within the scope of a singleapplication, in contrast with them, we illustrate the classi-fication of UDP (and TCP) traffic using an application-independent classifier. We use the same classificationapproach for both stateful flows (TCP) and stateless flowsbased upon UDP. Importantly, we demonstrate high levelsof accuracy: greater than 92% for the worst circumstanceregardless of the application.
Data. While anonymity needs and legal obligations limitan out-right release of our raw data-sets; we make avail-able to the community anonymized data files as well as
software at http://www.cl.cam.ac.uk/research/srg/netos/brasil/.
Acknowledgements
This work is supported by the Engineering and PhysicalSciences Research Council through grant GR/T10510/02.We thank the numerous network-operations groups whohave supported this research, they include JaNet, Dante,KAREN, AT&T and GARR; this work would have beenimpossible with their support and assistance. We thankthe anonymous reviewers for their many helpful com-ments and suggestions, we also thank Jon Crowcroft, Dam-ien Fay, Martin Zadnik and Ralphe Neill for their helpfulcomments on drafts of this work.
References
[1] L. Bernaille, R. Teixeira, K. Salamatian, Early applicationidentification, in: Proceedings of the 2006 ACM Conference onEmerging Network Experiment and Technology (CoNEXT’06),December 2006.
[2] Manuel Crotti, Maurizio Dusi, Francesco Gringoli, Luca Salgarelli,Traffic classification through simple statistical fingerprinting,SIGCOMM Computer Communication Review, January 2007.
[3] H. Dahmouni, S. Vaton, D. Rosse, A Markovian signature-basedapproach to IP traffic classification, in: Proceedings of the 2006SIGCOMM Workshop on Mining Network Data (MineNet’07), June2007.
[4] J. Erman, M. Arlitt, A. Mahanti, Traffic classification using clusteringalgorithms, in: Proceedings of the 2006 SIGCOMM Workshop onMining Network Data (MineNet’06), September 2006.
[5] Andrew W. Moore, Denis Zuev, Internet traffic classification usingBayesian analysis techniques, in: Proceedings of the 2005 ACMSIGMETRICS, 2005, pp. 50–60.
[6] N. Williams, S. Zander, G. Armitage, A preliminary performancecomparison of five machine learning algorithms for practical IPtraffic flow classification, SIGCOMM Computer CommunicationReview, October 2006.
[7] A.W. Moore, D. Papagiannaki, Toward the accurate identification ofnetwork applications, in: Proceedings of the Sixth Passive and ActiveMeasurement Workshop (PAM’05), LNCS, vol. 3431, Springer-Verlag,March 2005.
[8] Getbymail: Remote Access & File Sharing by Mail. <http://www.getbymail.com/>.
[9] M. Roughan, S. Sen, O. Spatscheck, N. Duffield, Class-of-ServiceMapping for QoS: a statistical signature-based approach to IP trafficclassification, in: Proceedings of the 2004 ACM SIGCOMM InternetMeasurement Conference (IMC’04), October 2004.
[10] R. Pang, V. Yegneswaran, P. Barford, V. Paxson, L. Peterson,Characteristics of internet background radiation, in: Proceedings ofthe 2004 ACM SIGCOMM Internet Measurement Conference(IMC’04), October 2004.
[11] A.W. Moore, D. Zuev, M Crogan, Discriminators for use in flow-basedclassification, Technical Report RR-05-13, Department of ComputerScience, Queen Mary, University of London, September 2005.
[12] Marco Canini, Wei Li, Andrew W. Moore, Raffaele Bolla, GTVS:boosting the collection of application traffic ground truth, TechnicalNote, University of Cambridge.
[13] Wei Li, Andrew W. Moore, Marco Canini, Classifying HTTP traffic inthe new age, in: ACM SIGCOMM 2008, Poster, August 2008.
[14] Application Layer Packet Classifier for Linux. <http://l7-filter.sourceforge.net/>.
[15] C. Estan, K. Keys, D. Moore, G. Varghese, Building a better NetFlow,in: Proceedings of the 2004 ACM SIGCOMM, August 2004.
[16] Marco Canini, Damien Fay, David J. Miller, Andrew W. Moore,Raffaele Bolla, Per flow packet sampling for high-speed networkmonitoring, in: Proceedings of the first International Conference onCommunication Systems and Networks (COMSNETS), January 2009.
[17] D. Bonfiglio, M. Mellia, M. Meo, D. Rossi, P. Tofanelli, Revealing Skypetraffic: when randomness plays with you, in: Proceedings of the2007 ACM SIGCOMM, August 2007.
808 W. Li et al. / Computer Networks 53 (2009) 790–809

Author's personal copy
[18] Raffaele Bolla, Marco Canini, Riccardo Rapuzzi, Michele Sciuto, Onthe double-faced nature of P2P traffic, in: Proceedings of the 16thEuromicro Conference on Parallel, Distributed and Network-BasedProcessing (PDP’08), 2008, pp. 524–530.
[19] J.R. Quinlan, C4.5: Program for Machine Learning, Morgan Kaufman,1993.
[20] Lei Yu, Huan Liu, Feature selection for high-dimensional data: a fastcorrelation-based filter solution, in: Proceedings of the 20thInternational Conference on Machine Learning (ICML’03), 2003.
[21] R.O. Duda, P.E. Hart, D.G. Stork, Pattern Classification, John Wiley andSons Inc., 2001.
[22] I.H. Witten, E. Frank, Data Mining: Practical Machine Learning Toolsand Techniques, second ed., Morgan Kaufmann Publishers, 2005.
[23] Thomas Karagiannis, Andre Broido, Nevil Brownlee, Kimberly C.Claffy, Michalis Faloutsos, Is P2P dying or just hiding? in:Proceedings of the 2004 IEEE GLOBECOM: Global Internet andNext Generation Networks, November 2004.
[24] David A. Patterson, David D. Clark, Anna Karlin, Jim Kurose, EdwardD. Lazowska, David Liddle, Derek McAuley, Vern Paxson, StefanSavage, Ellen W. Zegura, Looking Over the Fence at Networks: ANeighbor’s View of Networking Research, Computer Science andTelecommunications Board, National Academy of Sciences,Washington, DC, 2001.
[25] Martin Roesch, Snort – lightweight intrusion detection for networks,in: Proceedings of the 13th USENIX Conference on SystemAdministration (LISA’99), 1999.
[26] Vern Paxson, Bro: a system for detecting network intruders in real-time, Computer Networks 31 (23–24) (1999) 2435–2463.
[27] A. De Montigny-Leboeuf, Flow attributes for use in trafficcharacterization, Technical Report, Communications ResearchCentre Canada, December 2005.
[28] Li Jun, Zhang Shunyi, Lu Yanqing, Zhang Zailong, Internet trafficclassification using machine learning, in: Proceedings of SecondInternational Conference on Communications and Networking inChina (CHINACOM’07), August 2007, pp. 239–243.
[29] Wei Li, Andrew W. Moore, A machine learning approach for efficienttraffic classification, in: Proceedings of the 2007 IEEE InternationalSymposium on Modeling, Analysis, and Simulation of Computer andTelecommunication Systems (MASCOTS’07), October 2007.
[30] L. Bernaille, R. Teixeira, Early recognition of encrypted applications,in: Proceedings of the Eighth Passive and Active MeasurementConference (PAM’07), April 2007.
[31] K. Gopalratnam, S. Basu, J. Dunagan, H. Wang, Automaticallyextracting fields from unknown network protocols, in: Proceedingsof the First Workshop on Tackling Computer Systems Problems withMachine Learning Techniques (SysML’06), June 2006.
[32] Thomas Karagiannis, Konstantina Papagiannaki, Michalis Faloutsos,Blinc: multilevel traffic classification in the dark, in: Proceedings ofthe ACM SIGCOMM 2005, 2005, pp. 229–240.
[33] Thomas Karagiannis, Konstantina Papagiannaki, Nina Taft, MichalisFaloutsos, Profiling the end host, in: Proceedings of the EighthPassive and Active Measurement Conference (PAM’07), April 2007.
[34] Thomas Karagiannis, Andre Broido, Michalis Faloutsos, Kimberley C.Claffy, Transport layer identification of P2P traffic, in: Proceedings ofthe 2004 ACM SIGCOMM Internet Measurement Conference(IMC’04), October 2004.
[35] F. Constantinou, P. Mavrommatis, Identifying known and unknownpeer-to-peer traffic, in: Proceedings of the Fifth IEEE InternationalSymposium on Network Computing and Applications (NCA’06),2006.
Wei Li is a Ph.D. student in Computer Labo-ratory, University of Cambridge. Before that,he received the Master degree from UniversityCollege London. His research is specialized inbehavior-based real-time application andservice identification. He interests spanmachine learning, data mining, networkmonitoring and studying the use of theInternet.
Marco Canini was born in Genoa in 1980. In2005, he received the ‘‘laurea” degree inComputer Engineering from the University ofGenoa, Italy. Since January 2006, he is a Ph.D.student at the Department of Communica-tions, Computer and Systems Science (DIST) ofthe University of Genoa. His main researchinterests include methods for Internet trafficclassification according to the causing appli-cation, design of network monitoring appli-cations, design of network-traffic generators,peer-to-peer traffic monitoring, and graphical
visualization of networking data. During his Ph.D., he took internshipswith Intel Research and Google. He was invited as a visitor to the Uni-versity of Cambridge, Computer Laboratory.
Andrew W. Moore is a University Lecturer inthe Computer Laboratory, University of Cam-bridge. Prior to joining the Computer Labora-tory, he had been a Fellow at Queen Mary,University of London, an Intel Research Fellowand a foundation researcher at the CambridgeMarconi Research Laboratory. He took a Ph.D.with the Computer Laboratory in 2001 andprior to 1995 worked for some number ofyears in Australia. He took his first and Mas-ter’s degrees from Monash University inMelbourne. His research interests include the
characterization and accurate reproduction of Internet traffic – a specifictopic being the application of machine learning methods to the charac-terisation of network applications. Recent work has focused upon theeffective use of such methods given a constrained feature-set. His inter-ests also encompass photonic communications and switching systems.Specific recent work is examining the use of photonic switch devices as alow-power alternative to the PCI-interconnect architecture.
Raffaele Bolla received the ‘‘laurea” degree inElectronic Engineering in 1989 and the Ph.D.degree in Telecommunications in 1994 fromthe University of Genoa, Genoa, Italy. SinceSeptember 2004, he has been Associate Pro-fessor of Telematics at the University ofGenoa, where he is with the Department ofCommunications, Computer and Systems Sci-ence (DIST). He has been PI in a number ofrelevant research projects and contracts in thetelecommunications field. He has co-authoredover 130 scientific publications in interna-
tional journals and international conference proceedings. His currentresearch interests are in: (i) resource allocation, routing and control of IPQoS (Quality of Service) networks, (ii) modeling and design of TCP/IPnetworks, (iii) P2P overlay network-traffic measurement and modeling,(iv) advanced platforms for software routers, (v) performance and trafficmonitoring in IP networks, and (vi) advanced mobility management inheterogeneous wireless networks.
W. Li et al. / Computer Networks 53 (2009) 790–809 809