author's personal copy - surface science western at the ...€¦ · ... to uo2 decreasedthe...
TRANSCRIPT

This article appeared in a journal published by Elsevier. The attachedcopy is furnished to the author for internal non-commercial researchand education use, including for instruction at the authors institution
and sharing with colleagues.
Other uses, including reproduction and distribution, or selling orlicensing copies, or posting to personal, institutional or third party
websites are prohibited.
In most cases authors are permitted to post their version of thearticle (e.g. in Word or Tex form) to their personal website orinstitutional repository. Authors requiring further information
regarding Elsevier’s archiving and manuscript policies areencouraged to visit:
http://www.elsevier.com/authorsrights
Author's personal copy
Electrochimica Acta 130 (2014) 29–39
Contents lists available at ScienceDirect
Electrochimica Acta
j ourna l ho me page: www.elsev ier .com/ locate /e lec tac ta
Electrochemical and Surface Characterization of Uranium DioxideContaining Rare-Earth Oxide (Y2O3) and Metal (Pd) Particles
Mayuri Razdana, Martin Trummerb, Dmitrij Zagidulina, Mats Jonssonb,David W. Shoesmitha,c,∗
a Department of Chemistry, Western University, London, Ontario, Canada N6A 5B7b KTH Chemical Science and Engineering, Nuclear Chemistry, Royal Institute of Technology, SE-100 44 Stockholm, Swedenc Surface Science Western, London, Ontario, Canada N6G 0J3
a r t i c l e i n f o
Article history:Received 30 November 2013Received in revised form 20 January 2014Accepted 24 February 2014Available online 11 March 2014
Keywords:Uranium dioxideCyclic voltammetryRaman spectroscopyX-ray photoelectron spectroscopyDopants
a b s t r a c t
Four specimens of uranium dioxide doped with rare-earth oxide (Y2O3) and/or metal particles (Pd) i.e.,UO2, UO2-Y2O3, UO2-Y2O3-Pd, UO2-Pd were surface and electrochemically characterized using scanningelectron microscopy (SEM/EDX), Raman spectroscopy, X-ray photoelectron spectroscopy (XPS) and cyclicvoltammetry. Surface analyses showed that the dopants are present as a separate phase in the UO2
matrix and all oxides are non-stoichiometric and contain a large number of defect clusters. Voltammetryshows anodic oxidation begins at sub-thermodynamic potentials and the presence of multiple cathodicreduction peaks indicates the presence of a number of structural domains with different electrochemicalreactivities. Corrosion potential (ECORR) and polarization resistance measurements (Rp) in the presenceof H2O2 suggests that the anodic reactivity of all the specimens is comparable and high compared to 1.5at% SIMFUEL. The lower Rp values obtained on the doped specimens is consistent with the presence ofreadily oxidizable cuboctahedral clusters in the oxide matrix.
© 2014 Elsevier Ltd. All rights reserved.
1. Introduction
A considerable effort is underway in the nuclear industry to min-imize the potential impact of hazardous radioactive spent-fuel onthe environment. Proposed solutions range from reprocessing todirect disposal in a deep geologically-stable repository. A multi-barrier approach to radionuclide containment is internationallyuniversal and comprises the fuel waste form itself, a metal con-tainer, a clay buffer compacted around the container, repositorysealing materials, and the geologic formation [1–3].
The spent-fuel has a very low solubility in the reducing ground-waters expected to prevail at a repository depth of ≥ 500 m.However, radioactive decay processes within the fuel will causewater radiolysis to produce reactive species (H2O2, HO• etc) [1] andgenerate oxidizing conditions at the UO2 surface. Consequently,H2O2, expected to be the primary radiolytic oxidant, could promotecorrosion of the UO2 [4], especially when the UO2
2+ complexingagent, HCO3
-/CO32-, is present in the groundwater [5–8].
∗ Corresponding author. Tel.: +1 631 344 76 4; fax: +1519 661 2111x86366.E-mail address: [email protected] (D.W. Shoesmith).
While the establishment of oxidizing conditions provides theprimary driving force, the corrosion performance of the fuel willalso be influenced by the fission products produced in the fuelmatrix during in-reactor burnup. The composition of fission prod-ucts is determined by the initial enrichment of the fuel and itsin-reactor irradiation history. The typical burn-up range for CANDUfuel is 120 to 320 MWh/kgU [3] but is significantly higher forLWR/PWR fuel [9,10]. Consequently, used nuclear fuel will consistof ∼95% UO2, with the remaining 5% being radioactive fission prod-ucts and transuranium elements present in various chemical states.Depending on in-reactor history these fission products redistributewithin the fuel. Volatile species (Xe, Kr, I) can diffuse out of the fuelmatrix to the fuel cladding gap while other elements precipitate inmetallic (Mo, Ru, Pd, Ru) and oxide form (Rb, Cs, Ba, Zr) or remainin solid solution (transuranium and rare earth elements (REE)) inthe UO2 matrix [9].
A number of physical and chemical changes induced by in-reactor irradiation would be expected to change the reactivity ofthe fuel [11]. These include primarily, (a) the introduction of grainboundary tunnels; (b) the generation of trapped fission gas bubbles;(c) the generation of noble metal particles; (d) the rare-earth dopingof the UO2 matrix; and (e) the presence of non-stoichiometry. Inthis paper we are primarily interested in the chemical changes
http://dx.doi.org/10.1016/j.electacta.2014.02.1340013-4686/© 2014 Elsevier Ltd. All rights reserved.

Author's personal copy
30 M. Razdan et al. / Electrochimica Acta 130 (2014) 29–39
(c) to (e) which can be simulated in custom-fabricated UO2/UO2+xspecimens.
The influence of rare-earth dopants, which occupy lattice sitesin the fuel matrix, on air oxidation of UO2 has been well studied(M = Gd, Y, La [12–17]). This reaction proceeds in two stages,
UO2→ U3O7/U4O9→ U3O8 (1)
via a U3O7 intermediate for pure UO2 whereas, when the UO2 issubstantially doped, the intermediate is U4O9. The second stepinvolving the recrystallization to U3O8 is kinetically hindered byrare earth doping [12,17,18] as indicated by the increase in temper-ature required to force the recrystallization to occur. Based on thisevidence for air oxidation, a similar influence of rare earth dopingon corrosion might be anticipated since the reaction proceeds by asimilar two stage sequence,
UO2→ UO2+x→ UO22+ (2)
except the final product is dissolved UO22+ as opposed to a recrys-
tallized deposit of U3O8.Some support for this expectation is evident in electrochemical
experiments on SIMFUELs in which a decrease in anodic dissolutioncurrent was observed as the extent of simulated burn up increased.SIMFUELs are natural stoichiometric UO2 pellets doped with 11non-radioactive elements (Ba, Ce, La, Mo, Sr, Y, Zr, Rh, Pd, Ru, Nd)to replicate the chemical effects of in-reactor irradiation [10,11].The amount of the individual elements added simulates a specificdegree on in-reactor burnup. The key features of these simulatedfuels are the rare earth doping of the UO2 matrix and the presence ofnoble metal (Rh, Pd, Ru) particles. The observed decrease in anodiccurrent was attributed to the influence of the rare earth dopants insolid solution in the UO2 matrix.
Non-stoichiometry has also been shown to exert a signifi-cant influence on UO2 reactivity [11]. MicroRaman spectroscopyshowed very distinct changes in fuel structure as x (in UO2+x)increases. Studies using AFM, current-sensing AFM and scanningelectrochemical microscopy [19] demonstrated that the fuel reac-tivity increased substantially with highly non-stoichiometric UO2+xbeing ≥ 103 more reactive than close to stoichiometric UO2+x. Whilethe exact mechanistic details remain unresolved, the extent ofoxidation on a surface close to stoichiometric appears limited bythe low interstitial mobility within the matrix. At higher degreesof non-stochiometry the formation of defect clusters enhances Ointerstitial mobility [11].
In this paper our primary interest is in the influence of rare-earths and noble metals contained within the UO2 matrix. Recentstudies [20] showed that the addition of small amounts of Y2O3(0.3 wt%) to UO2 decreased the corrosion rate (compared to UO2)by a factor of 3 to 5. Since the rate of H2O2 consumption was verysimilar for UO2 and UO2/Y2O3, this decrease was attributed to adecrease in reactivity of the UO2/Y2O3 pellet. However, the degreeof non-stoichiometry of these pellets was not characterized.
To further investigate the influences of rare earth doping andthe presence of noble metal particles we have performed a series ofelectrochemical and corrosion experiments on UO2 and UO2/Y2O3pellets with and without added Pd. The electrodes were charac-terized by scanning electron microscopy (SEM), energy dispersiveX-ray analysis (EDX), Raman spectroscopy and X-ray photoelectronspectroscopy (XPS). The redox behavior was characterized by cyclicvoltammetry (CV) and the anodic reactivity by potentiostatic oxi-dation. Corrosion behavior was investigated in H2O2–containingsolutions purged with Ar.
2. Experimental
2.1. Fuel specimens and electrode preparation
Four different electrodes were used in this study consisting ofundoped UO2 and UO2 doped with Y2O3 (0.3 wt%) and/or Pd (1wt%) received from The Royal Institute of Technology, Stockholm,Sweden. These electrodes were fabricated using depleted UO2 pow-der, Y2O3 powder (particle size ∼ 5 �m) and Pd powder (particlesize ∼ 1.0–1.5 �m) as described by Trummer et al. [20,21]. The elec-trodes were prepared from the pellets using a previously publishedmethodology [22] and are designated UO2, UO2-Pd, UO2-Y2O3, andUO2-Y2O3-Pd. Prior to electrochemical experiments and surfaceanalyses electrodes were polished (wet) with a 1200 grit polishingpaper and rinsed with deionized water.
2.2. Solutions
All solutions were prepared with analytical grade chemicalsand distilled deionized water (� =18.2 M� cm) prepared using aMillipore Milli-Q-plus unit to remove organic and inorganic impu-rities. Experiments were performed in a 0.1 mol.L−1 NaCl solution(Caledon, >99%) purged with Ar (Praxair). Prior to the start of anyexperiment solutions were purged with Ar gas for a minimum of1 hr. When borate buffered solution was used, 0.05 mol.L−1 borax(Merck) was added to the solution prior to the pH adjustment. Thesolution pH was adjusted to the desired value using NaOH andwas monitored with an Orion model 720A pH meter and adjustedaccordingly. Solutions containing H2O2 (Fisher Scientific, 3%) wereprepared by dilution. The concentration of H2O2 was determinedusing a BioLogic Science Instruments MOS UV/VIS spectrophotome-ter [23].
2.3. Electrochemical measurements
All experiments were carried out in a standard three-electrode,three-compartment cell. The WE was attached to the shaft of aPine Instruments model AFASR analytical rotator to allow electroderotation when required. The counter electrode was a Pt sheet (∼6cm2) spot-welded to a Pt wire. All electrochemical experimentswere performed (22 ± 2 ◦C) using a Solartron model 1287 potentio-stat to control applied potentials and record current responses. Thecurrent interrupt method was employed to eliminate the potential(iR) drop caused by the ohmic resistance (R) primarily in the elec-trode. CorrwareTM, version 3.0, software was used to analyze thedata. All the potential measurements reported are quoted on thesaturated calomel electrode (SCE) scale.
2.4. Experimental procedure
Before all experiments the electrode was cathodically reducedat two different potentials (usually -1.5 V and -1.2 V) for 2 to5 minutes, the H2 gas bubbles produced at the more negativepotential being released while still maintaining cathodic controlat the less negative potential. In CV experiments, the potential wasscanned from the starting potential to different anodic limits andback while recording the current.
In potentiostatic experiments the potential was pulsed to +0.4 Vafter cathodic cleaning and the current measured over a periodof 30 min at an electrode rotation rate of 16.67 Hz in Ar-purgedsolution. The electrode was rotated to ensure that the reactionwas interfacially controlled. In corrosion experiments the ECORRwas followed in a 0.1 mol.L−1 NaCl + 0.01 mol.L−1 NaHCO3 (pH∼ 9.0) solution purged with Ar until a steady-state value wasachieved. Hydrogen peroxide was then added and the ECORR mea-surement continued. A series of linear polarization resistance (LPR)

Author's personal copy
M. Razdan et al. / Electrochimica Acta 130 (2014) 29–39 31
measurements was made before and after H2O2 addition. In LPRmeasurements a small potential, in the range of ±10 mV withrespect to ECORR is applied at a scan rate of 0.0167 mV/sec andthe resulting (linear) current response measured. The LPR (Rp) isthe ratio of the applied potential to the current response and isinversely proportional to the uniform charge transfer rate at theelectrode/solution interface. Electrochemical experiments wererepeated twice to assure the reproducibility of the results.
2.5. Surface analysis
2.5.1. Scanning electron microscopy (SEM)/Energy dispersiveX-ray (EDX) analyses
An Hitachi S-4500 Field emission scanning electron microscope(SEM) coupled with a Quartz XOne energy dispersive X-ray (EDX)system was used for imaging. The SEM micrographs were obtainedon polished electrodes with the varied electron beam potentialranging from 10.0 kV to 15.0 kV. EDX mapping was performedto obtain the size, distribution and elemental composition of thedoping elements in the host matrix. The chemical composition ofindividual particles was also determined.
2.5.2. Raman spectroscopyRaman spectra were acquired on all four electrodes using a Ren-
ishaw 2000 confocal Raman spectrometer (Renishaw PLC., UK).
Raman active vibrations were excited using a HeNe laser with awavelength of 632.8 nm which produces ∼ 2 �m diameter focusedbeam at the sample surface. The laser was used at 50% power toavoid laser heating since small changes in temperature can pro-duce small changes in the frequency and width of Raman lines. Thespectrometer was calibrated using a Si crystal standard at roomtemperature. The laser beam was focused onto the sample mountedon a Leica DMLM microscope with a 50x uncoated objective lens.Each spectrum was measured for an exposure time of ∼45 sec overthe wavenumber range 120 to 1400 cm−1. Measurements wererepeated at a number of different locations on the electrode toensure uniformity of response. The Lorentzian peak model and aShirley baseline correction were used to fit the Raman peaks.
2.5.3. X-ray photoelectron spectroscopy(XPS)XPS analyses were performed on a Kratos Axis NOVA spectrom-
eter. Spectra were collected using Al K� -monochromatic radiation(15 mA, 14 kV) to bombard the surface with high energy monochro-matic X-rays (hv = 1486.6 eV). The instrument work function wasset to give a binding energy (BE) of 83.96 eV for the Au 4f7/2 linefor metallic Au and the spectrometer dispersion was adjusted togive a BE of 932.62 eV for the Cu 2p3/2 line of metallic Cu. Surveyspectra were recorded over the energy range 0 to 1100 eV on ananalysis area of ∼300 × 700 �m at a pass energy of 160 eV. Highresolution spectra for the U 4f, O 1s, C 1s and the U 5f valence band
Fig. 1. CV’s to various anodic limiting potentials recorded on the (a) UO2 (b) UO2-Y2O3 (c) UO2-Y2O3-Pd (d) UO2-Pd electrodes in Ar-purged 0.1 mol.L−1 NaCl solution bufferedwith sodium borate (0.05 mol.L−1) at pH∼9 (22 ± 2 ◦C). The scan rate = 5 mV.s−1.

Author's personal copy
32 M. Razdan et al. / Electrochimica Acta 130 (2014) 29–39
regions were collected with a pass energy of 20 eV. The instrumentcharge neutralizer was used on all specimens. The carbon 1s lineat 285 eV was used as a standard, when necessary, to correct forsurface charging. Spectra were analysed using CasaXPS software(version 2.3.14). The 4f spectrum was deconvoluted into contrib-utions from UIV, UV and UVI by fitting both the two spin-orbit splitpeaks and the associated satellite structures following the proce-dure described elsewhere [23]. Surface analysis was conducted onunpolished (as-received) and polished electrodes in order to ensurethe reproducibility of surface characteristic.
3. Results
3.1. Voltammetric behavior
Fig. 1 (a to d) shows a series of IR-compensated CVs recordedon the four electrodes to different anodic potential limits. Severalstages of oxidation and reduction are observed and the profiles forUO2 and UO2-Y2O3 ((a) and (b)) are effectively identical. On thetwo electrodes which contain Pd (UO2-Pd and UO2-Y2O3-Pd; (c)and (d)) the same stages of oxidation and reduction appear to bepresent but are swamped by the very large currents observed at thepositive and negative potential limits of the scan.
According to previous electrochemical and XPS studies per-formed on UO2 and SIMFUEL (1.5 at% simulated burn-up; i.e., onlylightly doped), oxidation of a stoichiometric surface should not beobserved until the applied potential is > −0.4 V [1,22]. However, onthe electrodes used in this study, a shallow oxidation is observedover the potential range -0.8 V to -0.4 V (I in Fig. 1), leading to anequally shallow reduction process over the potential range -0.6 Vto -1.2 V. A current at such low potentials was previously attributedto the oxidation of hyperstoichiometric UO2+x locations on the UO2surface [1]. More recently, this “sub-thermodynamic” oxidationwas shown to be a feature of non-stoichiometric UO2+x [24].
Over the potential range -0.4 V to -0.1 V a distinct anodic oxi-dation peak is observed (II in Fig. 1) leading to an equally distinctcathodic reduction peak at ∼ -1.2 V (VI in Fig. 1). A similar oxidation-reduction couple was observed previously on a uranium dioxidespecimen with an average stoichiometry of UO2.011 and known topossess distinct regions with various stoichiometries [25]. Anodicoxidation leading to a reduction process requiring such a negativepotential is indicative of the formation of a very stable oxidizedstate. The nature of this state is presently obscure although it isclearly associated with the oxidation of already non-stoichiometriclocations.
When the anodic limit is extended to potentials ≥ -0.2 V theoxidation current is sustained and leads to the development ofa cathodic reduction peak at ∼ -0.7 V (IV in Fig. 1). Oxidationand reduction in these potential ranges has been convincinglyattributed to the oxidation of stoichiometric UO2 and the sub-sequent reduction of the UO2+x/UO3.yH2O formed [1,24,26]. Forpotentials positive to ∼ 0.2 V the current increases further (III inFig. 1) leading to an increase in the reduction peaks at both -1.2 Vand -0.7 V consistent with the more extensive oxidation of bothnon-stoichiometric and stoichiometric locations on the UO2 sur-face. In addition, a new reduction peak develops in the potentialrange -0.9 to -1.0 V (V in Fig. 1). A similar oxidation peak wasobserved previously [25] and tentatively attributed to the anodicoxidation of deeper locations in an already oxidized surface layer.The potential required to reduce this oxidized state is consider-ably more negative (∼ -0.9 V) than that required to reduce the filmformed on stoichiometric UO2 (-0.7 V) consistent with the claimby He [25] that the reduction of deeply oxidized states is involved.Previously, the reduction peaks at -0.9 V and -1.2 V have only beenseen after the anodic oxidation of a non-stoichiometric UO2.011
10 10 0 1000
1E-5
1E-4
1E-3
Region 3Region 2
I (A
/cm
2 )
Time (sec)
1.5 at % SIMFUEL UO2
UO2-Y2O3
UO2-Y 2O3-Pd UO2-Pd
Region 1
abcdea
bc de
Fig. 2. Potentiostatic current-time curves recorded on a 1.5 at% SIMFUEL, and thefour electrodes at +0.4 V for 30 min in Ar purged 0.1 mol.L−1 NaCl buffered withsodium borate (0.025 mol.L−1) at pH∼ 9 (22 ± 2 ◦C).
electrode [25] clearly indicating that the UO2 and UO2-Y2O3 elec-trodes are non-stoichiometric or a mixture of non-stoichiometricand stoichiometric regions.
The same general features are observed on the UO2-Pd and UO2-Y2O3-Pd electrodes but are more difficult to see due to the largepositive and negative currents, most likely due to water oxidation(to O2) and reduction (to H2) on the Pd particles in the electrodes.These results demonstrate, (i) the influence of the Pd content onthe anodic current and (ii) the marginal influence of the Y-contenton the anodic behaviour of the UO2+x.
Fig. 2 shows a series of such experiments conducted at a poten-tial of 0.4 V for 30 minutes at an electrode rotation rate of 16.7 Hzwith the current density (I) plotted logarithmically as a function ofthe log of time. This potential was chosen since all the possible elec-trochemical reactions feasible on the UO2 surface will be occurringand the current response will reflect the overall anodic reactivity.A more extensive investigation of the individual anodic reactions isbeing undertaken and will be published separately. An experimenton 1.5 at% SIMFUEL is included for comparison since this electrodehas been well studied previously [22,26].
As shown, the SIMFUEL behavior is very different to thatobserved on the other four electrodes. The current at short times isconsiderably lower and the decrease in current at longer times con-sistent with previous electrochemical and XPS experiments whichshowed anodic oxidation proceeded through the sequence
UO2→ UO2+x→ UO3.yH2O (3)
with the formation of the UVI oxide layer leading to a generalpassivation of the surface [27]. The other four electrodes all exhib-ited considerably higher currents at short times and especially atlonger times. The increased currents at short times indicate a sig-nificant increase in overall reactivity of the electrodes comparedto the stoichiometric, but rare earth doped SIMFUEL. Also, at shorttimes, the currents observed on the two Pd-containing electrodesare slightly higher than on the other two electrodes as observed atthis potential under voltammetric conditions (Fig. 1). However, thisdifference is temporary and disappears for times ≥ 30s. As notedwhen discussing the CV behavior it is likely that this enhanced cur-rent can be attributed to H2O oxidation on Pd particles (see below).At longer times all four electrodes exhibit almost identical behav-ior and approach steady-state with no tendency to passivate. Suchbehavior has only previously been observed on non-stoichiometricelectrodes which have been shown to exhibit enhanced anodicreactivity [25].

Author's personal copy
M. Razdan et al. / Electrochimica Acta 130 (2014) 29–39 33
Fig. 3. SEM micrographs recorded on the (a) UO2 (b) UO2-Y2O3 (c) UO2-Y2O3-Pd and (d) UO2-Pd electrodes.
3.2. Surface characterization
3.2.1. SEM/EDX analysisFig. 3 shows SEM images of the surfaces of the four electrodes. At
the higher magnification the surfaces appear rough and finely par-ticulate. Figs. 4 and 5 show SEM images and EDX maps recorded onthe UO2-Y2O3 and UO2-Y2O3-Pd electrodes and show that both theY and Pd are unevenly distributed in the host matrix and present asindividual particles of different sizes and shapes. This is expectedfor Pd which has a very low solubility in the UO2 matrix. The Pdparticles formed are significantly larger than the particle size ofthe Pd powder (1-1.5 �m), used in their fabrication, which has been
attributed to the compaction technique used when forming the pel-lets [20]. Similarly distributed Pd particles were observed in theUO2-Pd electrode (not shown).
These maps show that the majority, perhaps all, of the Y ispresent in particulate form as a separate phase and not incoRpo-rated in solid solution in the UO2+x matrix. This is consistent withthe voltammetric data, Figs. 1 and 2, which show no significantinfluence of Y on the electrochemical behavior of the pellets.
3.2.2. Raman analysisFig. 6 shows the Raman spectra recorded on all four elec-
trodes. Raman scattering for stoichiometric UO2 should generate a

Author's personal copy
34 M. Razdan et al. / Electrochimica Acta 130 (2014) 29–39
Fig. 4. SEM micrographs recorded on a UO2-Y2O3 electrode and the corresponding EDX maps for U, Y and O. An EDX spectrum recorded on the identified particle is alsoshown.
fundamental vibrational stretch at ∼ 450 cm−1 and a second bandat ∼ 1150 cm−1 [28–30]. The 450 cm−1 (T2g) stretch is ascribedto the symmetric (g) stretching mode due to O breathing vibra-tions around UIV in the fluorite structure of UO2, whereas the ∼1150 cm−1 band can be assigned to an overtone of the first orderLO phonon at 575 cm−1. The 1150 cm−1 band has been shown to behighly sensitive to the extent of non-stoichiometry of the UO2 [31].
Inspection of the spectra showed the T2g band is broad andshifted to higher frequency (445 to 455 cm−1) for all four electrodes.Desgranges et al. [32] attributed this shift to the local disorderinvolved in U4O9 formation, U4O9 being a UO2 based lattice con-taining clusters of interstitial O atoms (cuboctahedra) and U inhigher oxidation states. Deconvolution of this band is shown forthe UO2-Y2O3 electrode in Fig. 7 yields peaks at 455 and 475 cm−1,the 475 cm−1 peak suggesting a distortion of the cubic symmetryinduced by the increasing concentration of O excess defects [31].However, a similar Raman shift to higher frequency and the devel-opment of asymmetry was reported as a consequence of rare-earth
(SmIII) doping in TiO2 samples [33], and other authors attributed apeak at ∼ 480 cm−1 to the Raman active Eg (U-O) stretching mode,a characteristic of the tri-uranium octaoxide (�-U3O8) [29,34,35].Although not shown an identical deconvolution is obtained on theother three electrodes.
In addition to this shift in the T2g band, all four spectra exhibit abroad band between 500 and 700 cm−1 commonly attributed to Osublattice damage [27,28,32,36], Fig. 6. The intensity of this band issignificantly greater than that of the T2g band, a feature previouslyshown to be associated with a high degree of non-stoichiometry(0.25 ≤ x ≤ 0.33) [31]. As shown in Fig. 7 for the UO2-Y2O3 electrodethis broad band can be deconvoluted into peaks at 585 cm−1and630 cm−1. The peak at 585 cm−1 is not generally associated withstoichiometric UO2 and has been attributed to the presence of bulkdefects [37]. It is also possible it is associated with the peak com-monly observed at 575 cm−1, a forbidden first order LO Ramanscattering mode allowed as a consequence of the breakdown inselection rules due to disorder induced by the presence of defects.

Author's personal copy
M. Razdan et al. / Electrochimica Acta 130 (2014) 29–39 35
Fig. 5. SEM micrographs recorded on the UO2-Y2O3-Pd electrode and the corresponding EDX maps for U, Y, Pd and O.
Such a breakdown would be expected from a loss of translationalsymmetry at vacancy sites due to O defect clustering and thechange in cation radius when UIV is converted to UV with increasingnon-stoichiometry. Again, although not shown, an identical decon-volution was obtained for the spectra recorded on the other threeelectrodes.
The strong peak at 630 cm−1 (an A1g stretch) has been fre-quently observed on hyperstoichiometric UO2+x and on rare earthdoped SIMFUELs [31,32,38,39]. Its universal observance in thespectra recorded on all four electrodes indicates it is most appropri-ately assigned to hyperstoichiometry in the present case. Originalsuggestions that this band in UO2+x could be attributed to dis-tortion of the anion sublattice due to the O ion displacementsrequired to accommodate excess O ions were recently confirmedby Desgranges et al. [32] who demonstrated this peak was a sig-nature of the cuboctahedral cluster associated with the presenceof U4O9. The small peak at 155 to 160 cm−1 is similarly associ-ated with U4O9 [32] and attributed to the distortion of the cation
sublattice associated with the formation of a tetragonal structure. Asimilar band has been reported for tetragonal zirconia (ZrO2) [40].
3.2.3. XPS analysisFig. 8(i) shows a deconvoluted high resolution XPS spectrum
recorded on the freshly polished UO2-Y2O3 electrode. Identicalspectra were observed (but are not shown) for the other electrodes.The location of the satellite peak at a binding energy of ∼7 eVhigher than the U 4f5/2 peak confirms that UIV is the dominantoxidation state present in the electrode surface. There is also ameasurable UV content indicated by the presence of the satellitepeak at a binding energy ∼ 8 eV above the U 4f5/2 peak. Therelative amounts of UIV and UV are only marginally influencedby the presence of Y and Pd, Fig. 8(ii). This is especially truefor UV. Noticeable amounts of UVI were also detected, possiblydue to air-oxidation while transferring the specimens from thepolishing area to the vacuum chamber of the XPS spectrometer.These observations, and the very high UV content, confirm the

Author's personal copy
36 M. Razdan et al. / Electrochimica Acta 130 (2014) 29–39
200 400 600 800 1000 1200 1400
Cou
nts
(arb
itrar
y)
Raman Shift (cm-1)
UO2
UO2-Y
2O
3
UO2-Y
2O
3-Pd
UO2-Pd
abcd
a
b
c
d
Fig. 6. Raman spectra recorded on the four polished electrodes.
specimens are non-stoichiometric in agreement with the Ramanand electrochemical results. It is worth noting that XPS analyses onSIMFUELs showed the UV content increased from ∼17% to ∼26% asthe extent of simulated burnup (and hence the rare earth dopinglevel of the UO2 matrix) increased from 1.5 at% to 6.0 at%. This canbe compared to the 36 to 37% measured on these four electrodes.
3.3. Corrosion potential (ECORR) and linear polarization resistance(Rp) measurements in H2O2 solutions
Corrosion experiments were conducted on rotating electrodes(16.7 Hz) in an Ar-purged 0.1 mol.L−1 NaCl solution containing0.01 mol.L−1 NaHCO3 (pH ∼ 9.0). The corrosion potential, ECORR,was monitored on each electrode until steady-state was achievedand then 2 mmol.L−1 H2O2 was added to the cell and the ECORR mea-surement continued, Fig. 9. Prior to H2O2 addition, ECORR reaches asteady-state value almost immediately on the SIMFUEL electrodebut this required a few hours on the other four electrodes. Eventu-ally, ECORR for the SIMFUEL achieves a value ∼ 70 mV more negativethan the values recorded on the other four electrodes.
Series of LPR measurements were conducted at regular intervalsand the Rp values are plotted in Fig. 10. The first two data points
400 500 600 700 8000
500
1000
1500
2000
2500
3000 Data Fit 455 cm-1
475 585 630
Raman Shift (cm-1)
Cou
nts
abcdef
ab
c
d
e
f
Fig. 7. Fitted and deconvoluted Raman bands for the wavenumber range 350 cm−1
to 850 cm−1 on UO2-Y2O3 electrode.
402 39 6 390 384 37 8
20
40
60
80
100
120 Data Fit enve lop UIV
UV
UVI
U4f 5/2
U4f 7/2
~8.0 eV
~6.9 eV
Inte
nsity
(cps
x102 )
iabcd
e
ab
d
e
c
Binding Energy (eV)
10
20
30
40
50
60
70
80
UO2-PdUO2-Y2O3-PdUO
2-Y
2O
3
UIV
UV
UVI
% F
ract
ion
of S
urfa
ce O
xida
tion
Elect rode s
UO2
ii
Fig. 8. (i) Fitted and deconvoluted XPS spectra for the U-4f region recorded on UO2-Y2O3 electrode; (ii) Relative fractions of all three oxidation states obtained from theXPS curve fitting.
0 10 20 30 40 50-1.2
-1.0
-0.8
-0.6
-0.4
-0.2
0.0
0.2
0.4
EC
OR
R (V
vs
SC
E)
Time (hour s)
1.5 at% SIMFUEL UO2
UO2-Y2O3
UO2-Y2O3-Pd UO2-Pd
abcde
a
b
c
de
Fig. 9. ECORR recorded as a function of time before and after the addition of H2O2
(2 mmol.L−1) to an Ar -purged 0.1 mol.L−1 NaCl solution containing 0.01 mol.L−1
NaHCO3 at pH ∼9.0 (22 ± 2 ◦C): the sudden increases in ECORR occur immediately onH2O2 addition.
Author's personal copy
M. Razdan et al. / Electrochimica Acta 130 (2014) 29–39 37
5 10 15 20 25
1000
10000
1.5 at % SIMFUEL UO2
UO2-Y2O3
UO2-Y2O3-PdUO2-Pd
Rp(o
hms
cm2 )
Time (hou rs)
After H2O2 add itio n
Prior toH2O2
additio n
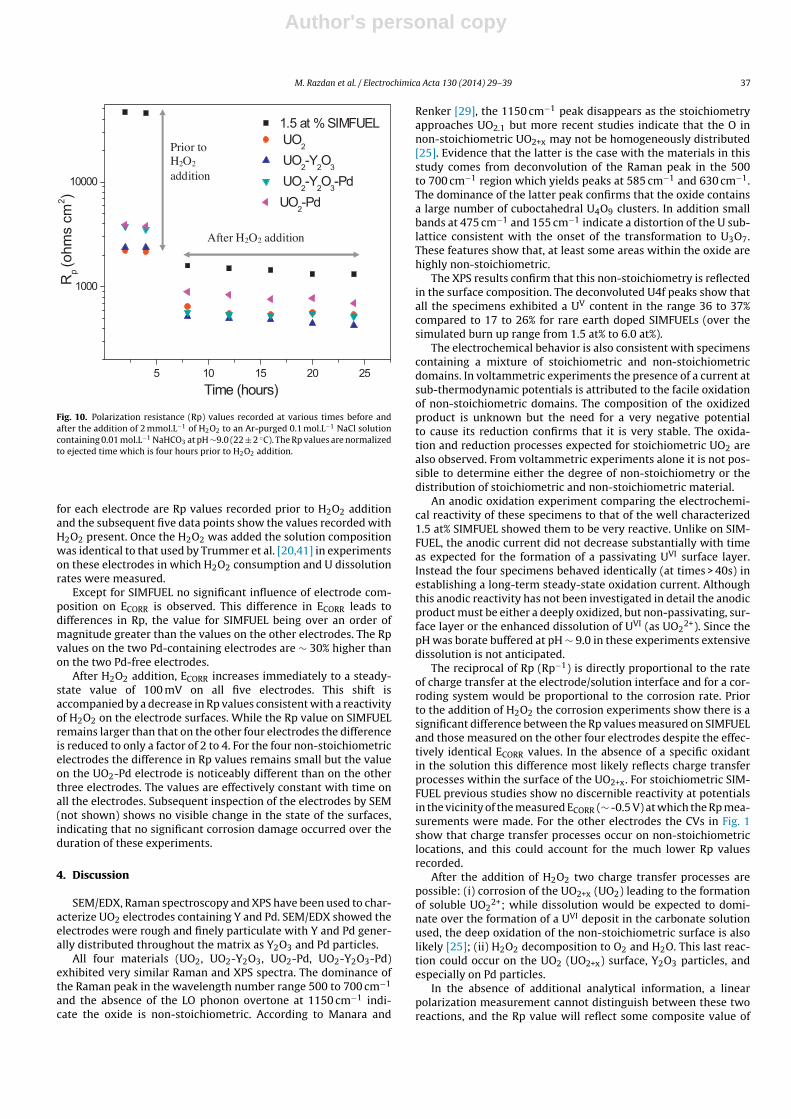
Fig. 10. Polarization resistance (Rp) values recorded at various times before andafter the addition of 2 mmol.L−1 of H2O2 to an Ar-purged 0.1 mol.L−1 NaCl solutioncontaining 0.01 mol.L−1 NaHCO3 at pH ∼9.0 (22 ± 2 ◦C). The Rp values are normalizedto ejected time which is four hours prior to H2O2 addition.
for each electrode are Rp values recorded prior to H2O2 additionand the subsequent five data points show the values recorded withH2O2 present. Once the H2O2 was added the solution compositionwas identical to that used by Trummer et al. [20,41] in experimentson these electrodes in which H2O2 consumption and U dissolutionrates were measured.
Except for SIMFUEL no significant influence of electrode com-position on ECORR is observed. This difference in ECORR leads todifferences in Rp, the value for SIMFUEL being over an order ofmagnitude greater than the values on the other electrodes. The Rpvalues on the two Pd-containing electrodes are ∼ 30% higher thanon the two Pd-free electrodes.
After H2O2 addition, ECORR increases immediately to a steady-state value of 100 mV on all five electrodes. This shift isaccompanied by a decrease in Rp values consistent with a reactivityof H2O2 on the electrode surfaces. While the Rp value on SIMFUELremains larger than that on the other four electrodes the differenceis reduced to only a factor of 2 to 4. For the four non-stoichiometricelectrodes the difference in Rp values remains small but the valueon the UO2-Pd electrode is noticeably different than on the otherthree electrodes. The values are effectively constant with time onall the electrodes. Subsequent inspection of the electrodes by SEM(not shown) shows no visible change in the state of the surfaces,indicating that no significant corrosion damage occurred over theduration of these experiments.
4. Discussion
SEM/EDX, Raman spectroscopy and XPS have been used to char-acterize UO2 electrodes containing Y and Pd. SEM/EDX showed theelectrodes were rough and finely particulate with Y and Pd gener-ally distributed throughout the matrix as Y2O3 and Pd particles.
All four materials (UO2, UO2-Y2O3, UO2-Pd, UO2-Y2O3-Pd)exhibited very similar Raman and XPS spectra. The dominance ofthe Raman peak in the wavelength number range 500 to 700 cm−1
and the absence of the LO phonon overtone at 1150 cm−1 indi-cate the oxide is non-stoichiometric. According to Manara and
Renker [29], the 1150 cm−1 peak disappears as the stoichiometryapproaches UO2.1 but more recent studies indicate that the O innon-stoichiometric UO2+x may not be homogeneously distributed[25]. Evidence that the latter is the case with the materials in thisstudy comes from deconvolution of the Raman peak in the 500to 700 cm−1 region which yields peaks at 585 cm−1 and 630 cm−1.The dominance of the latter peak confirms that the oxide containsa large number of cuboctahedral U4O9 clusters. In addition smallbands at 475 cm−1 and 155 cm−1 indicate a distortion of the U sub-lattice consistent with the onset of the transformation to U3O7.These features show that, at least some areas within the oxide arehighly non-stoichiometric.
The XPS results confirm that this non-stoichiometry is reflectedin the surface composition. The deconvoluted U4f peaks show thatall the specimens exhibited a UV content in the range 36 to 37%compared to 17 to 26% for rare earth doped SIMFUELs (over thesimulated burn up range from 1.5 at% to 6.0 at%).
The electrochemical behavior is also consistent with specimenscontaining a mixture of stoichiometric and non-stoichiometricdomains. In voltammetric experiments the presence of a current atsub-thermodynamic potentials is attributed to the facile oxidationof non-stoichiometric domains. The composition of the oxidizedproduct is unknown but the need for a very negative potentialto cause its reduction confirms that it is very stable. The oxida-tion and reduction processes expected for stoichiometric UO2 arealso observed. From voltammetric experiments alone it is not pos-sible to determine either the degree of non-stoichiometry or thedistribution of stoichiometric and non-stoichiometric material.
An anodic oxidation experiment comparing the electrochemi-cal reactivity of these specimens to that of the well characterized1.5 at% SIMFUEL showed them to be very reactive. Unlike on SIM-FUEL, the anodic current did not decrease substantially with timeas expected for the formation of a passivating UVI surface layer.Instead the four specimens behaved identically (at times > 40s) inestablishing a long-term steady-state oxidation current. Althoughthis anodic reactivity has not been investigated in detail the anodicproduct must be either a deeply oxidized, but non-passivating, sur-face layer or the enhanced dissolution of UVI (as UO2
2+). Since thepH was borate buffered at pH ∼ 9.0 in these experiments extensivedissolution is not anticipated.
The reciprocal of Rp (Rp−1) is directly proportional to the rateof charge transfer at the electrode/solution interface and for a cor-roding system would be proportional to the corrosion rate. Priorto the addition of H2O2 the corrosion experiments show there is asignificant difference between the Rp values measured on SIMFUELand those measured on the other four electrodes despite the effec-tively identical ECORR values. In the absence of a specific oxidantin the solution this difference most likely reflects charge transferprocesses within the surface of the UO2+x. For stoichiometric SIM-FUEL previous studies show no discernible reactivity at potentialsin the vicinity of the measured ECORR (∼ -0.5 V) at which the Rp mea-surements were made. For the other electrodes the CVs in Fig. 1show that charge transfer processes occur on non-stoichiometriclocations, and this could account for the much lower Rp valuesrecorded.
After the addition of H2O2 two charge transfer processes arepossible: (i) corrosion of the UO2+x (UO2) leading to the formationof soluble UO2
2+; while dissolution would be expected to domi-nate over the formation of a UVI deposit in the carbonate solutionused, the deep oxidation of the non-stoichiometric surface is alsolikely [25]; (ii) H2O2 decomposition to O2 and H2O. This last reac-tion could occur on the UO2 (UO2+x) surface, Y2O3 particles, andespecially on Pd particles.
In the absence of additional analytical information, a linearpolarization measurement cannot distinguish between these tworeactions, and the Rp value will reflect some composite value of

Author's personal copy
38 M. Razdan et al. / Electrochimica Acta 130 (2014) 29–39
the resistance to both processes. In comparison to the analyticalresults of Trummer et al. [20] and Pehrman et al. [41] the Rp valuewill be comparable to the total H2O2 consumption rate by both thecorrosion and decomposition reactions.
The values in Fig. 10 show Rp for the SIMFUEL is noticeablygreater than the values for the other electrodes when H2O2 ispresent, and with the exception of the UO2-Pd specimen the othervalues are effectively indistinguishable. Analytical experiments onSIMFUEL [41] show that while the rate of H2O2 consumption issimilar to that observed on the UO2 and UO2-Y2O3 electrodes, theU dissolution rate (which is a measure of the corrosion rate) is negli-gible. Although the doping level (expressed as a simulated burnup)of the SIMFUEL used is not given it will contain noble metal par-ticles which would support the decomposition process. However,a considerable amount of electrochemical evidence exists [7,42]showing that the H2O2 is reactive on the UO2 surface and that, atthe ECORR achieved (∼ + 0.1 V) the system is redox buffered by theH2O2 decomposition reaction. The results of Pehrman et al. [41]indicate that the rare earth doped stoichiometric UO2 matrix in thefuel is very stable under these conditions.
The similarity in Rp values for the UO2 and UO2-Y2O3 elec-trodes is consistent with the observations of Trummer et al. [20]who showed that the H2O2 consumption and U dissolution rateswere only slightly lower on the UO2-Y2O3 pellet than on the UO2pellet, the Y2O3 particles exerting little influence on the H2O2 con-sumption rate. Since the Y is not distributed within the uraniumoxide matrix the similarity in Rp values (surface reactivities) can beattributed to the identical nature of the oxide matrices as demon-strated voltammetrically and by Raman spectroscopy. The lower Rpvalues on the UO2 and UO2-Y2O3 electrodes compared to the SIM-FUEL can be predominantly attributed to the destabilizing influenceof cuboctahedral clusters in the matrix and their ability to supportreactions involving H2O2.
5. Summary and Conclusions
The electrochemical and corrosion behavior of a series ofuranium dioxide electrodes containing Y2O3 and Pd have beencharacterized by Raman spectroscopy and XPS and their reac-tivity investigated electrochemically. Both the Y2O3 and the Pdwere shown to be present in particulate form and the uraniumdioxide matrix was shown to contain both stoichiometric and non-stoichiometric domains.
Raman spectroscopy showed the oxides contained a high con-tent of cuboctahedral clusters and voltammetry suggested thatthese domains within the fuel are oxidized at sub-thermodynamicpotentials.
Electrochemical experiments showed that the anodic oxidationof these domains was extensive and not limited by the formationof a passive U(VI) layer, as observed for SIMFUEL.
Corrosion potential and linear polarization resistance mea-surements confirmed the electrodes were more electrochemicallyreactive than SIMFUEL in H2O2-containing solutions. As suggestedby the electrochemical results all the electrodes exhibited very sim-ilar corrosion behavior in H2O2 solutions.
The results confirm that the degree of non-stoichiometry willbe a dominant influence in determining the reactivity of spent fuelunder permanent waste disposal conditions. Although extensivenon-stochiometry is not expected in spent fuel its existence in grainboundaries within the fuel matrix is possible potentially makingthese locations more susceptible to corrosion than the stoichiomet-ric grains. Presently, it is assumed that the fission product inventoryat these locations would be rapidly released on contact of thefuel with groundwater. Until a more comprehensive understand-ing of the influences of rare earth doping and non-stoichiometry in
fuel corrosion is available this conservative assumption should beretained.
Acknowledgements
This research is funded under the Industrial Research Chairagreement between the Canadian Natural Sciences and Engineer-ing Research Council (NSERC) and Nuclear Waste ManagementOrganization (NWMO), Toronto, Canada. The Swedish Nuclear Fueland Waste Management Company (SKB) is also acknowledged forfinancial support. Surface Science Western is greatly acknowledgedfor the use of their XPS, Raman and SEM equipment.
References
[1] D.W. Shoemsith, Journal of Nuclear Materials 282 (2000) 1.[2] Nuclear Waste Management Organization (NWMO), Choosing a Way For-
ward: the Future Management of Canada’s Used Nuclear Fuel, November 2005,http://www.nwmo.ca
[3] J. McMurry, D. A. Dixon, J. D. Garroni, B. M. Ikeda, S. Stroes-Gascoyne, P.,Baumgartner, T. W. Melnyk, Ontario Power Generation Report No: 06819-REP-01200-10092-R00, 2003.
[4] K. Ollila, Posiva Oy: 2011-27, Eurajoki, Finland, May 2011.[5] I. Grenthe, J. Fuger, R.J. Konings, R.J. Lemire, A.B. Muller, C. Nguyen-Trung, H.
Wanne, Chemical Thermodynamics of Uranium, North Holland, Amsterdam,1992.
[6] D. W. Shoesmith, S., Sunder, W. H. Hocking, Electrochemistry of Novel Materi-als, ed. J. Liplowski and P. N. Ross, Vol. 297, New York, 1994.
[7] J.S. Goldik, J.J. Noël, D.W. Shoesmith, Electrochimica Acta 51 (2006)3278.
[8] S. Rollin, K. Spahiu, U.B. Eklund, Journal of Nuclear Materials 297 (2001)231.
[9] H. Kleykamp, Journal of Nuclear Materials 131 (1985) 221.[10] L. H. Johnson and D. W. Shoesmith, In Radioactive Waste Forms for the Future,
ed. W. Lutze and R. Ewing, Amsterdam, 1988.[11] H. He, M. Broczkowski, K. O’Neil, D. Ofori, O. Semenikhin, D.W. Shoesmith,
Nuclear Waste Management Organization, Ontario, Toronto, 2012.[12] J-Goo Kim, Y-Keong Ha, S-Dal Park, K-Yong Jee, W-Ho Kim, Journal of Nuclear
Materials 297 (2001) 327.[13] W.B. Wilson, Journal of Inorganic and Nuclear Chemistry 20 (1961)
242.[14] L.E. Thomas, R.E. Einziger, H.C. Buchanan, Journal of Nuclear Materials 201
(1993) 310.[15] G.S. You, K.S. Kim, D.K. Min, S.G. Ro, Journal of Nuclear Materials 277 (2000)
325.[16] R.D. Scheele, D.B. Hanson, E.S. Cumblidge, D.E. Jenson, E.A. Kozelisky, L.R. Sell,
J.P. MacFarlan, L.A. Snow, Material Research Society Symposium Proceedings824 (2004) 211.
[17] R.J. McEachern, D.C. Doern, D.D. Wood, Journal of Nuclear Materials 252 (1998)145.
[18] J-Won Choi, R.J. McEachern, P. Taylor, D.D. Wood, Journal of Nuclear Materials230 (1996) 250.
[19] H. He, Z. Qin, D.W. Shoesmith, Electrochimica Acta 56 (2010) 53.[20] M. Trummer, B. Dahlgren, M. Jonsson, Journal of Nuclear Materials 407 (2010)
195.[21] M. Trummer, S. Nilsson, M. Jonsson, Journal of Nuclear Materials 378 (2008)
55.[22] B.G. Santos, H.W. Nesbitt, J.J. Noel, D.W. Shoesmith, Electrochimica Acta 49
(2004) 1863.[23] M. Razdan, D.S. Hall, P.G. Keech, D.W. Shoesmith, Electrochimica Acta 83 (2012)
410.[24] H. He, R.K. Zhu, Z. Qin, P. Keech, Z. Ding, D.W. Shoesmith, Journal of the Elec-
trochemical Society 156 (2009) C87.[25] H. He, Ph.D. Thesis, Department of Chemistry, University of Western Ontario,
London, Canada, 2010.[26] B.G. Santos, J.J. Noël, D.W. Shoesmith, Journal of Electroanalytical Chemistry
586 (2006) 1.[27] D. Ofori, MS Thesis, University of Western Ontario, London, Canada, 2008.[28] H. He, P.G. Keech, M.E. Broczkowski, J.J. Noel, D.W. Shoemsith, Canadian Journal
of Chemistry 85 (2007) 1.[29] D. Manara, B. Renker, Journal of Nuclear Materials 321 (2003) 233.[30] S.D. Senanayake, G.I.N. Waterhouse, A.S.Y. Chan, T.E. Madey, D.R. Mullins, H.
Idriss, Catalysis Today 120 (2007) 151.[31] H. He, D. Shoesmith, Physical Chemistry Chemical Physics 12 (2010)
8108.[32] L. Desgranges, G. Baldinozzi, P. Simon, G. Guimbretière, A. Canizares, Journal of
Raman Spectroscopy 43 (2012) 455.[33] C.H. Yang, Z.Q. Ma, Applied Optics 51 (2012) 5438.[34] S.D. Senanayake, R. Rousseau, D. Colegrave, H. Idriss, Journal of Nuclear Mate-
rials 342 (2005) 179.[35] C. Jégou, R. Caraballo, S. Peuget, D. Roudil, L. Desgranges, M. Magnin, Journal of
Nuclear Materials 405 (2010) 235.

Author's personal copy
M. Razdan et al. / Electrochimica Acta 130 (2014) 29–39 39
[36] J.R. McBride, K.C. Hass, B.D. Poindexter, W.H. Weber, Journal of Applied Physics76 (1994) 2435.
[37] H. Idriss, Surface Science Reports 65 (2010) 67.[38] E.A. Stefaniak, A. Alsecz, I.E. Sajó, A. Worobiec, Z. Máthé, S. Török, R.V. Grieken,
Journal of Nuclear Materials 381 (2008) 278.[39] A. Seibert, S. Stumpf, D. Schild, T. Gouder, D. Bosbach, Institute for Transuranium
Elements FZKA 7489, Karlsruhe, Germany, 2009.
[40] P. Bouvier, G. Lucazeau, Journal of Physics and Chemistry of Solids 61 (2000)569.
[41] R. Pehrman, M. Trummer, C.M. Lousada, M. Jonsson, Journal of Nuclear Materials430 (2012) 6.
[42] S. Sunder, N.H. Miller, D.W. Shoesmith, Corrosion Science 46 (2004) 1095.