author's personal copy - uni-muenster.de · author's personal copy dynamics of redox...
TRANSCRIPT

This article appeared in a journal published by Elsevier. The attachedcopy is furnished to the author for internal non-commercial researchand education use, including for instruction at the authors institution
and sharing with colleagues.
Other uses, including reproduction and distribution, or selling orlicensing copies, or posting to personal, institutional or third party
websites are prohibited.
In most cases authors are permitted to post their version of thearticle (e.g. in Word or Tex form) to their personal website orinstitutional repository. Authors requiring further information
regarding Elsevier’s archiving and manuscript policies areencouraged to visit:
http://www.elsevier.com/copyright

Author's personal copy
Dynamics of redox processes in a minerotrophic fen exposed to a watertable manipulation
Klaus-Holger Knorr a, Gunnar Lischeid b, Christian Blodau a,⁎a Limnological Research Station, Department of Hydrology, University of Bayreuth, Universitaetsstr. 30, 95447 Bayreuth, Germanyb Leibnitz Centre for Agricultural Landscape Research, Institute of Landscape Hydrology, Eberswalder Str. 84, 15374 Müncheberg, Germany
a b s t r a c ta r t i c l e i n f o
Article history:Received 12 February 2009Received in revised form 12 August 2009Accepted 30 August 2009Available online 19 September 2009
Keywords:PeatlandsFenMethaneBiogeochemistryRedox processesClimate change
Climate change studies foresee substantial changes in precipitation patterns in northern temperate regions,including an increased frequency of drought and intense rain events. To elucidate the impact of drying andrewetting on redox processes in peatlands we conducted a field scale manipulation experiment, tracing thebelow ground dynamics of dissolved inorganic carbon (DIC), methane (CH4), and electron acceptors in aminerotrophic fen. On three treatment plots, a drought phase of ~4 weeks was initiated by means of adrainage system and a mountable roof. Subsequently we simulated a heavy rainfall by irrigation, whichraised the water table by 20–35 cm. Three plots served as control. Solute electron acceptor concentrationsincreased during drought and decreased after rewetting, consistent with treatment and weather. Changes insolid phase electron acceptor contents were not detected. Drought induced aeration regenerated electronacceptors and suppressedmethanogenic activity. This suppressive effect persisted during and some 1–4weeksafter rewetting, dependent on depth. Hydrogen- and acetate-dependent iron and sulfate reduction werethermodynamically viable processes in the peat as their energy gain exceeded the threshold for microbialmetabolism of −23 kJ mol−1. Hydrogenotrophic methanogenesis was apparently thermodynamicallyinhibited in most of the peat, but proceeded presumably in microenvironments. In the uppermost peat layers,partly above the water table level, iron and sulfate reduction and occasionally methanogenesis overlappedand aeration was limited. Thus, in these layers reductive processes could partly proceed even during drought.As all processes, including methanogenesis, responded quickly to wetting events, the microbial communityseemed to be well adapted to fluctuating redox conditions. This study demonstrated that the dense and highlydecomposed material could still provide anaerobic habitats for microorganisms during drought and the depthdistribution of redox processes was quite insensitive towards the water table manipulations, presumablydue to formation of microenvironments.
© 2009 Elsevier B.V. All rights reserved.
1. Introduction
Peatlands have withdrawn an estimated 270–370 Pg of carbonfrom the atmosphere (Batjes, 1996; Turunen et al., 2002) but on theother hand contribute 2–10% to the global natural methane emissions(Mikaloff Fletcher et al., 2004). Peatlands are also considered tobe vulnerable to climate change due to their dependence on soilhydrology and temperature (Moore, 2002). The predicted increase inprecipitation in winters and drier summers with strong convectiverainfalls (IPCC, 2001) are thus expected to change carbon cycling innorthern wetlands, which is a matter of concern (Moore, 2002).
Most studies have focused on long term changes in average soilmoisture or temperature on the carbon balance of peatlands (Laiho,
2006, and refs. therein). The impact of extreme weather, such asdrought, on belowground respiration and methane dynamics andunderlying redox dynamics is however not well quantified. This ispartly related to the difficulties of studying individual processes in-situ,which is in turn due to the difficulty to identify responses to controllingfactors in field studies. The contribution of autotrophic and heterotro-phic respiration to soil respiration and, even more so, changes in theirrates due to variations in soil moisture and temperature are difficultto separate. This makes it difficult to establish general relationshipsbetween environmental controls and process rates (Aerts and Ludwig,1997; Blodau, 2002 and refs. therein; Yavitt et al., 2005). A furthercaveat of field studies is the interaction of environmental factors,which prevents assigning a certain ecosystem response to an individualcontrolling factor. To circumvent this problem, several studies werebased on laboratory incubations of samples that were retrieved aftermanipulations in the field (e.g. Corstanje and Reddy, 2004; Kettunenet al., 1999; Moore and Dalva, 1993), and on the mesocosm approach,which allows to manipulate water tables in the laboratory, while
Geoderma 153 (2009) 379–392
⁎ Corresponding author. Present address: Canada Research Chair in EnvironmentalGeology and Biogeochemistry, School of Environmental Sciences, University of Guelph,Guelph ON N1G 2W1, Canada. Tel.: +1 519 824 4120 56203; fax: +1 519 824 5730.
E-mail address: [email protected] (C. Blodau).
0016-7061/$ – see front matter © 2009 Elsevier B.V. All rights reserved.doi:10.1016/j.geoderma.2009.08.023
Contents lists available at ScienceDirect
Geoderma
j ourna l homepage: www.e lsev ie r.com/ locate /geoderma

Author's personal copy
holding other variables constant and maintaining a realistic represen-tation of the ecosystem (Blodau and Moore, 2003; Knorr et al., 2008a).Such approaches cannot fully represent reality, however, and a numberof ecosystem experiments have been conducted in response, in whichtemperature, irradiation or hydrologywere activelymanipulated in-situ(Bridgham et al., 1999; Chimner and Cooper, 2003; Granberg et al.,2001; Updegraff et al., 2001).
The production of CO2 and CH4 and their relation to the productionand consumption of electron donors and acceptors has rarely beenstudied in intact peat soils (Knorr et al., 2008a; Küsel et al., 2008). Ourunderstanding of the in-situ impact of drought and rewetting on thecomplexanaerobic respirationnetwork and theoxidation and reductionof nitrogen, iron and sulfur in peat soils is therefore limited. It can beassumed that terminal respiration pathways follow a sequence that isgoverned by Gibbs free energies due to the capacity of bacteria to lowersubstrate concentrations to levels that thermodynamically inhibitprocesses with a lower standard Gibbs free energy (Conrad, 1999).Of all terminal respiration processes, methanogenesis is the processyielding the lowest amount of Gibbs free energy (Stumm and Morgan,1996), and in agreement with this concept, presence of alternativeelectron acceptors was often observed to suppress methanogenicactivity (e.g. Achtnich et al., 1995; Roden and Wetzel, 1996; Yavittand Lang, 1990). Such an effect was not always found, however, in bothlaboratory incubations and field measurements (Dettling et al., 2006;Vile et al., 2003). Blodau and Moore (2003) speculated that suchdisparate resultsmaybe a result of adaptation ofmicrobial communitiesto frequently changing redox conditions and substrate availability in thenear-surface peat. Evidence has also accumulated that microenviron-mentsmay allow for a coexistence of these processes on the soil horizonscale (Knorr et al., 2008a; Paul et al., 2006). To better understand thesuppression of methanogenesis by drought and rewetting in peatlands,it is thus important to obtain temporally highly resolved concentrationdata indicative of the induced redox processes, and to relate theseprocesses to potential thermodynamic constraints.
In this study we investigated how experimental drought andsubsequent rewetting affected production and consumption of electronacceptors, i.e. nitrate, ferric iron and sulfate, andmethane concentrationpatterns in the subsurface of a minerotrophic fen. High spatiotemporalresolution of sampling allowed for identifying local effects of vegetationand site heterogeneity. Fens represent a considerable fraction ofpeatlands, also in Bavaria (originally some 30–60%, Wagner andWagner, 2005), and have been identified as a peatland type withoften high potential methane production and soil respiration due topresence of easily degradable substrates, especially in the shallow peat(Bartlett and Harriss, 1993; Chimner and Cooper, 2003; Nilsson et al.,2001). Fens often also contain larger quantities of terminal electronacceptors, which can be supplied by the watershed, possibly contrib-uting to the suppression of methanogenesis after drought events (Küselet al., 2008; Paul et al., 2006). To study these effects in-situ, we drainedthree experimental plots and subsequently rewetted themby irrigation,and compared them to three control plots. We expected that droughtand rewetting would lead to oxidation and subsequent reduction ofnitrogen, iron and sulfur in the soils and suppress methanogenesis byrespiration of nitrate, ferric iron and sulfate on a time scale of weeks tomonths, as previously observed in a controlled laboratory mesocosmexperiment (Knorr and Blodau, 2009). Furthermore, we expectedshallow peat to respond more quickly to drought and wetting thandeep peat due to a higher availability of degradable substrates.
2. Methods
2.1. Study site
This studywas conducted at the Schlöppnerbrunnen fen site, locatedin north-eastern Bavaria. The elevation is ~700 m, mean annualprecipitation 1995–2007was ~1020mmandmean annual temperature
was~6.3 °C. Thepeat thickness ranges from30 to120 cm. Thematerial isrich in iron and sulfur (Paul et al., 2006), dense and highly decomposedbelow5–10 cmdepth (vonPost Scale 3–9) (Goldberg et al., 2008).Meanannual water table levels were 13±19 cm but occasionally droppeddown to >70 cm below soil surface in summer 2002 (Paul et al., 2006).In its north-western part the site is water logged throughout the yearand the vegetation comprises mainly Carex rostrata and Sphagnumfallax, while towards the south-east it is only periodically waterloggedand Nardus stricta, Agrostis sp.,Molinia coerulea, Eriophorum vaginatum,Brachythecium rivulare, and Polytrichum commune dominate.
For the study six experimental plots were prepared, three controlplots, C1–C3, and three drying-rewetting plots, D1–D3 (Fig. 1). Due tothe heterogeneity of the site, a moisture gradient occurred along theexperimental plots: in the northern plots C1 and D1 wetter conditionspersisted throughout the experimental period compared to thesouthern plots C3 and D3, despite of the drainage. Size of the plotswas 7.2×5 m2 each. The D plots were located downstream of the Cplots in terms of groundwater flow direction. At each plot we installedtwo drainage systems, one at the north-eastern (upstream) and one atthe south-western (downstream) edge. At the control plots we alsoinstalled the drainage system to create the same initial conditions forboth treatments, but no water was retrieved from that drainage.
2.2. Water table manipulation
In April and May, the water table was about 10–30 cm below peatsurface. The roof was closed on the 10th of Mai 2007 (day 129) and thedrainage ditches of the D plots pumped empty. Open sides of the rooftunnels allowed for air circulation and minimized temperature effects.
Fig. 1. Schematic sketch of the study site. The non-treated control plots C1–C3 arelocated upstream of the treatment plots D1–D3 in terms of groundwater flow direction.Boardwalks to minimize disturbance during access are depicted as grey lines. The siteis surrounded by Norway spruce forest, the open area is marked by the dashed line. Atthe site there is a moisture gradient from north to south. During the drought period,D1–D3 were covered with a roof construction and the drainage system was emptiedconstantly.
380 K.-H. Knorr et al. / Geoderma 153 (2009) 379–392

Author's personal copy
After ~4weeks, thewater tablewas lowered to about 1mbelow surfaceat both ends of the plots and to about 40 cmbelow surface in themiddle,about 20 cm lower than in the control plots (Fig. 2). These relativedifferencesweremaintained,whilewater tablesfluctuated. Thedroughtlasted till 19th of July. Subsequently we applied ~182 mm of artificialrainwater, 111 mm on the 19th (day 199) and 71 mm on 23rd of July(day 203) at rates of ~11mm h−1. The irrigate represented the averageconcentrations of solutes in precipitation and contained 34 µmol L−1
NO3− and NH4
+, 12 µmol L−1 SO42−, 19 µmol L−1 Na+, 4 µmol L−1 Ca2+
and 8 µmol L−1 K+. Irrigation raised the water table to the level of thecontrol plots (0–5 cm below surface). A small fraction of irrigate wasalso lost due to surface runoff. All variables were monitored foradditional 8 weeks after rewetting.
2.3. Sampling, analytical techniques and calculations
Soil gases were sampled using a diffusive equilibration samplerconsisting of a 30 mm PVC pipe wrapped with 2 m of silicon tubing(3 mm i.d., 5 mm o.d.) per sampling interval (10 cm) down to 60 cm.The silicon tubes were sealed at one end and the other was connectedto 1.8 mm inner diameter polyurethane tubing reaching to the peatsurface with a stop-cock. For details of the construction see Fig. 3 (allmaterials from VWR International, Darmstadt, Germany). Silicontubes have been shown to be suitable to sample soil gases, as they arepermeable within hours for a variety of gases, such as CO2, CH4
and N2O (Kammann et al., 2001). Soil gases were analyzed for CO2 andCH4 after transfer of samples into plastic syringes and using a gas-
Fig. 2. Precipitation at the study site during the course of the experiment and corresponding water table levels in all plots. The drought period was from days 129 to 203. The effectof our drainage and roof system was expressed in a noticeably lowered water table of the treatment plots compared to the corresponding control plots (i.e. C1 vs. D1, C2 vs. D2,and C3 vs. D3).
381K.-H. Knorr et al. / Geoderma 153 (2009) 379–392

Author's personal copy
chromatograph (SRI 8610 equipped with methanizer and flameionization detector, SRI Instruments, Torrance, USA). Hydrogen wasmeasured using a hydrogen analyzer TA 3000 (Trace Analytical,AMETEC, Newark, USA). Concentrations of dissolved inorganic carbon(DIC), methane and hydrogen were recalculated from gas samplesassuming equilibrium and using Henry's constants recalculated forthe corresponding in-situ temperature (Lide and Frederikse, 1995).Temperature was recorded in corresponding depths using thermo-couples and data-loggers (delta T devices, Cambridge, UK).
Soil solution was sampled using Rhizon® soil solution samplers(pore size ~0.16 µm, length 10 cm, diameter 3mm, fibre glass support,Eijkelkamp, Giesbeek, The Netherlands). A peat core of 10 by 10 cmand 50 cm length was extruded and two samplers per depth wereplaced at 5, 10, 20, 30, 40 and 50 cm below the soil surface each. Thepit was subsequently refilled with the previously extruded peat core.Soil solution was sampled weekly from 30.04.2007 (day 119) to14.09.2007 (day 256). Syringes were used to obtain the samples withminimal exposure to atmospheric oxygen.
Values of pH were determined in the field using a glass electrode(WTW, Weilheim, Germany). For determination of H2S, an aliquot of
2 ml was transferred into a plastic (PP) cuvette, which had beenprepared with 750 µl of Zn-acetate solution to fix the sulfide untilmeasurement in the laboratory (approx. after 1.5h)with themethylene-blue method (Hofmann and Hamm, 1967). Ferric and ferrous iron wereanalyzed analogously in cuvettes preparedwith 50 µl 6 NHCl to preventoxidation before analysis (phenanthroline method, Tamura et al.,1974). Major anions (Cl−, NO3
−, PO43−, SO4
2−, S2O32−) and short chain
fatty acids (formiate, acetate, butyrate) were analyzed using ionchromatography with chemical suppression and conductivity detector(Metrohm modular IC system, Anion Dual 3 Column, Metrohm,Filderstadt, Germany). Formiate, Butyrate, PO4
3− and S2O32− were never
detected at a detection limit of 0.01 mg L−1. Dissolved organic carbon(DOC) was measured on a TOC-Analyzer (Shimadzu Europe, Duisburg,Germany).
We analyzed the solid phase on 7 occasions in 5, 10, 20, and 30 cmdepth and determined contents of reactive ferrous and ferric iron,extractable with 1N HCl in 24 h (Wallmann et al., 1993). Contentsof total reduced inorganic sulfur (TRIS) were determined using adistillation apparatus akin to that described in Wieder et al. (1985).Three milliliters of ethanol, 5 ml of 5N HCl and 15 ml of a 1M Cr2+
solution were added and the samples were allowed to boil for 1 h. Thereduced sulfur species (S22−, S2−, S0) were released as H2S and trappedin 0.15N NaOH. Total sulfides in the trapped solution were quantifiedas described.
For determination of sulfate reduction rates small peat-subcores of30 mm diameter and ~3–5 cm length were retrieved from 5, 10, 20and 30 cm depth. The cores were transferred into PVC tubes andstoppered at both ends, maintaining in-situ moisture and redoxconditions. The radioactive sulfate (Perkin Elmer LAS Europe, Monza,Italy) was injected in 45–60 µl of degassed water, equivalent to anactivity of 75–120 kBq. The cores were incubated at room temper-ature in the dark for 90 minutes, then immersed in liquid nitrogen,and subsequently stored at −30 °C. The incubation time was chosenas tests revealed a decreasing reduction rate at longer incubationtimes (data not shown), presumably due to a recycling of reducedsulfur species (Jorgensen, 1978). For analysis, the cores were thawedin a Zn-acetate solution to prevent the sulfides from oxidation.An aliquot was transferred in a three-neck flask and analyzed asdescribed above for solid phase TRIS measurements. The activity ofreduced sulfur was measured in a 1 ml aliquot of the NaOH trapsolution in a liquid scintillation cocktail (Aquasafe 300 plus, ZinsserAnalytic, Frankfurt, Germany) using a Beckman LS 6500 counter(Beckman Coulter, Fullerton, USA).
Thermodynamic energy yields of ferric iron and sulfate reductionand methanogenesis was calculated for pathways using either H2 oracetate as electron donor. Reaction stoichiometries and constants aregiven in Table 1, assuming ferrihydrite as ferric iron phase.
Contour-plots for solutes concentration data were created usingSurfer 8 (Golden Software, Golden, CO, USA) and an inverse distanceinterpolation method. Interpolation of the data (approx. 125 datapoints per plot) was adjusted to leave actually measured dataunchanged; for all calculations only measured values were usedwhile interpolated data is only presented to facilitate reading of thegraphs.
Fig. 3. Schematic sketch of the soil gas samplers used in the study to determine dissolvedCO2, CH4 and H2 concentrations. In the silicon gas sampler, a gas concentration inequilibrium with the surrounding water or gas phase is measured (Kammann et al.,2001). A recalculation of the dissolved gas concentrations was done using Henry's lawand the corresponding constants and pH values as stated in the Methods section.
Table 1Stoichiometries and thermodynamic energy yield ΔGR
0 (standard conditions) and ΔGRt (temperature corrected for 10 °C) of selected microbial respiration pathways: ferric iron
reduction (FeR), sulfate reduction (SO42−R) and methanogenesis (M).
Index Stoichiometry ΔGR0 (kJ mol L−1) ΔGR
t (kJ mol L−1)
FeR Fe(OH)3+1/2 H2+2 H+ → Fe2++3 H2O −181.1a,b,c −183.9a,b,c
Fe(OH)3+1/8 CH3COO−+17/8 H+ → Fe2++1/4 CO2+11/4 H2O −582.4a,b,c −587.8a,b,c
SO42−R SO4
2−+4 H2+2 H+ → H2S+4 H2O −302.2a,b −300.8a,b
SO42−+CH3COO−+3 H+ → H2S+2 H2O+2 CO2 −160.2a,b −154.3a,b
M CO2+4 H2 → CH4+2 H2O −193.0a,b −194.3a,b
CH3COO−+H+ → CH4+CO2 −51.0a,b −49.2a,b
Thermodynamic data was taken from aNordstrom and Munoz (1994), bStumm and Morgan (1996), and cMajzlan et al. (2004).
382 K.-H. Knorr et al. / Geoderma 153 (2009) 379–392

Author's personal copy
3. Results
3.1. Weather and hydrology
In the beginning of our field season in April, the weather was quitedry and thus lead to relatively lowwater table levels. Total precipitationof 2007 was 1268 mm compared to a 13 year mean of 1020±203 mm(1995–2007), making 2007 a wet year. Mean temperature in 2007 waswarm (7.4 °C) compared to a 1995–2007 mean of 6.3±0.9 °C. Soiltemperature at 5 cmdepth increased fromabout 5 °C at the beginning ofthe experiment reaching 15 °C around rewetting and again decreasingthereafter (Fig. 2). The water table within the experimental plots didvary considerably over time due to precipitation but the water tablelevel in the drought plots was held ~20 cm below the levels in thecontrol plots for a period of ~40 days after day 155 (Fig. 2). Due to thegiven spatial soil moisture gradient across the peatland, the watertable in D1 was only lowered about 10–20 cm compared to C1, whilein D3 thewater table level was temporarily >30 cm lower than C3. Dueto these relatively dry conditions, the strongest treatment effects inD3 occurred by irrigation.
3.2. Solutes
Dissolved inorganic carbon (DIC) concentrations were fairlylow and rarely exceeded 2000 µmol L−1. Concentrations in the un-saturated peat were generally around or below 500 µmol L−1 and
>1000 µmol L−1 in the water saturated peat (Figs. 4, 5). Lowestvalues were thus measured during the drought period in D1–D3, asthe deeper peat became unsaturated, i.e. down to ~30 cm in D1 anddown to ~40 cm in D2 and D3. After rewetting, DIC concentrationsrapidly rebounded to pre-drought levels in D1 and D2 and evenexceeded these concentrations in D3. Following twomajor rainfalls ondays 149 and 166 providing ~45 and ~65 mm, respectively, DICquickly increased in the upper profiles of C1–C3, as observed afterirrigating D1–D3. The rapid response of DIC concentrations to wettingthus suggested increased respiration activity or a slow down ofdiffusive transport with lowered air filled porosity.
Nitrate was mostly below detection (<0.2 µmol L−1) and onlyoccasionally reached up to 50 µmol L−1 during drought and in theuppermost depths of C3 and D3 (data not shown). Ferrous ironconcentration ranged from below detection to 50 µmol L−1 in all plotswith the exception of C3,where concentrations reached>100 µmol L−1
(Figs. 4, 5). Highest concentrations generally occurred with increases insoil moisture, although patterns differed somewhat between plots. InC1, C2, D1 and D2, concentrations peaked in ~30 cm depth and close tothe surface after wetting events. In C3, concentrations increased morebroadly and in D3 in the deeper peat and at the surface. Both irrigationand natural rainfall thus induced a pulse of iron reduction, leading to apronounced iron dynamics. Sulfate was initially generally present in theshallow peat at concentrations of 25–75 µmol L−1, presumably due tothe dry weather conditions prior the experimental period (Figs. 4, 5).Highest concentrations were observed in the drier plots C3 and D3. In
Fig. 4. Concentrations of dissolved inorganic carbon (DIC), ferrous iron (Fe2+), sulfate (SO42−), and methane (CH4) in the plots C1 (left) and D1 (right). All concentrations are given in
µmol L−1. Data for C2–C3 and D2–D3 is in Fig. 5. The drought phase lasted from days 129 to 203, indicated with solid arrows. Open arrows indicate major rain events (compare Fig. 1)and the thin line denotes the approximate water table over time and depth.
383K.-H. Knorr et al. / Geoderma 153 (2009) 379–392

Author's personal copy
Fig. 5. Concentrations of dissolved inorganic carbon (DIC), ferrous iron (Fe2+), sulfate (SO42−), andmethane (CH4) in the plots C2 and D2 (left) and C3 and D3 (right). All concentrations are given in µmol L−1. Data for C1 and D1 is in Fig. 4. The
drought phase lasted from days 129 to 203 (indicated with solid arrows). Open arrows indicate major rain events (compare Fig. 2) and the thin line denotes the approximate water table over time and depth.
384K.-H
.Knorr
etal./
Geoderm
a153
(2009)379
–392

Author's personal copy
the D1–D3 plots, concentrations of 20–100 µmol L−1 persisted duringthe experimental drought period from days 129 until 203. Afterirrigation, sulfate concentrationsdiminished inD1andD2, but remainedat >25 µmol L−1 down to 40 cm in D3.
Dissolved CH4 concentrations hardly exceeded 40 µmol L−1 withthe exception of C1 (Figs. 4, 5). In the unsaturated zone, CH4
concentrations were mostly <5 µmol L−1 in the densely rooteduppermost soil layer but following rainfall increased to >20 µmol L−1
in C3 on days 166, 203 and 233.Methane concentrationswere loweredduring drought in D2, D3 and especially in D1. This coincided witha decrease in ferrous iron and an increase in sulfate concentrations.After wetting, CH4 concentrations slowly increased, but only below20–30 cm depth in D2 and D3. In D1, elevated CH4 concentrationsoccurred also close to the soil surface. Methane concentrations afterrewetting thus roughly followed a redox sequence, with elevatedCH4 concentrations occurring after the oxidized forms of iron andsulfur had diminished.
Dissolvedhydrogen concentrations,whichcould onlybedeterminedfrom 29th May 07 to 10th July 07, ranged from 0.2 to 13 nmol L−1 andwere highest in the shallow peat (0–10 cm) of C1–C3 at levels of>5 nmol L−1 (Fig. 6). The dryer conditions in the shallow andintermediate peat (0–30 cm) of the D plots coincided with lowerhydrogen concentrations of <1 nmol L−1. Hydrogen concentrationmaxima in the D plots corresponded with depths of highest methaneconcentrations. Acetate concentrations were low in all plots, reachingmaxima of only 20 µmol L−1 in the shallow depths, and did not respondto the drought but probably temporarily decreased right after rewetting(2–10 µmol L−1 vs. 5–15 µmol L−1, data not shown).
3.3. Solid phase
Total iron and reduced sulfur contents varied among and withinplots but the top soil was enriched with reactive iron (1N HCl
extractable) at ~200 to ~900 µmol g−1 dry matter in the uppermost5 cm, particularly in C1, D1 and D2 (Fig. 7, top). Below, contentssharply decreased by a factor of 2–8. As reactive iron was by fardominated by ferric iron, this solid phase fraction provided a con-siderable electron accepting capacity of 6.2–14.8 mol electronequivalents m−2 in the upper 30 cm (Table 1). Ferrous reactive ironcontent amounted to about 1/6 to 1/4 of ferric iron content. Due tothe large pool size, drying and rewetting did, however, not lead todetectable changes in ferrous (Table 1) or ferric reactive iron contents(data not shown). Total reduced inorganic sulfur (TRIS) contentsmostly peaked below the depths of iron enrichment but depthpatterns were not fully consistent (Fig. 7, bottom). TRIS contentspeaked at ~8 to ~25 µmol g−1 in C1, D1 and D2, as observed for iron,and at ~4.5 to ~9 µmol g−1 in C2, C3 and D3. Contents of TRIS, AVS andCRS did not consistently respond to soil moisture either.
To estimate a potential contribution of solid phase species (Table 1)to the below ground electron flow at the site, we used the standarddeviation of contents over time and converted these into an potentialelectron flow. To this endwe assumed TRIS to be present as S(−II) andto be oxidized to S(+VI) over the observation period of 105 days.Following this concept, reduced sulfur species accounted for more ofthe solid phase electron donor capacity when compared to iron. Thestandard deviation of analyzed iron and sulfur solids was in the rangeof 10–50% of the average absolute value (iron: 40–950 µmol g−1,sulfur: 4–25 mmol g−1) and would account for potential turnoverrates of 16–67 mmol m−2 d−1 of electron acceptors and 16–44 mmol m−2 d−1 of electron donors.
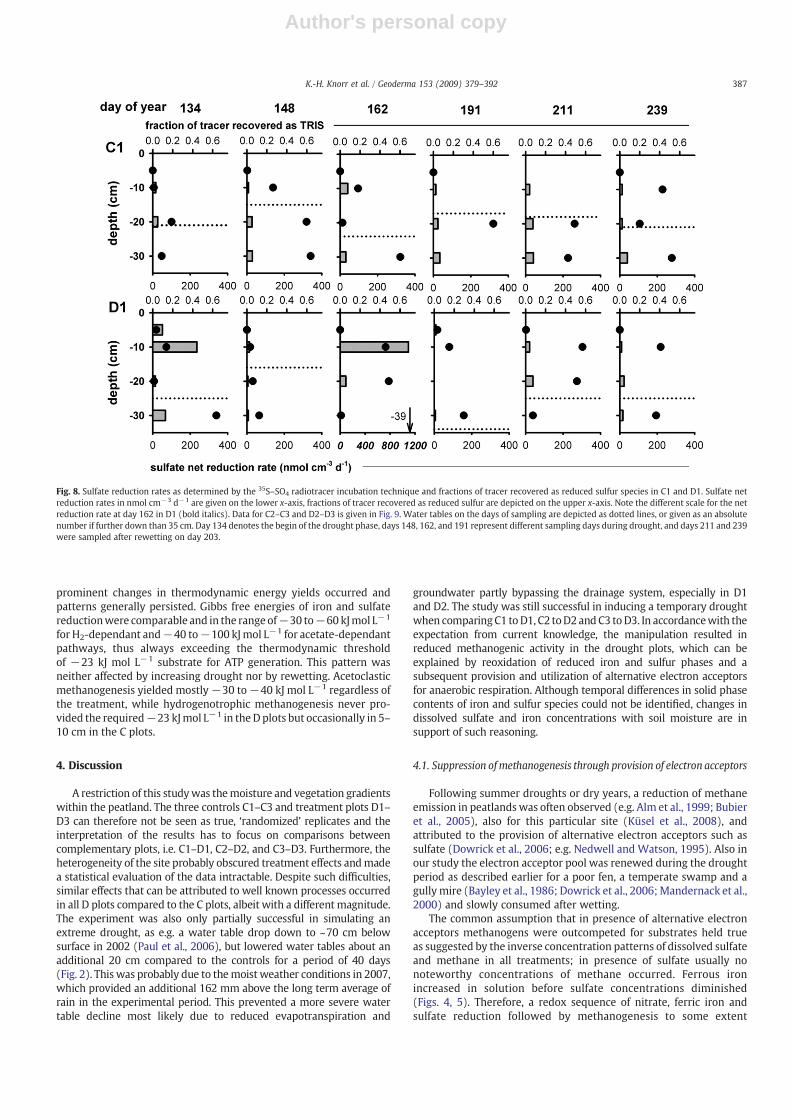
3.4. Sulfate gross reduction rates
In the control plots sulfate gross reduction rates mostly peaked inthe uppermost layers at diminishing levels over time (Figs. 8, 9). Atdays 148 and 191, rates were temporarily elevated at 20 and 30 cm
Fig. 6. Concentrations of dissolved hydrogen (H2), averaged over days 149–190 (29thMay 07–10th July 07). All concentrations are given in nmol L−1. Due to an instrument failure nodata is available after that date, so the presented data denotes the drought period only.
385K.-H. Knorr et al. / Geoderma 153 (2009) 379–392

Author's personal copy
depth in control plot C2. The D and C plots were similar in terms ofsulfate reduction for the first sampling date on day 134, except for thevery dry plot D3. During drought in D1 and D2, elevated sulfatereduction rates could be measured on day 162. In D2, highestrates occurred around the water table level, exceeding 300–600 nmol cm−3 d−1. After rewetting (day 211), sulfate reductionrates again increased when compared to the sampling date just beforewetting (day 191). This was especially true in D3, where saturated
conditions in the upper profile probably occurred for the first time inthe experimental period.
3.5. Thermodynamic calculations
Due to the limited hydrogen dataset also thermodynamic energyyield of the respiratory pathways given in Table 1 could not becalculated for the entire experimental period. Nevertheless, no
Fig. 7. Solid phase contents in µmol g−1 drymatter of reactive (1N HCl dissolvable) ferrous and ferric iron (top) and total reduced inorganic sulfur (TRIS, bottom) in all plots. For eachbar the mean was calculated from the seven sampling dates over the experimental campaign in 2007, of which each was measured in triplicate. Error bars denote the standarddeviation of all measurements. Note the different scale in iron and TRIS contents for C3 and D3.
386 K.-H. Knorr et al. / Geoderma 153 (2009) 379–392
Author's personal copy
prominent changes in thermodynamic energy yields occurred andpatterns generally persisted. Gibbs free energies of iron and sulfatereductionwere comparable and in the range of−30 to−60 kJmol L−1
for H2-dependant and−40 to−100 kJmol L−1 for acetate-dependantpathways, thus always exceeding the thermodynamic thresholdof −23 kJ mol L−1 substrate for ATP generation. This pattern wasneither affected by increasing drought nor by rewetting. Acetoclasticmethanogenesis yielded mostly−30 to−40 kJ mol L−1 regardless ofthe treatment, while hydrogenotrophic methanogenesis never pro-vided the required−23 kJmol L−1 in theD plots but occasionally in 5–10 cm in the C plots.
4. Discussion
A restriction of this studywas themoisture and vegetation gradientswithin the peatland. The three controls C1–C3 and treatment plots D1–D3 can therefore not be seen as true, ‘randomized’ replicates and theinterpretation of the results has to focus on comparisons betweencomplementary plots, i.e. C1–D1, C2–D2, and C3–D3. Furthermore, theheterogeneity of the site probably obscured treatment effects andmadea statistical evaluation of the data intractable. Despite such difficulties,similar effects that can be attributed to well known processes occurredin all D plots compared to the C plots, albeit with a different magnitude.The experiment was also only partially successful in simulating anextreme drought, as e.g. a water table drop down to ~70 cm belowsurface in 2002 (Paul et al., 2006), but lowered water tables about anadditional 20 cm compared to the controls for a period of 40 days(Fig. 2). This was probably due to themoist weather conditions in 2007,which provided an additional 162 mm above the long term average ofrain in the experimental period. This prevented a more severe watertable decline most likely due to reduced evapotranspiration and
groundwater partly bypassing the drainage system, especially in D1and D2. The study was still successful in inducing a temporary droughtwhen comparingC1 toD1, C2 toD2andC3 toD3. In accordancewith theexpectation from current knowledge, the manipulation resulted inreduced methanogenic activity in the drought plots, which can beexplained by reoxidation of reduced iron and sulfur phases and asubsequent provision and utilization of alternative electron acceptorsfor anaerobic respiration. Although temporal differences in solid phasecontents of iron and sulfur species could not be identified, changes indissolved sulfate and iron concentrations with soil moisture are insupport of such reasoning.
4.1. Suppression ofmethanogenesis through provision of electron acceptors
Following summer droughts or dry years, a reduction of methaneemission in peatlandswas often observed (e.g. Alm et al., 1999; Bubieret al., 2005), also for this particular site (Küsel et al., 2008), andattributed to the provision of alternative electron acceptors such assulfate (Dowrick et al., 2006; e.g. Nedwell and Watson, 1995). Also inour study the electron acceptor pool was renewed during the droughtperiod as described earlier for a poor fen, a temperate swamp and agullymire (Bayley et al., 1986; Dowrick et al., 2006;Mandernack et al.,2000) and slowly consumed after wetting.
The common assumption that in presence of alternative electronacceptors methanogens were outcompeted for substrates held trueas suggested by the inverse concentration patterns of dissolved sulfateand methane in all treatments; in presence of sulfate usually nonoteworthy concentrations of methane occurred. Ferrous ironincreased in solution before sulfate concentrations diminished(Figs. 4, 5). Therefore, a redox sequence of nitrate, ferric iron andsulfate reduction followed by methanogenesis to some extent
Fig. 8. Sulfate reduction rates as determined by the 35S–SO4 radiotracer incubation technique and fractions of tracer recovered as reduced sulfur species in C1 and D1. Sulfate netreduction rates in nmol cm−3 d−1 are given on the lower x-axis, fractions of tracer recovered as reduced sulfur are depicted on the upper x-axis. Note the different scale for the netreduction rate at day 162 in D1 (bold italics). Data for C2–C3 and D2–D3 is given in Fig. 9. Water tables on the days of sampling are depicted as dotted lines, or given as an absolutenumber if further down than 35 cm. Day 134 denotes the begin of the drought phase, days 148, 162, and 191 represent different sampling days during drought, and days 211 and 239were sampled after rewetting on day 203.
387K.-H. Knorr et al. / Geoderma 153 (2009) 379–392

Author's personal copy
occurred during this drying and rewetting treatment. On the wholethe results confirmed that our findings from an earlier mesocosmexperimentwith better control onwater tables are also relevant in thefield (Knorr and Blodau, 2009). A sequential occurrence of electronaccepting processes is in agreement with a superior competitivenessof ferric iron and sulfate reducers compared to methanogens in peat
(Achtnich et al., 1995; Dowrick et al., 2006). As dissolved nitrate washardly detected at the Schlöppnerbrunnen site, nitrate had littlepotential to suppress methanogenic activity under in-situ conditions.Methane concentrations in the Schlöppnerbrunnen fen were in therange of values reported for other fens by Coles and Yavitt (2004) orSmemo and Yavitt (2006). Compared tomost concentrations reported
Fig. 9. Sulfate reduction rates as determined by the 35S–SO4 radiotracer incubation technique and fractions of tracer recovered as reduced sulfur species in C2–C3 and D2–D3. Sulfatenet reduction rates in nmol cm−3 d−1 are given on the lower x-axis, fractions of tracer recovered as reduced sulfur are depicted on the upper x-axis. Note the different scale for thenet reduction rate at day 162 in D2 (bold italics). Data for C1 and D1 is given in Fig. 8. Water tables on the days of sampling are depicted as dotted lines, or given as an absolutenumber if further down than 35 cm. Day 134 denotes the begin of the drought phase, days 148, 162, and 191 represent different sampling days during drought, and days 211 and 239were sampled after rewetting on day 203.
388 K.-H. Knorr et al. / Geoderma 153 (2009) 379–392

Author's personal copy
in other studies they were rather low, for example compared to bogs(e.g. Blodau et al., 2007) and to data from fens investigated by Sundhet al. (1994). For this specific site, low methane concentrationsmay be related to repeated redox oscillations resulting from watertable fluctuations that occur naturally here (Paul et al., 2006), causinga long term suppression of methanogens by continuous resupplyof electron acceptors. Microbial metabolic versatility, such as thereported ability of some methanogens to shift their metabolism toiron reduction if ferric iron is present, may contribute to this phe-nomenon (Reiche et al., 2008; van Bodegom et al., 2004). A formationof entrapped CH4 bubbles was likely to occur, as concentrations ofabout 390 µmol L−1 (equivalent to CH4 partial pressures of around0.2 atm) would be necessary to support such a mechanism (Beer andBlodau, 2007). However, emissions were found to reach <4–10 mmolCH4 m−2 d−1, which presumably originated from plant mediatedtransport in presence of C. rostrata and frommost shallow productionzones on the C3 plot (Knorr and Goldberg, unpublished data).
A major finding of the study was that the time scale of response ofreductive processes was quite variable depending on process, depthand probably even further plot-specific differences. Both ferric ironand sulfate reducing activity was quickly initiated following increasesin soil moisture and apparently did not suffer from time lagsthemselves. Given the duration of our effective drought phase ofapproximately 5 weeks, and an additional water table draw down ofabout 20 cm, the induced event was close to natural analogues.Nevertheless, only a shallow or inhomogeneously aerobic soil layerdeveloped. This was indicated by the persistent occurrence of reducedcomponents, such as ferrous iron, close to the peatland surface andthe occurrence of sulfate reduction in the unsaturated zone (Fig. 8).Furthermore, Brune et al. (2000) summarized that most anaerobicbacteria, but especially sulfate reducing bacteria, are well adapted tolife at the oxic–anoxic interface and may tolerate at least temporalexposure to oxygen. A rapid transition into an again active state afterre-establishment of anoxic conditions was reported by Stenstromet al. (2001). The combination of incomplete aeration and microbialadaptation may explain why iron and sulfate reducing bacteria andmethanogens were not much affected by the experimental drought,an effect we have also previously observed in a detailed laboratorymesocosm study (Knorr and Blodau, 2009).
The sulfate reduction rates measured in this study showed at leastpartly an influence of irrigation (Figs. 8, 9). Highest absolute valuesoccurredduringdrought inD1andD2 in the rangeof thewater table level,and after experimental wetting. Drought and rewetting thus triggeredsulfate reducing activity, likely suppressing methanogenesis. Assuming aQ10 of 3 (Urban et al., 1994) and integrating over the upper 30 cm depth,sulfate reduction rates were in a range of 0.5–30 mmol m−2 d−1.The numbers coincided well with sulfate reduction data from otherminerotrophic wetland sites (Nedwell and Watson, 1995; Wieder andLang, 1988) and exceeded rates reported from an ombrotrophic bog (Vileet al., 2003).
In contrast to solutes, solid phase reactive iron and total reducedinorganic sulfur (TRIS) contents did not respond to the treatment.Because pool sizes were large, and spatially variable, effects may havebeen obscured, although the poorly crystalline iron oxides in this peatwere mostly bioavailable (Reiche et al., 2008). The oxidation andreduction dynamics at the Schlöppnerbrunnen site were only partlycoupled to the water table level changes, probably due to the densenature of the peat. This was also obvious from the results of the solutedynamics, as notable concentrations of ferrous iron and methane andhigh sulfate reduction rates occurred also at shallow depths in theD plots, and did not differ substantially compared to the C plots. In alaboratory mesocosm study with peat from this site, water contentsremained high (>85% water-filled pore space) despite a water tablereduction of 50 cm (Knorr et al., 2008b). Oxic conditions probablybecame more pronounced in the upper part of D3 when comparedto C3. As the dynamics of reduced species in the upper layers of the
other D plots during drought somewhat paralleled the patterns in theC plots, this may have been caused by a coincidence of relativelywet conditions and high soil temperatures during this period (Fig. 2).Below ground respiration increases with temperature in fens andbogs (Lafleur et al., 2005; Updegraff et al., 2001) and enhancedmicrobial activity may have lead to a temporary depletion of oxygen.Nevertheless, measurable methane concentrations in the unsaturatedprofile of the D plots require comparably high production rates due tothe higher diffusivity when compared to the saturated part of theprofile.
Segers and Kengen (1998), Yavitt and Seidmann-Zager (2006),and other authors found that there were often not enough electronacceptors present to explain the suppression of methanogenesis andclose electron flow balances. An internal recycling of sulfur supportingsulfate reduction has been proposed to resolve this problem (Blodauet al., 2007; Wieder and Lang, 1988). In the peat under study here alarge pool of iron oxides was always present in the solid phase andprovided potential electron accepting capacity (see also Reiche et al.,2008), but we cannot clarify whether this pool was in-situ availablefor reduction. Few in-situ anaerobic respiration rates have beenpublished to date. We calculated a range of 1–20 mmol m−2 d−1 forsoil from mesocosms of the investigated fen when incubated at 15 °C(Knorr et al., 2008a). Lansdown et al. (1992) calculated a range of 2.6–9 mmol m−2 d−1 for an acidic peat bog. Based on this range, anelectron acceptor concentration in Schlöppnerbrunnen fen peat of 5–155 µmol e-equivalents cm−3, equivalent to a pool of 6–15 mol m−2
in the upper 30 cm soil depth, may suffice to fuel anaerobic CO2
production by reduction of Fe(III) for several weeks. For theexperimental period, 16–67 mmol m−2 d−1 of electron acceptorsmay have been turned over but still fall in the range of only onestandard deviation of the measured electron acceptor pool size. As theelectron accepting capacity was calculated from reactive iron contentsonly, a significant amount of electron accepting capacity originatingfrom sorbed sulfate has probably to be added (up to 1000 nmol cm−3,equivalent to roughly 50 mmol m−2 in the upper 30 cm of soil onaverage) (Paul et al., 2006; Table 2 ). Therefore, most likely enoughelectron acceptors were present to strongly diminish methanogenicactivity on a seasonal time scale at this site.
4.2. Apparent coexistence and competition of reductive processes
As far as such information can be deduced from concentration timeseries, the thermodynamically derived sequence of respiration pro-cesses considerably overlapped, particularly in terms of ferric ironand sulfate reduction. This may, for example, be explained by partialthermodynamic equilibria between these processes (Postma andJakobsen, 1996), which would lead to an inability of individual
Table 2Pools of potential solid phase electron acceptors and donors present in all plots(mol electron equivalents m−2) in the upper 30 cm of the profile and correspondingstandard deviation.
Treatment Solid phaseelectronacceptors(mol m−2)
Potentiale-acceptorturnover(mmol m−2 d−1)
Solid phaseelectron donors(mol m−2)
Potentiale-donor turnover(mmol m−2 d−1
C1 14.3±6.2 59.0 15.0±3.6 43.6C2 6.7±3.9 37.2 5.2±1.5 17.0C3 6.2±1.7 16.2 6.2±1.5 18.5D1 14.8±4.2 40.3 11.7±3.6 42.5D2 13.1±7.02 66.9 13.6±2.8 33.5D3 8.3±3.5 33.2 5.1±1.3 15.6
Electron acceptors were assumed to be ferric reactive iron, electron donorswere assumedto be ferrous reactive iron plus total reduced inorganic sulfur. Standard deviations werealso recalculated into a potential contribution to electron acceptor and donor turnoverover the observation campaign (105 days).
389K.-H. Knorr et al. / Geoderma 153 (2009) 379–392

Author's personal copy
microbial pathways to predominate the electron flow. Such anexplanation is simplistic in view of other possible constraints onanaerobic respiration, though. Possibly ferric iron hydroxides were in-situ not well accessible for microorganisms due to passivation ofhydroxide surfaces by re-adsorption of ferrous iron (Roden, 2006).The occurrence of microenvironments on a scale smaller than oursampling devices can identify, may have played a role as well for thecoexistence of terminal respiration processes. We earlier identifiedthis phenomenon in soils of this peatland (Knorr et al., 2008a), andit was also described for other methanogenic peats and sediments(Hoehler et al., 2001; Wachinger et al., 2000). The suppressive effectof alternative electron acceptors on methanogenesis was thus locallydiminished, especially in the upper peat, but also at greater depths,especially in D3, where methane was apparently produced inpresence of sulfate.
We expected sulfate reduction rates to be low under unsaturatedconditions (Chapman and Davidson, 2001), which we especiallyobserved in D3 during drought. High rates should occur when apreviously aerobic and sulfate rich substrate is exposed to anaerobicconditions (Wieder et al., 1990), which also occurred in D3 afterwetting. Sulfate reduction activitywas also high along the oxic–anoxicinterface, which has also been found for the surface peat of other fens(Wieder et al., 1990), in acidic blanket peat (Chapman and Davidson,2001), and in peat from ombrotrophic bogs (Blodau andMoore, 2003;Vile et al., 2003). One may thus speculate that around the mean watertable different redox conditions coexisted (Paul et al., 2006) withinthe microenvironments of the capillary fringe. The closeness ofoxygen supply through air filled porespace and sulfide production inwater-filled reduced peat may have allowed for rapid sulfur cyclingthrough oxidized and reduced forms and supported high sulfatereduction rates. Steep redox gradients between mobile and immobilenear-surface groundwaters in a close-by wetland were describedby Lischeid et al. (2007). Support for such an explanation is furtherprovided by the hydrological properties of highly decomposedSchlöppnerbrunnen peat. In comparable fen peat, Niedermeier andRobinson (2007) found that air permeated peat only at water tensionsas high as 25 cm, meaning that in a broad capillary fringe of 25 cmabove the water table reduced conditions may still persist. Recyclingprocesses in the capillary fringe, although difficult to study, maytherefore govern anaerobic respiratory activity to a great extent.
Formation of protective consortia in microenvironments may alsohave enabled methanogens at these shallow depths to survivetemporary aeration during drought (Brune et al., 2000). Support forthis hypothesis is also given by thermodynamic data. According toliterature data, one would expect hydrogen concentrations inmethanogenic environments to be substantially higher than observedin our study, i.e. reaching >10 nmol L−1 instead of the observed 0.5–5 nmol L−1 (Achtnich et al., 1995; Lovley and Goodwin, 1988). Suchconcentrations as observed here typically occur in systems dominatedby iron reduction (Achtnich et al., 1995; Lovley and Goodwin, 1988).Therefore, methanogenesis was probably not a viable process in mostof the peat matrix and instead must have occurred in microenviron-ments, where elevated hydrogen concentrations can be maintained(Hansen et al., 2001; Hoehler et al., 2001). Minding the high contentsof reactive ferric iron in the solid phase, it is plausible that hydrogenconcentrationswere lowered to levels insufficient formethanogenesisin much of the peat. Sulfate was often not detected but even inpresence of very low sulfate concentrations, sulfate reduction, bothhydrogen- and acetate-dependant, was thermodynamically superiorto methanogenesis. Furthermore drought lead to a regeneration ofelectron acceptors, such as iron and sulfate, in theD plots. In thewetterC plots,where this regenerationwas less pronounced,methanogenesiswas also more important, which was in agreement with elevatedhydrogen concentrations.
Acetoclastic methanogenesis was thermodynamically generallyfeasible as the thermodynamic threshold of−23 kJ mol L−1 was often
exceeded. The isotopic composition of CO2 and CH4 in mesocosmsfrom the Schlöppnerbrunnen site, however, suggested a predomi-nance of the hydrogenotrophic pathway in this peat (Knorr et al.,2008a). Acetate oxidation by iron and sulfate reducers yielded moreenergy and iron or sulfate reducers may thus have outcompetedmethanogens also for acetate (Schonheit et al., 1982).
Hughes et al. (1999) reported that more frequent and subsequentsummer droughts may not only reduce methane formation but alsoshift zones of methanogenesis downward in the profile where thebacteria are less subjected to disturbance. Also Sundh et al. (1994)found a maximum in methanogenic activity about 12 cm below theaverage water table depth. As the Schlöppnerbrunnen site regularlyundergoes strong water table fluctuations (Paul et al., 2006), this mayexplain why methane accumulated to highest concentrations onlybelow 30 to 40 cm. Another more transient zone of methanogenesis,however, occurred in the densely rooted zone near the peatlandsurface, and partly above the water table. Here methanogenesisresponded more quickly to drought and especially to wetting. Underwet conditions we observed CH4 concentrations of >10 µmol L−1 indepths of 2.5 to 10 cm in the C3 plot after rainfall of about 15mmd−1.In the other plots, methane concentrations in the surface peat werealso elevated during moist periods, but concentrations in those plotshardly exceeded 5 µmol L−1 and diminished during the droughtphase. Water unsaturated methanogenic peat appears to have onlybeen reported from laboratory incubations (Coles and Yavitt, 2004)and a mesocosm study using peats of the Schlöppnerbrunnen fen(Knorr et al., 2008a). Smemo and Yavitt (2006) attributed elevatedCH4 concentrations in the surface peat to wet conditions, owing to asignificant correlation with precipitation, and to root exudation in thisintensely rooted soil layer (Coles and Yavitt, 2004). Highest potentialCH4 production rates, obtained in anaerobic incubations assays, werealso mostly reported for incubations of material from upper peatof fens (Coles and Yavitt, 2004; Wieder et al., 1990). Such a depthdistribution was also described for the Schlöppnerbrunnen fen(Reiche et al., 2008). Even fairly low concentrations of methanenear the soil surface could be relevant for emissions because electronacceptors provided by precipitation should be rapidly consumeddue to high respiration rates in the warm and active surface layer,and because CH4 transport is faster when air filled pore space remainsand transport distances to the atmosphere are short. The uppermostunsaturated layers of peat soils and their response to drought andrewetting should probably receive more attention in the future.
The importance of highly reactive surface peats, especially in fens,was pointed out by Chimner and Cooper (2003) and also found atthis site (Knorr et al., 2008b). From mesocosm experiments, we gotsupport for a redox microstructure on an aggregate scale in thesurface peat at this site (Knorr and Blodau, 2009), and thus commonconcepts of suppression by alternative electron acceptors may furtherbe limited in these layers due to spatially heterogeneous distributionof electron acceptors.
5. Conclusions
Oxidation and reduction processes occurred in response to experi-mental and natural drying and rewetting at the Schlöppnerbrunnensite, but their distribution was characterized by strong temporal andsite specific variability. The oxic–anoxic boundary appeared to be arelatively broad and moving zone, partly being above, at or below thewater table. This pattern can in be attributed to the continuous naturalfluctuations of soilmoisture andwater table, and the dense nature of thepeat. Thedense anddegradedpeat couldnot clearly be separated into anoxic and anoxic layer, and apparently formed microenvironments inwhich individual redox processes predominated. This conclusion issupported by the quick response of iron and sulfate reduction and evenmethanogenesis after wetting, especially in the uppermost layers.Despite such characteristics, drought lead to a measurable reoxidation
390 K.-H. Knorr et al. / Geoderma 153 (2009) 379–392

Author's personal copy
of electron acceptors, which coincided with a temporary suppression ofmethanogenesis afterwards. While iron and sulfate reducers obviouslysucceeded in outcompeting methanogens for substrate, iron reducerswere not able to suppress sulfate reducers and theseprocesses appearedto coexist. Following our previous work at the site, one can speculatethat this phenomenon was also assisted by a formation of microenvi-ronments. In agreement with this concept, methane appeared to beproduced when hydrogen concentrations were too low to supporthydrogenotrophic methanogenesis. Deeper into the peat, the depthdistribution of DIC, CH4, sulfate and ferrous iron concentrations waslittle sensitivewith respect towater table change and the samewas truefor sulfate reduction rates and the pools of reduced sulfur and iron. Thus,we conclude that biogeochemical processes in the highly decomposedand dense peats of this fen, and presumably also comparable fens,may be relatively resilient in response tomoderately enhanced droughtand rewetting.
Acknowledgments
This study was financed by the German Research Foundation(DFG) grant BL 563/7-2 to C. Blodau, being part of the Research GroupFOR 562 (soil processes under extreme meteorological boundaryconditions). The help of Lukas Gudmundsson, Tobias Biermann,Benjamin Kopp and Ireneusz Forys in installing the field infrastructureand in sampling is greatly acknowledged. The meteorological datawas kindly provided by T. Foken and J. Luers (Dept. of Micromete-orology, University of Bayreuth).
References
Achtnich, C., Bak, F., Conrad, R., 1995. Competition for electron-donors among nitratereducers, ferric iron reducers, sulfate reducers, and methanogens in anoxic paddysoil. Biol. Fertil. Soils 19 (1), 65–72.
Aerts, R., Ludwig, F., 1997. Water-table changes and nutritional status affect trace gasemissions from laboratory columns of peatland soils. Soil Biol. Biochem. 29 (11–12),1691–1698.
Alm, J., et al., 1999. Carbon balance of a boreal bog during a year with an exceptionallydry summer. Ecology 80 (1), 161–174.
Bartlett, K.B., Harriss, R.C., 1993. Review and assessment of methane emissions fromwetlands. Chemosphere 26 (1–4), 261–320.
Batjes, N.H., 1996. Total carbon and nitrogen in the soils of theworld. Eur. J. Soil Sci. 47 (2),151–163.
Bayley, S.E., Behr, R.S., Kelly, C.A., 1986. Retention and release of S from a fresh-waterwetland. Water Air Soil Pollut. 31 (1–2), 101–114.
Beer, J., Blodau, C., 2007. Transport and thermodynamics constrain belowground carbonturnover in a northern peatland. Geochim. Cosmochim. Acta 71 (12), 2989–3002.
Blodau, C., 2002. Carbon cycling in peatlands — a review of processes and controls.Environmental Reviews 10, 111–134.
Blodau, C., Moore, T.R., 2003. Micro-scale CO2 and CH4 dynamics in a peat soil during awater fluctuation and sulfate pulse. Soil Biol. Biochem. 35 (4), 535–547.
Blodau, C., Mayer, B., Peiffer, S., Moore, T.R., 2007. Support for an anaerobic sulfur cyclein two Canadian peatland soils. J. Geophys. Res. 112, G02004.
Bridgham, S.D., et al., 1999. Ecosystem control over temperature and energy flux innorthern peatlands. Ecol. Appl. 9 (4), 1345–1358.
Brune, A., Frenzel, P., Cypionka, H., 2000. Life at the oxic–anoxic interface: microbialactivities and adaptations. FEMS Microbiol. Rev. 24 (5), 691–710.
Bubier, J., Moore, T., Savage, K., Crill, P., 2005. A comparison of methane flux in a boreallandscape between a dry and a wet year. Glob. Biogeochem. Cycles 19 (1).
Chapman, S.J., Davidson, M.S., 2001. S-35-sulphate reduction and transformation inpeat. Soil Biol. Biochem. 33 (4–5), 593–602.
Chimner, R.A., Cooper, D.J., 2003. Influence of water table levels on CO2 emissions in aColorado subalpine fen: an in situ microcosm study. Soil Biol. Biochem. 35 (3),345–351.
Coles, J.R.P., Yavitt, J.B., 2004. Linking belowground carbon allocation to anaerobic CH4and CO2 production in a forested peatland, New York state. Geomicrobiol. J. 21 (7),445–455.
Conrad, R., 1999. Contribution of hydrogen to methane production and control ofhydrogen concentrations in methanogenic soils and sediments. FEMS Microbiol.Ecol. 28 (3), 193–202.
Corstanje, R., Reddy, K.R., 2004. Response of biogeochemical indicators to a drawdownand subsequent reflood. J. Environ. Qual. 33 (6), 2357–2366.
Dettling, M.D., Yavitt, J.B., Zinder, S.H., 2006. Control of organic carbon mineralizationby alternative electron acceptors in four peatlands, central New York State, USA.Wetlands 26 (4), 917–927.
Dowrick, D.J., Freeman, C., Lock, M.A., Reynolds, B., 2006. Sulphate reduction and thesuppression of peatland methane emissions following summer drought. Geoderma132 (3–4), 384–390.
Goldberg, S.D., Knorr, K.-H., Gebauer, G., 2008. N2O concentration and isotope signaturealong profiles provide deeper insight into the fate of N2O in soils. Isot. Environ.Healt. S. 44 (4), 377–391.
Granberg, G., Sundh, I., Svensson, B.H., Nilsson, M., 2001. Effects of temperature, andnitrogen and sulfur deposition, on methane emission from a boreal mire. Ecology82 (7), 1982–1998.
Hansen, L.K., Jakobsen, R., Postma, D., 2001. Methanogenesis in a shallow sandy aquifer,Romo, Denmark. Geochim. Cosmochim. Acta 65 (17), 2925–2935.
Hoehler, T.M., Alperin, M.J., Albert, D.B., Martens, C.S., 2001. Apparent minimum freeenergy requirements for methanogenic Archaea and sulfate-reducing bacteria in ananoxic marine sediment. FEMS Microbiol. Ecol. 38 (1), 33–41.
Hofmann, K., Hamm, R., 1967. Determination of hydrogen sulfide with N,N-dimethyl-P-phenylene diamine and iron(3) chloride. Zeitschrift Fur Analytische Chemie Fresenius232 (3), 167.
Hughes, S., Dowrick, D.J., Freeman, C., Hudson, J.A., Reynolds, B., 1999. Methaneemissions from a gully mire in mid-Wales, UK under consecutive summer watertable drawdown. Environ. Sci. Technol. 33 (2), 362–365.
IPCC, 2001. Climate Change 2001, 3rd Assessment Report, Intergovernmenmental Panelon Climate Change, Geneva.
Jorgensen, B.B., 1978. Comparison of methods for the quantification of bacterial sulfatereduction in coastal marine-sediments. 1. Measurement with radiotracer techniques.Geomicrobiol. J. 1 (1), 11–27.
Kammann, C., Grunhage, L., Jager, H.J., 2001. A new sampling technique to monitorconcentrations of CH4, N2O and CO2 in air at well-defined depths in soils withvaried water potential. Eur. J. Soil Sci. 52 (2), 297–303.
Kettunen, A., et al., 1999. Methane production and oxidation potentials in relation towater table fluctuations in two borealmires. Soil Biol. Biochem. 31 (12), 1741–1749.
Knorr, K.-H., Blodau, C., 2009. Impact of experimental drought and rewetting on redoxtransformations and methanogenesis in mesocosms of a northern fen soil. Soil Biol.Biochem. 41 (6), 1187–1198.
Knorr, K.H., Glaser, B., Blodau, C., 2008a. Fluxes and 13C isotopic composition ofdissolved carbon and pathways of methanogenesis in a fen soil exposed toexperimental drought. Biogeosciences 5 (5), 1457–1473.
Knorr, K.H., Oosterwoud, M., Blodau, C., 2008b. Experimental drought alters rates of soilrespiration andmethanogenesis but not carbon exchange in soil of a temperate fen.Soil Biol. Biochem. 40, 1781–1791. doi:10.1016/j.soilbio.2008.03.019.
Küsel, K., Blöthe,M., Schulz,D., Reiche,M., Drake,H.L., 2008.Microbial reductionof iron andporewater biogeochemistry in acidic peatlands. Biogeosciences 5 (6), 1537–1549.
Lafleur, P.M., Moore, T.R., Roulet, N.T., Frolking, S., 2005. Ecosystem respiration in a cooltemperate bog depends on peat temperature but not water table. Ecosystems 8 (6),619–629.
Laiho, R., 2006. Decomposition in peatlands: reconciling seemingly contrasting resultson the impacts of lowered water levels. Soil Biol. Biochem. 38 (8), 2011–2024.
Lansdown, J.M., Quay, P.D., King, S.L., 1992. CH4 production via CO2 reduction in atemperate bog: a source of 13C-depleted CH4. Geochim. Cosmochim. Acta 56 (9),3493–3503.
Lide, D.R., Frederikse, H.P.R. (Eds.), 1995. CRC Handbook of Chemistry and Physics. CRCPress, Inc., Boca Raton, FL.
Lischeid, G., Kolb, A., Alewell, C., Paul, S., 2007. Impact of redox and transport processesin a riparian wetland on streamwater quality in the Fichtelgebirge region, southernGermany. Hydrol. Process. 21 (1), 123–132.
Lovley, D.R., Goodwin, S., 1988. Hydrogen concentrations as an indicator of thepredominant terminal electron-accepting reactions in aquatic sediments. Geochim.Cosmochim. Acta 52 (12), 2993–3003.
Majzlan, J., Navrotsky, A., Schwertmann, U., 2004. Thermodynamics of iron oxides:part III. Enthalpies of formation and stability of ferrihydrite (~Fe(OH)3, schwert-mannite (~FeO(OH)3/4(SO4)1/8, and e-Fe2O3. Geochim. Cosmochim. Acta 68 (5),1049–1059.
Mandernack, K.W., Lynch, L., Krouse, H.R., Morgan, M.D., 2000. Sulfur cycling in wetlandpeat of the New Jersey Pinelands and its effect on stream water chemistry.Geochim. Cosmochim. Acta 64 (23), 3949–3964.
Mikaloff Fletcher, S.E., Tans, P.P., Bruhwiler, L.M., Miller, J.B., Heimann, M., 2004. CH4sources estimated from atmospheric observations of CH4 and its C-13/C-12isotopic ratios: 1. Inverse modeling of source processes. Glob. Biogeochem. Cycles18 (4), GB4004.
Moore, P.D., 2002. The future of cool temperate bogs. Environ. Conserv. 29 (1), 3–20.Moore, T.R., Dalva, M., 1993. The influence of temperature and water-table position on
carbon-dioxide and methane emissions from laboratory columns of peatland soils.J. Soil Sci. 44 (4), 651–664.
Nedwell, D.B., Watson, A., 1995. CH4 production, oxidation and emission in a UKombrotrophic peat bog — influence of SO42- from Acid-Rain. Soil Biol. Biochem.27 (7), 893–903.
Niedermeier, A., Robinson, J.S., 2007. Hydrological controls on soil redox dynamics in apeat-based, restored wetland. Geoderma 137 (3–4), 318–326.
Nilsson, M., et al., 2001. Methane emission from Swedish mires: national and regionalbudgets and dependence on mire vegetation. J. Geophys. Res. 106 (D18),20,847–20,860.
Nordstrom, D.K., Munoz, J.L., 1994. Geochemical Thermodynamics. Blackwell ScientificPublications. (493 pp).
Paul, S., Kusel, K., Alewell, C., 2006. Reduction processes in forest wetlands: trackingdown heterogeneity of source/sink functions with a combination of methods. SoilBiol. Biochem. 38 (5), 1028–1039.
Postma, D., Jakobsen, R., 1996. Redox zonation: equilibrium constraints on the Fe(III)/SO4-reduction interface. Geochim. Cosmochim. Acta 69, 3169–3175.
Reiche, M., Torburg, G., Küsel, K., 2008. Competition of Fe(III) reduction andmethanogenesis in an acidic fen. FEMS Microbiol. Ecol. 65 (1), 88–101.
391K.-H. Knorr et al. / Geoderma 153 (2009) 379–392

Author's personal copy
Roden, E.E., 2006. Geochemical and microbiological controls on dissimilatory ironreduction. Comptes Rendus Geoscience 338 (6–7), 456–467.
Roden, E.E., Wetzel, R.G., 1996. Organic carbon oxidation and suppression of methaneproduction by microbial Fe(III) oxide reduction in vegetated and unvegetatedfreshwater wetland sediments. Limnol. Oceanogr. 41 (8), 1733–1748.
Schonheit, P., Kristjansson, J.K., Thauer, R.K., 1982. Kinetic mechanism for the ability ofsulfate reducers to out-compete methanogens for acetate. Arch. Microbiol. 132 (3),285–288.
Segers, R., Kengen, S.W.M., 1998. Methane production as a function of anaerobic carbonmineralization: a process model. Soil Biol. Biochem. 30 (8–9), 1107–1117.
Smemo, K.A., Yavitt, J.B., 2006. A multi-year perspective on methane cycling in ashallow peat fen in central New York State, USA. Wetlands 26 (1), 20–29.
Stenstrom, J., Svensson, K., Johansson, M., 2001. Reversible transition between activeand dormant microbial states in soil. FEMS Microbiol. Ecol. 36 (2–3), 93–104.
Stumm, W., Morgan, J.J., 1996. Aquatic chemistry — chemical equilibria and rates innatural waters. Environ. Sci. Technol. Wiley-Interscience, New York.
Sundh, I., Nilsson, M., Granberg, G., Svensson, B.H., 1994. Depth distribution ofmicrobial-production and oxidation of methane in Northern Boreal peatlands.Microbial Ecology 27 (3), 253–265.
Tamura, H., Goto, K., Yotsuyanagi, T., Nagayama, M., 1974. Spectrophotometricdetermination of iron(II) with 1,10-phenanthroline in the presence of large amountsof iron(III). Talanta 21 (4), 314–318.
Turunen, J., Tomppo, E., Tolonen, K., Reinikainen, A., 2002. Estimating carbonaccumulationrates of undrained mires in Finland — application to boreal and subarctic regions.Holocene 12 (1), 69–80.
Updegraff, K., Bridgham, S.D., Pastor, J., Weishampel, P., Harth, C., 2001. Response of CO2and CH4 emissions from peatlands to warming and water table manipulation. Ecol.Appl. 11 (2), 311–326.
Urban, N.R., Brezonik, P.L., Baker, L.A., Sherman, L.A., 1994. Sulfate reduction anddiffusion in sediments of Little-Rock Lake, Wisconsin. Limnol. Oceanogr. 39 (4),797–815.
van Bodegom, P.M., Scholten, J.C.M., Stams, A.J.M., 2004. Direct inhibition ofmethanogenesis by ferric iron. FEMS Microbiol. Ecol. 49 (2), 261–268.
Vile,M.A., Bridgham, S.D.,Wieder, R.K., 2003. Response of anaerobic carbonmineralizationrates to sulfate amendments in a boreal peatland. Ecol. Appl. 13 (3), 720–734.
Wachinger, G., et al., 2000. Variability of soil methane production on the micro-scale:spatial association with hot spots of organic material and Archaeal populations. SoilBiol. Biochem. 32 (8–9), 1121–1130.
Wagner, A., Wagner, I., 2005. Leitfaden der Niedermoorrenaturierung in Bayern.Bayerisches Landesamt für Umwelt, Augsburg.
Wallmann, K., Hennies, K., König, K.I., Petersen, W., Knauth, H.D., 1993. New procedurefor determining reactive Fe(III) and Fe(II) minerals in sediments. Limnol. Oceanogr.38, 1803–1812.
Wieder, R.K., Lang, G.E., 1988. Cycling of inorganic and organic sulfur in peat from BigRun Bog, West-Virginia. Biogeochemistry 5 (2), 221–242.
Wieder, R.K., Lang, G.E., Granus, V.A., 1985. An evaluation of wet chemical methods forquantifying sulfur fractions in fresh-water wetland peat. Limnol. Oceanogr. 30 (5),1109–1115.
Wieder, R.K., Yavitt, J.B., Lang, G.E., 1990. Methane production and sulfate reduction in 2Appalachian Peatlands. Biogeochemistry 10 (2), 81–104.
Yavitt, J.B., Lang, G.E., 1990.Methane production in contrastingwetland sites— responseto organic–chemical components of peat and to sulfate reduction. Geomicrobiol. J.8 (1), 27–46.
Yavitt, J.B., Seidmann-Zager, M., 2006. Methanogenic conditions in northern peat soils.Geomicrobiol. J. 23 (2), 119–127.
Yavitt, J.B., Williams, C.J., Wieder, R.K., 2005. Soil chemistry versus environmentalcontrols on production of CH4 and CO2 in northern peatlands. Eur. J. Soil Sci. 56 (2),169–178.
392 K.-H. Knorr et al. / Geoderma 153 (2009) 379–392