author's personal copy - university of...
TRANSCRIPT

This article appeared in a journal published by Elsevier. The attachedcopy is furnished to the author for internal non-commercial researchand education use, including for instruction at the authors institution
and sharing with colleagues.
Other uses, including reproduction and distribution, or selling orlicensing copies, or posting to personal, institutional or third party
websites are prohibited.
In most cases authors are permitted to post their version of thearticle (e.g. in Word or Tex form) to their personal website orinstitutional repository. Authors requiring further information
regarding Elsevier’s archiving and manuscript policies areencouraged to visit:
http://www.elsevier.com/copyright

Author's personal copy
Compound-specific D/H ratios of the marine lakes of Palau as proxies forWest Pacific Warm Pool hydrologic variability
R.H. Smittenberg a,d,*, C. Saenger b, M.N. Dawson c, J.P. Sachs d
a ETH Zürich, Geological Institute, Sonneggstrasse 5, Room NO G47, 8092 Zürich, Switzerlandb Yale University, Department of Geology and Geophysics, New Haven, CT 06520, USAc School of Natural Sciences, University of California, Merced, 5200 North Lake Road, Merced, CA 95343, USAdUniversity of Washington, School of Oceanography, Box 355351, Seattle, WA 98195, USA
a r t i c l e i n f o
Article history:Received 29 September 2010Received in revised form17 January 2011Accepted 19 January 2011Available online 11 February 2011
Keywords:West Pacific Warm PoolBiomarkersHydrogen isotopesPaleoclimateHydroclimateMarine lakesPalau
a b s t r a c t
We tested the use of hydrogen isotopic ratios (dD) of lipids in marine lake sediments from the Micro-nesian Republic of Palau against the instrumental record of the last century to assess their capacity torecord past hydrological changes of the Western Pacific Warm Pool. dD values of the algal lipid biomarkerdinosterol (dDDino) and the more generic palmitic acid (dDPA) were found to be sensitive indicators of theintensity of regional precipitation, as recorded by the Southern Oscillation Index (SOI). The observedsensitivity is caused by the combined effect of: 1) The amount effect in tropical precipitation; 2) Dilutionof the isotopically heavy saline surface waters with light precipitation; 3) A salinity effect on thebiosynthetic D/H fractionation between lipid and lake water. Both lake water dD (dDLake) and dDDino couldbe expressed as a quadratic function of either precipitation or lake water salinity. dDDino values were usedto reconstruct past hydrological changes of the region. Long-term variations in the strength and sign ofthe El Niño - Southern Oscillation (ENSO) since the Little Ice Age (LIA, w1450e1850 A.D.) and during theearly Holocene (w7e9 kyr BP) appeared to dominate decadal variability, and indicate very dry conditionsduring the LIA. Early Holocene dDDino values were on average w10& higher than those of recentcenturies, which we interpret as a result of millennial scale hydrologic and water mass changes ona global level. The similar w35& range of dD changes during the early Holocene and last severalcenturies imply a similar range of decadal-centennial hydrologic variability during those two climateregimes. Our results indicate that a correlation exists between solar irradiance levels and tropical Pacificclimate.
� 2011 Elsevier Ltd. All rights reserved.
1. Introduction
Recent research has improved understanding of the physicalfeatures and dynamics of tropical Pacific climate, yet many aspectsare still only partly understood (Collins et al., 2010). Insights fromcoupled global circulation models (CGCMs) tested against globalobservational records during the satellite age contrast with thedearth of reliable observations of tropical climate, which rarelyextend back more than a century and are spatially scattered,especially in oceanic regions. Proxy-based paleoclimate recon-structions thus provide invaluable information describing naturalclimate variability and dynamics prior to observational records,may help assess sources of model uncertainty, and allow important
supplemental tests of model sensitivity to boundary conditionsoutside the range of observational records (Brown et al., 2008).Such reconstructions are scarce in the tropical Pacific, and there isan ongoing need to increase the number and type of paleoclimatereconstructions in the region.
The Western Pacific Warm Pool (WPWP) is a key component oftropical Pacific and global climate variability. Deep convection inthis body of warm (>28 �C) surface water drives large fluxes ofsensible and latent heat andmoisture to the global atmosphere. Thehydrological cycle is one of the most sensitive indicators of changesin the WPWP atmosphere-ocean system. Small variations in thesize, position and temperature of the WPWP can have a large effecton tropical hydrology and therefore global climate (Trenberth et al.,1998; Cane, 1998; Pierrehumbert, 2000; Wang and Mehta, 2008).This, in turn, can affect oceanic and terrestrial ecosystems, as wellas primary productivity (Behrenfeld et al., 2006; Woodward et al.,2008). In addition to local WPWP-forcing, tropical hydrology canbe influenced remotely by high latitude cooling (Chiang and Bitz,
* Corresponding author. Future address: Department of Geological Sciences,Stockholm University, SE-106 91, Stockholm, Sweden. Tel.: þ41 44 632 8474.
E-mail address: [email protected] (R.H. Smittenberg).
Contents lists available at ScienceDirect
Quaternary Science Reviews
journal homepage: www.elsevier .com/locate/quascirev
0277-3791/$ e see front matter � 2011 Elsevier Ltd. All rights reserved.doi:10.1016/j.quascirev.2011.01.012
Quaternary Science Reviews 30 (2011) 921e933
Author's personal copy
2005; Broccoli et al., 2006), natural variations in solar activity (Bardand Frank, 2006) and anthropogenic climate change (Trenberth andHoar,1997; Collins et al., 2010). Finally, theWPWP is a driving factorin the El Niño-Southern Oscillation (ENSO), which interacts withthe annual movement and strength of the Intertropical Conver-gence Zone (ITCZ) (e.g. Gagan et al., 2004).
Most reconstructions of tropical Pacific hydrology come fromsites on or near continents (Wang et al., 2005; Partin et al., 2007;Yancheva et al., 2007; Griffiths et al., 2009; Tierney et al., 2009).At those sites ocean-driven climatic changes are mixed withcontinental effects such as orography or the vastly different mois-ture contents and heat capacity of land compared to the ocean.Reconstructions of the oceanic hydroclimate must therefore besought farther from large landmasses. Although valuable paleohy-drologic reconstructions have been generated frommarine settings(e.g. Stott et al., 2004; Oppo et al., 2009; Abram et al., 2009; Newtonet al., 2006), they are based primarily on the oxygen isotopic ratio ofbiogenic carbonate (d18OCaCO3). This reflects the d18O value ofseawater, which is influenced by evaporation and precipitationprocesses e the same processes that influence salinity. As a result,d18OCaCO3 also typically co-varies with sea surface salinity (SSS).However, d18OCaCO3 can also be strongly influenced by sea surfacetemperature (SST). In many cases Mg/Ca or Sr/Ca thermometershave been used to correct for the temperature influence ond18OCaCO3, but the reliability of these ratios as pure SST proxies isunder debate (e.g. Saenger et al., 2008; Dissard et al., 2010).Furthermore, many existing reconstructions from open ocean sitesmay not capture hydrologic variations well due to surface mixing ordampening by the large ocean reservoir. For instance, in theWPWPthe ideal situation for the use of d18OCaCO3 exists in that the SSTremains consistently warm and equable, while SSS can change byup to two psu in association with hydrological changes related toENSO. Still, this only translates only to changes in coral d18O of ca0.3& (Wu and Grottoli, 2010), i.e. just above the standard error ofmeasurement (�0.15).
Here, we investigate the hydrogen isotopic ratio (dD) of lipidspreserved in marine lake sediments from the WPWP island groupof Palau as a paleohydrologic proxy. The islands are relatively smalland low and lie in the maritime province of the WPWP, so thatrainfall characteristics closely represent those of the ocean. Amodern correlation between lipid dD and tropical hydrology is usedas the basis for paleohydrologic reconstructions from the Little IceAge (LIA,w1450e1850 A.D.) and early Holocene (w7e9 kyr BP). LIAresults, initially presented by Sachs et al. (2009), are explored ingreater detail while early Holocene results are presented for thefirst time.
2. Study area
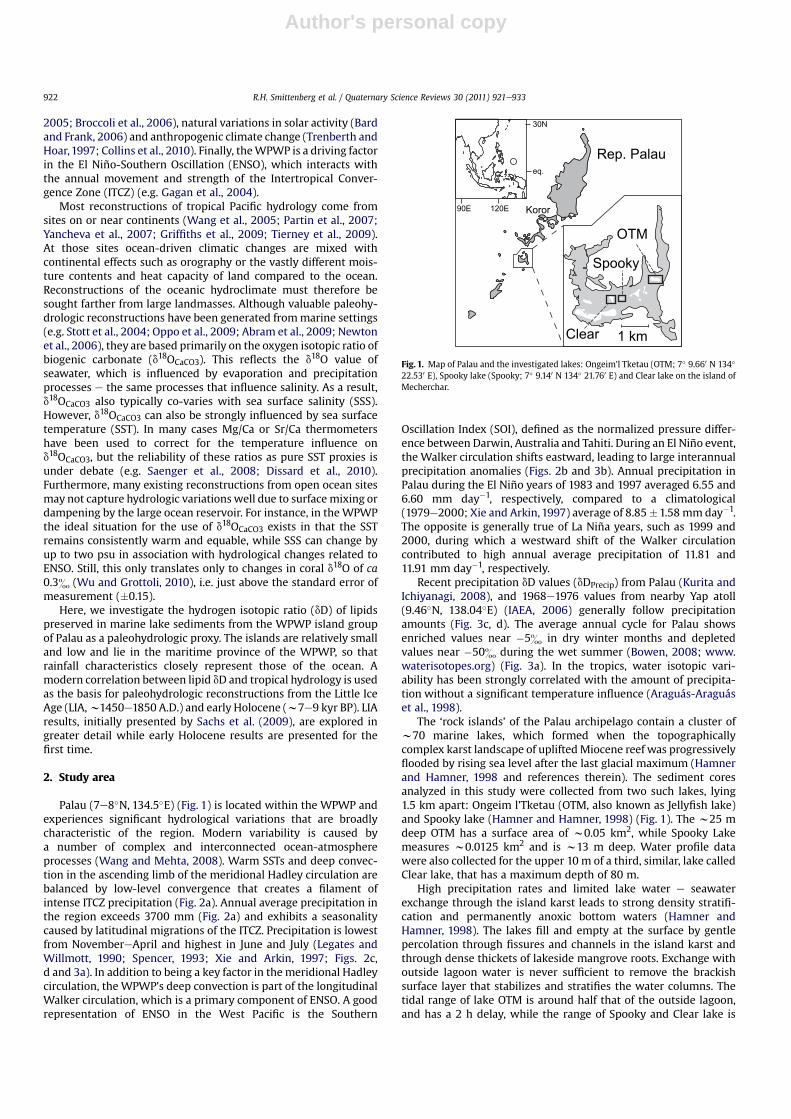
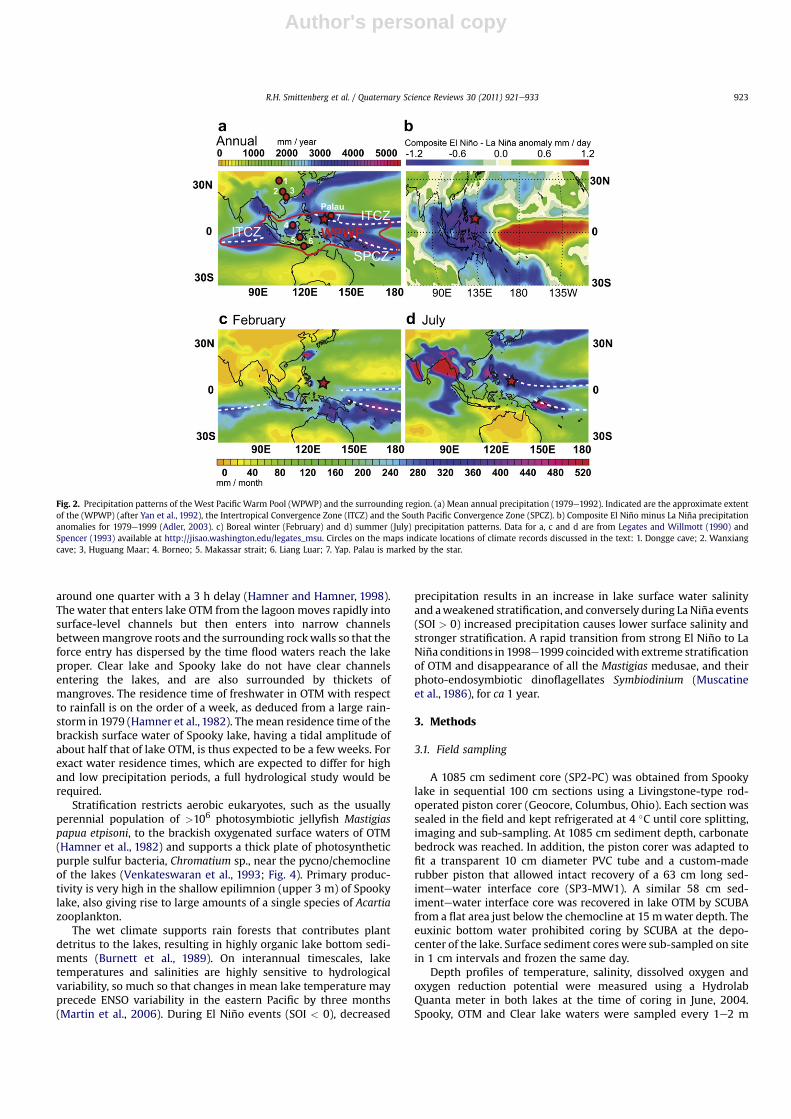
Palau (7e8�N, 134.5�E) (Fig. 1) is located within the WPWP andexperiences significant hydrological variations that are broadlycharacteristic of the region. Modern variability is caused bya number of complex and interconnected ocean-atmosphereprocesses (Wang and Mehta, 2008). Warm SSTs and deep convec-tion in the ascending limb of the meridional Hadley circulation arebalanced by low-level convergence that creates a filament ofintense ITCZ precipitation (Fig. 2a). Annual average precipitation inthe region exceeds 3700 mm (Fig. 2a) and exhibits a seasonalitycaused by latitudinal migrations of the ITCZ. Precipitation is lowestfrom NovembereApril and highest in June and July (Legates andWillmott, 1990; Spencer, 1993; Xie and Arkin, 1997; Figs. 2c,d and 3a). In addition to being a key factor in the meridional Hadleycirculation, the WPWP’s deep convection is part of the longitudinalWalker circulation, which is a primary component of ENSO. A goodrepresentation of ENSO in the West Pacific is the Southern
Oscillation Index (SOI), defined as the normalized pressure differ-ence between Darwin, Australia and Tahiti. During an El Niño event,the Walker circulation shifts eastward, leading to large interannualprecipitation anomalies (Figs. 2b and 3b). Annual precipitation inPalau during the El Niño years of 1983 and 1997 averaged 6.55 and6.60 mm day�1, respectively, compared to a climatological(1979e2000; Xie and Arkin,1997) average of 8.85�1.58 mm day�1.The opposite is generally true of La Niña years, such as 1999 and2000, during which a westward shift of the Walker circulationcontributed to high annual average precipitation of 11.81 and11.91 mm day�1, respectively.
Recent precipitation dD values (dDPrecip) from Palau (Kurita andIchiyanagi, 2008), and 1968e1976 values from nearby Yap atoll(9.46�N, 138.04�E) (IAEA, 2006) generally follow precipitationamounts (Fig. 3c, d). The average annual cycle for Palau showsenriched values near �5& in dry winter months and depletedvalues near �50& during the wet summer (Bowen, 2008; www.waterisotopes.org) (Fig. 3a). In the tropics, water isotopic vari-ability has been strongly correlated with the amount of precipita-tion without a significant temperature influence (Araguás-Araguáset al., 1998).
The ‘rock islands’ of the Palau archipelago contain a cluster ofw70 marine lakes, which formed when the topographicallycomplex karst landscape of upliftedMiocene reef was progressivelyflooded by rising sea level after the last glacial maximum (Hamnerand Hamner, 1998 and references therein). The sediment coresanalyzed in this study were collected from two such lakes, lying1.5 km apart: Ongeim l’Tketau (OTM, also known as Jellyfish lake)and Spooky lake (Hamner and Hamner, 1998) (Fig. 1). The w25 mdeep OTM has a surface area of w0.05 km2, while Spooky Lakemeasures w0.0125 km2 and is w13 m deep. Water profile datawere also collected for the upper 10 m of a third, similar, lake calledClear lake, that has a maximum depth of 80 m.
High precipitation rates and limited lake water e seawaterexchange through the island karst leads to strong density stratifi-cation and permanently anoxic bottom waters (Hamner andHamner, 1998). The lakes fill and empty at the surface by gentlepercolation through fissures and channels in the island karst andthrough dense thickets of lakeside mangrove roots. Exchange withoutside lagoon water is never sufficient to remove the brackishsurface layer that stabilizes and stratifies the water columns. Thetidal range of lake OTM is around half that of the outside lagoon,and has a 2 h delay, while the range of Spooky and Clear lake is
Koror
30N
90E 120E
eq.
Spooky
Clear
OTM
Rep. Palau
1 km
Fig. 1. Map of Palau and the investigated lakes: Ongeim’l Tketau (OTM; 7� 9.660 N 134�
22.530 E), Spooky lake (Spooky; 7� 9.140 N 134� 21.760 E) and Clear lake on the island ofMecherchar.
R.H. Smittenberg et al. / Quaternary Science Reviews 30 (2011) 921e933922
Author's personal copy
around one quarter with a 3 h delay (Hamner and Hamner, 1998).The water that enters lake OTM from the lagoonmoves rapidly intosurface-level channels but then enters into narrow channelsbetweenmangrove roots and the surrounding rockwalls so that theforce entry has dispersed by the time flood waters reach the lakeproper. Clear lake and Spooky lake do not have clear channelsentering the lakes, and are also surrounded by thickets ofmangroves. The residence time of freshwater in OTM with respectto rainfall is on the order of a week, as deduced from a large rain-storm in 1979 (Hamner et al., 1982). Themean residence time of thebrackish surface water of Spooky lake, having a tidal amplitude ofabout half that of lake OTM, is thus expected to be a few weeks. Forexact water residence times, which are expected to differ for highand low precipitation periods, a full hydrological study would berequired.
Stratification restricts aerobic eukaryotes, such as the usuallyperennial population of >106 photosymbiotic jellyfish Mastigiaspapua etpisoni, to the brackish oxygenated surface waters of OTM(Hamner et al., 1982) and supports a thick plate of photosyntheticpurple sulfur bacteria, Chromatium sp., near the pycno/chemoclineof the lakes (Venkateswaran et al., 1993; Fig. 4). Primary produc-tivity is very high in the shallow epilimnion (upper 3 m) of Spookylake, also giving rise to large amounts of a single species of Acartiazooplankton.
The wet climate supports rain forests that contributes plantdetritus to the lakes, resulting in highly organic lake bottom sedi-ments (Burnett et al., 1989). On interannual timescales, laketemperatures and salinities are highly sensitive to hydrologicalvariability, so much so that changes in mean lake temperature mayprecede ENSO variability in the eastern Pacific by three months(Martin et al., 2006). During El Niño events (SOI < 0), decreased
precipitation results in an increase in lake surface water salinityand aweakened stratification, and conversely during La Niña events(SOI > 0) increased precipitation causes lower surface salinity andstronger stratification. A rapid transition from strong El Niño to LaNiña conditions in 1998e1999 coincidedwith extreme stratificationof OTM and disappearance of all the Mastigias medusae, and theirphoto-endosymbiotic dinoflagellates Symbiodinium (Muscatineet al., 1986), for ca 1 year.
3. Methods
3.1. Field sampling
A 1085 cm sediment core (SP2-PC) was obtained from Spookylake in sequential 100 cm sections using a Livingstone-type rod-operated piston corer (Geocore, Columbus, Ohio). Each section wassealed in the field and kept refrigerated at 4 �C until core splitting,imaging and sub-sampling. At 1085 cm sediment depth, carbonatebedrock was reached. In addition, the piston corer was adapted tofit a transparent 10 cm diameter PVC tube and a custom-maderubber piston that allowed intact recovery of a 63 cm long sed-imentewater interface core (SP3-MW1). A similar 58 cm sed-imentewater interface core was recovered in lake OTM by SCUBAfrom a flat area just below the chemocline at 15 mwater depth. Theeuxinic bottom water prohibited coring by SCUBA at the depo-center of the lake. Surface sediment cores were sub-sampled on sitein 1 cm intervals and frozen the same day.
Depth profiles of temperature, salinity, dissolved oxygen andoxygen reduction potential were measured using a HydrolabQuanta meter in both lakes at the time of coring in June, 2004.Spooky, OTM and Clear lake waters were sampled every 1e2 m
Fig. 2. Precipitation patterns of the West Pacific Warm Pool (WPWP) and the surrounding region. (a) Mean annual precipitation (1979e1992). Indicated are the approximate extentof the (WPWP) (after Yan et al., 1992), the Intertropical Convergence Zone (ITCZ) and the South Pacific Convergence Zone (SPCZ). b) Composite El Niño minus La Niña precipitationanomalies for 1979e1999 (Adler, 2003). c) Boreal winter (February) and d) summer (July) precipitation patterns. Data for a, c and d are from Legates and Willmott (1990) andSpencer (1993) available at http://jisao.washington.edu/legates_msu. Circles on the maps indicate locations of climate records discussed in the text: 1. Dongge cave; 2. Wanxiangcave; 3, Huguang Maar; 4. Borneo; 5. Makassar strait; 6. Liang Luar; 7. Yap. Palau is marked by the star.
R.H. Smittenberg et al. / Quaternary Science Reviews 30 (2011) 921e933 923

Author's personal copy
using a Niskin bottle through the entire water column to generatelake water dD depth profiles. Additional samples of lake surfacewater, precipitation and regional ocean water were collected inJune, 2004 during fieldwork. Spooky lake was sampled on 6, 21 and22 June, and OTM and Clear lake from 20e22 June. Periodicsampling of OTM lake water, regional seawater and precipitationcontinued through 2004 and 2005 by the Coral Reef ResearchFoundation in Koror. All samples were sealed, refrigerated and thenshipped to the laboratory for later dD analysis.
3.2. Organic geochemical analyses
All sediment samples (0.5e2.0gdryweight)were freezedriedandextracted by pressurized fluid extraction (Dionex ASE-200) usinga 9:1 (v/v) mixture of dichloromethane (DCM) and methanol.Dinosterol (4,23,24-trimethylcholestan-22-en-3b-ol) was isolatedfollowing the procedure of Smittenberg and Sachs (2007). Briefly,after the initial solvent extraction, a neutral fraction was isolated bysolid phase extraction before further purification using an Agilent1100 series high-performance liquid chromatograph equipped witha fraction collector and a quadrupole mass spectrometer (HPLC-MS).Dinosterol was separated from co-eluting higher plant-derived
pentacyclic triterpenoidalcoholsusingaDCM-hexanemixture (15:85v/v, 1 mL/min) on a Prevail Cyano column (4.6 � 250 mm � 5m).Fractions containing dinosterol were recombined based on HPLC-MSresults and then quantified using gas chromatography with flame-ionization detection (GC-FID). Finally, fractions containing dinosterolwere acetylated by adding 20 ml pyridine and 20 ml acetic anhydrideof known hydrogen isotopic composition and heating at 60 �Cfor 1 h.
To isolate palmitic acid (PA), fatty acid fractions were initiallypurified from the total lipid extract using silicious column chro-matography (hexane:ethyl acetate:acetic acid; 74:24:2, v/v/v, afterprevious elution with less polar solvents). The fatty acid fractionwas methylated using a mixture of anhydrous methanol and acetylchloride (9:1 v/v) of known isotopic composition, and furtherseparated in a second chromatography step into fatty acid methylesters (hexane:ethyl acetate; 95:5, v/v) and hydroxy fatty acids(hexane:ethyl acetate 8:2, v/v).
The stable hydrogen isotopic composition of dinosterol (dDDino)and palmitic acid (dDPA) were measured on a DELTA V gas chro-matograph-isotope ratio mass spectrometer (GC-IRMS) similar tothat described by Burgoyne and Hayes (1998). Instrument perfor-mance and the H3þ factor were determined on a daily basis using
-50
-40
-30
-20
-10
δD (‰
)Pa
lau
δD (‰
)
5
7
9
11
13
15
δD (Palau)
Palau precip
Palau precip Yap precip
δD (Yap)
-60
-40
-20
0
1972 1973 19740
4
8
12
16
20
J F M A M J J A S O N D
δD (‰
)p
(mm
day
-1)
p (m
m d
ay-1)
p (m
m d
ay-1
)p
(mm
day
-1)
p (m
m d
ay-1)
4
6
8
10
12
14
1950 1955 1960 1965 1970 1975 1980 1985 19904
6
8
10
12
14
CAMS OPI 2.5º x 2.5º (6.25ºN,133.75ºE)Koror, Palau (7.37ºN, 134.54ºE) CAMS 2º x 2º (7ºN, 133ºE)
a
1995 2000 2005 2010
-60
-40
-20
0
0
4
8
12
16
20
2003 2004 2005 2006
d
c
b
precipδD
Fig. 3. Relationship between precipitation and its hydrogen isotopic composition (dDprecip). (a) Climatological dDprecip (Bowen, 2008; available via www.waterisotopes.org) andprecipitation (mm day�1) in Palau (Xie and Arkin, 1997). (b). Local and regional precipitation near Palau since 1950. El Niño periods are shaded. Data are rain gauge/satellite dataobtained from http://www.ncdc.noaa.gov. (c) Time series of precipitation in Yap and Palau and dDprecip in Yap during the 1973 El Niño event. (d) Time series of precipitation anddDprecip in Palau during 2003e2006 (Kurita and Ichiyanagi, 2008).
R.H. Smittenberg et al. / Quaternary Science Reviews 30 (2011) 921e933924

Author's personal copy
a reference gas and a mixture of n-alkanes of known isotopiccomposition as described in Zhang and Sachs (2007). Isotopicvalues were calculated with ISODAT software using co-injectionstandards. dDDino and dDPA were corrected for the hydrogen atomsof the added acetyl and methyl groups, respectively. Hydrogenisotopic values were typically determined by three replicate anal-yses, and the results were averaged to obtain a mean value andstandard deviation. The precision of dD measurements was 4%based on repeated analyses of a standard containing 15 different n-alkanes of known dD. dD of lake and ocean water and precipitation(dDPrecip) was measured using an H-device Thermo-Finnigan Del-taplus XL mass spectrometer at Dartmouth College, as described byZhang and Sachs (2007).
3.3. Dating
Chronologies for the upper portion of Spooky lake and lake OTMare based on 210Pb dating (Supporting Information, Fig. S1).Radiocarbon dating of acid-alkali-acid treated leaf remains wasused to determine the depth of the early 1960s atmospheric bombspike, the age of the bottommost portion of SP3-MW1, and agesthroughout SP2-PC (Supporting Information, Table S1). Measure-ments were made at the University of California, Irvine’s Keck-Carbon Cycle AMS facility, the Woods Hole Oceanographic Institu-tion’s National Ocean Sciences AMS facility, and the LawrenceLivermore AMS. Oxcal (v. 4.1) (Bronk Ramsey, 2009) and theNorthern Hemisphere atmospheric calibration curve (Reimer et al.,2009) were used to convert to calendar ages.
4. Results
4.1. Limnology and water dD
Temperature, salinity, resulting density, dissolved oxygencontents, and lake water dD profiles (Supplementary Information,Table S2) are shown in Fig. 4. Increases in density in Spooky lake,Clear lake and OTM from about 1009 to 1017, 1012e1014, and1015e1020 kg m�3 correspond to salinity increases from 19 to 29,22 to 25 and 26 to 31 psu, respectively (Fig. 4aec). Dissolved oxygendropped to zero at the pycnocline in the lakes, leading to reducingsulfidic conditions and thick plates of photosynthetic purple sulfurbacteria. Highest temperatures occurred above the bacterial plates,i.e. the pycno/chemocline, but did not inverse the density structureof the water column.
Depth profiles of dD in all three lakes showed trends towardheavier values with depth that strongly resemble salinity anddensity profiles (Fig. 4). Surface water dD values near �17, �13and �8& in respectively Spooky lake, Clear lake and lakeOTM, increased to bottom water values of respectively �5, �9.5and �3.5& (Supplementary Information, Table S2). Local dDPrecip
of �27 � 15& in June 2004 (Fig. 5a; Supplementary Information,Table S3) were similar to surface lakewater, while dD values of�5.8to �6.4& in the saline lagoons nearest OTM were close to lakebottom water dD.
Between June 2004 and September 2005 the dD variability inOTM lake surfacewater, local precipitation and regional open oceanwater show similar seasonal phasing, but significantly different
-20 -16 -12 -8 -418 22 26 30salinity (psu)
0
2
4
6
8
10
12
14
30 31 32 33 34 35
0 1 2 3 4 1008 1012 1016
temperature (ºC)
density (kg m-3)dissolved oxygen (mg L-1)
temperaturedissolvedoxygen
salinitydensity
a Spooky Lake b OTM
June 6
June 20
June 20-21
20 J
une
‘04
16 F
eb ‘0
5
29 S
ept ‘
05
δD (‰)
0
5
10
15
20
25
27 28 29 30 31
0 1 2 3 4 5 6 7
25 27 29 31
1014 1016 1018 1020
-8-12 -4
temperaturedissolved oxygen
salinitydensity
density (kg m-3)dissolved oxygen (mg L-1)
temperature (ºC) salinity (psu) δD (‰)
dept
h (m
)
dept
h (m
)
C Clear Lake d Salinity - δD (‰)
0
2
4
6
8
10
30 31 32 33 34
0 1 2 3 4 5 6 7
20 22 24 26
1011 1012 1013 1014
-14-16 -12 -10
dissolved oxygen
salinitydensity
density (kg m-3)dissolved oxygen (mg L-1)
temperature (ºC) salinity (psu) δD (‰)
dept
h (m
)
temperature
June 21
-50
-45
-40
-35
-30
-25
-20
-15
-10
-5
0
0 10 20 30 40
Spooky LakeDepth profiles:
lake bottom water
Spooky Lake surface water mixing line
June 2004
Lake OTMClear Lake
Lake OTM surface water mixing line
δD = 1.05 x salinity - 35.6
δDLake= -0.121 x S2 + 7.077 x S - 107
lake water salinity (psu)
annualweightedmean
High precipitation (16mm/day)
Low precipitation(2.5 mm/day)
δD (‰
)la
ke w
ater
Fig. 4. Depth profiles of Spooky lake, lake OTM and Clear lake temperature, dissolved oxygen, density, salinity and water dD measured in June, 2004. (a) Spooky lake. (b) lake OTM.(c) Clear lake. Depths where photosynthetic sulfur bacterial plates occurred are shaded. For lake OTM, the highest and lowest water dD values observed between June 2004 andNovember 2005 are also indicated (d). Cross plot of salinity and dD data of a-c, as well as climatological dD values for precipitation. Surface water mixing lines for Spooky lake andlake OTM were constructed as discussed in the text.
R.H. Smittenberg et al. / Quaternary Science Reviews 30 (2011) 921e933 925

Author's personal copy
amplitudes (Fig. 5a, Supplementary Information, Table S3). Lake,precipitation and ocean dD all reach their most enriched values inboreal winter (NovembereMarch) and are most depleted insummer (MayeSeptember). The amplitude of this variability islargest in precipitation, (2 to �76&), smaller in OTM lake water(�4.5 to �11.3&) and smallest in the open ocean (w1 to �1&).
4.2. Age model
Sediment accumulation rates for OTM-MW1 and SP3-MW1were determined by fitting exponential decay profiles to plots ofaccumulated dry mass and excess 210Pb, aided by some radiocarbonmeasurements (Sachs et al., 2009; Supplementary Information,Fig. S1). The very good fit of the 210Pb data, combined with 14C datesfor Spooky lake, results in a well constrained age model for the lastcentury. Uncertainty increases for sediments prior to 1900 AD,when the detection limit of 210Pb is reached but remains con-strained by the radiocarbon date at 63 cm depth at the bottom ofSP3-MW1. Core SP2-PC was dated using 10 radiocarbon ages(Supplementary Information, Table S1). Based on these radiocarbonages, combined with information about early Holocene sea-levelrise and some stratigraphic information, an age model for this corewas constructed (Fig. 6) using the software program Oxcal (v. 4.1;Bronk Ramsey, 2009; Reimer et al., 2009) (see SupplementaryInformation). Total organic carbon in a 5 cm thick clay layerimmediately overlying the carbonate base of SP2-PC was dated10,230e9940 cal. BP (2s), an age that likely reflects a mix of olderand younger material deposited over several centuries or more
prior to inundation of the dry valley (ca 24m belowpresent-day sealevel) by post-glacial sea-level rise. Published sea-level curvesindicate a rise around Palau as fast as 10e15 mm yr�1 until 7 kyr BP(Kayanne et al., 2002), and first inundation of Spooky lake musthave happened between 9.3 and 8.7 kyr BP. The shallowest modernlakes that are meromictic (i.e. stratified) are ca 5 me8 m deep.Given this and the rate of sea-level rise, the transition from a hol-omictic (i.e. mixed, oxic) to a meromictic state where anoxicconditions allow the organic sediment to be better preserved, musthave happened between 8.7 and 8.2 kyr BP. Core material fromabove 1040 cm became less ‘peat-like’ and also started to includebivalve shell debris. We interpreted this as the boundary betweensediments deposited before and after the transition of the lake toa meromictic state. This is indeed expected to be marked bya change in the ecological community structure, including estab-lishment of a numerically large population of the bivalve Brachi-dontes sp., which are especially abundant in all meromictic marinelakes (own observations; G. Paulay, pers. comm.). Between 100 and200 cm depth the sediment existed almost exclusively of bivalveshell debris, and since these organisms can only grow in oxygen-ated surface water, we interpreted this as a slump from the side ofthe lake. Broken shell debris mixed through the otherwise highlyorganic sediment in the other core sections likely reflects someextent of secondary deposition. The fact that the radiocarbon agesof 600 and 700 cm depth were fairly close to each other (Fig. 6)indicates that this depth interval also contains some mass deposit.However, the otherwise relative straight age model and theabsence of reversals in our radiocarbon chronology indicate thatthe sedimentary succession is generally intact and regular, which isalso supported by the very regular 210Pb decay profile of the surfacesediment (Supplementary Information, Fig. S1).
4.3. Dinosterol and palmitic acid dD
dDPA values in lake OTM ranged from�165 to�200& from 1895to 1998 A.D. (Fig. 7a; Supplementary Information, Table S4). Spooky
-80
-60
-40
-20
0
J J A S O N D J F M A M J J A S O N D
-20
-16
-12
-8
-4
0
climatology Kurita (2008) precip OTM lake Spooky lake
-100
-80
-60
-40
-20
0
0 2 4 6 8 10 12 14 16 18 20
2004 2005
Ocean
y = -9.34x - 3.35 r = 0.91
y = -3.40x + 2.00 r = 0.68
-2
-1
0
1
2
δ D pr
ecip
(‰)
δ D lake ( ‰
)
δ D ocean ( ‰
)
δ D pr
ecip
(‰)
precipitation (mm / day) extreme precipitation days (count) Kurita et al. 2009
a
b
Fig. 5. Seasonal water dD values measured in Palau. (a) Monthly mean dD value ofseveral precipitation samples (open circles), OTM lake surface water (diamonds),Spooky lake surface water (cross) and local ocean water (exes), climatological dDvalues for Palau, as in Fig. 3 (line). (b) Regression of monthly mean dDprecip in Palauwith precipitation (crosses) and days of extreme precipitation (open circles). Opensquares: long-term (2003e2006) monthly mean dD vs. precipitation amount fromKurita and Ichiyanagi (2008).
0
200
400
600
800
1000
0 2000 4000 6000 8000 10000calendar age (yr BP)
sedi
men
t dep
th (c
m)
lake
ince
ptio
n(s
ea le
vel ~
bas
al ro
ck)
mer
omic
tic la
ke
basin abovesea level
dino
ster
ol δ
D
bedrock
‘slump’
‘slump’
basa
l car
bona
te ro
ckw
ith g
rey
clay
Fig. 6. Age model of the SP2-PC sediment core. Calibrated calendar age probability(2s) distributions (Table S1) are light shaded and the modeled probability distributions(2s) are dark shaded. The calibrated points are interpolated with a line with a width of2s. The time period for which the basin was above sea level is indicated, as are theapproximate timing of lake inception and the estimated time when the lake becamemeromictic. Bars on the vertical axis indicate depths at which dDDino was measured.
R.H. Smittenberg et al. / Quaternary Science Reviews 30 (2011) 921e933926

Author's personal copy
lake dDDino values covaried with dDPA during their period of overlap(Fig. 7a), but were offset toward more negative values. Both dDrecords exhibit an amplitude ofw35& during the last century, andhighest values occurred after w1975 A.D. From 1520 e present,dDDino values from core SP3-MW1were between�285 and�320&(Sachs et al., 2009) (Fig. 8b). Early Holocene (7.0e8.2 kyr BP) dDDinovalues from core SP2-PC ranged between �306& and �270&(Fig. 9a). At the investigated time scale diagenetic alteration of theoriginal, alkyl-carbon bound, isotopic signal is very unlikely(Sessions et al., 2004).
5. Discussion
5.1. Sources of lake water dD variability
Local measurements of dD in precipitation from 2004e2005indicate that changes in dDPrecip are mainly caused by the amounteffect. The intensity of precipitation during this interval, estimatedby calculating the number of days in each month when precipita-tion exceeded the long-term mean by at least 1 standard deviation,was highly correlated (r2 ¼ 0.91) with dDPrecip (Fig. 5b). dDPrecip was
moderately correlated (r2 ¼ 0.68) with monthly mean precipitationover this time interval. A similar correlation (r2 ¼ 0.70) between 4year mean monthly precipitation amount and dDPrecip in Palau andBali was found by Kurita et al. (2009) (Fig. 5b). Their detailedanalysis of isotopic ratios in WPWP precipitation indicates thatdDPrecip is primarily a function of regional precipitation amounts.Precipitation amount, in turn, is ultimately determined by largerscale climate variables like the annual movement of the ITCZ andthe intensity of theWalker and Hadley circulations. The intensity ofdeep convection is also very sensitive to changes inWPWP SST, andsmall anomalies (w0.5 �C) may generate significant changes in
b
-320
-310
-300
-290
-280-0.8 -0.6 -0.4 -0.2 0 0.2 0.4
-200
-190
-180
-170
-160
-0.8 -0.6 -0.4 -0.2 0 0.2 0.4
r2=0.57p<0.001
r2=0.63
SOI
SOI
Spoo
ky L
ake
Din
oste
rol δ
D (‰
)
OTM
Pal
miti
c Ac
id δ
D (‰
)
p<0.001δDDino= -26.4 x SOI - 307.4
δDPA = -27.2 x SOI - 189
*
*** *
**
*
-330
-320
-310
-300
-290
-280
-210-200-190-180-170-160
1860 1880 1900 1920 1940 1960 1980 2000
Spooky Lake Dinosterol δD (‰)
OTM Palmitic Acid δD (‰)
Year AD
a
-1
-0.6
-0.2
0.2
0.6
SOI
0
5
10
15reconstructed p (mm/day)
mean age probabilitysediment sample thickness not used in regression
*
Fig. 7. Relation between lake lipid dD values and the Southern Oscillation Index (SOI).(a) dDDino (circles) and dDPA (squares) variability since 1870 AD, the instrumental SOIindex (9-year running mean) (stippled line). The reconstructed precipitation based onSpooky lake dDDino is also shown. The time span of the 1-cm thick sediment samplesand the probability distribution of the mean sample age of the samples are indicated.b) Linear regressions between the SOI (9-year averages) and dDDino and dDPA. Dashedlines are 95% confidence intervals. SOI data from University of East Anglia, http://www.cru.uea.ac.uk/cru/data/soi.htm.
a
b
c
d
f
e
Fig. 8. WPWP hydrologic climate variability since 1500 A.D. (a) 40-year (cycle) aver-aged total solar irradiance (TSI) anomaly relative to 1986 (1365.57 W m�2) (Steinhilberet al., 2009). Shaded band is 1s uncertainty. (b) Palau dDDino. Horizontal error barsindicate the age uncertainty of the record. (c) Dongge Cave speleothem d18O (Wanget al., 2005) and (d) Wanxiang Cave speleothem d18O (Zhang et al., 2008) indicateAsian summer Monsoon strength. (e) Reconstructed Makassar Strait seawater d18O(Oppo et al., 2009). (f) Terrestrial plant-wax dD from Sulawesi deposited in Makassarstrait (Tierney et al., 2009). The same polynomial trendline (adjusted for values) issuperimposed on all records as a visual aid. Gray bars under records a and b indicatedecadal-scale high solar irradiance anomalies corresponding to a relatively wet WPWP.Note the reversed scales for plots e and f.
R.H. Smittenberg et al. / Quaternary Science Reviews 30 (2011) 921e933 927

Author's personal copy
precipitation amount and intensity (Wang and Mehta, 2008, andreferences therein).
Assuming that regionally-driven changes in dDPrecip are theultimate source of Palau lake water and seawater dD variability, theca 40& change in dDPrecip from dry to wet seasons leads to varia-tions of 8& in OTM, but only 2& in local ocean water (Fig. 5a). Thisimplies that OTM lake water is four times more sensitive than theopen ocean with respect to dDPrecip variability, and by extensionthat the lake’s dDLipid record is more sensitive than comparableoceanic proxy records. The more depleted June 2004 Spooky lakewater dD (�16&, Fig. 4a) indicates an even greater dependence ofdDLake on dDPrecip in this basin than in OTM, and thus a potentiallygreater sensitivity of dDLipid to WPWP hydrologic variability.
The salinities and dDwater values measured for the three lakes inJune 2004 are well correlated (Fig. 4d), and show a relationship ofdDwater ¼ 1.05 � salinity � 35.6. This suggests that at the time ofsampling precipitation dD averaged approximately �36&, which iswithin error of the observed �27 � 15& and similar to meanJuneeJuly, 2004 values of �24.1 to �37.6& reported by Kurita andIchiyanagi (2008) for the WPWP. Using lake salinity and dDWater endmembers (bottom water ¼ 30 psu; dD ¼ �4& andprecipitation ¼ 0 psu; dD ¼ �36&) for June 2004 we estimated thefraction of meteoric water in lake surface waters to be ca 15% and ca35% for lakeOTMand Spooky lake, respectively. This suggests Spookylake is more than twice as sensitive as lake OTM to precipitationchanges, as expected from its much shallower pycnocline.
Making the assumption that the extent of freshwatere seawatermixing of the lakes linearly correlates with the amount of precip-itation, and assuming also that dDPrecip relates linearly with theamount of rain (Fig. 5b), one can estimate that at the wettestperiods (w14 mm/day, with dDPrecip as low as �50&, Figs. 3a and5a; Kurita et al., 2009), Spooky lake surface water salinity should bew16 psu, and dDLake should be w �26&. In contrast, during rela-tively dry periods surface water dD may become as high as �4&,and have a salinity of 28 psu, when oceanic and meteoric waterhave almost the same isotopic composition (Fig. 4d). Calculation forvarious amounts of rain, their estimated isotopic composition, andthe resulting extent of mixing in the different lakes leads to dD-salinity mixing lines, for surface waters, that can be expressed asquadratic equations (Fig. 4d). In other words, lake water dD valuesrespond increasingly sensitive at higher amounts of precipitation,because of the amplifying amount effect. Conversely, the responseof dDLake is smaller at dryer conditions.
5.2. Biomarker dD variability
Laboratory (Englebrecht and Sachs, 2005; Schouten et al.,2006; Zhang and Sachs, 2007; Zhang et al., 2009b) and field(Englebrecht and Sachs, 2005; Huang et al., 2004; Sachse andSachs, 2008; Schwab and Sachs, 2009) studies demonstrate thatdD in a wide range of algal lipids closely co-varies with sourcewater dD. Measurements of salinity, dDwater and dD values of
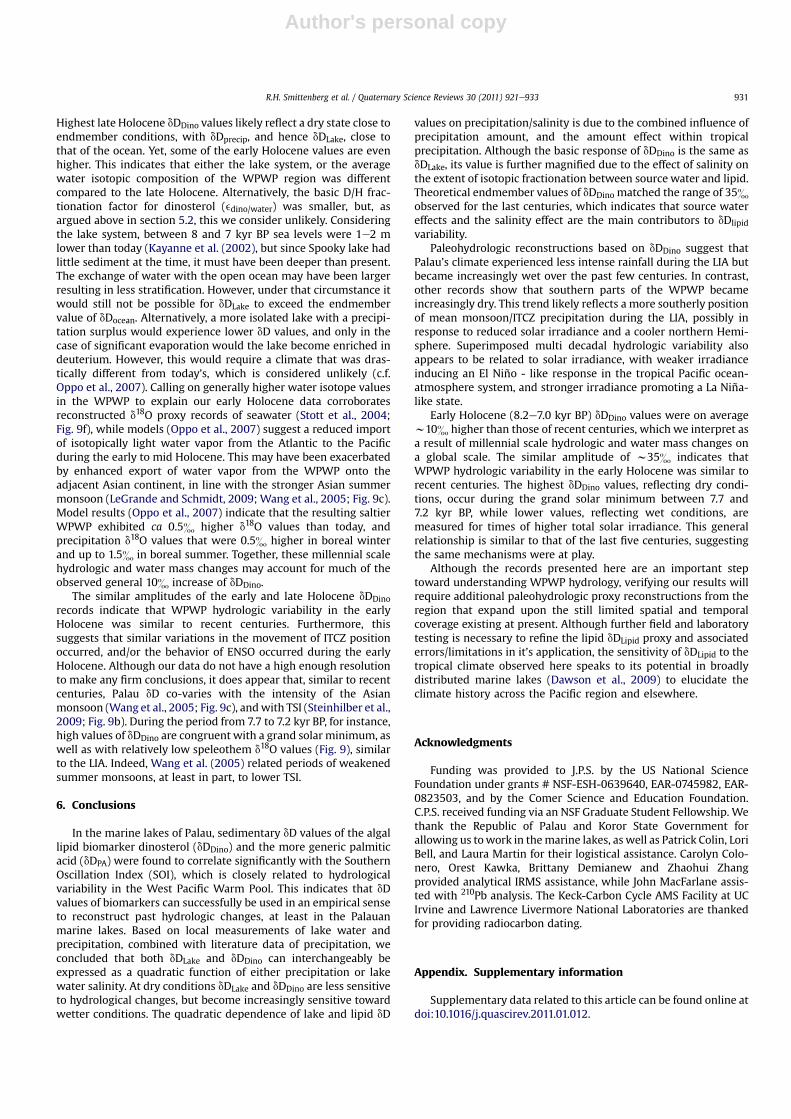
Fig. 9. Comparison of Holocene hydrologic reconstructions. (a) Palau dDDino. (b) TSI as in Fig. 8, small dots at the bottom indicate TSI < 1364.64 Wm�2. (c) Dongge Cave speleothemd18O (Wang et al., 2005). Gray bands indicate the concurrence of low TSI, weak precipitation in Palau, and relatively weak Asian summer Monsoon. (d) Difference between Augustand January insolation at 7�N (Laskar et al., 2004). Compared to the late Holocene, NH seasonality was stronger during the early Holocene due to stronger summer and weakerwinter insolation. (e) Borneo speleothem d18O (Partin et al., 2007). (f) Reconstructed WPWP mean seawater d18O (Stott et al., 2004). (g) Liang Luar stalagmite d18O record (Griffithset al., 2009). Upper horizontal axis: the 2s age distributions for the calibrated 14C ages of 8 and 10 m are shown (see Fig. 6). The estimated time when lake became meromictic is alsoindicated.
R.H. Smittenberg et al. / Quaternary Science Reviews 30 (2011) 921e933928
Author's personal copy
dinoflagellate-produced dinosterol (Volkman, 2003) (dDdino)across large gradients in the Chesapeake Bay (Sachs and Schwab,2011), confirm that this is also true for this lipid, and that anapproximate basal fractionation factor edino/water ¼ �315& appliesat zero salinity. Previous work has shown that dDPA in lake surfacesediments is capable of recording lake water dD variability (Huanget al., 2004). However, palmitic acid is a generic lipid, which is notonly produced by algae (e.g. dinoflagellates) and bacteria (e.g.purple sulfur bacteria), but also by vascular plants. Hence, dDPAmay not reflect lake surface water dD exclusively, but may ratherrepresent an integrated ecosystem signal that is ultimatelydependent on the dD value of regional precipitation. The advan-tage of using dinosterol is that it is a specifically algal lipid, incontrast to the generic palmitic acid, which is why we chosedinosterol as a target for Spooky lake. However, purification andisotope analysis of dinosterol is relatively elaborate compared tothe more straightforward procedure for palmitic acid. Because ofthis, and the fact that dinosterol concentrations were relativelylow in lake OTM, we chose palmitic acid as a target for this lake.Although they would provide an interesting comparison, labora-tory and machine time constraints precluded a parallel dDPA
record for Spooky lake.Thegenerallyobservedco-varianceof dDlipid and sourcewater dD
can bemodulated bya number of biological and physical factors thatinfluence the extent of fractionation during lipid biosynthesis. Forinstance, the low dD values of the isoprenoid lipid dinosterol,compared to thehigher values of the acetogenic lipidpalmitic acid, iscaused by the larger extent of D/H fractionation that occurs duringisoprenoid lipid synthesis compared to that of acetogenic lipids(Zhang et al., 2009a, 2009b and references therein). Through theirimpact on biosynthesis and/or metabolism, changes in nutrients,light intensity, salinity and temperature may also influence lipid dD(Sachse and Sachs, 2008; Schouten et al., 2006; Zhang et al., 2009b),leading tovariability that is unrelated to changes in sourcewater (c.f.van derMeer et al., 2008). Furthermore, different strains of bacteria,algae andplants havebeen shown to fractionateD fromHdifferently(Campbell et al., 2009; Sachse et al., 2006; Sauer et al., 2001; Zhangand Sachs, 2007) indicating that changes in biological source couldsignificantly impact the hydrogen isotopic composition of sedi-mentary lipids. Different species of dinoflagellates may thus, intheory, exert a different D/H fractionation upon dinosterol produc-tion.However, inChesapeakeBay (SachsandSchwab, 2011), exhibitsthe same large salinity gradient, (summer) stratification and sub/anoxia as the Palauan lakes, no dD variability could be attributed tochanges in species distribution. This apparent absence of a ‘specieseffect’ lets us assume that the dinoflagellates in the Palauan lakes,most commonly Symbiodinium and Ceratium spp., fractionate toa similar extent as those in Chesapeake Bay, although we recognizethat the two environments are significantly different, and that wecannot rule out a species effects.
Any influence of temperature on D/H fractionation (Zhang et al.,2009b) is probably small considering that mean lake temperatureshave only varied by a few degrees (Dawson et al., 2001). In contrast,recent work shows that the effect of salinity on biosynthetic frac-tionation appears to be significant. Sachs and Schwab (2011) founda 0.99 � 0.23& decrease in D/H fractionation per unit increase insalinity for dinosterol in particulate organic matter along a salinitygradient in Chesapeake Bay. This effect is comparable to thatobserved by Sachse and Sachs (2008) for various algal lipidsanalyzed from hypersaline ponds of Christmas Island. The salinityeffect amplifies the primary signal of lake water dD variation, sothat three additive effects on the recorded dDlipid are at play: (i)Reduced precipitation carries a smaller amount effect; (ii) the lakesurface water will experience a relatively greater contribution ofdD-enriched oceanicwater compared to depleted precipitation, due
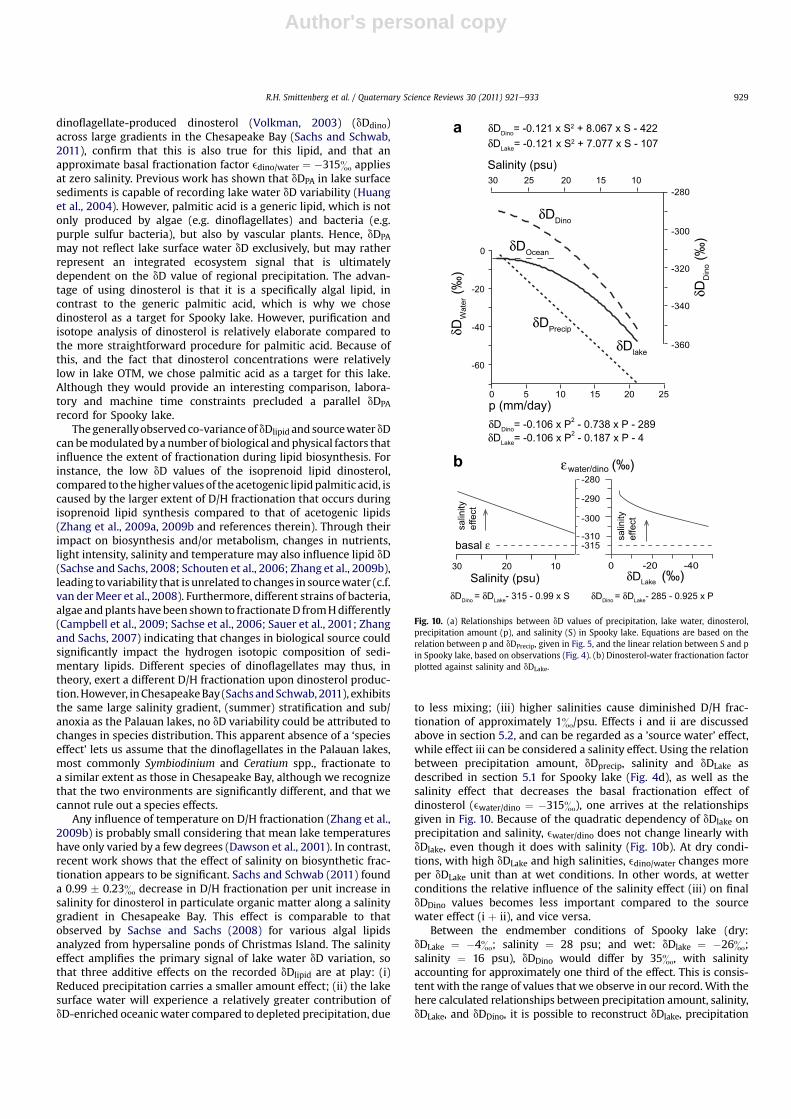
to less mixing; (iii) higher salinities cause diminished D/H frac-tionation of approximately 1&/psu. Effects i and ii are discussedabove in section 5.2, and can be regarded as a ’source water’ effect,while effect iii can be considered a salinity effect. Using the relationbetween precipitation amount, dDprecip, salinity and dDLake asdescribed in section 5.1 for Spooky lake (Fig. 4d), as well as thesalinity effect that decreases the basal fractionation effect ofdinosterol (ewater/dino ¼ �315&), one arrives at the relationshipsgiven in Fig. 10. Because of the quadratic dependency of dDlake onprecipitation and salinity, ewater/dino does not change linearly withdDlake, even though it does with salinity (Fig. 10b). At dry condi-tions, with high dDLake and high salinities, edino/water changes moreper dDLake unit than at wet conditions. In other words, at wetterconditions the relative influence of the salinity effect (iii) on finaldDDino values becomes less important compared to the sourcewater effect (i þ ii), and vice versa.
Between the endmember conditions of Spooky lake (dry:dDLake ¼ �4&; salinity ¼ 28 psu; and wet: dDlake ¼ �26&;salinity ¼ 16 psu), dDDino would differ by 35&, with salinityaccounting for approximately one third of the effect. This is consis-tent with the range of values that we observe in our record.With thehere calculated relationships between precipitation amount, salinity,dDLake, and dDDino, it is possible to reconstruct dDlake, precipitation
-60
-40
-20
0
-360
-340
-320
-300
-280
0 5 10 15 20 25p (mm/day)
δDW
ater (‰
)
δDPrecip
δDOcean
δDD
ino (
‰)
δDDino
δDlake
δDDino= -0.106 x P2 - 0.738 x P - 289
δDDino= -0.121 x S2 + 8.067 x S - 422
δDLake= -0.106 x P2 - 0.187 x P - 4
δDLake= -0.121 x S2 + 7.077 x S - 107
Salinity (psu)30 25 20 15 10
-300
-280
-290
-310-315
εwater/dino (‰)sa
linity
effe
ct
basal ε
Salinity (psu)30 20 10
a
b
salin
ityef
fect
-40-200δDLake (‰)
δDDino = δDLake- 285 - 0.925 x PδDDino = δDLake- 315 - 0.99 x S
Fig. 10. (a) Relationships between dD values of precipitation, lake water, dinosterol,precipitation amount (p), and salinity (S) in Spooky lake. Equations are based on therelation between p and dDPrecip, given in Fig. 5, and the linear relation between S and pin Spooky lake, based on observations (Fig. 4). (b) Dinosterol-water fractionation factorplotted against salinity and dDLake.
R.H. Smittenberg et al. / Quaternary Science Reviews 30 (2011) 921e933 929

Author's personal copy
and salinity of Spooky lake based upon sedimentary dDDino values(Fig. 7a). We did not calculate the error of the estimates for thederived equations, but it is clear that reconstructed annual averageprecipitations of near 0 mm/day are unrealistic. This can beexplained in part by the insensitivity of dDLake values towardprecipitation at the low end of the precipitation range, primarilycaused by the small difference between oceanic and meteoric dDvalues (Fig. 4d). Furthermore, we did not take the residence time ofthe lake water into account, which would attenuate the climaticsignal. The residence time of the lake water would be expected to belowest during wet periods, i.e, dDLake should respond faster toincreases in precipitation, than to decreases. The derived equationsare not universal, but depend on the local hydrological and meteo-rological conditions that determine the amount effect and the extentof mixing of rain water into the lake.
The spread of dDPA in lake OTM is similar to that of dDDino inSpooky lake, even though lake OTM appears more than twice lesssensitive from a hydrological perspective. It is possible that part ofthe PA is not derived from the ‘diluted’ lake water, but rather fromthe surrounding vegetation that might transmit the full range ofdDprecip variability. However, dD values of plant-wax-derived longchain n-alkanes in these lakes (unpublished results) show varia-tions that are negligibly larger than the measurement error. LakeOTM dDLake variability may also be larger than could be deducedfrom the June 2004 salinity and dD profile. A significant differencewith the salinityedDLakeedDDino relationships presented in Sachsand Schwab (2011) for the Chesapeake Bay, is the amplifying roleof the amount effect. As exemplified by the difference between lakeOTM and Spooky lake (Fig. 4d), the extent of mixing of precipitationinto saline waters is also important, as this will affect the salinity-dDWater relationship.
The fact that we can satisfactorily explain the spread of observeddDDino, based on source water variability and the salinity effect,suggests that these are the two main factors that influence thesedimentary dDDino, and potentially also dDPA. Although changes insource organisms, nutrients or other biological and physicochem-ical factors, besides salinity, could also affect dDLipid, we concludethat these factors appear to be of secondary importance. Forexample, despite their distinctly different biological sources andbiosynthetic pathways, dDDino and dDPA exhibit synchronous vari-ability that traces regional hydrology, as further described below.This is consistent with the marine lakes being relatively stableecosystems (Hamner and Hamner, 1998). If any biological responseto occasional dramatic climate events influenced dDLipid indepen-dently of the source water and salinity signals, this influence wasapparently either relatively unimportant or acted in the samedirection as the factors described above.
5.3. Hydrological variability since 1890 AD
The 35& range in dDDino and dDPA since w1890 AD points tosignificant hydrological variations during the twentieth century(Fig. 7a). The most striking of these features is the abrupt shifttoward drier conditions in the 1970s, which coincides with ananomalous shift toward a tropical Pacific mean state that resembles’El Niño-like’ conditions (Trenberth and Hoar, 1997; Fig. 3b). TheSouthern Oscillation Index (SOI), captures this variability (Fig. 7a)and can be compared empirically with lipid dD records to assesstheir utility as hydrological/climatological proxies.
A linear least-squares regression of lipid dD values against 9-year averages of monthly SOI values, with the center correspondingto the given average sediment age values for which biomarker dDvalues were measured, shows significant inverse correlations fordDDino (r2 ¼ 0.63 (p < 0.001)) and for dDPA (r2 ¼ 0.53 (p < 0.001))(Fig. 7b) (see Supplementary Information). Slopes near�27& SOI�1
for both lipids indicate that a 0.1 unit change in the SOI is roughlyequivalent to a 3& decrease in Palauan lake lipid dD. The 95%confidence interval of the regression indicates that changes in lipiddD of 10& or more would predict significantly different values of0.3e0.5 SOI units, suggesting that dD variability can distinguish dryconditions (‘El Niño-like’) from ‘neutral’ and wet conditions (‘LaNiña-like’) (see Supplementary Information).
5.4. Hydrological variability since the Little Ice Age
The modern lipid dD-SOI empirical relation suggests thatenriched dDDino values during the LIAmay reflect a more El Niño-likemean state of the tropical Pacific. However, as argued by Sachs et al.(2009), the low LIA dDDino values can also be explained by a moresoutherly mean latitude of the ITCZ (Fig. 8). A number of recentrecords not considered by Sachs et al. (2009) support this interpre-tation. Speleothem d18O evidence suggests the Asian summermonsoon was weaker during the LIA and became progressivelystronger during the past five centuries (Wang et al., 2005; Fig. 8c;Zhang et al., 2008; Fig. 8d), consistent with a northwardmigration ofthe ITCZ since the LIA. In the southern hemisphere, a foraminifera-based reconstruction of seawater d18O (Oppo et al., 2009; Fig. 8e)from the Makassar Strait (4�S, 118�E), and a plant-wax dD record(Tierney et al., 2009; Fig. 8f) from nearby Sulawesi show similar butopposite trends to those in Palau, with wet conditions during the LIAbecoming increasingly arid toward the present. These records areconsistent with a LIA precipitation pattern resembling that ofpresent-day boreal winter (Fig. 2c), with an intensified South PacificConvergence Zone (SPCZ) and Australian monsoon rainfall, anddiminished northern hemisphere ITCZ precipitation and Asianmonsoon activity. The latitude of the ITCZ is known to be sensitive tothe inter-hemispheric temperature gradient with southerlydisplacements occurring when the northern hemisphere is relativelycool (Chiang and Bitz, 2005; Broccoli et al., 2006; Saenger et al.,2009). The distinct minima of total solar irradiance (TSI) thatoccurred during the LIA (Fig. 8a) may have cooled the northernhemisphere (Shindell et al., 2003) and provide a possiblemechanismfor the apparent southward position of the ITCZ. The same argumentsuggests that the general rise in TSI after w1700 A.D. may havecontributed to the centennial scale trend towardwetter conditions inPalau following the LIA (Sachs et al., 2009).
Although meridional migrations of ITCZ/monsoon precipitationappear to exert the dominant control on centennial variations inPalau hydrology, other processes such as ENSO variability andshorter-scale climatic responses to solar, volcanic (Mann et al.,2005), or greenhouse gas-related forcings (Collins et al., 2010),may be more important on (multi) decadal timescales. Althoughage model uncertainties and record resolution preclude a rigorousstatistical comparison, WPWP hydrology inferred from detrendeddDDino (Fig. 8b), appears to co-vary with solar anomalies since 1500A.D. (Fig. 8a). This is consistent with recent observations of the solarcycle and the Pacific Climate (van Loon et al., 2007, and referencestherein), and reinforces the notion that more negative dD values,indicating stronger precipitation, occur during periods of relativelyhigh TSI. According to Meehl et al. (2009, and references therein),several mechanisms may explain a large tropical Pacific hydrologicresponse to relatively small solar forcing. We refrain however froman elaborate discussion about this matter and do not draw anyfurther conclusions, given the limitations of our record andcomplexity of the issue.
5.5. Early Holocene hydrological variability
Early Holocene (ca 8.2e7.0 kyr BP) dDDino values are on averagew10& higher but of similar amplitude as modern values (Fig. 9a).
R.H. Smittenberg et al. / Quaternary Science Reviews 30 (2011) 921e933930
Author's personal copy
Highest late Holocene dDDino values likely reflect a dry state close toendmember conditions, with dDprecip, and hence dDLake, close tothat of the ocean. Yet, some of the early Holocene values are evenhigher. This indicates that either the lake system, or the averagewater isotopic composition of the WPWP region was differentcompared to the late Holocene. Alternatively, the basic D/H frac-tionation factor for dinosterol (edino/water) was smaller, but, asargued above in section 5.2, this we consider unlikely. Consideringthe lake system, between 8 and 7 kyr BP sea levels were 1e2 mlower than today (Kayanne et al. (2002), but since Spooky lake hadlittle sediment at the time, it must have been deeper than present.The exchange of water with the open ocean may have been largerresulting in less stratification. However, under that circumstance itwould still not be possible for dDLake to exceed the endmembervalue of dDocean. Alternatively, a more isolated lake with a precipi-tation surplus would experience lower dD values, and only in thecase of significant evaporation would the lake become enriched indeuterium. However, this would require a climate that was dras-tically different from today’s, which is considered unlikely (c.f.Oppo et al., 2007). Calling on generally higher water isotope valuesin the WPWP to explain our early Holocene data corroboratesreconstructed d18O proxy records of seawater (Stott et al., 2004;Fig. 9f), while models (Oppo et al., 2007) suggest a reduced importof isotopically light water vapor from the Atlantic to the Pacificduring the early to mid Holocene. This may have been exacerbatedby enhanced export of water vapor from the WPWP onto theadjacent Asian continent, in line with the stronger Asian summermonsoon (LeGrande and Schmidt, 2009; Wang et al., 2005; Fig. 9c).Model results (Oppo et al., 2007) indicate that the resulting saltierWPWP exhibited ca 0.5& higher d18O values than today, andprecipitation d18O values that were 0.5& higher in boreal winterand up to 1.5& in boreal summer. Together, these millennial scalehydrologic and water mass changes may account for much of theobserved general 10& increase of dDDino.
The similar amplitudes of the early and late Holocene dDDinorecords indicate that WPWP hydrologic variability in the earlyHolocene was similar to recent centuries. Furthermore, thissuggests that similar variations in the movement of ITCZ positionoccurred, and/or the behavior of ENSO occurred during the earlyHolocene. Although our data do not have a high enough resolutionto make any firm conclusions, it does appear that, similar to recentcenturies, Palau dD co-varies with the intensity of the Asianmonsoon (Wang et al., 2005; Fig. 9c), andwith TSI (Steinhilber et al.,2009; Fig. 9b). During the period from 7.7 to 7.2 kyr BP, for instance,high values of dDDino are congruent with a grand solar minimum, aswell as with relatively low speleothem d18O values (Fig. 9), similarto the LIA. Indeed, Wang et al. (2005) related periods of weakenedsummer monsoons, at least in part, to lower TSI.
6. Conclusions
In the marine lakes of Palau, sedimentary dD values of the algallipid biomarker dinosterol (dDDino) and the more generic palmiticacid (dDPA) were found to correlate significantly with the SouthernOscillation Index (SOI), which is closely related to hydrologicalvariability in the West Pacific Warm Pool. This indicates that dDvalues of biomarkers can successfully be used in an empirical senseto reconstruct past hydrologic changes, at least in the Palauanmarine lakes. Based on local measurements of lake water andprecipitation, combined with literature data of precipitation, weconcluded that both dDLake and dDDino can interchangeably beexpressed as a quadratic function of either precipitation or lakewater salinity. At dry conditions dDLake and dDDino are less sensitiveto hydrological changes, but become increasingly sensitive towardwetter conditions. The quadratic dependence of lake and lipid dD
values on precipitation/salinity is due to the combined influence ofprecipitation amount, and the amount effect within tropicalprecipitation. Although the basic response of dDDino is the same asdDLake, its value is further magnified due to the effect of salinity onthe extent of isotopic fractionation between source water and lipid.Theoretical endmember values of dDDino matched the range of 35&observed for the last centuries, which indicates that source watereffects and the salinity effect are the main contributors to dDlipidvariability.
Paleohydrologic reconstructions based on dDDino suggest thatPalau’s climate experienced less intense rainfall during the LIA butbecame increasingly wet over the past few centuries. In contrast,other records show that southern parts of the WPWP becameincreasingly dry. This trend likely reflects a more southerly positionof mean monsoon/ITCZ precipitation during the LIA, possibly inresponse to reduced solar irradiance and a cooler northern Hemi-sphere. Superimposed multi decadal hydrologic variability alsoappears to be related to solar irradiance, with weaker irradianceinducing an El Niño - like response in the tropical Pacific ocean-atmosphere system, and stronger irradiance promoting a La Niña-like state.
Early Holocene (8.2e7.0 kyr BP) dDDino values were on averagew10& higher than those of recent centuries, which we interpret asa result of millennial scale hydrologic and water mass changes ona global scale. The similar amplitude of w35& indicates thatWPWP hydrologic variability in the early Holocene was similar torecent centuries. The highest dDDino values, reflecting dry condi-tions, occur during the grand solar minimum between 7.7 and7.2 kyr BP, while lower values, reflecting wet conditions, aremeasured for times of higher total solar irradiance. This generalrelationship is similar to that of the last five centuries, suggestingthe same mechanisms were at play.
Although the records presented here are an important steptoward understanding WPWP hydrology, verifying our results willrequire additional paleohydrologic proxy reconstructions from theregion that expand upon the still limited spatial and temporalcoverage existing at present. Although further field and laboratorytesting is necessary to refine the lipid dDLipid proxy and associatederrors/limitations in it’s application, the sensitivity of dDLipid to thetropical climate observed here speaks to its potential in broadlydistributed marine lakes (Dawson et al., 2009) to elucidate theclimate history across the Pacific region and elsewhere.
Acknowledgments
Funding was provided to J.P.S. by the US National ScienceFoundation under grants # NSF-ESH-0639640, EAR-0745982, EAR-0823503, and by the Comer Science and Education Foundation.C.P.S. received funding via an NSF Graduate Student Fellowship. Wethank the Republic of Palau and Koror State Government forallowing us towork in themarine lakes, as well as Patrick Colin, LoriBell, and Laura Martin for their logistical assistance. Carolyn Colo-nero, Orest Kawka, Brittany Demianew and Zhaohui Zhangprovided analytical IRMS assistance, while John MacFarlane assis-ted with 210Pb analysis. The Keck-Carbon Cycle AMS Facility at UCIrvine and Lawrence Livermore National Laboratories are thankedfor providing radiocarbon dating.
Appendix. Supplementary information
Supplementary data related to this article can be found online atdoi:10.1016/j.quascirev.2011.01.012.
R.H. Smittenberg et al. / Quaternary Science Reviews 30 (2011) 921e933 931

Author's personal copy
References
Abram, N.J., McGregor, H.V., Gagan, M.K., Hantoro, W.S., Suwargadi, B.W., 2009.Oscillations in the southern extent of the Indo-Pacific warm pool during themid-Holocene. Quat. Sci. Rev. 28, 2794e2803.
Adler, R.F., 2003. The version-2 global precipitation climatology project (GPCP)monthly precipitation analysis (1979-present). J. Hydromet 4, 1147e1167.
Araguás-Araguás, L., Froehlich, K., Rozanski, K., 1998. Stable isotope composition ofprecipitation over southeast Asia. J. Geophys. Res. 103 (D22), 28721e28742.
Bard, E., Frank, M., 2006. Climate change and solar variability: What’s new underthe sun? Earth Planet. Sci. Lett. 248, 1e14.
Behrenfeld, M.J., O’Malley, R.T., Siegel, D.A., McClain, C.R., Sarmiento, J.L.,Feldman, G.C., Milligan, A.J., Falkowski, P.G., Letelier, R.M., Boss, E.S., 2006.Climate-driven trends in contemporary ocean productivity. Nature 444,752e755.
Bowen, G.J., 2008. Spatial analysis of the intra-annual variation of precipitationisotope ratios and its climatological corollaries. J. Geophys. Res. 113.doi:10.1029/2007JD009295 D05113.
Broccoli, A.J., Dahl, K.A., Stouffer, R.J., 2006. Response of the ITCZ to northernhemisphere cooling. Geophys. Res. Lett. 33. doi:10.1029/2005GL024546 L01702.
Brown, J., Tudhope, A.W., Collins, M., McGrego, H.V., 2008. Mid-Holocene ENSO:Issues in quantitative model-proxy data comparisons. Paleoceanography 23.doi:10.1029/2007PA001512 PA3202.
Bronk Ramsey, C., 2009. Bayesian analysis of radiocarbon dates. Radiocarbon 51,337e360.
Burgoyne, T.W., Hayes, J.M., 1998. Quantitative production of H2 by pyrolysis of gaschromatographic effluents. Anal. Chem. 70, 5136e5141.
Burnett, W.C., Landing, W.M., Lyons, W.B., Orem, W., 1989. Jellyfish Lake, Palau:a model anoxic environment for geochemical studies. Eos 73, 777e783.
Campbell, B.J., Li, C., Sessions, A.L., Valentine, D.L., 2009. Hydrogen isotopic frac-tionation in lipid biosynthesis by H2-consuming Desulfobacterium auto-trophicum. Geochim. Cosmochim. Acta 73, 2744e2757.
Cane, M.A., 1998. Climate change: a role for the tropical Pacific. Science 282, 59e61.Chiang, J.C.H., Bitz, C.M., 2005. Influence of high latitude ice cover on the marine
Intertropical Convergence Zone. Clim. Dyn. 25, 477e496.Collins, M., An, S.-I., Cai, W., Ganachaud, A., Guilyardi, E., Jin, F.-F., Jochum, M.,
Lengaigne, M., Power, S., Timmermann, A., Vecchi, G., Wittenberg, A., 2010. Theimpact of global warming on the tropical Pacific Ocean and El Niño. Nat. Geosci.3, 391e397.
Dawson, M.N., Martin, L.E., Bell, L.J., Patric, S., 2009. Marine Lakes. In: Gillespie, R.,Clague, D.A. (Eds.), Encyclopedia of Islands. University of California Press, Ber-keley, pp. 603e607.
Dawson, M.N., Martin, L.E., Penland, L.K., 2001. Jellyfish swarms, tourists, and theChrist-child. Hydrobiologia 451, 131e144.
Dissard, D., Nehrkea, G., Reichart, G.-J., Bijma, J., 2010. The impact of salinity on theMg/Ca and Sr/Ca ratio in the benthic foraminifera ammonia tepida: results fromculture experiments. Geochim. Cosmochim. Acta 74, 928e940.
Englebrecht, A.C., Sachs, J.P., 2005. Determination of sediment provenance at driftsites using hydrogen isotopes and unsaturation ratios in alkenones. Geochim.Cosmochim. Acta 69, 4253e4265.
Gagan, M.K., Hendy, E.J., Haberle, S.G., Hantoro, W.S., 2004. Post-glacial evolution ofthe Indo-Pacific Warm Pool and El Niño-southern oscillation. Quat. Int. 118-119,127e143.
Griffiths, M.L., Drysdale, R.N., Gagan, M.K., Zhao, J., Ayliffe, L.K., Hellstrom, J.C.,Hantoro, W.S., Frisia, S., Feng, Y., Cartwright, I., Pierre, E.S., Fischer, M.J.,Suwargadi, B.W., 2009. Increasing Australian-Indonesian monsoon rainfalllinked to early Holocene sea-level rise. Nat. Geosci. 2, 636e639.
Hamner, W.M., Gilmer, R.W., Hamner, P.P., 1982. The physical, chemical, and bio-logical characteristics of a stratified, saline, sulfide lake in Palau. Limnol. Oce-anogr. 27, 896e909.
Hamner, W.M., Hamner, P.P., 1998. Stratified marine lakes of Palau (Western Caro-line Islands). Phys. Geogr. 19, 175e220.
Huang, Y.S., Shuman, B., Wang, Y., Webb, T., 2004. Hydrogen isotope ratios ofindividual lipids in lake sediments as novel tracers of climatic and environ-mental change: a surface sediment test. J. Paleolim. 31, 363e375.
IAEA, 2006. Isotope Hydrology Information System. The ISOHIS Database. http://isohis.iaea.org Accessible at.
Kayanne, H., Yamano, H., Randall, R.H., 2002. Holocene sea-level changes andbarrier reef formation on an oceanic island, Palau Islands, western Pacific. Sed.Geol. 150, 47e60.
Kurita, N., Ichiyanagi, K., 2008. Daily basis precipitation sampling network for waterisotope analysis. Institute of Observational Research for Global Change, JapanAgency for Marine-Earth Science and Technology. http://www.jamstec.go.jp/iorgc/hcorp/data/.
Kurita, N., Ichiyanagi, K., Matsumoto, J., Yamanaka, M.D., Ohata, T., 2009. The rela-tionship between the isotopic content of precipitation and the precipitationamount in tropical regions. J. Geochem. Explor. 102, 113e122.
Laskar, J., Robutel, P., Joutel, F., Gastineau, M., Correia, A.C.M., Levrard, B., 2004.A long term numerical solution for the insolation quantities of the Earth.Astron. Astrophys. 428, 261e285.
LeGrande, A.N., Schmidt, G.A., 2009. Sources of Holocene variability of oxygenisotopes in paleoclimate archives. Clim. Past 5, 441e455.
Legates, D.R., Willmott, C.J., 1990. Mean seasonal and spatial variability in gauge-corrected, global precipitation. Int. J. Climatol. 10, 111e127.
Mann, M.E., Cane, M.A., Zebiak, S.E., Clement, A., 2005. Volcanic and solar forcing ofthe tropical Pacific over the past 1000 years. J. Clim. 18, 447e456.
Martin, L.E., Dawson, M.N., Bell, L.J., Colin, P.L., 2006. Marine lake ecosystemdynamics illustrate ENSO variation in the tropical western Pacific. Biol. Lett. 2,144e147.
Meehl, G.A., Arblaster, J.M., Matthes, K., Sassi, F., van Loon, H., 2009. Amplifying thePacific climate system response to a small 11-year solar cycle forcing. Science325, 1114.
Muscatine, L., Wilkerson, F.P., McCloskey, L.R., 1986. Regulation of populationdensity of symbiotic algae in a tropical marine jellyfish (Mastigias sp.). Mar.Ecol. Prog. Ser. 32, 279e290.
Newton, A., Thunell, R., Stott, L., 2006. Climate and hydrographic variability in theIndo-Pacific Warm Pool during the last millennium. Geophys. Res. Lett. 33.doi:10.1029/2006GL027234 L19710.
Oppo, D.W., Schmidt, G.A., LeGrande, A.N., 2007. Seawater isotope constraints ontropical hydrology during the Holocene. Geophys. Res. Lett. 34. doi:10.1029/2007GL030017 L13701.
Oppo, D.W., Rosenthal, Y., Linsley, B.K., 2009. 2,000-year-long temperature andhydrology reconstructions from the Indo-Pacific Warm Pool. Nature 460,1113e1116.
Partin, J.W., Cobb, K.M., Adkins, J.F., Clark, B., Fernandez, D.P., 2007. Millennial-scaletrends in west Pacific Warm Pool hydrology since the last glacial maximum.Nature 449, 452e455.
Pierrehumbert, R.T., 2000. Climate change and the tropical Pacific: the sleepingdragon wakes. Proc. Nat. Acad. Sci. 97, 1355e1358.
Reimer, P.J., Baillie, M.G.L., Bard, E., Bayliss, A., Beck, J.W., Blackwell, P.G., BronkRamsey, C., Buck, C.E., Burr, G.S., Edwards, R.L., Friedrich, M., Grootes, P.M.,Guilderson, T.P., Hajdas, I., Heaton, T.J., Hogg, A.G., Hughen, K.A., Kaiser, K.F.,Kromer, B., McCormac, F.G., Manning, S.W., Reimer, R.W., Richards, D.A.,Southon, J.R., Talamo, S., Turney, C.S.M., van der Plicht, J., Weyhenmeyer, C.E.,2009. IntCal09 and Marine09 radiocarbon age calibration curves, 0-50,000years cal BP. Radiocarbon 51, 1111e1150.
Sachs, J.P., Sachse, D., Smittenberg, R.H., Zhang, Z., Battisti, D.S., Golubic, S., 2009.Southward movement of the Pacific intertropical convergence zone AD1400e1850. Nat. Geosci. 2, 519e525.
Sachs, J.P., Schwab, V.F., 2011. Hydrogen isotopes in dinosterol from the ChesapeakeBay estuary. Geochim. Cosmochim. Acta 75, 444e459.
Sachse, D., Radke, J., Gleixner, G., 2006. delta D values of individual n-alkanes fromterrestrial plants along a climatic gradient - Implications for the sedimentarybiomarker record. Org. Geochem. 37, 469e483.
Sachse, D., Sachs, J.P., 2008. Inverse relationship between D/H fractionation incyanobacterial lipids and salinity in Christmas Island saline ponds. Geochim.Cosmochim. Acta 72, 793e806.
Sauer, P.E., Eglinton, T.I., Hayes, J.M., Schimmelmann, A., Sessions, A.L., 2001.Compound-specific D/H ratios of lipid biomarkers from sediments as a proxyfor environmental and climatic conditions. Geochim. Cosmochim. Acta 65,213e222.
Saenger, C., Cohen, A.C., Oppo, D.W., Hubbard, D.H., 2008. Interpreting sea surfacetemperature from strontium/calcium ratios in Montastrea corals: link withgrowth rate and implications for proxy reconstructions. Paleoceanography 23.doi:10.1029/2007PA001572.
Saenger, C., Chang, P., Ji, L., Oppo, D.W., Cohen, A.L., 2009. Tropical Atlantic climateresponse to low-latitude and extratropical sea-surface temperature: a Little IceAge perspective. Geophys. Res. Lett. 36. doi:10.1029/2009GL038677 L11703.
Schouten, S., Ossebaar, J., Schreiber, K., Kienhuis, M.V.M., Langer, G., Benthien, A.,Bijma, J., 2006. The effect of temperature, salinity and growth rate on the stablehydrogen isotopic composition of long chain alkenones produced by EmilianiaHuxleyi and Gephyrocapsa Oceanica. Biogeosciences 3, 113e119.
Schwab, V.F., Sachs, J.P., 2009. The measurement of D/H ratio in alkenones and theirisotopic heterogeneity. Org. Geochem. 40, 111e118.
Sessions, A.L., Sylva, S.P., Summons, R.E., Hayes, J.M., 2004. Isotopic exchange ofcarbon-bound hydrogen over geologic timescales. Geochim. Cosmochim. Acta68, 1545e1559.
Shindell, D.T., Schmidt, G.A., Miller, R.L., Mann, M.E., 2003. Volcanic and solarforcing of climate change during the preindustrial era. J. Clim. 16, 4094e4107.
Smittenberg, R.H., Sachs, J.P., 2007. Purification of dinosterol for hydrogen isotopicanalysis using high-performance liquid chromatography-mass spectrometry.J. Chrom. A. 1169, 70e76.
Spencer, R.W., 1993. Global oceanic precipitation from the MSU during 1979-91 andcomparisons to other climatologies. J. Clim. 6, 1301e1326.
Steinhilber, F., Beer, J., Fröhlich, C., 2009. Total solar irradiance during the Holocene.Geophys. Res. Lett. 36. doi:10.1029/2009GL040142 L19704.
Stott, L., Cannariato, K., Thunell, R., Haug, G.H., Koutavas, A., Lund, S., 2004. Declineof surface temperature and salinity in the western tropical Pacific Ocean in theHolocene epoch. Nature 431, 56e59.
Tierney, J.E., Oppo, D.W., Rosenthal, Y., Russell, J.M., Linsley, B.K., 2009. Coordinatedhydrological regimes in the Indo-Pacific region during the past two millennia.Paleoceanography. doi:10.1029/2009PA001871.
Trenberth, K.E., Branstator, G.W., Karoly, D., Kumar, A., Lau, N.-C., Ropelewski, C.,1998. Progress during TOGA in understanding and modeling global tele-connections associated with tropical sea surface temperatures. J. Geophys. Res.103 (C7), 14291e14324.
Trenberth, K.E., Hoar, T.J., 1997. El Niño and climate change. Geophys. Res. Lett. 24,3057e3060.
R.H. Smittenberg et al. / Quaternary Science Reviews 30 (2011) 921e933932

Author's personal copy
van der Meer, M.T.J., Sangiorgi, F., Baas, M., Brinkhuis, H., SinningheDamsté, J.S., Schouten, S., 2008. Molecular isotopic and dinoflagellateevidence for Late Holocene freshening of the Black Sea. Earth Planet. Sci.Lett. 267, 426e434.
van Loon, H., Meehl, G.A., Shea, D.J., 2007. Coupled air-sea response to solar forcingin the Pacific region during northern winter. J. Geophys. Res. 112. doi:10.1029/2006JD007378.
Venkateswaran, K., Shimada, A., Maruyama, A., Higashihara, T., Sakou, H.,Maruyama, T., 1993. Microbial characteristics of Palau Jellyfish lake. Can. J.Microbiol. 39, 506e512.
Volkman, J., 2003. Sterols in microorganisms. Appl. Microbiol. Biotechnol. 60,495e506.
Wang, Y., Cheng, H., Edwards, R.L., He, Y., Kong, X., An, Z., Wu, J., Kelly, M.J.,Dykoski, C.A., Li, X., 2005. The Holocene Asian monsoon: links to solar changesand North Atlantic climate. Science 308, 854e857.
Wang, H., Mehta, V.M., 2008. Decadal variability of the Indo-Pacific warm pool andits association with atmospheric and oceanic variability in the NCEPeNCAR andSODA reanalyses. J. Clim. 21, 5545e5565.
Woodward, F.I., Lomas, M.R., Quaife, T., 2008. Global responses of terrestrialproductivity to contemporary climatic oscillations. Phil. Trans. Roy. Soc. Lond. B.363, 2779e2785.
Wu, H.C., Grottoli, A.G., 2010. Stable oxygen isotope records of corals and scle-rosponge in the Western Pacific warm pool. Coral Reefs 29, 413e418.
Xie, P.P., Arkin, P.A., 1997. Global precipitation: a 17-year monthly analysis based ongauge observations, satellite estimates, and numerical model outputs. Bull. Am.Meteorol. Soc. 78, 2539e2558.
Yancheva, G., Nowaczyk, N.R., Mingram, J., Dulski, P., Schettler, G., Negendank, J.F.W.,Liu, J., Sigman, D.M., Peterson, L.C., Haug, G.H., 2007. Influence of the inter-tropical convergence zone on the East Asian monsoon. Nature 445, 74e77.
Yan, X.-H., Ho, C.-R., Zheng, Q., Klemas, V., 1992. Temperature and size variabilitiesof the western Pacific warm pool. Science 258, 1643e1645.
Zhang, Z., Sachs, J.P., 2007. Hydrogen isotope fractionation in freshwater algae: I.Variations among lipids and species. Org. Geochem. 38, 582e608.
Zhang, X., Gillespie, A.L., Sessions, A.L., 2009a. Large D/H variations in bacteriallipids reflect central metabolic pathways. Proc. Nat. Acad. Sci. 106, 12580.
Zhang, Z., Sachs, J.P., Marchetti, A., 2009b. Hydrogen isotope fractionation infreshwater and marine algae: II. Temperature and nitrogen limited growth rateeffects. Org. Geochem. 40, 428e439.
Zhang, P.Z., Cheng, H., Edwards, R.L., Chen, F., Wang, Y., Yang, X., Liu, J., Tan, M.,Wang, X., Liu, J., An, C., Dai, Z., Zhou, J., Zhang, D., Jia, J., Jin, L., Johnson, K.R.,2008. A test of climate, sun, and culture relationships from an 1810-yearChinese cave record. Science 322, 940e942.
R.H. Smittenberg et al. / Quaternary Science Reviews 30 (2011) 921e933 933