auto-integrating multiple hec-ras flood-line models · pdf fileauto-integrating multiple...
TRANSCRIPT

Watershed Update Vol. 10, No. 1 June - December 2012
1 ____________________________________________________________________________ AWRA Hydrology & Watershed Management Technical Committee <[email protected]>
Auto-Integrating Multiple HEC-RAS Flood-line Models into Catchment-wide SWMM Flood Forecasting Models
W Robert C James, Karen Finney and William James
Computational Hydraulics International
147 Wyndham Street North
Guelph, ON N1H 4E9
Canada
Email: <[email protected]>

Watershed Update Vol. 10, No. 1 June - December 2012
2 ____________________________________________________________________________ AWRA Hydrology & Watershed Management Technical Committee <[email protected]>
ABSTRACT
Flooding in Ontario is fairly common. Recently two Ontario conservation authorities, the Toronto and Region Conservation Authority (TRCA) and the Credit Valley Conservation Authority (CVC) have developed flood forecasting models (FFMs) that process real-time radar-rainfall and leverage multiple existing HEC-RAS model datafiles. In these FFMs PCSWMM represents the watershed hydrology and hydraulics in a real-time decision support system that computes watershed responses using long-term continuous simulations. The Don Valley watershed FFM comprises 67 subcatchments, 2734 conduits, 2376 junctions, 17 storage ponds, and 4 orifices representing the G. Lord Ross Dam, while the Cooksville Creek watershed FFM comprises 30 subcatchments, 302 conduits and 250 junctions. Although the primary purpose of these FFMs is to estimate peak computed water surface elevations throughout the watersheds, up to 2 hours prior to the rainfall events, the focus of this paper is the constituent procedure of rapid conversion of HEC-RAS datasets into conceptually-equivalent SWMM5-compatible models, and to verify the methodology.
INTRODUCTION
Because development took place prior to current building standards in Ontario, many urbanized watersheds have flood-susceptible areas (Hebb and Mortsch, 2007). As an example of this situation, on August 19, 2005 100-150 mm of rain fell within one hour in the Toronto Region resulting in an estimated $10-11 million of municipal costs for repairing roads and infrastructure. Additional insurance claims were estimated to be $350 million (TRCA, 2006). As a further example, evidently the most severe flooding on record, in terms of loss of life in Ontario, occurred in October 1954 when Hurricane Hazel passed over the Toronto area. Eighty-one lives were lost and damages were estimated at $25 million or $146.9 million in 1998 dollars (MNR, 2008). Consequently Ontario Conservation Authorities have, within their watersheds, prioritized the need to better understand and quantify flood response and impacts, and thus the need for accurate flood management and forecasting. An effective flood warning system can mitigate potential damage and injury in these areas (Ontario Ministry of Natural Resources MNR, 2008).
In simple terms, the goal of a flood warning system is to inform those in danger and so reduce the risk of injury, fatality and property damage, and this includes providing information for safe dam operations (MNR, 2008). Thus a flood warning system estimates likely flood water levels caused by incoming events and provides timely warnings to those potentially in danger. Current watershed flood forecasting systems can be improved by using meteorological observations in combination with a model to forecast water levels and flows (MNR, 2008). Remote-sensing radar data can be acquired and used to estimate near-future rainfall and can be applied to continuous real-time hydrology and hydraulic models to estimate likely water surface elevations (CHI, 2009).
Recently two conservation authorities, the Toronto and Region Conservation authority (TRCA) and the Credit Valley Conservation authority (CVC) have implemented flood forecasting models for the Don Valley watershed, located in Toronto, Ontario, and for Cooksville Creek, in Mississauga, Ontario.

Watershed Update Vol. 10, No. 1 June - December 2012
3 ____________________________________________________________________________ AWRA Hydrology & Watershed Management Technical Committee <[email protected]>
These models were assembled using multiple existing HEC-RAS datafiles, and automatically imported into a SWMM5-compatible hydrology model (PCSWMM) which was calibrated against observed rainfall to match flow data. SWMM5 was chosen for the unsteady floodline computational engine because it accounts for varied urban drainage infrastructure, loss of flood plain storage, conveyance and area, and is computationally stable (FEMA, 2002), and PCSWMM was chosen to provide the necessary decision and action support systems partly because it is transparently compatible with SWMM5.
Over the past 40 years or more a large investment has been made in HEC-2 and HEC-RAS floodplain delineation studies, and the resulting datafiles have been carefully archived. Leveraging these existing HEC-RAS hydraulics datafiles allows the river bathymetry to be modeled without incurring additional costly survey work. For developing SWMM5 datafiles from existing HEC-RAS data, a new procedure was required. Implemented in the transparent PCSWMM decision support system, the new import routines were designed to conserve the available hydraulic storage in the network and to transfer and distribute geo-referencing information for executing GIS-based water surface calculations. Note that in PCSWMM the routines in the SWMM5 engine remain unchanged, and datafiles are transparently interchangeable between these two programs. HGL comparisons for a sub-basin in the Don Valley watershed verified the performance of the new modeling procedures.
Flood forecasting system
To assist flood duty staff in making informed decisions, new flood forecasting model (FFM) systems are required to forecast near-future water surface elevations throughout their watersheds. Current flood forecasting systems were found to be insufficiently accurate or responsive, and it was suggested that the methodologies could be improved by:
1. more detailed, higher-resolution hydrological and hydraulic modeling, 2. high resolution radar-rainfall acquisition and processing, 3. real-time forecasting and flood analysis tools, and 4. an accessible web-based spatial decision and action support environment.
Included in the new PCSWMM real-time FFM system are four main components:
1. real-time radar rainfall acquisition, processing and forecasting; 2. real-time continuous SWMM modeling; 3. real-time flood inundation and flood vulnerable asset analysis; and 4. real-time web-based decision support.
So much for the background; from here on, the present paper focuses on one task in the third component: automatic importation and adaptation of HEC-RAS datafiles into a conceptually equivalent SWMM5, a new task built into PCSWMM. Denoting an automatically-derived PCSWMM model herein “AD-PCSWMM” distinguishes it from an independently and manually constructed PCSWMM model.
Note that while it is generally considered that models should be proven against observed flow and rain records, in this study, because the 100y floodline has legal and fiscal standing, it is important that

Watershed Update Vol. 10, No. 1 June - December 2012
4 ____________________________________________________________________________ AWRA Hydrology & Watershed Management Technical Committee <[email protected]>
new methodologies should closely conform to the established statuary floodlines. Consistency is essential.
MODEL DESCRIPTIONS
HEC-2, the predecessor of HEC-RAS, was developed by the US Army Corps of Engineers, first released in 1968, and was last released in 1991. HEC-RAS is an event-based hydraulic model that has been widely used for floodway and floodplain modeling since its release in 1995 (FEMA, 2002). HEC-RAS models are commonly used for steady-state analysis (however there is an unsteady flow or dynamic option). HEC-RAS models in flood mapping studies frequently simulate flow through culverts, natural channels and bridges.
SWMM, originally developed by the U.S. EPA in 1971, is a spatially distributed, rainfall-runoff simulation model used for single event or continuous simulation of runoff quantity and quality. SWMM has been updated many times since its first release, the most recent (this is written in November 2012) version being SWMM5.0.022. SWMM5 hydrology operates on a collection of catchments that receive precipitation and generate runoff and pollutant hydrographs, accounting for evapotranspiration, infiltration and groundwater percolation (Rossman, 2008). Runoff is transported through a system of pipes, channels, storage/treatment devices, pumps, and regulators. SWMM5 models have been used for a wide variety of watershed applications, as reported in the long series of 21 annual monographs resulting from the annual International Conference on Stormwater and Urban Water Systems held in Toronto every February (see: www.CHIwater.com). SWMM5 has an advantage in that it accounts for the loss of (a) flood plain storage, (b) conveyance and (c) area. (On the other hand, floodway analyses in steady flow models account only for the loss of conveyance.) SWMM5 is accepted by FEMA for floodway/flood plain determination (FEMA, 2002).
PCSWMM is a group decision and action support system that provides an engineering planning, design, and management environment for SWMM, as well as additional hydrologic and hydraulic capabilities. Differences between HEC-RAS and PCSWMM hydraulics primarily result from the way the two models define river reach or link cross-sections and transects. In SWMM5, links are assigned a uniform cross-section, separated by a node. Figure 1 shows how CVC’s Cooksville Creek is schematically represented in a SWMM5 model, where the links are shown in yellow and the nodes blue.

Watershed Update Vol. 10, No. 1 June - December 2012
5 ____________________________________________________________________________ AWRA Hydrology & Watershed Management Technical Committee <[email protected]>
Figure 1 - SWMM5 link and node network (Cooksville Creek, CVC)
HEC-RAS networks differ by defining river reaches separated by a transect or junction that is typically a specified or surveyed cross-section, generally indicating an abrupt change in river geometry (U.S. Army Corps of Engineers, 2010). Reach cross-sections are assumed to vary linearly between transects. Figure 2 shows how the geometric data of a geo-referenced HEC-RAS model are represented schematically. In this example there are two rivers: River-1 which has two reaches and River-2 which has one. Cross-section locations are represented by green lines that intersect the river centerline and bridge/culverts are coloured gray.

Watershed Update Vol. 10, No. 1 June - December 2012
6 ____________________________________________________________________________ AWRA Hydrology & Watershed Management Technical Committee <[email protected]>
Figure 2- HEC-RAS geometric data (Cooksville Creek, CVC)
Because it has been a preferred method for delineating floodplains and floodways, numerous HEC-RAS datafiles (commonly referred to as “models”) are readily available from watershed authorities. HEC-RAS datafiles contain detailed information on the watershed bathymetry and the geometry of key hydraulic structures. To leverage these existing HEC-RAS datafiles, originally derived for a range of earlier HEC-RAS codes, additional special code was created in PCSWMM to convert multiple standard and obsolete HEC-RAS geometric datafiles into an equivalent geo-referenced SWMM5 hydraulic model, both conceptually and geometrically. The new HEC-RAS importer:
transforms HEC river reach segments into a SWMM conduits layer;
positions junctions at the HEC geo-referenced transects;
obtains from the HEC-RAS cross-sections junction depths, transect data, bank stations, Manning's n coefficients and invert elevations;
imports common culvert shapes and irregular cross-sections;
assigns to the downstream conduits culvert shapes and transects as the case may be;
uses GIS conduit lengths to draw the network; and
imports HEC user-defined lengths into the conduit length attributes for routing calculations.
Another important difference between HEC-RAS and SWMM5 lies in the methods used to simulate bridges and culverts. In HEC-RAS, bridges and culverts are defined using a custom bridge editor that requires four cross-sections to compute energy losses, at the:
1. downstream location where flow has fully expanded (no longer affected by the bridge), 2. downstream cross-section immediately downstream from the bridge, giving the narrowest shape
in the expansion zone,

Watershed Update Vol. 10, No. 1 June - December 2012
7 ____________________________________________________________________________ AWRA Hydrology & Watershed Management Technical Committee <[email protected]>
3. cross-section immediately upstream from the bridge, depicting the narrowest part of the contraction zone, and
4. upstream location where flow has not yet contracted into the bridge structure (U.S. Army Corps of Engineers, 1995).
SWMM5 currently does not support a complex bridge editor so when importing bridge and culverts from HEC-RAS into SWMM5. Therefore in PCSWMM an equivalent surface area to depth transect is assigned as a custom culvert shape. Bridge piers are modeled as parallel conduits, each representing the surface area available for flow under the structure. The high-chord overflow of the bridge or culvert is, of course, represented by an additional, parallel, irregular open channel conduit.
Comparison of 100-y HGL computed by HEC-RAS and AD-PCSWMM
To determine whether AD-PCSWMM computes flood depths and flows comparable to those generated by HEC-RAS, previously-created HEC-RAS models were imported using both (a) kinematic and (b) dynamic wave routing. Peak computed surface water elevations (CWSEL) for the two routing methods were compared to the HEC-RAS steady-state results for the established, official 100-y event for the Don Valley watershed, specifically in a section of the Don Valley watershed located in Mississauga, Ontario and referred to as Basin 39A. As shown in Figure 3, the section comprised approximately 4 km of river with three bridge structures.
Figure 3 - Location of HEC-RAS model section located in the Don Valley watershed in Mississauga, Ontario
A further important difference between HEC-RAS and SWMM5 lies in the way the programs handle assigned flows. In HEC-RAS the assigned steady-state flow rate supersedes steady flow rates assigned upstream (US Army Corps of Engineers, 2010). However in SWMM5 baseline flows assigned

Watershed Update Vol. 10, No. 1 June - December 2012
8 ____________________________________________________________________________ AWRA Hydrology & Watershed Management Technical Committee <[email protected]>
to the nodes represent additional inflow; instead of replacing the previous flow with the new flow SWMM5 adds the new flow. Thus to set equivalent conditions as a HEC-RAS model, SWMM5 baseline flows are entered at the upstream junctions. Figure 4 is a screen-shot of steady Flow Data assigned to the Basin 39A HEC-RAS model. To represent the HEC-RAS 100y steady state flows in SWMM5, the upper junctions were assigned baselines flows of 281.4 m3/s for reach 1 and 7.6 m3/s for reach 2, as shown in Figure 4.
Figure 4 - Baseline flow locations (junctions J39.26 and J390.06)
Figure 5 presents results from the HEC-RAS steady-state model and the kinematic and dynamic AD-PCSWMM5 models. Kinematic routing results did not compare well to the HEC-RAS peak water surface elevation whereas dynamic wave routing results closely matched HEC-RAS maximum CWSEL.
Figure 5 - Hydraulic grade line (HGL) comparison SWMM5 DW & KW - 100y
Watershed Update Vol. 10, No. 1 June - December 2012
9 ____________________________________________________________________________ AWRA Hydrology & Watershed Management Technical Committee <[email protected]>
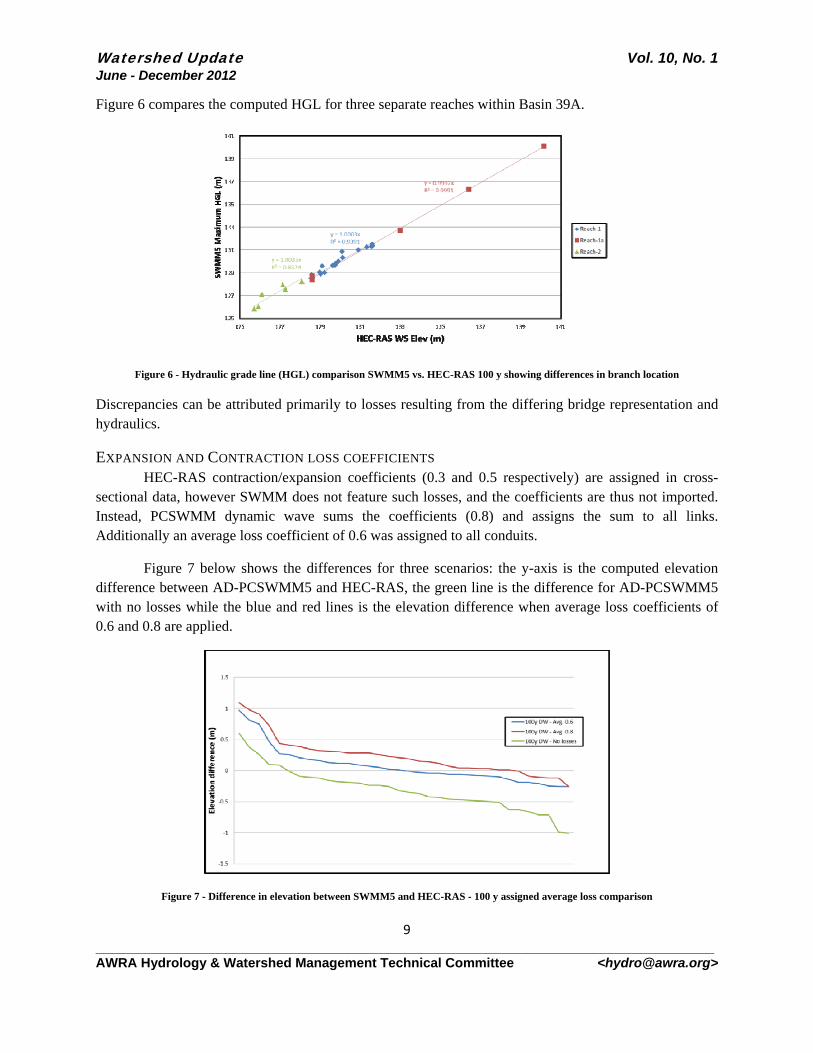
Figure 6 compares the computed HGL for three separate reaches within Basin 39A.
Figure 6 - Hydraulic grade line (HGL) comparison SWMM5 vs. HEC-RAS 100 y showing differences in branch location
Discrepancies can be attributed primarily to losses resulting from the differing bridge representation and hydraulics.
EXPANSION AND CONTRACTION LOSS COEFFICIENTS HEC-RAS contraction/expansion coefficients (0.3 and 0.5 respectively) are assigned in cross-sectional data, however SWMM does not feature such losses, and the coefficients are thus not imported. Instead, PCSWMM dynamic wave sums the coefficients (0.8) and assigns the sum to all links. Additionally an average loss coefficient of 0.6 was assigned to all conduits.
Figure 7 below shows the differences for three scenarios: the y-axis is the computed elevation difference between AD-PCSWMM5 and HEC-RAS, the green line is the difference for AD-PCSWMM5 with no losses while the blue and red lines is the elevation difference when average loss coefficients of 0.6 and 0.8 are applied.
Figure 7 - Difference in elevation between SWMM5 and HEC-RAS - 100 y assigned average loss comparison

Watershed Update Vol. 10, No. 1 June - December 2012
10 ____________________________________________________________________________ AWRA Hydrology & Watershed Management Technical Committee <[email protected]>
COMPUTED WATER SURFACE ELEVATION COMPARISONS Of course, the question that arises is whether AD-PCSWMM can with minor adjustment produce results similar to those computed by HEC-RAS. For the 100y flood, largest HGL discrepancies are found at the upstream bridges. Figure 8 compares the two computed peak water levels using the 100y event for Reach 1A where the blue fill area is the AD-PCSWMM generated result and the red line markers are the HEC-RAS results.
Figure 8 - 100 y water surface elevation profile at bridge 39.105
Figure 9 shows better matching of AD-PCSWMM5 CWSEL, as well as the original AD-PCSWMM CWSEL in green, when the average loss coefficient is increased at the upstream bridge. Close matches seem achievable.
Figure 9 - 100 y water surface elevation profile at bridge 39.105 adjusted

Watershed Update Vol. 10, No. 1 June - December 2012
11 ____________________________________________________________________________ AWRA Hydrology & Watershed Management Technical Committee <[email protected]>
MODEL APPLICATION
THE DON VALLEY WATERSHED For the Don Valley watershed in south-western Ontario, the Toronto Region Conservation Authority (TRCA) recently implemented a flood forecasting system that uses PCSWMM. This watershed is approximately 360,000 ha with 17,000 ha of directly connected impervious area (DCIA) and comprises primarily urban land use with industrial and rural areas. Ground elevations range from a maximum of 307 m to a minimum of 73 m at Lake Ontario, with an average slope of approximately 2.5 % (CHI, 2010).
Initially the transport portion of the Don Valley model was assembled in HEC-RAS by combining 35 separate previous HEC models, and the combined model then automatically imported into a new SWMM5 model using the HEC-RAS import routines in PCSWMM. Bridges were characterized using multiple conduits to represent bridge piers and high-chords. Geo-referencing information was imported from GIS coordinates associated with the HEC-RAS geometric files. When geo-referencing information was not available, user-defined lengths were used to position the junctions. To reduce computational error in SWMM5, smaller conduits were aggregated into either upstream or downstream links. Altogether the resulting AD-PCSWMM model for the Don Valley includes approximately 225 km of natural channel, defined by 3000 transects, 270 conduits and bridges, and a single downstream boundary outfall, and is considered to be suitable for major system conveyance.
Entry and exit loss coefficients were assigned differently for three scenarios: (i) irregular or 'natural' channels, (ii) culverts and (iii) bridges. Based on the sum of the contraction and expansion coefficients assigned to most HEC-RAS irregular channels in the original models, an average loss coefficient of 0.4 was assigned to the irregular or natural channels. Culvert losses were automatically assigned as the assembled HEC-RAS model was imported. Bridges and high chords were assigned an entrance loss coefficient of 0.6 and an average loss coefficient of 0.8, based on the assigned entrance and exit loss coefficients upstream and downstream of the bridges.
Additional flood regulators were added to the model to account for 20 stormwater management (SWM) ponds and the G. Ross Lord Dam. SWM ponds were based on a "lumped" SWM pond modeling procedure: equivalent storage volumes were assigned to these ponds, determined by adding the storage volumes and outflows for each catchment for the 2-y to 100-y design storms.
On the West Don River, the major flood control facility is the G. Ross Lord dam, which operates in conjunction with downstream flood control channels to reduce the risk of flooding to flood-prone communities. Approximately 365.76 m long, 19.81 m high with a crest length of 366 m (TRCA, 2007), the dam was modeled in AD-PCSWMM using four orifices representing the four spillway gates and one outlet representing two mud gates, and calibrated against observed time series.
Hydrological parameters for the AD-PCSWMM model were initially estimated using the existing subcatchment inventory from an existing OTTHYMO model, and updated using soils and land use maps to estimate infiltration, Manning’s n, slopes and depression storage. Remaining subcatchment attributes were estimated using a digital elevation model (DEM). Finally the AD-PCSWMM model was calibrated

Watershed Update Vol. 10, No. 1 June - December 2012
12 ____________________________________________________________________________ AWRA Hydrology & Watershed Management Technical Committee <[email protected]>
at three flow gage locations against 10 events using 2.5 years of continuous rainfall from 9 rain gages covering the period from 15/05/2007 to 09/10/2009 (CHI, 2010). Figure 10 compares event total observed and computed flows for the Todmorden flow gage, located in the lower section of the watershed.
Figure 10 - Computed vs. observed event total flow at the Todmorden flow gage
THE COOKSVILLE CREEK WATERSHED Credit Valley Conservation (CVC) recently implemented a flood forecasting system for the Cooksville Creek watershed, located in Mississauga, Ontario. Approximating 3600 ha, 1700 ha being DCIA, this watershed comprises mostly residential land use with industrial and commercial sections, has maximum ground elevation of 200 m and minimum elevation of approximately 75 m at Lake Ontario, and an average slope of 1% (Anderson Associates Limited, 1996).
Two existing HEC-2 models (main branch and east branch) wre available, but did not include geo-spatial information, because of the early software predated graphics environments. Both earlier models were initially converted into HEC-RAS then imported into a geo-referenced AD-PCSWMM model. Further updated HEC-RAS models were imported, bridges were characterized using multiple conduits to represent bridge piers and high-chords, and smaller conduits were aggregated into either the upstream or downstream links. Major system conveyance in the Cooksville Creek model includes 13 km of natural channel defined by 364 transects, 52 conduits and bridges, and a downstream boundary outfall.
For land-phase hydrology, the area was discretized into 30 subcatchments delineated according to common land-uses and topography described in the Cooksville Creek report. To estimate infiltration parameters a soils map layer was used, and for depression storage, DCIA, and Manning's roughness coefficients a land-use layer was used. From two months of continuous rainfall at three rain gages and for

Watershed Update Vol. 10, No. 1 June - December 2012
13 ____________________________________________________________________________ AWRA Hydrology & Watershed Management Technical Committee <[email protected]>
five flow gages covering the period 30/06/2009 - 20/08/2009 (CHI, 2009), the model was calibrated against nine events. Figure 11 compares event total observed and computed flows at flow gage 02HB030, located in the mid-section of the watershed.
Figure 11- Computed vs. observed total flow at flow gage 02HB030
SUMMARY AND CONCLUSIONS
Where there is a history of flooding, helpful flood warning systems that mitigate damage can be readily developed from existing floodplain models. Methodology for fast and automatic leveraging of existing floodplain models is described for two urban watersheds in the Toronto region of Ontario, Canada.
Both the Cooksville Creek and Don Valley FFMs (flood warning models) were efficiently built using this methodology. Water surface elevations computed by both the original HEC and the new AD-PCSWMM models are compared. Results are evidently closely equivalent.
Error:R²SEELSELSE dimRMSERMSE dim
C6.714_1_02HB0300.962239141.251.378834E+100.17991533.340
0
100000
200000
300000
400000
500000
600000
700000
800000
0 100000 200000 300000 400000 500000 600000 700000 800000
Computed vs Observed Total Flow (m³) at Link C6.714_1_02HB030
cooksville creek RT Final.out File date: 09/12/2010 9:51:49 AM
Co
mp
ute
d T
ota
l Flo
w (
m³)
Observed Total Flow (m³)

Watershed Update Vol. 10, No. 1 June - December 2012
14 ____________________________________________________________________________ AWRA Hydrology & Watershed Management Technical Committee <[email protected]>
REFERENCES
Anderson Associates Limited, 1996. Cooksville Creek Floodline Mapping Study – Final Report. Prepared for the City of Mississauga Transportation and Works Department.
Computational Hydraulics International (CHI). 2009. Cooksville Creek real-time flood forecasting model development. Report prepared for the Credit Valley Conservation Authority (CVC), Mississauga, Ontario.
Computational Hydraulics International (CHI). 2010. Don Valley real-time flood forecasting model development and implementation. Report prepared for the Toronto and Region Conservation Authority (TRCA). Toronto, Ontario.
Federal Emergency Management Agency (FEMA). 2002. Floodplain Modeling Manual - HEC-RAS Procedures for HEC-2 Modelers. Dewberry & Davis LLC. Washington, DC.
Hebb, A. and Mortsch, L. 2007. Floods: Mapping Vulnerability in the Upper Thames Watershed under a Changing Climate. Final Report of the Canadian Foundation for Climate and Atmospheric Sciences (CFCAS) Project: Assessment of Water Resources Risk and Vulnerability to Changing Climatic Conditions. Project Report XI.
James, William, Lewis A. Rossman, W. Robert C. James. 2011. User's Guide to SWMM5. [Edition 13 in the CHI series of User's Guides to SWMM]. Pub. CHI, Guelph, Catalog R242, ca 1200 pp. ISBN: 978-0-9808853-5-4.
Ministry of Natural Resources (MNR). 2008. Ontario Flood Forecasting and Warning: Implementation Guidelines for Conservation Authorities and the Ministry of Natural Resources. Ver. 1. (http://www.mnr.gov.on.ca/stdprodconsume/groups/lr/@mnr/@water/documents/document/264484.pdf)
Rossman, Lewis A. 2008. Storm Water Management Model User's Manual Version 5.0. Pub. Water Supply and Water Resources Division, National Risk Management Research Laboratory, Cincinnati, OH.
Todd, H. 2004. Comparison of HEC-RAS and MIKE11 Unsteady Flow Modeling for the Tillamook Valley. World Water Congress, Salt Lake City, UT.
Toronto and Region Conservation Authority (TRCA). 2006. Documentation of the Severe Thunderstorms and Flooding Event of August 19th, 2005. TRCA, Toronto, Ontario. 21 pp. + appendices.
Toronto and Region Conservation Authority (TRCA). 2007. G. Ross Lord Dam Operations and Maintenance and Surveillance manual. TRCA, Toronto, Ontario. 296 pp.
US Army Corps of Engineers. 2010. HEC-RAS River analysis system applications guide. Version 4.1, Davis, CA.

Watershed Update Vol. 10, No. 1 June - December 2012
15 ____________________________________________________________________________ AWRA Hydrology & Watershed Management Technical Committee <[email protected]>
US Army Corps of Engineers. 1995. A Comparison of the One-Dimensional Bridge Hydraulic Routines from: HEC-RAS, HEC-2 and WSPRO. RD-41. 27 pp. + appendices.
US Army Corps of Engineers. 1995. A Comparison of the One-Dimensional Bridge Hydraulic Routines from HEC-RAS, HEC-2 and WSPRO.