automated recognition of lung diseases in ct images based...
TRANSCRIPT

Noname manuscript No.(will be inserted by the editor)
Automated Recognition of Lung Diseases in CT images basedon the Optimum-Path Forest Classifier
Pedro P. Reboucas Filho · Antonio C. da Silva Barros · Geraldo L. B.
Ramalho · Clayton R. Pereira · Joao Paulo Papa · Victor Hugo C. de
Albuquerque · Joao Manuel R. S. Tavares
Received: date / Accepted: date
Abstract The World Health Organization estimated
that around 300 million people have asthma, and 210
million people are affected by Chronic Obstructive Pul-
monary Disease (COPD). Also, it is estimated that
the number of deaths from COPD increased 30% in
2015 and COPD will become the third major cause of
death worldwide by 2030. These statistics about lung
diseases get worse when one considers fibrosis, calci-
fications and other diseases. For the public health sys-
tem, the early and accurate diagnosis of any pulmonary
disease is mandatory for effective treatments and pre-
vention of further deaths. In this sense, this work con-
sists in using information from lung images to identify
and classify lung diseases. Two steps are required to
achieve these goals: automatically extraction of repre-
sentative image features of the lungs, and recognition
of the possible disease using a computational classifier.
Pedro P. Reboucas Filho, Antonio C. da Silva Barros, Ger-aldo L. B. RamalhoLaboratorio de Processamento Digital de Imagens eSimulacao Computacional, Instituto Federal de Federalde Educacao, Ciencia e Tecnologia do Ceara (IFCE),Ceara, Brazil. E-mail: [email protected], [email protected], [email protected]
Clayton R. Pereira, Joao Paulo PapaDepartamento de Ciencia da Computacao, Universidade Es-tadual Paulista, Bauru, Sao Paulo, Brazil. E-mail: [email protected], [email protected]
Victor Hugo C. de AlbuquerquePrograma de Pos-Graduacao em Informatica Aplicada, Uni-versidade de Fortaleza, Fortaleza-CE, Brazil. E-mail: [email protected]
Joao Manuel R. S. TavaresInstituto de Ciencia e Inovacao em Engenharia Mecanicae Engenharia Industrial, Departamento de EngenhariaMecanica, Faculdade de Engenharia, Universidade do Porto,Porto, Portugal. E-mail: [email protected] (correspondingAuthor)
As to the first step, this work proposes an approach
that combines Spatial Interdependence Matrix (SIM)
and Visual Information Fidelity (VIF). Concerning the
second step, we propose to employ a Gaussian based
distance to be used together with the Optimum-Path
Forest (OPF) classifier to classify the lungs under study
as normal or with fibrosis, or even affected by COPD.
Moreover, to confirm the robustness of OPF in this clas-
sification problem, we also considered Support Vector
Machines and a Multilayer Perceptron Neural Network
for comparison purposes. Overall, the results confirmed
the good performance of the OPF configured with the
Gaussian distance when applied to SIM and VIF based
features. The performance scores achieved by the OPF
classifier were as follows: average accuracy of 98.2%, to-
tal processing time of 117 microseconds in a commonpersonal laptop, and F -score of 95.2% for the three clas-
sification classes. These results showed that OPF is a
very competitive classifier, and suitable to be used for
lung disease classification.
Keywords Medical Imaging · Optimum-Path Forest ·Feature Extraction · Image Classification.
1 Introduction
Since its establishment in 1948, the World Health Or-
ganization (WHO) is responsible for ranking the most
dangerous diseases, which are led today by ischaemic
heart disease followed by cerebral vascular accidents,
usually known as strokes. Additionally, the large num-
ber of lung diseases that affect the worldwide popula-
tion has also been confirmed by WHO [1]. Therefore,
research in the field of Pulmonology has become of great
importance in public health, and it has been mainly fo-

2 Pedro P. Reboucas Filho et al.
cused on asthma, bronchiectasis and Chronic Obstruc-
tive Pulmonary Disease (COPD) [2, 3].
WHO estimated around 300 million people suffer-
ing from asthma, being this disease in charge of around
250 thousand deaths per year worldwide [4]. In addi-
tion, WHO estimated that around 210 million people
are affected by COPD, which is responsible for about
3 million deaths in 2015 (5% of all worldwide deaths
in that year) [5]. Recent studies revealed that COPD is
mainly present in the 20-to-45-year-old age bracket, al-
though it is usually characterized as an over-50-year-old
disease. Accordingly, WHO estimated that the number
of deaths due to COPD increased 30% in 2015, being
such disease the third cause of mortality worldwide by
2030 [6].
Based on the aforementioned context, the early and
accurate diagnosis of pulmonary diseases is mandatory
for the public health systems in order to attain effec-
tive treatments and prevention of further deaths. From
a clinical viewpoint, aid diagnosis tools and systems are
of great importance for specialists to improve people
health. In this sense, this work uses information from
lung images to identify and classify lung diseases ac-
cording to two main steps: (i) extraction of lung image
features, and (ii) identification of lung diseases using a
machine learning classifier. As to the extraction of infor-
mation from the lungs under study, the Computed To-
mography (CT) imaging modality has been commonly
used in pulmonology for diagnostic purpose, since it en-
ables the analysis of the lungs and their internal struc-
tures with high quality and accuracy [7, 8, 9, 10]. How-
ever, for the effective pulmonary disease analysis and
diagnosis from CT images, it is usually necessary to
segment the regions of interest (ROIs), i.e., the lungs
in the input images, since these ROIs must include the
lung structures that are the object of study [11, 12, 8].
The segmentation step proposed in this work is based
on the Adaptive Crisp Active Contour Models (ACACM)
method, which uses an active contour model specially
designed for medical imaging that has outperformed
traditional image segmentation methods, such as Wa-
tershed, Region Growing, Mathematical Morphology,
as well as the well-known Active Contour algorithm
[8, 13]. Following the segmentation step, an automatic
procedure can be applied to detect diseases in lung
CT images in order to support radiologic diagnosis.
Some studies have yielded promising disease detection
results, as the one reported in [14], where texture de-
scriptors extracted from a Gray Level Co-occurrence
Matrix (GLCM) [15] are used to distinguish three dis-
ease patterns (nodule, emphysema and frosted glass)
relatively to the normal one. GLCM texture descrip-
tors are also employed in [16] to determine whether
lungs are healthy or not. Furthermore, some works have
been proposed to address the detection of certain spe-
cific lung diseases in images, such as nodules [17] and
emphysema [18, 8], just to name a few. Finally, Ra-
malho et al. [16] proposed a feature extraction method
based on a Spatial Interdependence Matrix (SIM) to
classify lung diseases. In this work, this approach is ex-
tended by combining Visual Information Fidelity (VIF)
[19] with attributes obtained from the SIM method.
In the classification step, we focused our study
on a recent classifier known as Optimum Path For-
est (OPF) [20, 21, 22], which has gained increas-
ing attention in the last years because it presents
interesting characteristics: (i) it is free of hard-to-
calibrate control parameters; (ii) it does not assume
any shape/separability of the feature space; (iii) it runs
the training phase usually much faster than other tech-
niques; and (iv) it can make decisions based on global
criteria. Moreover, the OPF classifier does not inter-
pret the classification task as a hyperplane optimiza-
tion problem, but as the computation of optimum paths
from key patterns (known as prototypes) to the re-
maining nodes. As such, each prototype becomes a root
from its optimum-path tree, and then each node is clas-
sified according to its strongest connected prototype.
This process defines a discrete optimal partition (in-
fluence region) of the feature space. Therefore, due its
efficiency and effectiveness, combined with its param-
eter independence and robustness to highly non-linear
datasets, the OPF classifier can be very effective in the
automated classification of CT based images of lungs
as being healthy or affected by diseases like COPD or
fibrosis.
OPF has been used in different application domains,
such as Biomedical engineering, for example, for the
classification of electroencephalography (EEG) [23] and
electrocardiography (ECG) [24] signals, classification
of human intestinal parasites [25], and classification of
brain tissue in Magnetic Resonance images [26], with
very promising performances [27, 28, 29, 30, 31, 32, 33],
mainly with respect to its computational efficiency. As
to the classification rates, OPF has also obtained no-
table results, being in many cases at least as good as
the ones obtained by some traditional classifiers, such
as Support Vector Machines (SVMs), Bayesian classi-
fiers, Artificial Neural Networks (ANNs) and k-nearest
neighbors (k-NNs) [34, 35, 36, 37, 38, 39, 29, 40, 41, 42,
43, 27, 28, 31, 30, 32, 25, 26, 33, 23, 44].
In previous works [45, 46, 47, 48, 9, 49, 13, 50], the
authors have evaluated the potential of different seg-
mentation approaches in order to tackle the automatic
detection of lung nodules in images [51]. Overall, the re-
sults achieved shown that the studied techniques were

Automated Recognition of Lung Diseases in CT images based on the Optimum-Path Forest Classifier 3
competitive in terms of accuracy and processing time.
However, the choice of the feature extractor is a re-
ally critical decision in order to efficient results can be
achieved. Additionally, our previous works let us con-
clude that the automated classification using machine
learning techniques, especially using the Optimum Path
Forest classifier [40, 34, 35, 37, 38, 39, 41, 42, 43], is a
very promising tool in medical assisted diagnosis.
However, despite the number of current applications
based on the OPF classifier, we have not observed any
work related to pulmonary disease identification so far.
This article also addresses the detection of fibrosis and
emphysema diseases, which are the COPD main com-
ponents, based on a new feature extraction method
(SIM). A classification experiment was also performed
to compare the performance achieved from the SIM and
GLCM texture based descriptors. The VIF index [19]
was also investigated, since it performs similarly to SIM
based based descriptors. In fact, both approaches are
based on the analysis of a reference image. As a final
contribution of this article, we considered to employ a
Gaussian based distance to weight OPF edges, since the
original approach uses the Euclidean distance [52]. For
evaluation purpose, the computational cost (processing
time), accuracy rate (success rate), positive predictive
value (precision), sensitivity (recall) and F -measure were
used to calculate the similarity among the patterns un-
der classification [44], as well as to assess the features
extracted from the lung-segmented CT images.
The remainder of this article is organized as follows.
Sections 2 and 3 present the methodology and a theoret-
ical background about the OPF classifier, respectively.
Section 4 discusses the experimental results, and Sec-
tion 5 states the main conclusions and possible future
works.
2 Methodology
2.1 Dataset
The images included in the used experimental dataset
were acquired using the following CT systems: Toshiba
Aquilion (TA), GE Medical system LightSpeed16 (GEMSL)
and Phillips Brilliance 10 (PB). All images have a res-
olution of 512 x 512 pixels, a bit depth of 16 bits, and
were obtained in partnership with the Walter Cantıdio
Hospital of the Federal University of Ceara in Brazil [2,
3]. This research was approved and evaluated by the Re-
search Ethics Committee - COMEPE (Protocol number
35/06), and complied with the requirements of Reso-
lution number 196/96 of the National Health Council
concerning the research in human beings [2, 3].
The CT lung images were acquired on apex, hilum
and on the base of the axial plane, according to the fol-
lowing conditions: each slice has 1.5 mm of thickness,
the field of view was 312 mm, the electrical tension in
the tube was 120 kV, and the electric current was 200
mA; lung window adjustment: the level and width were
-600 and 1600 HU, respectively; the dimension of the
reconstructed window was 512 × 512 pixels, and the
voxels have dimensions of 0.585× 0.585× 1.5 mm, be-
ing quantified in 16 bits. In this study, we used 36 CT
images: 12 from healthy volunteers, 12 from patients
with fibrosis, and 12 from patients with COPD, result-
ing in 72 lungs, since each image contained two lungs.
Concerning these lungs, 27 were healthy, 21 affected by
fibrosis and 24 had COPD.
Reboucas Filho et al. [8] employed the ACACM seg-
mentation method to detect the inner region of the
lungs in CT images, being the segmented regions used
to obtain the attributes employed in the classification
of the lungs under study. The ACACM method was
adopted here because it provides accurate segmenta-
tion results; indeed, it outperformed other segmenta-
tion methods available in the literature based on region
growing, watershed, mathematical morphology and tra-
ditional active contour techniques [53, 54], both in terms
of processing time and accuracy. This method is based
on an Active Contour Model, and encompasses com-
putational intelligence techniques with prior knowledge
about the lung anatomy [55, 8, 56, 57]. Figure 1 depicts
examples of lung segmentation results in thorax CT im-
ages acquired from patients with COPD and fibrosis, as
well as from a healthy volunteer.
2.2 Feature extraction
The first feature extraction method employed in this
work was the GLCM matrix suggested in [15] and often
adopted in problems related to texture analysis [58, 59].
Figure 2 illustrates a three-dimensional distribution of
the samples achieved by the GLCM built upon the ex-
perimental image dataset used in this work. This repre-
sentation was built considering the best set of features
by means of the Principal Component Analysis (PCA)
technique.
The second feature extraction method, namely the
Spatial Interdependence Matrix, uses co-occurrence
statistics to analyze the structural information based
on the way the Human Visual System interprets scenes.
Therefore, this method is commonly used to assess im-
age structural degradation. Moreover, it performs quite
similarly to the VIF index [19], which assesses differ-
ences between an image and its degraded version.

4 Pedro P. Reboucas Filho et al.
(a) (b) (c)
Fig. 1: Examples of segmentation results for thorax CT images with: a) COPD, b) fibrosis and c) healthy lungs [16].
Fig. 2: Three-dimensional distribution concerning three
classes by applying PCA on the GLCM built from the
image dataset under study.
Let us consider an image I and its degraded im-
age J as a set of gray levels in domain D ⊂ Z2 ∈{0, 1, 2, ..., N}, where N is the total number of gray
levels. One can arrange the transitions among the in-
tensities of the pixels that are spatially related in both
images into an (N×N) matrix whose elements Mij are
defined as follows:
Mij = |{(i, j) : i = j, i = I (p) , j = J (p)}| ∀pεD, (1)
which is basically the number of times the intensities
i = I(p) and j = J(p) of pixels p from images I and J
verify some spatial constraint.
Three structural attributes obtained using the SIM
technique are commonly used to assess the degraded im-
age J relatively to the original one I: correlation (Cor),
inverse difference moment (Idm) and chi-square (Chi)
[16]. These attributes represent the level of degradation
from three different perspectives: structural similarity,
structural degradation and structural independence, re-
spectively.
In order to calculate the structural attributes Cor,
Idm and Chi, a symmetric version of matrix M : MS =(M +MT
)/2 is used. Then, a normalization procedure
is applied to MS , such that∑MS = 1, in order to
obtain the weight of each transition-pair as an approxi-
mation of probabilities. Afterwards, the three structural
attributes are computed as follows:
Cor =
N−1∑i,j=0
(i− µi)(j − µj)Mij√ρ2i ρ
2j
ε[−1, 1], (2)
Idm =
N−1∑i,j=0
Mij
1 + |i− j|ε[0, 1], (3)
Chi =
N−1∑i,j=0
(Oi − Ei)2
Eiε[0, 1], (4)
where µi and µj stand for the average values of line i
and column j of matrix MS , and ρi and ρj are the stan-
dard deviation of each line i and column j of the same
matrix; Oi refers to the observed weights in the main
diagonal (i = j) of MS , and Ei refers to the expected
weights in the main diagonal of MS .
The SIM technique provides a visual pattern useful
to interpret the degraded image. When the image struc-
tures are not degraded, the weights are well distributed
closely to the diagonal of the matrix. Otherwise, differ-
ent patterns appear according to the structural degra-
dation. Therefore, the SIM pattern of a healthy lung is
quite different from a fibrosis one. The structures of a
healthy lung are small, sparse and have high contrast.
However, the fibrosis structures are spread through the
lung region.

Automated Recognition of Lung Diseases in CT images based on the Optimum-Path Forest Classifier 5
The degradation model used in this work relies
on the knowledge that CT imaging systems usually
blur the lung structures. Thus, the input images were
smoothed by convolving them with a (3 × 3) Gaus-
sian kernel with zero mean and unitary standard de-
viation. Our experiments have shown that this convo-
lution mask is sufficient to smooth small structures, and
has low impact on the overall computational cost. The
number of gray-levels N was set to 64 in the computa-
tion of the SIM descriptor, which ensures the successful
detection of structural changes and good numerical es-
timations for the co-occurrence frequencies.
2.3 Lung disease classification
Usually, COPD images present low-medium intensity
and large structures. On the other hand, pulmonary-
fibrosis (PF) lung images present particular texture,
and therefore are more susceptible to structural changes
caused by blurring effects. In fact, the Idm and Chi at-
tributes can easily detect this structural degradation.
On the other hand, the fibrosis structures are largely
distributed in the lungs and present relative larger di-
mensions in comparison to protruding structures like
blood vessels. More importantly, the Cor attribute value
exceeds the Idm and Chi ones for degraded structures
in fibrosis images. Regarding healthy lung (HL) images,
usually they are more uniform than PF and COPD im-
ages. Nevertheless, HL images present some prominent
vessels degraded by the smoothing filter. In general, the
SIM attributes for HL are lower than the ones calcu-
lated for PF and COPD images.
The proposed lung disease descriptor is a set of three
attributes in a vector A = {Cor, Idm, 1 − Chi} ex-
tracted from the SIM features computed from the 72
lung images under study. Further, the dataset of de-
scriptors consists of 27 vector samples of healthy lungs,
24 of COPD and 21 of pulmonary fibrosis, respectively.
Experts on pulmonary diseases provided the gold stan-
dard (GS) reference labels that were used to train-
ing and validate the artificial classifiers. Figure 3 il-
lustrates the projection of both sets of descriptors in
the bi-dimensional space using an U-Matrix projection
[60]. This n-dimensional visualization tool reveals the
discriminant power of the descriptors under analysis
through a distance map that indicates how close is an
entity to its neighbors that belong to the same class.
The color intensity in Figures 3a, 3b and 3c, is pro-
portional to the distance, i.e., the darker the color, the
closer the entity is to the neighbors in the same class.
Figures 3d, 3e and 3f illustrate these U-Matrices us-
ing color labelling for the data samples. Two classes
are well discriminated when there is a well-delimited
light region among them. Therefore, this map provides
a visual interpretation of the spatial arrangement of the
samples in clusters of similar meaning. One can observe
that the SIM U-Matrix presents the best discrimina-
tion due to the presence of three well-defined regions,
one for each class. The GLCM U-Matrix presents more
than three regions, which means there are samples asso-
ciated, i.e., belonging to different classes. On the other
hand, the VIF U-Matrix presents only two well-defined
regions, being not so useful to discriminate the three
classes involved. From the images, one can observe that
both GLCM and VIF descriptors performed poorly in
the present context. However, it is noteworthy the tex-
ture descriptors were able to provide a good discrimi-
nation of the COPD cases [16].
Figure 4 displays a diagram that highlights the
boundaries found among classes in the segmented lung
images and their associated SIM. The matrices exhibit
a particular pattern for each lung image, as well as sim-
ilarities among samples that belong to the same class.
The largest dispersion around the diagonal indicates
that high contrasted structures are degraded, as hap-
pened in the COPD images. The matrices show a sim-
ilar pattern region with a “V” shape in the HL im-
ages, indicating the imaged lungs present high contrast
among adjacent structures [16].

6 Pedro P. Reboucas Filho et al.
(a) (b) (c)
(d) (e) (f)
Fig. 3: (a-c) U-Matrices for the SIM, GLCM and VIF descriptors used in lung disease discrimination; (d-f) the
colors identify the HL (red), PF (yellow), and COPD (blue) classes [16].
Fig. 4: Lung images associated to the boundaries of the
classes under study. The colors in the U-Matrix identify
the HL (red), PF (yellow) and COPD (blue) classes [16].
3 Optimum-path Forest classifier
The OPF classifier works by modeling the problem of
pattern recognition as a graph partition in a given fea-
ture space. The nodes are represented by feature vec-
tors and the edges connect all pairs of them, defining
a full connectedness graph. This kind of representa-
tion is straightforward, given that the graph does not
need to be explicitly represented, allowing the saving of
memory. The partition of the graph is carried out by a
competition process between key samples (prototypes),
which defines optimum paths to the remaining nodes of
the graph. Each prototype sample defines its optimum-
path tree (OPT), and the collection of all OPTs defines
an optimum-path forest, which gives the name to the
classifier [61].
Let Z = Z1 ∪ Z2 be a dataset labeled with a func-
tion λ, in which Z1 and Z2 are, respectively, a training
set and a test set such that Z1 is used to train the clas-
sifier and Z2 is used to assess its accuracy. Also, let’s
S ⊆ Z1 be a set of prototype samples. Essentially, the
OPF classifier creates a discrete optimal partition of
the feature space such that any sample s ∈ Z2 can be
classified according to this partition. The found parti-
tion is the OPF computed in <n by the image foresting
transform (IFT) algorithm [62].
The OPF algorithm may be used based with any
smooth path-cost function that can group samples with
similar properties [62]. In this work, we considered the
Automated Recognition of Lung Diseases in CT images based on the Optimum-Path Forest Classifier 7
path-cost function fmax, which is computed as follows:
fmax(〈s〉) =
{0 if s ∈ S,
+∞ otherwise,
fmax(π · 〈s, t〉) = max{fmax(π), d(s, t)}, (5)
in which d(s, t) means the distance between samples s
and t, and a path π is defined as a sequence of adja-
cent samples. Notice that 〈s〉 stands for a trivial path
rooted at sample s, and 〈s, t〉 denotes the arc between
the adjacent nodes s and t.
Therefore, one has that fmax(π) computes the max-
imum distance between adjacent samples in π, when π
is not a trivial path. The OPF algorithm assigns one
optimum path P ∗(s) from S to every sample s ∈ Z1,
establishing an optimum path forest P (a function with
no cycles that assigns to each s ∈ Z1\S its predeces-
sor P (s) in P ∗(s) or a marker nil when s ∈ S). Let’s
R(s) ∈ S be the root of P ∗(s) that can be reached
from P (s). Then, OPF computes for each s ∈ Z1, the
cost C(s) of P ∗(s), the label L(s) = λ(R(s)), and the
predecessor P (s).
The OPF classifier is composed of two distinct
phases: (i) training and (ii) classification. The former
step consists, essentially, in finding the prototypes and
computing the optimum-path forest, which is the union
of all OPTs rooted at each prototype. After that, a
sample is taken from the test sample, connected to all
samples of the OPF generated in the training phase and
then it is found which node offered the optimum path
to it. Notice that this test sample is not permanently
added to the training set, i.e., it is used only once. The
next sections describe in details this procedure.
One can say that S∗ is an optimum set of proto-
types when the OPF algorithm minimizes the classifi-
cation errors for every s ∈ Z1. S∗ can be found based on
the theoretical relation between the minimum-spanning
tree (MST) and the optimum-path tree for fmax [63].
The training essentially consists in finding S∗ and an
OPF classifier rooted at S∗.
By computing a MST in the complete graph (Z1, A),
a connected acyclic graph whose nodes are all sam-
ples of Z1 and the arcs are undirected and weighted
by the distances d between adjacent samples is estab-
lished. The spanning tree is optimum since the sum of
its arc weights is minimum in comparison to any other
spanning tree in the complete graph. In the MST, ev-
ery pair of samples is connected by a single path that
is optimum according to fmax. That is, the minimum-
spanning tree contains one optimum-path tree for any
selected root node. The optimum prototypes are the
closest elements of the MST with different labels in Z1
(i.e., elements that fall in the frontier of the classes). Al-
gorithm 1 resumes the training procedure for the OPF
classifier.
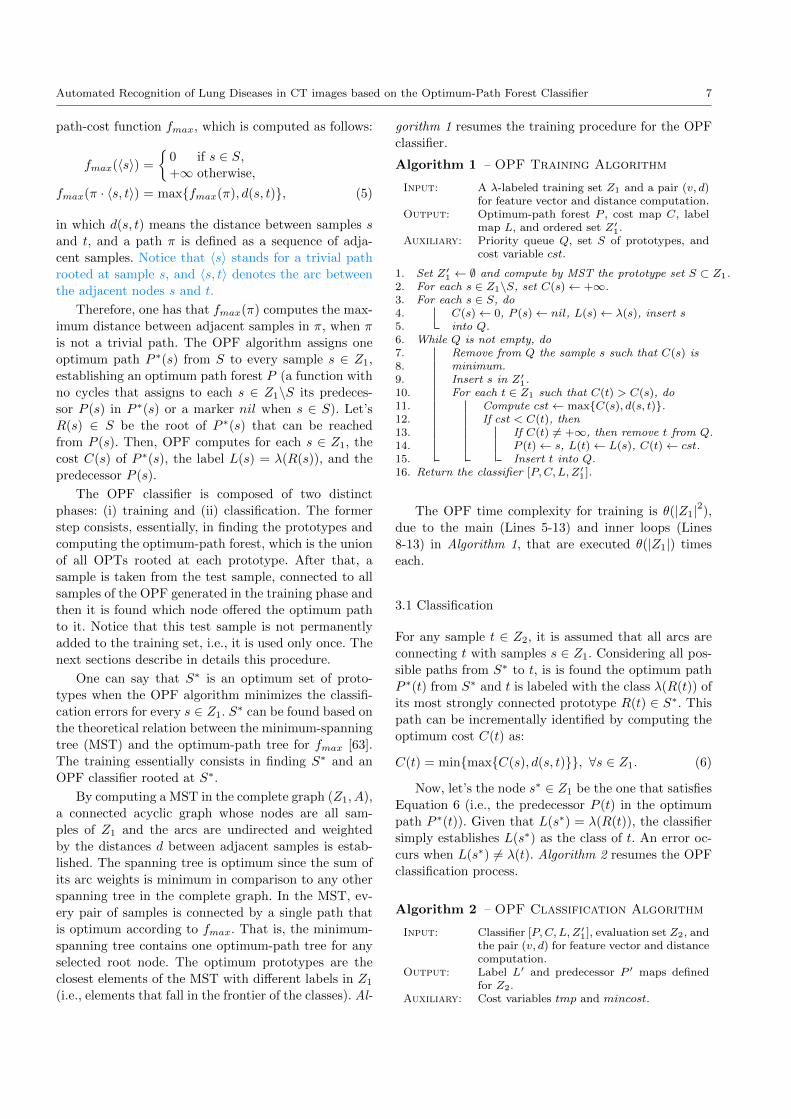
Algorithm 1 – OPF Training Algorithm
Input: A λ-labeled training set Z1 and a pair (v, d)for feature vector and distance computation.
Output: Optimum-path forest P , cost map C, labelmap L, and ordered set Z′
1.Auxiliary: Priority queue Q, set S of prototypes, and
cost variable cst.
1. Set Z′1 ← ∅ and compute by MST the prototype set S ⊂ Z1.
2. For each s ∈ Z1\S, set C(s)← +∞.3. For each s ∈ S, do4. C(s)← 0, P (s)← nil, L(s)← λ(s), insert s5. into Q.6. While Q is not empty, do7. Remove from Q the sample s such that C(s) is8. minimum.9. Insert s in Z′
1.10. For each t ∈ Z1 such that C(t) > C(s), do11. Compute cst← max{C(s), d(s, t)}.12. If cst < C(t), then13. If C(t) 6= +∞, then remove t from Q.14. P (t)← s, L(t)← L(s), C(t)← cst.15. Insert t into Q.16. Return the classifier [P,C,L, Z′
1].
The OPF time complexity for training is θ(|Z1|2),
due to the main (Lines 5-13) and inner loops (Lines
8-13) in Algorithm 1, that are executed θ(|Z1|) times
each.
3.1 Classification
For any sample t ∈ Z2, it is assumed that all arcs are
connecting t with samples s ∈ Z1. Considering all pos-
sible paths from S∗ to t, is is found the optimum path
P ∗(t) from S∗ and t is labeled with the class λ(R(t)) of
its most strongly connected prototype R(t) ∈ S∗. This
path can be incrementally identified by computing the
optimum cost C(t) as:
C(t) = min{max{C(s), d(s, t)}}, ∀s ∈ Z1. (6)
Now, let’s the node s∗ ∈ Z1 be the one that satisfies
Equation 6 (i.e., the predecessor P (t) in the optimum
path P ∗(t)). Given that L(s∗) = λ(R(t)), the classifier
simply establishes L(s∗) as the class of t. An error oc-
curs when L(s∗) 6= λ(t). Algorithm 2 resumes the OPF
classification process.
Algorithm 2 – OPF Classification Algorithm
Input: Classifier [P,C,L, Z′1], evaluation set Z2, and
the pair (v, d) for feature vector and distancecomputation.
Output: Label L′ and predecessor P ′ maps definedfor Z2.
Auxiliary: Cost variables tmp and mincost.
8 Pedro P. Reboucas Filho et al.
0.6
0.5
0.2
0.2
0.3
0.80.7
0.7
0.8
0.8
0.6
0.5 0.2
0.2 0.5
0.2
0.2
0.0 0.0
( i )( ii ) ( iii )
0.5
0.2
0.2
0.0 0.0
???0.2
0.50.6
0.70.3 0.5
0.2
0.2
0.0 0.0
0.4
( iv ) ( v )
Fig. 5: (i) Training set modeled as a complete graph; (ii) computation of a minimum spanning tree over the training
set; (iii) optimum-path forest found over the training set (prototypes are highlighted); (iv) classification process
of a “green” sample; and (v) a test sample is finally classified.
1. For each t ∈ Z2, do2. i← 1, mincost← max{C(ki), d(ki, t)}.3. L′(t)← L1(ki) and P ′(t)← ki.4. While i < |Z′
1| and mincost > C(ki+1), do5. Compute tmp← max{C(ki+1, d(ki+1, t)}.6. If tmp < mincost, then7. mincost← tmp.8. L′(t)← L(ki+1) and P ′(t)← ki+1.9. i← i+ 1.10. Return [L′, P ′].
In Algorithm 2, the main loop (Lines 1 − 9) per-
forms the classification of all nodes in Z2. The inner
loop (Lines 4 − 9) visits each node ki+1 ∈ Z ′1, i =
1, 2, . . . , |Z ′1| − 1 until an optimum path πki+1· 〈ki+1, t〉
is established, Fig. 5.
3.1.1 OPF with Gaussian distance
The OPF algorithm estimates prototypes by calculating
the path-cost function fmax, as given by Equation 5.
The OPF library available freely, which is known as
LibOPF1, implements seven approaches to calculate the
distance d(s, t) between nodes s and t [20, 21].
In this work, we considered a distance between nodes
s and t that is based on the Gaussian probability den-
sity function dGaussian(s, t) [64]:
dGaussian (s, t) = 1− exp(−‖s− t‖
2σ2
), (7)
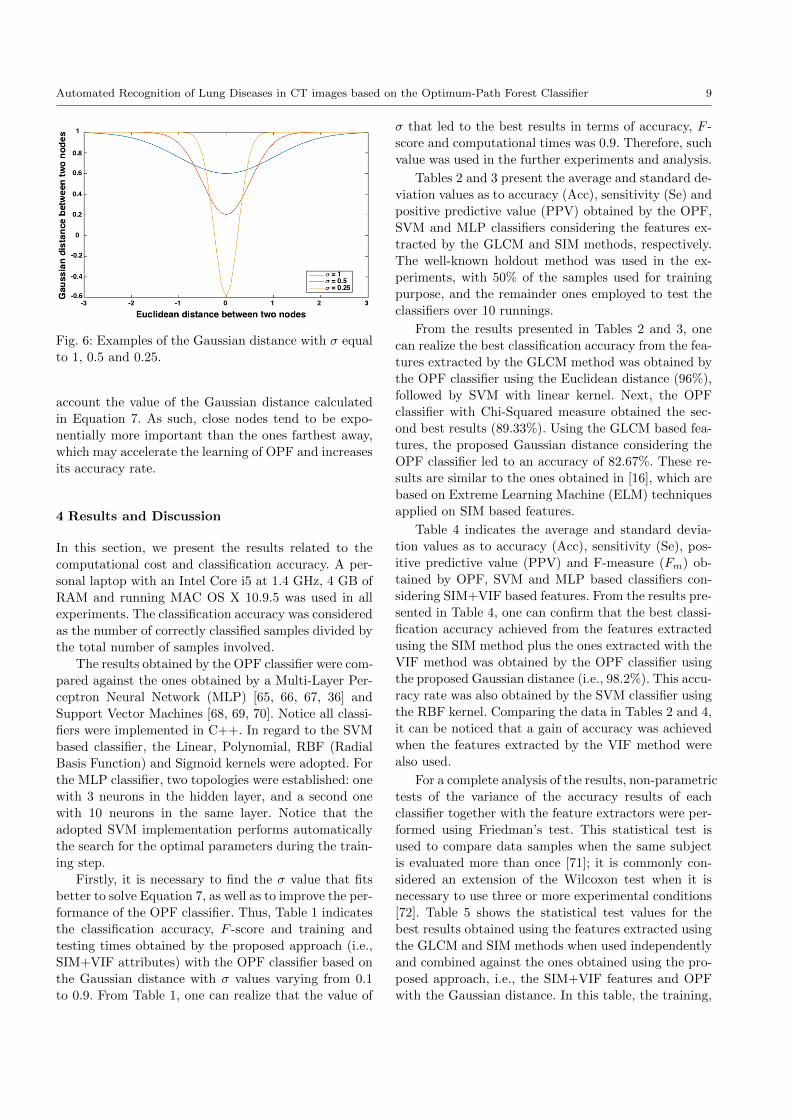
where σ is a parameter that controls the smoothness of
the Gaussian function, and ‖s− t‖ stands for the Eu-
clidean distance between nodes s and t. Figure 6 depicts
the relationship between the Euclidean and the Gaus-
sian distance with σ equal to 1, 0.5 and 0.25 concerning
two distinct nodes.
In Figure 6, one can observe the smaller is the σ
value, the more peaked is the Gaussian distance and
closer the two nodes are, and that larger σ values cor-
respond to smoother decision boundaries. Then, σ de-
fines the fmax calculated in Equation 5 not only by
the distance between nodes s and t, but by taking into
1 http://www.ic.unicamp.br/~afalcao/libopf/LibOPF.
tar.gz
Automated Recognition of Lung Diseases in CT images based on the Optimum-Path Forest Classifier 9
Fig. 6: Examples of the Gaussian distance with σ equal
to 1, 0.5 and 0.25.
account the value of the Gaussian distance calculated
in Equation 7. As such, close nodes tend to be expo-
nentially more important than the ones farthest away,
which may accelerate the learning of OPF and increases
its accuracy rate.
4 Results and Discussion
In this section, we present the results related to the
computational cost and classification accuracy. A per-
sonal laptop with an Intel Core i5 at 1.4 GHz, 4 GB of
RAM and running MAC OS X 10.9.5 was used in all
experiments. The classification accuracy was considered
as the number of correctly classified samples divided by
the total number of samples involved.
The results obtained by the OPF classifier were com-
pared against the ones obtained by a Multi-Layer Per-
ceptron Neural Network (MLP) [65, 66, 67, 36] and
Support Vector Machines [68, 69, 70]. Notice all classi-
fiers were implemented in C++. In regard to the SVM
based classifier, the Linear, Polynomial, RBF (Radial
Basis Function) and Sigmoid kernels were adopted. For
the MLP classifier, two topologies were established: one
with 3 neurons in the hidden layer, and a second one
with 10 neurons in the same layer. Notice that the
adopted SVM implementation performs automatically
the search for the optimal parameters during the train-
ing step.
Firstly, it is necessary to find the σ value that fits
better to solve Equation 7, as well as to improve the per-
formance of the OPF classifier. Thus, Table 1 indicates
the classification accuracy, F -score and training and
testing times obtained by the proposed approach (i.e.,
SIM+VIF attributes) with the OPF classifier based on
the Gaussian distance with σ values varying from 0.1
to 0.9. From Table 1, one can realize that the value of
σ that led to the best results in terms of accuracy, F -
score and computational times was 0.9. Therefore, such
value was used in the further experiments and analysis.
Tables 2 and 3 present the average and standard de-
viation values as to accuracy (Acc), sensitivity (Se) and
positive predictive value (PPV) obtained by the OPF,
SVM and MLP classifiers considering the features ex-
tracted by the GLCM and SIM methods, respectively.
The well-known holdout method was used in the ex-
periments, with 50% of the samples used for training
purpose, and the remainder ones employed to test the
classifiers over 10 runnings.
From the results presented in Tables 2 and 3, one
can realize the best classification accuracy from the fea-
tures extracted by the GLCM method was obtained by
the OPF classifier using the Euclidean distance (96%),
followed by SVM with linear kernel. Next, the OPF
classifier with Chi-Squared measure obtained the sec-
ond best results (89.33%). Using the GLCM based fea-
tures, the proposed Gaussian distance considering the
OPF classifier led to an accuracy of 82.67%. These re-
sults are similar to the ones obtained in [16], which are
based on Extreme Learning Machine (ELM) techniques
applied on SIM based features.
Table 4 indicates the average and standard devia-
tion values as to accuracy (Acc), sensitivity (Se), pos-
itive predictive value (PPV) and F-measure (Fm) ob-
tained by OPF, SVM and MLP based classifiers con-
sidering SIM+VIF based features. From the results pre-
sented in Table 4, one can confirm that the best classi-
fication accuracy achieved from the features extracted
using the SIM method plus the ones extracted with the
VIF method was obtained by the OPF classifier using
the proposed Gaussian distance (i.e., 98.2%). This accu-
racy rate was also obtained by the SVM classifier using
the RBF kernel. Comparing the data in Tables 2 and 4,
it can be noticed that a gain of accuracy was achieved
when the features extracted by the VIF method were
also used.
For a complete analysis of the results, non-parametric
tests of the variance of the accuracy results of each
classifier together with the feature extractors were per-
formed using Friedman’s test. This statistical test is
used to compare data samples when the same subject
is evaluated more than once [71]; it is commonly con-
sidered an extension of the Wilcoxon test when it is
necessary to use three or more experimental conditions
[72]. Table 5 shows the statistical test values for the
best results obtained using the features extracted using
the GLCM and SIM methods when used independently
and combined against the ones obtained using the pro-
posed approach, i.e., the SIM+VIF features and OPF
with the Gaussian distance. In this table, the training,

10 Pedro P. Reboucas Filho et al.
Table 1: Accuracy (Acc), sensitivity (Se), training and testing times obtained from SIM plus VIF attributes using
the OPF classifier based on the Gaussian distance with different σ values.
σ Acc (%) Se (%) Training Time (µs) Testing Time (µs)
0.10 55.56±0.87 33.33±0.92 85±42 42±30.20 57.78±1.01 36.67±0.98 86±39 43±20.30 68.89±0.91 56.00±1.05 90±40 42±30.40 70.67±1.18 66.67±1.10 91±41 41±10.50 95.56±0.71 93.33±0.81 85±35 43±20.60 95.56±0.55 93.33±0.58 86±37 40±30.70 96.89±0.42 95.33±0.64 83±42 38±20.80 97.78±0.53 96.67±0.53 81±38 38±10.90 98.02±0.46 97.78±0.41 80±36 37±2
Table 2: Accuracy (Acc), sensitivity (Se) and positive predictive value (PPV) obtained by the OPF, SVM and
MLP based classifiers from the features extracted by the GLCM method.
GLCM
Method PPV(%) Se(%) Acc(%)
OPF-Euclidean 97.00±0.05 94.00±0.05 96.00±0.03OPF-Squared Chi-Sq. 92.00±0.03 84.00±0.04 89.33±0.03OPF-Manhattan 90.00±0.05 80.00±0.05 86.67±0.03OPF-Canberra 90.00±0.04 80.00±0.05 86.67±0.00OPF-Gaussian 87.00±0.04 74.00±0.05 82.67±0.03OPF-Chi-Square 72.00±0.07 44.00±0.04 62.67±0.03OPF-BrayCurtis 62.00±0.07 24.00±0.07 49.33±0.04SVM-Linear 95.95±0.04 91.89±0.04 94.59±0.02SVM-RBF 95.54±0.87 91.08±1.73 94.05±1.15SVM-Poly 94.86±1.99 89.73±3.97 93.15±2.65SVM-Sigmoid 67.30±4.86 34.59±9.73 56.40±6.49MLP 4/3/3 91.49±11.18 82.97±22.35 88.65±14.90MLP 4/10/3 90.95±8.86 81.89±17.72 87.93±11.82
Table 3: Accuracy (Acc), sensitivity (Se) and positive predictive value (PPV) obtained by the OPF, SVM and
MLP based classifiers from the features extracted by SIM method.
SIM
Method PPV(%) Se(%) Acc(%)
OPF-Gaussian 98.00±0.04 96.00±0.04 97.53±0.05OPF-Euclidean 98.00±0.00 96.00±0.00 97.33±0.05OPF-Squared Chi-Sq. 97.00±0.05 94.00±0.04 96.00±0.05OPF-Manhattan 94.00±0.05 88.00±0.05 92.00±0.05OPF-Canberra 96.00±0.04 92.00±0.05 94.67±0.04OPF-Chi-Square 75.00±0.06 50.00±0.06 66.67±0.06OPF-BrayCurtis 71.00±0.06 42.00±0.06 61.33±0.06SVM-Poly 98.11±1.73 96.22±3.46 97.48±2.31SVM-Linear 97.30±0.55 94.59±0.32 96.40±0.32SVM-RBF 97.30±0.07 94.59±0.07 96.40±0.06SVM-Sigmoid 68.92±0.05 37.84±0.05 58.56±0.05MLP 3/10/3 91.08±15.35 82.16±30.70 88.11±20.47MLP 3/3/3 87.16±15.98 74.32±31.96 82.88±21.31
test and total times are also indicated additionally to
the average classification accuracy.
The Friedman test is useful to prove the null hypoth-
esis (H0). Table 5 indicates the Friedman test results for
the best classifier in combination with the features ex-
tractors in evaluation. The used confidence interval was
equal to 0.001, which represents the probability that
H0 is incorrect, or the accuracy arrangement between
features extractor methods/classifiers are not equiva-
lent. Equivalence (�) among the results shows how effi-
cient is the proposed approach when compared against
other extractors already established in the literature.
Superiority (4) or inferiority (5) mean that the pro-
posed approach presents effectiveness higher or lower
Automated Recognition of Lung Diseases in CT images based on the Optimum-Path Forest Classifier 11
Table 4: Accuracy (Acc), sensitivity (Se) and positive predictive value (PPV) obtained by the OPF, SVM and
MLP based classifiers from the features extracted by the SIM method plus the ones extracted by the VIF method.
SIM+VIF
Method PPV (%) Se (%) Acc (%)
OPF-Gaussian 97.60±0.04 95.20±0.08 98.20±0.05OPF-Euclidean 97.01±0.01 94.00±0.02 96.00±0.01OPF-Squared Chi-Sq. 97.00±0.03 94.00±0.03 96.00±0.02OPF-Manhattan 97.00±0.02 94.00±0.01 96.00±0.01OPF-Canberra 97.00±0.02 94.00±0.02 96.00±0.01OPF-Chi-Square 80.00±0.07 60.00±0.08 73.33±0.07OPF-BrayCurtis 70.00±0.15 40.00±0.18 60.00±0.17SVM-Poly 97.70±0.87 95.41±1.73 96.94±1.15SVM-Linear 97.84±1.62 95.68±3.24 97.12±2.16SVM-RBF 98.65±0.08 97.30±0.08 98.20±0.07SVM-Sigmoid 68.92±0.11 37.84±0.12 58.56±0.09MLP 4/10/3 91.35±12.58 82.70±25.16 88.47±16.77MLP 4/3/3 87.57±12.90 75.14±25.80 83.42±17.20
Table 5: Results of the Friedman’s test on the Acc values achieved by the classifiers in combination with the
results obtained in the classification of the experimental image dataset used by the classifiers under comparison
(� - Equivalence, 4 - Superiority, 5 - Inferiority.)
Method Acc (%) Statistical test Training time (µs) Testing time (µs) Total time (µs)
GLCM
OPF-Euclidean 96.00±0.03 4 82±63 124±19 206±42SVM-Linear 94.59±0.02 4 7389±1320 4024±697 11413±1050MLP 4/3/3 88.65±14.90 4 53336±38700 1±1 53337±38799
SIM
OPF-Gaussian 97.53±0.05 4 86±42 37±1 123±43SVM-Poly 97.48±2.31 4 200294±32606 444±481 200738±33485MLP 4/10/3 88.11±20.47 4 89800±27442 1±1 89801±27441
SIM+VIF
OPF-Gaussian 98.20±0.05 - 80±36 37±2 117±39SVM-RBF 98.20±0.07 � 15085±3268 3552±5402 18637±8670MLP 4/10/3 88.47±16.77 4 77983±30314 1±1 77984±30315
than the method in comparison, respectively. From the
data presented in Table 5, one can realize that the pro-
posed approach based on SIM+VIF features combined
with OPF and the Gaussian distance performs simi-
larly to the SVM classifier with RBF kernel applied on
SIM+VIF features, but is higher than the other ap-
proaches based on GLCM and SIM features. Also, the
fastest classifier to train was the OPF classifier with
Gaussian distance, the fastest to test was the MLP clas-
sifier, and the one that takes the lowest total time was
the OPF classifier with Gaussian distance. Compared
against the SVM-RBF classifier, the proposed approach
had lower training and test times, thus presenting it-
self as the most efficient solution among the ones under
comparison.
From the results obtained, it is possible to conclude
that the best classification accuracy achieved from the
features extracted by the GLCM method was obtained
by the OPF classifier with Euclidean distance, which
had also the lowest training and total times. On the
other hand, the best classification accuracy obtained
from the features extracted by the SIM method was
achieved using the OPF classifier with the Gaussian dis-
tance. Additionally, this classifier had also in this case
the lowest training and total execution times. The OPF
classifier with the Gaussian distance achieved the best
classification accuracy achieved from the SIM+VIF fea-
tures, which was equal to 98.20%; in addition, this con-
figuration led to the lowest total time.
Another analysis that can be performed is based on
the confusion matrix presented in Table 6, which de-
picts the classes under study and the obtained classifi-
cation results according to the classifier and the feature
extraction method. Analyzing the data in Table 6, it
can be easily noticed the low accuracies obtained by the
MLP based classifier, which is indicated by many errors
verified in the confusion matrix. It can also be noted
that the OPF and SVM based classifiers successfully

12 Pedro P. Reboucas Filho et al.
Table 6: Average confusion matrices for 10 runnings using the best classifiers under comparison applied on the
features extracted using the GLCM and SIM methods and their combination (VIF + SIM).
GLCM
True Class Classified as OPF-Euclidean SVM-Linear MLP 4/3/3
Normal 13 12 12.7
Normal Fibrosis 1 2 0.7
COPD 0 0 0.6
Normal 0.5 2 1.8
Fibrosis Fibrosis 10.5 9 8.3
COPD 0 0 0.9
Normal 0 0 1.1
COPD Fibrosis 0 0 1.2
COPD 12 12 9.7
SIM
True Class Classified as OPF-Gaussian SVM-Polynomial MLP 4/10/3
Normal 13.5 13.6 10.7
Normal Fibrosis 0.5 0.4 2.1
COPD 0 0 1.2
Normal 0 0.4 1.8
Fibrosis Fibrosis 11 10.6 8.8
COPD 0 0 0.4
Normal 0 0 1.1
COPD Fibrosis 0 0 0.7
COPD 12 12 10.2
SIM + VIF
True Class Classified as OPF-Gaussian SVM-RBF MLP 4/10/3
Normal 13.8 13.5 12
Normal Fibrosis 0.2 0.5 1.2
COPD 0 0 0.8
Normal 0 0.1 1.6
Fibrosis Fibrosis 11 10.9 7.6
COPD 0 0 1.8
Normal 0 0 3
COPD Fibrosis 0 0 2.2
COPD 12 12 9
classified the COPD class, as there is no error in their
classification results. The same did not occur for the
Fibrosis and Normal classes, as some errors occurred
with both classifiers.
Based on the experimental findings, it should be
stressed that the OPF classifier with the Gaussian dis-
tance achieved no error in the classification of the Fibro-
sis class, both from the SIM features and from the SIM
features plus the VIF features. It should also be noted
that the classifier that obtained fewer classification er-
rors as to the normal class was the OPF classifier with
the Euclidean distance when applied on the SIM+VIF
features.
5 Conclusion
In this article, an assessment of the OPF classifier per-
formance to handle the task of lung disease diagnosis
in CT images was presented. In this evaluation, three
feature extraction methods and seven distance metric
functions were employed and compared.
In particular, the OPF classifier configured with the
Gaussian distance achieved very satisfactory accuracy
levels, both when applied on the features extracted us-
ing the GLCM method and on the ones extracted using
the SIM method. It can also be noted an accuracy gain
of 2.2% relatively to the results presented in [16] using

Automated Recognition of Lung Diseases in CT images based on the Optimum-Path Forest Classifier 13
the same experimental image dataset. Among the ex-
traction methods, SIM led to higher accuracies, mainly
when associated with the VIF metric and the proposed
Gaussian distance with the OPF classifier.
Based on the results obtained from the experiments
conducted, one can conclude that as to the COPD class,
the OPF and SVM classifiers with the features extracted
using the SIM and VIF methods were the most promis-
ing ones, without classification errors. Relatively to the
Fibrosis class, the OPF classifier with the Gaussian dis-
tance had no classification errors from the features ex-
tracted using the SIM method, neither from the features
extracted using the SIM method plus the ones using the
VIF method.
Relatively to the other traditional supervised learn-
ing algorithms studied here, namely, SVM and MLP,
the OPF classifier confirmed its classification suitabil-
ity, which was assessed in terms of accuracy, precision,
recall and F -measure, as well as its superior computa-
tional efficiency, being therefore a very promising tool
to identify pulmonary diseases from CT images.
Acknowledgements
The authors thank the Graduate Program in Computer
Science from the Federal Institute of Education, Science
and Technology of Ceara and the Department of Com-
puter Engineering from the Walter Cantıdio University
Hospital of the Federal University of Ceara, in Brazil,
for the support given.
The first author acknowledges the sponsorship from
the Federal Institute of Education, Science and Tech-
nology of Ceara through grants PROINFRA/2013 and
PROAPP/2014. The author acknowledges also the spon-
sorship from the Brazilian National Council for Re-
search and Development (CNPq).
Victor Hugo C. de Albuquerque thanks CNPq for
providing financial support through grants 470501/2013-
8 and 301928/2014-2.
Joao P. Papa is grateful to Sao Paulo Research Foun-
dation grants #2014/16250-9 and #2014/12236-1, as
well as CNPq grant #306166/2014-3.
Authors gratefully acknowledge the funding of Project
NORTE-01-0145-FEDER-000022 - SciTech - Science and
Technology for Competitive and Sustainable Industries,
cofinanced by “Programa Operacional Regional do Norte”
(NORTE2020), through “Fundo Europeu de Desenvolvi-
mento Regional” (FEDER).
Conflict of interest statement
The authors report no conflict of interest.
References
1. WHO. Causes of death in the world. Technical
report, World Health Organization, 2016.
2. Marcelo Alcantara Holanda, Ricardo Coelho
Reis, Georgia Freire Paiva Winkeler, Simone
Castelo Branco Fortaleza, Jose Wellington Oliveira
Lima, and Eanes Delgado Barros Pereira. Influ-
ence of total face, facial and nasal masks on short-
term adverse effects during noninvasive ventilation.
Jornal Brasileiro de Pneumologia, 35:164 – 173, 02
2009.
3. M. A. Holanda, A. C. Fortaleza, M. A. de Almeida,
G. F. Winkeler, R. C. Reis, J. H. Hebert, J. W.
Lima, and E. D. Pereira. Continuous positive air-
way pressure effects on regional lung aeration in pa-
tients with COPD: a high-resolution CT scan study.
Chest, 138(2):305–14, 2010.
4. Peter J Barnes. Immunology of asthma and chronic
obstructive pulmonary disease. Nature Reviews Im-
munology, 8(3):183–192, 2008.
5. WHO. Chronic obstructive pulmonary disease
(copd). Technical report, World Health Organiza-
tion, 2016.
6. R. de Marco, S. Accordini, I. Cerveri, A. Corsico,
J. Sunyer, F. Neukirch, N. Kunzly, B. Leynaert,
C. Janson, T. Gislason, P. Vermeire, C. Svanes,
J.M. Anto, and P. Burney. An international survey
of chronic obstrutive pulmonary disease in young
adults according to gold stages. Thorax, 59:120–
125, Julho 2004.
7. P. P. Reboucas Filho, P. C. Cortez, J. H. S. Felix,
Tarique da Silveira T. S. Cavalcante, and M. A.
Holanda. 3D segmentation and visualization of
lung and its structures using CT images of the tho-
rax. Journal of Biomedical Science and Engineer-
ing, pages 1099–1108, 2013.
8. P. P. Reboucas Filho, P. C. Cortez, J. H. S. Felix,
Tarique da Silveira T. S. Cavalcante, and M. A.
Holanda. Adaptive 2D crisp active contour model
applied to lung segmentation in CT images of the
thorax of healthy volunteers and patients with pul-
monary emphysema. Revista Brasileira de Engen-
haria Biomedica, pages 363–376, 2013.
9. E. Souza Reboucas, R. Moura Sarmento, and P. Pe-
drosa Reboucas Filho. 3D adaptive balloon active
contour: method of segmentation of structures in
three dimensions. IEEE Latin America Transac-
tions, 13(1):195–203, Jan 2015.
10. E. Cavalcanti Neto, P. Cesar Cortez, T. Silveira
Cavalcante, V. Enoc Rodrigues, P. Pedrosa Rebou-
cas Filho, and M. Alcantara Holanda. 3D lung fis-
sure segmentation in TC images based in textures.

14 Pedro P. Reboucas Filho et al.
IEEE Latin America Transactions, 14(1):254–258,
Jan 2016.
11. Tan Kok Liang, Toshiyuki Tanaka, Hidetoshi Naka-
mura, Toru Shirahata, and Hiroaki Sugiura. An
automated 3D emphysema extraction method us-
ing lung CT. SICE Annual Conference 2008, pages
3110–3114, August 2008.
12. Zhen Ma, J. M. R. S. Tavares, Renato Natal Jorge,
and T. Mascarenhas. A review of algorithms
for medical image segmentation and their applica-
tions to the female pelvic cavity. Computer Meth-
ods in Biomechanics and Biomedical Engineering,
13(2):235–246, 2010.
13. Pedro Pedrosa Reboucas Filho, Paulo Cesar
Cortez, Antonio C. da Silva Barros, Victor Hugo C.
Albuquerque, and Joao Manuel R. S. Tavares.
Novel and powerful 3D adaptive crisp active con-
tour method applied in the segmentation of CT
lung images. Medical Image Analysis, 35:503 – 516,
2017.
14. Zhen Ma, J. Manuel R. S. Tavares, and R. M. Natal
Jorge. A review on the current segmentation algo-
rithms for medical images. 1st International Con-
ference on Imaging Theory and Applications (IMA-
GAPP), 5(8):135–140, 2009.
15. R.M. Haralick, K. Shanmugam, and Its’Hak Din-
stein. Textural features for image classification.
IEEE Transactions on Systems, Man and Cyber-
netics, SMC-3(6):610–621, Nov 1973.
16. G. L. B. Ramalho, P. P. Reboucas Filho, Fatima
Nelsizeuma S. de Medeiros, and P. C. Cortez. Lung
disease detection using feature extraction and ex-
treme learning machine. Revista Brasileira de En-
genharia Biomedica, 30:363–376, 2014.
17. M. Costa Oliveira and J. Raniery Ferreira. A bag-
of-tasks approach to speed up the lung nodules re-
trieval in the bigdata age. In IEEE 15th Inter-
national Conference o e-Health Networking, Appli-
cations Services (Healthcom), pages 632–636, Oct
2013.
18. John Hebert Silva Felix, Paulo Cesar Cortez,
Pedro Pedrosa ReboucasFilho, Auzuir Ripardo
de Alexandria, Rodrigo Carvalho Sousa Costa, and
Marcelo Alcantara Holanda. Identification and
quantification of pulmonary emphysema through
pseudocolors. Lecture Notes in Computer Science,
5317:957–964, 2008.
19. H.R. Sheikh, A.C. Bovik, and G. de Veciana. An in-
formation fidelity criterion for image quality assess-
ment using natural scene statistics. IEEE Transac-
tions on Image Processing, 14(12):2117–2128, Dec
2005.
20. J. P. Papa, A. X. Falcao, and Celso T. N.
Suzuki. Supervised pattern classification based on
Optimum-Path Forest. International Journal of
Imaging Systems and Technology, 19(2):120–131,
2009.
21. J. P. Papa, V. H. C. Albuquerque, A. X. Falcao, and
J. M. R. S. Tavares. Efficient supervised Optimum-
Path Forest classification for large datasets. Pat-
tern Recognition, 45:512–520, 2012.
22. J. P. Papa, S. E. N. Fernandes, and A. X. Falcao.
Optimum-path forest based on k-connectivity: The-
ory and applications. Pattern Recognition Letters,
87:117–126, 2017.
23. Thiago M. Nunes, Andre L.V. Coelho,
Clodoaldo A.M. Lima, Joao P. Papa, and V. H. C.
Albuquerque. EEG signal classification for epilepsy
diagnosis via optimum path forest - a systematic
assessment. Neurocomputing, 136:103–123, 2014.
24. Eduardo Jose da S. Luz, Thiago M. Nunes, V. H. C.
Albuquerque, Joao P. Papa, and David Menotti.
ECG arrhythmia classification based on Optimum-
Path Forest. Expert Systems with Applications,
40(9):3561–3573, 2013.
25. C. Suzuki, J. Gomes, A. Falcao, J. P. Papa, and
S. Hoshino-Shimizu. Automatic segmentation and
classification of human intestinal parasites from mi-
croscopy images. IEEE Transactions on Biomedical
Engineering, 60(9):803–812, 2012.
26. FAbio A.M. Capabianco, Alexandre X. Falcao,
Clarissa L. Yasuda, and Jayaram K. Udupa. Brain
tissue MR-image segmentation via optimum-path
forest clustering. IEEE Transactions on Image Pro-
cessing, 116:1047–1059, 2012.
27. A. I. Iliev, M. S. Scordilis, J. P. Papa, and
A. X. Falcao. Spoken emotion recognition through
Optimum-path Forest classification using glottal
features. Computer Speech & Language, 24:445–
460, 2010.
28. J. P. Papa, A. X. Falcao, G. M. Freitas, and
A. M. H. Avila. Robust pruning of training patterns
for Optimum-Path Forest classification applied to
satellite-based rainfall occurrence estimation. IEEE
Geoscience and Remote Sensing Letters, 7(2):396–
400, 2010.
29. J. P. Papa, R. Y. M. Nakamura, V. H. C. Albu-
querque, A. X. Falcao, and J. M. R. S. Tavares.
Computer techniques towards the automatic char-
acterization of graphite particles in metallographic
images of industrial materials. Expert Systems with
Applications, 40:590—597, 2013.
30. C. C. O. Ramos, A. N. Souza, J. P. Papa, and A. X.
Falcao. A new approach for nontechnical losses
detection based on Optimum-Path Forest. IEEE

Automated Recognition of Lung Diseases in CT images based on the Optimum-Path Forest Classifier 15
Transactions on Power Systems, 26:181–189, 2011.
31. C. R. Pereira, R. Y. M. Nakamura, K. A. P. Costa,
and J. P. Papa. An Optimum-Path Forest frame-
work for intrusion detection in computer networks.
Engineering Applications of Artificial Intelligence,
25:1226–1234, 2012.
32. A. T. Silva, A. X. Falcao, and L. P. Magalhaes. Ac-
tive learning paradigms for CBIR systems based on
Optimum-path Forest classification. Pattern Recog-
nition, 44:2971–2978, 2011.
33. Thiago M. Nunes, V. H. C. Albuquerque, Jo ao
P. Papa, Cleiton C. Silva, Paulo G. Normando,
Elineudo P. Moura, and J. Manuel R. S. Tavares.
Automatic microstructural characterization and
classification using artificial intelligence techniques
on ultrasound signals. Expert Systems with Appli-
cations, 40:3096–3105, 2013.
34. Samuel L. Gomes, Elizangela de S. Reboucas, Ed-
son Cavalcanti Neto, Joao P. Papa, Victor H. C. de
Albuquerque, Pedro P. Reboucas Filho, and Joao
Manuel R. S. Tavares. Embedded real-time speed
limit sign recognition using image processing and
machine learning techniques. Neural Computing
and Applications, pages 1–12, 2016.
35. Edgard M. Silva, Leandro B. Marinho, Pedro P. Re-
boucas Filho, Joao P. Leite, Josinaldo P. Leite, Wal-
ter M. L. Fialho, Victor Hugo C. de Albuquerque,
and Joao Manuel R. S. Tavares. Classification of in-
duced magnetic field signals for the microstructural
characterization of sigma phase in duplex stainless
steels. Metals, 6(7):164, 2016.
36. Edson Cavalcanti Neto, Samuel Luz Gomes, Pedro
Pedrosa Reboucas Filho, and Victor Hugo C. de Al-
buquerque. Brazilian vehicle identification using a
new embedded plate recognition system. Measure-
ment, 70:36 – 46, 2015.
37. Victor Hugo C. de Albuquerque, Cleisson V. Bar-
bosa, Cleiton C. Silva, Elineudo P. Moura, Pedro
P. Reboucas Filho, Joao P. Papa, and Joao Manuel
R. S. Tavares. Ultrasonic sensor signals and opti-
mum path forest classifier for the microstructural
characterization of thermally-aged inconel 625 al-
loy. Sensors, 15(6):12474, 2015.
38. A.S. Iwashita, J.P. Papa, A.N. Souza, A.X. Falcao,
R.A. Lotufo, V.M. Oliveira, Victor Hugo C. de Al-
buquerque, and Joao Manuel R.S. Tavares. A path-
and label-cost propagation approach to speedup the
training of the optimum-path forest classifier. Pat-
tern Recognition Letters, 40:121 – 127, 2014.
39. Thiago M. Nunes, Andre L.V. Coelho,
Clodoaldo A.M. Lima, Joao P. Papa, and Victor
Hugo C. de Albuquerque. EEG signal classification
for epilepsy diagnosis via optimum path forest – a
systematic assessment. Neurocomputing, 136:103 –
123, 2014.
40. T. M. Nunes, V. H. C. Albuquerque, J. P. Papa,
C. S. Silva, P. G. Normando, E. P. Moura, and J. M.
R. S. Tavares. Automatic microstructural charac-
terization and classification using artificial intelli-
gence techniques on ultrasound signals. Expert Sys-
tems with Applications, 40(8):3096–3105, 2013.
41. Hjalmar K. Turesson, Sidarta Ribeiro, Danillo R.
Pereira, Joao P. Papa, and Victor Hugo C. de Al-
buquerque. Machine learning algorithms for au-
tomatic classification of marmoset vocalizations.
PLoS ONE, 11(9):1–14, 09 2016.
42. Victor Hugo C. de Albuquerque, Thiago M. Nunes,
Danillo R. Pereira, Eduardo Jose da S. Luz, David
Menotti, Joao P. Papa, and Joao Manuel R. S.
Tavares. Robust automated cardiac arrhythmia de-
tection in ECG beat signals. Neural Computing and
Applications, pages 1–15, 2016.
43. Eduardo Jose da S. Luz, Thiago M. Nunes, Victor
Hugo C. de Albuquerque, Joao P. Papa, and David
Menotti. ECG arrhythmia classification based on
optimum-path forest. Expert Systems with Appli-
cations, 40(9):3561 – 3573, 2013.
44. A. T. Silva, J. A. Santos, A.X. Falcao, R. S. Torres,
and L. P. Magalhaes. Incorporating multiple dis-
tance spaces in Optimum-Path Forest classification
to improve feedback-based learning. Computer Vi-
sion and Image Understanding, 116:510–523, 2012.
45. Auzuir Ripardo De Alexandria, Paulo Cesar
Cortez, Jessyca Almeida Bessa, John Hebert
da Silva Felix, Jose Sebastiao De Abreu, and Vic-
tor Hugo C De Albuquerque. psnakes: A new ra-
dial active contour model and its application in the
segmentation of the left ventricle from echocardio-
graphic images. Computer methods and programs
in biomedicine, 116(3):260–273, 2014.
46. Pedro Pedrosa Reboucas Filho, Paulo Cesar
Cortez, Antonio Carlos da Silva Barros, and Vic-
tor Hugo C De Albuquerque. Novel adaptive bal-
loon active contour method based on internal force
for image segmentation–a systematic evaluation on
synthetic and real images. Expert Systems with Ap-
plications, 41(17):7707–7721, 2014.
47. Francisco Diego Lima Moreira, Maurıcio Nunes
Kleinberg, Hemerson Furtado Arruda, Francisco
Nelio Costa Freitas, Marcelo Monteiro Valente Par-
ente, Victor Hugo Costa de Albuquerque, and Pe-
dro Pedrosa Reboucas Filho. A novel vickers hard-
ness measurement technique based on adaptive bal-
loon active contour method. Expert Systems with
Applications, 45:294–306, 2016.
16 Pedro P. Reboucas Filho et al.
48. Pedro Pedrosa Rebouc, Roger Moura Sarmento,
Paulo C Cortez, Victor Hugo C De, et al. Adaptive
crisp active contour method for segmentation and
reconstruction of 3d lung structures. International
Journal of Computer Applications, 111(4), 2015.
49. E. Cavalcanti Neto, P. C. Cortez, T. S. Cavalcante,
V. E. R. da Silva Filho, P. P. Reboouc Filho, and
M. A. Holanda. Supervised Enhancement Filter Ap-
plied to Fissure Detection, pages 337–340. Springer
International Publishing, Cham, 2015.
50. Murillo B. Rodrigues, Leandro B. Marinho, Raul
Victor M. Nobrega, Joao Wellington M. Souza, and
Pedro Pedrosa Reboucas Filho. Lung Segmentation
in Chest Computerized Tomography Images Using
the Border Following Algorithm, pages 539–548.
Springer International Publishing, Cham, 2017.
51. Igor Rafael S Valente, Paulo Cesar Cortez, Ed-
son Cavalcanti Neto, Jose Marques Soares, Vic-
tor Hugo C de Albuquerque, and Joao Manuel RS
Tavares. Automatic 3D pulmonary nodule detec-
tion in ct images: a survey. Computer methods and
programs in biomedicine, 124:91–107, 2016.
52. J. P. Papa, C. T. N. Suzuki, and A. X. Falcao. Li-
bOPF: A library for the design of Optimum-Path
Forest classifiers, 2009. Software version 2.0 avail-
able at http://www.ic.unicamp.br/~afalcao/
LibOPF.
53. J. H. S. Felix, P. C. Cortez, M. A. Holanda, and
R. C. S. Costa. Automatic segmentation and mea-
surement of the lungs in healthy persons and in pa-
tients with chronic obstructive pulmonary disease
in CT images. volume 18, pages 370–373, Margarita
Island, Venezuela, October 2007. IV Latin Ameri-
can Congress on Biomedical Engineering 2007, Bio-
engineering Solutions for Latin America Health.
54. John Heber S. Felix, P. C. Cortez, M. A. Holanda,
D. F. Colaco, V. H. C. Albuquerque, and A. R.
Alexandria. Lung and chest wall structures seg-
mentation in CT images. pages 291–294. Computa-
tional Vision and Medical Image Processing (VIP-
MAGE), Outubro 2007.
55. Pedro Pedrosa Reboucas Filho, Paulo Cesar
Cortez, and Marcelo Alcantara Holanda. Active
contour modes crisp: new technique for segmenta-
tion the lungs in CT images. Revista Brasileira de
Engenharia Biomedica, 27:259–272, 2011.
56. Geraldo L. Bezerra Ramalho, Daniel S. Ferreira,
Pedro P. Reboucas Filho, and Fatima N. Sombra
de Medeiros. Rotation-invariant feature extraction
using a structural co-occurrence matrix. Measure-
ment, 94:406 – 415, 2016.
57. Pedro P Reboucas Filho, Elizangela de S Reboucas,
Leandro B Marinho, Roger M Sarmento, Joao
Manuel RS Tavares, and Victor Hugo C de Albu-
querque. Analysis of human tissue densities: A new
approach to extract features from medical images.
Pattern Recognition Letters, 2017.
58. Ki-Young Choi and SS Kim. Morphological anal-
ysis and classification of types of surface corrosion
damage by digital image processing. Corrosion Sci-
ence, 47(1):1–15, 2005.
59. Fatima N S Medeiros, Geraldo L B Ramalho, Mar-
iana P Bento, and Luiz CL Medeiros. On the eval-
uation of texture and color features for nondestruc-
tive corrosion detection. EURASIP Journal on Ad-
vances in Signal Processing, 2010:7, 2010.
60. A. Ultsch. U * -matrix: a tool to visualize clusters
in high dimensional data. University of Marburg,
Department of Computer Science, (36):1–10, 2003.
61. J. P. Papa, A. X. Falcao, and C. T. N. Suzuki. Su-
pervised pattern classification based on optimum-
path forest. International Journal of Imaging Sys-
tems and Technology, 19(2):120–131, 2009.
62. A.X. Falcao, J. Stolfi, and R.A. Lotufo. The Image
Foresting Transform: Theory, Algorithms, and Ap-
plications. IEEE Transactions on Pattern Analysis
and Machine Intelligence, 26(1):19–29, 2004.
63. C. Allene, J.Y. Audibert, M. Couprie, J. Cousty,
and R. Keriven. Some links between min-cuts, op-
timal spanning forests and watersheds. In Proceed-
ings of the 8th International Symposium on Math-
ematical Morphology, pages 253–264, 2007.
64. H. Liu, S. Jiang, Q. Huang, and C. Xu W. Gao
region-based visual attention analysis with its ap-
plication in image browsing on small displays. In
Proceedings of the 15th international Conference on
Multimedia, pages 25–29, September 2007.
65. Dennis W Ruck, Steven K Rogers, Matthew
Kabrisky, Mark E Oxley, and Bruce W Suter. The
multilayer perceptron as an approximation to a
bayes optimal discriminant function. IEEE Trans-
actions on Neural Networks, 1(4):296–298, 1990.
66. S. Nissen. Implementation of a Fast Artificial Neu-
ral Network Library (FANN), 2003. Department
of Computer Science University of Copenhagen
(DIKU). Software available at http://leenissen.
dk/fann/.
67. Simon O Haykin. Neural Networks and Learning
Machines. Pearson Prentice Hall, 2008.
68. C. Cortes and V. Vapnik. Support vector networks.
Machine Learning, 20:273–297, 1995.
69. C. J. C. Burges. A tutorial on support vector ma-
chines for pattern recognition. Data Mining and
Knowledge Discovery, 2:121–167, 1998.
70. Chih-Chung Chang and Chih-Jen Lin. Libsvm: A
library for support vector machines. ACM Trans.

Automated Recognition of Lung Diseases in CT images based on the Optimum-Path Forest Classifier 17
Intell. Syst. Technol., 2(3):27:1–27:27, May 2011.
71. Sidney Siegel. Estatıstica nao-parametrica para
as ciencias do comportamento. Serie Metodos de
Pesquisa. Artmed, Porto Alegre, RS, 2 edition, 7
2006.
72. Mario F Triola et al. Introducao a estatıstica, vol-
ume 10. LTC, Rio de Janeiro, RJ, 2005.