automated three-dimensional choroidal vessel segmentation
TRANSCRIPT
Automated three-dimensional choroidal vessel segmentation of 3D 1060 nm OCT retinal data
Vedran Kajić,1,* Marieh Esmaeelpour,2,1 Carl Glittenberg,2 Martin F. Kraus,3 Joachim Honegger,3 Richu Othara,1 Susanne Binder,2 James G. Fujimoto,4 and
Wolfgang Drexler1 1Center for Medical Physics and Biomedical Engineering, Medical University Vienna, General Hospital Vienna 4L,
Waehringer Guertel 18-20, A-1090 Vienna, Austria 2Ludwig Boltzmann Institute of Retinology and Biomicroscopic Laser Surgery, Department of Ophthalmology,
Rudolf Foundation Clinic, Vienna, Austria 3Pattern Recognition Lab and School of Advanced Optical Technologies (SAOT), University Erlangen-Nuremberg,
Erlangen, Germany 4Department of Electrical Engineering and Computer Science, MIT, Cambridge, MA, USA
Abstract: A fully automated, robust vessel segmentation algorithm has been developed for choroidal OCT, employing multiscale 3D edge filtering and projection of “probability cones” to determine the vessel “core”, even in the tomograms with low signal-to-noise ratio (SNR). Based on the ideal vessel response after registration and multiscale filtering, with computed depth related SNR, the vessel core estimate is dilated to quantify the full vessel diameter. As a consequence, various statistics can be computed using the 3D choroidal vessel information, such as ratios of inner (smaller) to outer (larger) choroidal vessels or the absolute/relative volume of choroid vessels. Choroidal vessel quantification can be displayed in various forms, focused and averaged within a special region of interest, or analyzed as the function of image depth. In this way, the proposed algorithm enables unique visualization of choroidal watershed zones, as well as the vessel size reduction when investigating the choroid from the sclera towards the retinal pigment epithelium (RPE). To the best of our knowledge, this is the first time that an automatic choroidal vessel segmentation algorithm is successfully applied to 1060 nm 3D OCT of healthy and diseased eyes. © 2012 Optical Society of America OCIS codes: (170.4500) Optical coherence tomography; (100.0100) Image processing; (100.3008) Image recognition, algorithms and filters; (170.4580) Optical diagnostics for medicine.
References and links 1. M. Esmaeelpour, B. Povazay, B. Hermann, B. Hofer, V. Kajic, K. Kapoor, N. J. Sheen, R. V. North, and W.
Drexler, “Three-dimensional 1060-nm OCT: choroidal thickness maps in normal subjects and improved posterior segment visualization in cataract patients,” Invest. Ophthalmol. Vis. Sci. 51(10), 5260–5266 (2010).
2. R. Margolis and R. F. Spaide, “A pilot study of enhanced depth imaging optical coherence tomography of the choroid in normal eyes,” Am. J. Ophthalmol. 147(5), 811–815 (2009).
3. W. R. Green and S. N. Key 3rd, “Senile macular degeneration: a histopathologic study,” Trans. Am. Ophthalmol. Soc. 75, 180–254 (1977).
4. D. S. McLeod and G. A. Lutty, “High-resolution histologic analysis of the human choroidal vasculature,” Invest. Ophthalmol. Vis. Sci. 35(11), 3799–3811 (1994).
5. S. H. Sarks, “Ageing and degeneration in the macular region: a clinico-pathological study,” Br. J. Ophthalmol. 60(5), 324–341 (1976).
6. Z. Q. Yin, T. J. Vaegan, T. J. Millar, P. Beaumont, and S. Sarks, “Widespread choroidal insufficiency in primary open-angle glaucoma,” J. Glaucoma 6(1), 23–32 (1997).
7. W. Drexler and J. G. Fujimoto, Optical Coherence Tomography: Technology and Applications (Springer, 2008), Vol. 1.
8. R. M. Rangayyan, F. J. Ayres, F. Oloumi, F. Oloumi, and P. Eshghzadeh-Zanjani, “Detection of blood vessels in the retina with multiscale Gabor filters,” J. Electron. Imaging 17(2), 023018 (2008).
9. W. P. Zhou, W. X. Yu, and H. Z. Shu, “Detection of cerebral vessels in MRA based on 3D steerable filters,” Tien Tzu Hsueh PaoActa Electronica Sinica 34, 1333–1336 (2006).
(C) 2012 OSA 1 January 2013 / Vol. 4, No. 1 / BIOMEDICAL OPTICS EXPRESS 134#177528 - $15.00 USD Received 5 Oct 2012; revised 13 Dec 2012; accepted 15 Dec 2012; published 17 Dec 2012

10. S. Aylward, S. Pizer, D. Eberly, and E. Bullitt, “Intensity ridge and widths for tubular object segmentation and description,” in Proceedings of the Workshop on Mathematical Methods in Biomedical Image Analysis, 1996 (IEEE Computer Society, 1996), pp. 131–138.
11. P. J. Yim, P. L. Choyke, and R. M. Summers, “Gray-scale skeletonization of small vessels in magnetic resonance angiography,” IEEE Trans. Med. Imaging 19(6), 568–576 (2000).
12. N.-Y. Lee, “Automatic generation of 3D vessels model using vessels image matching based on adaptive control points,” in Sixth International Conference on Advanced Language Processing and Web Information Technology, 2007. ALPIT 2007 (2007).
13. V. Prinet, O. Monaga, C. Ge, S. L. Xie, and S. D. Ma, “Thin network extraction in 3D images: application to medical angiograms,” in Proceedings of the 13th International Conference on Pattern Recognition, 1996 (IEEE Computer Society, 1996), Vol. 3, pp. 386–390.
14. R. Nekovei and Y. Sun, “Back-propagation network and its configuration for blood vessel detection in angiograms,” IEEE Trans. Neural Netw. 6(1), 64–72 (1995).
15. A. Chung and J. Noble, “Statistical 3D Vessel segmentation using a rician distribution,” in Medical Image Computing and Computer-Assisted Intervention—MICCAI’99, (Springer, 1999), pp. 82–89.
16. K. Krissian, G. Malandain, N. Ayache, R. Vaillant, and Y. Trousset, “Model-Based Multiscale Detection of 3D Vessels,” in Workshop on Biomedical Image Analysis (1998), pp. 202–208.
17. J. A. Tyrrell, E. di Tomaso, D. Fuja, R. Tong, K. Kozak, R. K. Jain, and B. Roysam, “Robust 3-D modeling of vasculature imagery using superellipsoids,” IEEE Trans. Med. Imaging 26(2), 223–237 (2007).
18. C. Kirbas and F. Quek, “A review of vessel extraction techniques and algorithms,” ACM Comput. Surv. 36(2), 81–121 (2004).
19. B. Povazay, B. Hermann, B. Hofer, V. Kajić, E. Simpson, T. Bridgford, and W. Drexler, “Wide-field optical coherence tomography of the choroid in vivo,” Invest. Ophthalmol. Vis. Sci. 50(4), 1856–1863 (2009).
20. ABSoft, ” Neat Video—best noise reduction for digital video.” 21. P. Thevenaz and M. Unser, “A pyramid approach to sub-pixel image fusion based on mutual information,” in
International Conference on Image Processing, 1996. Proceedings (1996), Vol. 1, pp. 265–268. 22. M. F. Kraus, B. Potsaid, M. A. Mayer, R. Bock, B. Baumann, J. J. Liu, J. Hornegger, and J. G. Fujimoto,
“Motion correction in optical coherence tomography volumes on a per A-scan basis using orthogonal scan patterns,” Biomed. Opt. Express 3(6), 1182–1199 (2012).
23. V. Kajić, M. Esmaeelpour, B. Považay, D. Marshall, P. L. Rosin, and W. Drexler, “Automated choroidal segmentation of 1060 nm OCT in healthy and pathologic eyes using a statistical model,” Biomed. Opt. Express 3(1), 86–103 (2012).
24. T. A. Chowdhury, O. Ghita, and P. F. Whelan, “Evaluation of 3D gradient filters for estimation of the surface orientation in CTC,” in IMVIP 2006—10th International Machine Vision and Image Processing Conference (2006), paper 4645.
25. M. Esmaeelpour, B. Povazay, B. Hermann, B. Hofer, V. Kajic, S. Hale, R. V. North, W. Drexler, and N. J. Sheen, “Mapping choroidal and retinal thickness variation in type 2 diabetes using three-dimensional 1060-nm optical coherence tomography,” Invest. Ophthalmol. Vis. Sci. 52(8), 5311–5316 (2011).
26. R. F. Spaide, “Age-related choroidal atrophy,” Am. J. Ophthalmol. 147(5), 801–810 (2009).
1. Introduction
Retinal pathologies are a major health concern in the industrialized world. While previously, significant research effort has been invested to explore and analyze the outer retinal layers, little attention has been devoted to non-invasive imaging and analysis of the choroid in-vivo. The choroid is the layer between the sclera and retinal pigment epithelium (RPE), which contains vessels and connecting tissue providing oxygen and nourishment to the upper layers. The choroid is composed of Haller’s layer containing larger vessels, Sattler’s layer containing medium and small vessels, followed by the choriocapillaris, a fine, thin level of capillaries. Just underneath the RPE is Bruch’s membrane. Choroidal thickness is related to age and axial eye length [1,2] but also seems to have a strong relation to pathologies. It can reveal an increase that correlates with a higher density of vessels in the superficial choroidal layers in atrophy of the choroidal capillary structure, open-angle glaucoma and neovascularization in the choriocapillaris [3–6]. It can be assumed that the choroidal vasculature changes as well, though due to the difficulty of visualizing it in-vivo, the type of change is still largely unknown. A reliable vessel segmentation algorithm would enable numerous avenues for further clinical research.
While angiography has been previously used to visualize the choroidal vasculature, it is an invasive method that requires injecting an intravenous contrast agent into the patient, making it potentially dangerous and uncomfortable. Long wavelength optical coherence tomography (OCT) [7] enables sub-surface, three-dimensional (3D) in-vivo imaging of the choroid. A high resolution 3D data volume can typically be obtained in a few seconds.
(C) 2012 OSA 1 January 2013 / Vol. 4, No. 1 / BIOMEDICAL OPTICS EXPRESS 135#177528 - $15.00 USD Received 5 Oct 2012; revised 13 Dec 2012; accepted 15 Dec 2012; published 17 Dec 2012
The low contrast and signal to noise ratio (SNR) of OCT tomograms within the choroid presents a significant challenge to vessel segmentation algorithms. To the best of the authors’ knowledge, to date no 3D vessel segmentation method has been published that automatically segments and qualifies choroidal vasculature from OCT tomograms. Methods developed and applied to vessel segmentation of MRI, CT and other types of data will be discussed. These algorithms rely on relatively high contrast, while usually trying to achieve very high accuracy.
A straightforward approach is to use some form of edge filtering to find the vessel walls directly. Gabor filters for vessel wall detection have been used [8], as well as 3D dyadic B-spline wavelets [9]. However, these methods do not perform well if the vessel walls are not well defined. A ridge based approach uses data intensity represented as ridges, that can be traversed to form a vessel tree [10]. The drawback of the aforementioned approach is the need for seed points, requiring manual intervention. Unclear vessel boundaries would present another problem for these approaches. Region growing methods also rely on seed points [11] and there is a possibility of segmentation leaks. An alternative is to use moving control points [12], however, the algorithm can go off track if presented with noisy data. Deformable model based algorithms, such as snakes, converge slowly and often unreliably and also require some form of initialization.
Differential geometry represents data amplitude as an extra dimension, embedding 2D data as a surface and 3D data as a 4D hypersurface. Local maxima of principal curvatures are likely candidates for vessel centers, however results were limited to data with high SNR [13].
Artificial intelligence and neural network based methods require difficult to obtain training sets. Additionally, pixel based classification algorithms [14], would have difficulty segmenting choroidal vessels based on texture features only. Because OCT background is hard to distinguish from the vessels, Rician distribution background modeling approach [15] encounters the same problem.
Parametric models are the most promising approach, especially if based on multiscale detection. Vessels can be located by estimating the Hessian matrix, interpreting the data according to a cylindrical or other model [16]. Eigenvectors obtained using the model give vessel orientation, however the method can be susceptible to outliers. The data presented had high contrast and even with simple thresholding produced not as accurate, but reasonable results, which is not true for the OCT choroidal data. An elliptical fitting model [17] produced good results in data with relatively highly contrasted vessels compared to the OCT choroidal data. The data stack size used in the aforementioned paper was far smaller, due to the complex computational procedure it is questionable how the algorithm would scale up. A thorough review of vessel segmentation techniques, with more than a hundred algorithms included, covers many more methods similar to the ones mentioned [18].
For 3D choroidal vessel quantification, a vessel segmentation algorithm is required that scales well with highly noisy data. All of the aforementioned methods require relatively high contrast and rely on various initializations, sequential tracking steps and/or require manual intervention of the operator which is extremely time costly and limited in the case of 3D data by human 2D vision (true 3D data can only be perceived as a 2D projection). The proposed method uses simple multiscale filtering followed by probability estimation of vessel cores to determine the plausible solutions in a low signal, noisy environment.
2. Materials and methods
High-speed 3D OCT-imaging at 1060 nm was performed with less than 2.5 mW at the cornea, within safe power limits for a 10-second exposure [19]. Three-dimensional OCT volumes were acquired with 15 to 20 µm transverse resolution, approximately 7 µm axial resolution in the tissue, and interpolated to 1024 voxels per depth scan (A-scan). The beam scans across a 36° by 36° field producing 512 by 512 A-scans at 56,000 A-scans/s centered on the fovea (110 B-scans/s, total acquisition time 4.7s per volume). The spectrometer utilized a line camera with 1024 px (Goodrich SU-LDH2).
The OCT volume was averaged in both transverse directions within a field of approximately 1°, to remove speckle. The “Neat Video” plugin for denoising is applied to the
(C) 2012 OSA 1 January 2013 / Vol. 4, No. 1 / BIOMEDICAL OPTICS EXPRESS 136#177528 - $15.00 USD Received 5 Oct 2012; revised 13 Dec 2012; accepted 15 Dec 2012; published 17 Dec 2012

data, applying adaptive noise reduction based on the background profile to reduce speckle [20]. For stack registration ImageJ software was used [21] in case that the input stack was produced by a standard single raster scan. To improve the signal to noise ratio (SNR), some data sets were acquired using orthogonal scan pattern. Two 3D volumes of OCT data were acquired with horizontal and vertical raster scans respectively. The two orthogonal volumes were used to estimate retinal motion by associating a displacement field with each volume and calculating the displacements, while optimizing similarity and penalizing motion. This registration method corrects the 3D OCT data for motion on a per A-scan basis. The two motion corrected 3D OCT data sets are then merged to create a motion corrected 3D data set with improved SNR [22].
Choroid was defined as the area between the RPE/Bruch’s membrane/choriocapillaris (RBC) complex and the choroidal–sclera interface (CSI), which is found using our previously published algorithm [23]. Although it is not necessary to find the choroid before performing the vessel segmentation (i.e. treating the whole volume as a region of interest), it allows for the removal of vessel, drusen and similar structures that might be found outside of the choroidal area.
The algorithm was tested on healthy eyes and eyes with various retinal pathologies including wet and dry age-related macular degeneration (AMD). Testing of the segmentation algorithm was performed in different clinical cases that are often accompanied by low SNR in deep choroidal structures, combined with various contrast changes and shadowing artifacts. The results are meant to show the technical ability of the algorithm, rather than to draw direct, clinical conclusions.
2.1. Segmentation algorithm overview
The basic idea of the algorithm is to perform multiscale edge filtering and to obtain a surface normal for each voxel. Irrespective of the strength of an edge, from each voxel a probability cone can be projected, increasing a counter for each voxel in the path by one, signifying the likely position of the vessel core. Utilizing this approach, the sensitivity to poorly defined vessel walls is eliminated. The concept is illustrated in Fig. 1. The data are downsampled axially to match the correct physical aspect ratio, as it is important that the vessels are approximately circular. Depending on the cross-section plane used for visualization, some vessels appear to have a profile significantly different from circular, but that is irrelevant to the algorithm which operates in 3D.
Fig. 1. Projected probability cones mark the likely position of the vessel core. The actual algorithm operates fully in 3D, the concept is presented in 2D. Notice the high probability where the cones intersect.
(C) 2012 OSA 1 January 2013 / Vol. 4, No. 1 / BIOMEDICAL OPTICS EXPRESS 137#177528 - $15.00 USD Received 5 Oct 2012; revised 13 Dec 2012; accepted 15 Dec 2012; published 17 Dec 2012

The algorithm overview is shown in Fig. 2. For each scale, edge filtering and cone projection procedure is performed.
Fig. 2. Algorithm overview: the data passes through the pre-processing block, giving the choroidal boundary, before being decomposed into multiscale representation and filtered independently to locate vessel estimates. Subsequently, all the estimates are combined to obtain the full vasculature.
2.2. Multiscale edge filtering
We apply multiscale filtering using the kernel [−1 −2 0 2 1], a 1D version of a planar kernel as described in [24]. The kernel satisfies standard coefficient conditions, where d is a kernel element, and k is the iterator:
0,
0.
N
kk N
N
kk N
d
d k
=−
=−
=
=
∑
∑ (1)
The filtering is performed for all three directions (x, y, z), each filtering operation giving one vector component, thus producing a normal vector for each voxel. We have used four scales, spaced so that they do not overlap in the vessel detection (downsampling by a factor of 1, 2, 3, and 4). The last scale could detect the largest choroidal vessels. The cone ray length was set to four for all scales, effectively giving larger cones in higher scales, enabling detection of larger vessels.
2.3. Vessel estimation
An ideal probability profile, for the cone projection of an infinite range is
2 1 2
1
2
8 tan( ) ,360
sin( )arcsin ,
sin( ) sin( )( arcsin ) arcsin .
A r
rx
r rx x
γ γα
αγ α
α αγ α α
+= Π
= +
= Π − Π − + = −
(2)
(C) 2012 OSA 1 January 2013 / Vol. 4, No. 1 / BIOMEDICAL OPTICS EXPRESS 138#177528 - $15.00 USD Received 5 Oct 2012; revised 13 Dec 2012; accepted 15 Dec 2012; published 17 Dec 2012

Illustrated in Fig. 3 is how the probability profile A can be obtained using trigonometry. r is the circle/vessel radius, α is the half cone width (set to 12.5 degrees). The profile A is actually obtained on a cylindrical segment, which is how the 2rtan(α) factor is obtained. We can imagine that for any given x, two components will contribute; the first for angles from 0 to γ1 and the second from γ2 to π. That must be multiplied by two due to the same effect occurring on the bottom side.
Fig. 3. The two contributing factors to the probability profile, that will cover at least the distance x or longer
Fig. 4. An ideal vessel profile, with the vessel core marked in red, and the probability profile below in blue.
(C) 2012 OSA 1 January 2013 / Vol. 4, No. 1 / BIOMEDICAL OPTICS EXPRESS 139#177528 - $15.00 USD Received 5 Oct 2012; revised 13 Dec 2012; accepted 15 Dec 2012; published 17 Dec 2012

This type of profile (Fig. 4) enables us to effectively threshold the filtered data by using a value set to roughly a half of the ideal profile plateau (roughly −1.8 to 1.8, Fig. 4) for a certain scale. This will produce a very close estimate of the vessel core, almost independent of the variation due to noise, because of the steep edge of the profile. Also, large differences in the height of the profile plateau between the scales, allow for an effective scale separation, enabling reliable detection of vessels of all sizes.
While most of the code was implemented in MATLAB, the cone projection algorithm itself was written in C and linked with the rest of the code as a mex file. Due to iterating through each voxel of the stack and projecting a cone for that iteration, such an implementation in MATLAB would require unreasonable amounts of execution time.
An alternative to using the multiscale approach would be to use a longer range cone in one scale, and then use an accumulation (counting) array per each voxel of all the contributing cones. After thresholding, a skeleton (a thin version of the shape equidistant to its boundaries) could be computed. For each skeleton voxel, the approximate vessel radius could be then obtained as
2
( )arg max ( ).4 tan( )r
num rr αΠ
(3)
num(r) means the number of elements in the accumulation array with the value r, while the denominator is the normalization term. As a whole, we want to find the r for which there was the largest contribution of cones, meaning that that r is probably significant due to a vessel wall.
However, we have found the multiscale method to give better results, and executes faster. The final addition to the algorithm was an SNR dependent thresholding. In some cases, due to extremely low signal deep in the choroid (Fig. 5), we found that the threshold values could be too high. For this reason we obtain a depth related SNR for all the data, computed on groups of voxels equidistant to the RPE. For low SNR the thresholding values must be reduced to compensate for poorly defined vessels, despite the steep edge of the probability profile.
Fig. 5. 1060 nm OCT scan of a healthy eye with a deep choroid that presents a vessel segmentation challenge (top). The depth related SNR is computed and is used to adjust the thresholding parameters (bottom).
1
1 mm
(C) 2012 OSA 1 January 2013 / Vol. 4, No. 1 / BIOMEDICAL OPTICS EXPRESS 140#177528 - $15.00 USD Received 5 Oct 2012; revised 13 Dec 2012; accepted 15 Dec 2012; published 17 Dec 2012

3. Results and discussion
There is a wide variety of data that have to be processed reliably. First, we can demonstrate that a single standard OCT scan (Fig. 5), as well as a motion corrected merged OCT volume with increased SNR [22] (Fig. 6), give similar results, with an 8% classification difference (expressed as the number of voxels differently classified relative to the total number of voxels). The motion corrected, merged volume (Fig. 7) has improved visibility of choroidal features because of increased SNR and speckle averaging.
Fig. 6. A cross-sectional 1060 nm OCT tomogram of a healthy eye, using a single scan (top). The same tomogram is shown with choroidal vessel segmentation (bottom).
Fig. 7. The same tomogram obtained by performing a double orthogonal scan and merging the data after registration (top), with choroidal vessel segmentation displayed (bottom).
Figure 8 is interesting because it shows that there are also smaller vessels deep in the choroid, visible due to good SNR, despite the usual trend for larger vessels to dominate in the Haller’s layer. It is also possible to locate the perforating vessels below the sclera.
1
1 mm
1
1 mm
(C) 2012 OSA 1 January 2013 / Vol. 4, No. 1 / BIOMEDICAL OPTICS EXPRESS 141#177528 - $15.00 USD Received 5 Oct 2012; revised 13 Dec 2012; accepted 15 Dec 2012; published 17 Dec 2012

Fig. 8. A tomogram from a healthy eye with good SNR, using double scan (top, Media 1), with choroidal vessel segmentation overlaid (bottom, Media 2). Sub-chorio-scleral junction vessels are also detected.
Figure 9 shows a thick healthy choroid. Despite low SNR in the tomogram, all major vessels are detected by the algorithm.
Fig. 9. A tomogram from a healthy eye with deep choroid, using double scan (top, Media 3), with choroidal vessel segmentation overlaid (bottom, Media 4). Vessels close to the sclera are also detected, despite low SNR.
Figure 10 shows data from a patient with wet AMD, an example of posterior eye pathology. Even with strong shadowing produced by the RPE detachment, the algorithm still detects vessels in the choroidal region below the lesion and next to it.
In Fig. 11 it can be seen that very challenging data can be segmented as well. Not only is the choroid very thin with small vasculature and rapid contrast changes due to RPE atrophy, but the image is also grainy.
1
1 mm
1
1 mm
(C) 2012 OSA 1 January 2013 / Vol. 4, No. 1 / BIOMEDICAL OPTICS EXPRESS 142#177528 - $15.00 USD Received 5 Oct 2012; revised 13 Dec 2012; accepted 15 Dec 2012; published 17 Dec 2012

Fig. 10. A tomogram from a patient with wet AMD, using double scan (top, Media 5), with choroidal vessel segmentation overlaid (bottom, Media 6). Vessels are detected even below the RPE detachment.
Fig. 11. Tomograms from a patient with dry AMD, using double scan (top, Media 7), with choroidal vessel segmentation overlaid (bottom, Media 8). Vessels are detected despite significant contrast changes and grainy artifacts.
Useful statistics revealing quantitative, morphological detail of the healthy and diseased choroid can be obtained by using simple measures, such as extracting the number of outer (vessel walls) and inner vessel pixels. These numbers are related to the distribution of the large and small choroidal vessels. Figure 12 and Fig. 13 show that the ratio of inner to outer pixels, corresponding to the relative proportion of larger vessels, decreases from the sclera towards the RPE.
In Fig. 14 the same inner and outer pixel ratio can be calculated by aggregating values in the axial direction, giving an intuitive 2D projection.
Figure 15 shows 3D rendering of a good contrast, normal choroid. In subfigures with choroid flattened according to sclera, the depth is color coded, from red to blue.
1
1 mm
1
1 mm
(C) 2012 OSA 1 January 2013 / Vol. 4, No. 1 / BIOMEDICAL OPTICS EXPRESS 143#177528 - $15.00 USD Received 5 Oct 2012; revised 13 Dec 2012; accepted 15 Dec 2012; published 17 Dec 2012

Fig. 12. Inner to outer pixel ratio, corresponding to the proportion of larger vessels, from sclera towards the RPE in a healthy subject with good SNR data (Fig. 8, Fig. 15)
Fig. 13. Inner to outer pixel ratio, corresponding to the proportion of larger vessels, from sclera towards the RPE in a patient with wet AMD (Fig. 10, Fig. 17).
(C) 2012 OSA 1 January 2013 / Vol. 4, No. 1 / BIOMEDICAL OPTICS EXPRESS 144#177528 - $15.00 USD Received 5 Oct 2012; revised 13 Dec 2012; accepted 15 Dec 2012; published 17 Dec 2012

Fig. 14. Healthy eye (subfigures (a), (c), (e)) and a wet AMD (subfigures (b), (d), (f)). (a) and (b) is the ratio of inner pixels and total choroid thickness, (c) and (d) is the ratio of inner pixels
and total vessel pixels, (e) and (f) is the ratio of outer pixels and total choroid thickness.
(a) (b)
(c)
(e) (f)
(d)
1mm
1mm
(C) 2012 OSA 1 January 2013 / Vol. 4, No. 1 / BIOMEDICAL OPTICS EXPRESS 145#177528 - $15.00 USD Received 5 Oct 2012; revised 13 Dec 2012; accepted 15 Dec 2012; published 17 Dec 2012

Fig. 15. A normal eye with good SNR (Fig. 8). Subfigure (a) shows the overlay (Media 9), (b) is a deep cross cut, in (c) the watershed zone can be distinguished (Media 10). The axes show
the relative dimensions ratio. The ON label points to the optic nerve
(a)
(b)
(c)
ON
ON
(C) 2012 OSA 1 January 2013 / Vol. 4, No. 1 / BIOMEDICAL OPTICS EXPRESS 146#177528 - $15.00 USD Received 5 Oct 2012; revised 13 Dec 2012; accepted 15 Dec 2012; published 17 Dec 2012

Fig. 16. A healthy thick choroid (Fig. 9). Subfigure (a) shows the overlay (Media 11), (b) is a surface cross cut, showing the mostly vertical growth of smaller vessels (Media 12). The ON label points to the optic nerve
Figure 16 shows a thick healthy choroid, with an intricate vasculature, especially in Sattler’s layer. In Fig. 17 a wet AMD is shown, with some disruption in the vasculature of Haller’s layer (not many vessels in the central region), underneath the RPE detachment. It is difficult to tell whether this observation corresponds entirely to the biological changes in the tissue, or whether it might be a result of low SNR in the region below the detachment, due to hyper-reflectivity of the RPE.
Figure 18 shows a case of dry AMD. The choroidal vasculature is thin and of low density, while there seems to be an increase in the volume of connective tissue.
(a)
(b)
ON
(C) 2012 OSA 1 January 2013 / Vol. 4, No. 1 / BIOMEDICAL OPTICS EXPRESS 147#177528 - $15.00 USD Received 5 Oct 2012; revised 13 Dec 2012; accepted 15 Dec 2012; published 17 Dec 2012
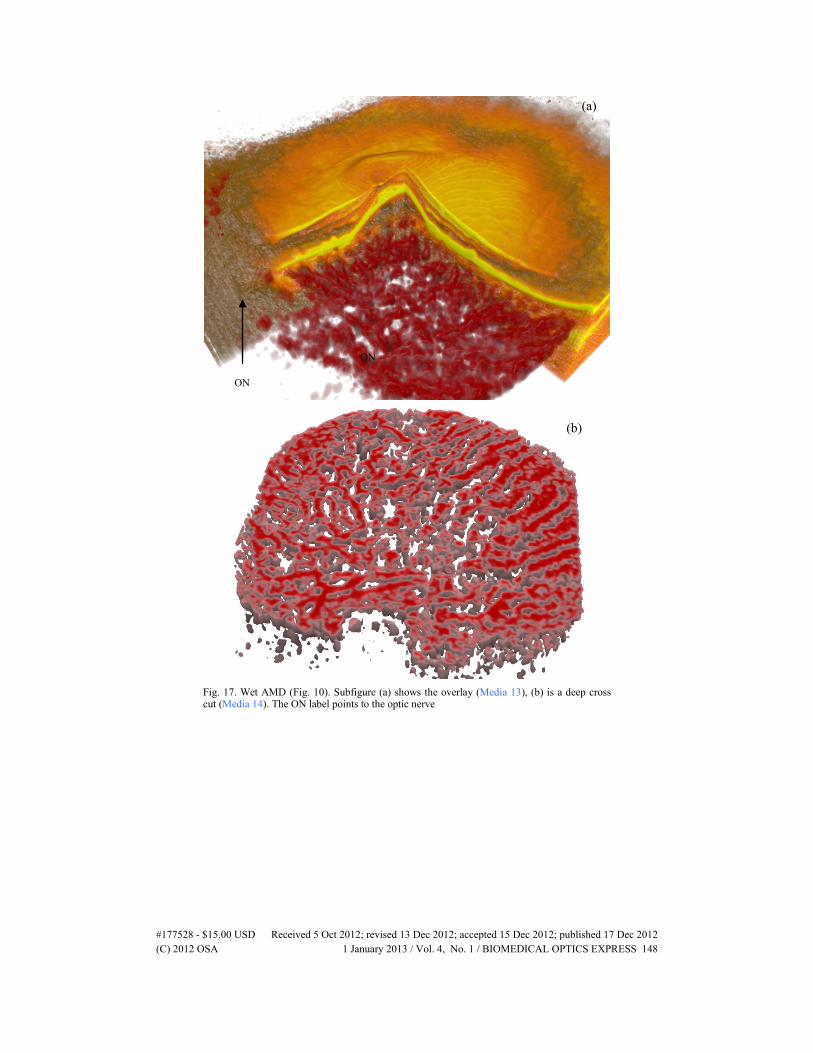
Fig. 17. Wet AMD (Fig. 10). Subfigure (a) shows the overlay (Media 13), (b) is a deep cross cut (Media 14). The ON label points to the optic nerve
(a)
(b)
ON
ON
(C) 2012 OSA 1 January 2013 / Vol. 4, No. 1 / BIOMEDICAL OPTICS EXPRESS 148#177528 - $15.00 USD Received 5 Oct 2012; revised 13 Dec 2012; accepted 15 Dec 2012; published 17 Dec 2012

Fig. 18. Dry AMD (Fig. 11). Subfigure (a) shows the overlay (Media 15), (b) is a deep cross cut, (c) shows that there are hardly any smaller vessels in the upper choroid (Media 16). The ON label points to the optic nerve
(a)
(b)
(c)
ON
(C) 2012 OSA 1 January 2013 / Vol. 4, No. 1 / BIOMEDICAL OPTICS EXPRESS 149#177528 - $15.00 USD Received 5 Oct 2012; revised 13 Dec 2012; accepted 15 Dec 2012; published 17 Dec 2012

4. Conclusion
We have developed and demonstrated an algorithm for automatic vessel segmentation of the choroid based on vessel “core” multiscale probability filtering. The novel algorithm performs well on data from healthy subjects and patients with retinal pathologies, containing artifacts, and extremely low signal due to shadows and depth. The choroidal thickness correlates negatively with axial length and age. Statistical data such as the ratio between vessels and non-vessels tissue, the ratio between small and large vessels and visualization of the large to small vessel distribution can be used to understand choroidal physiological structure, its changes with age and axial length and differentiate pathological from healthy variation. The choroid is involved in the pathogenesis of some diseases such as AMD and its associated buildup of drusen is a risk factor. In addition, despite numerous treatment modalities for advanced AMD, improvement of vision and a halt to the disease is not always achieved and continuous retreatment is often necessary. For clinical application, this information needs to be investigated for its ability to predict predispositions or success of treatment in diseases that involve the choroid [25] and have been shown to cause choroidal atrophy [26] or choroidal neovascularization.
The run time on an average desktop machine (2 GHz, 8 GB RAM) per stack (512 x 512 x 150) is about 5 to 10 minutes which can be further reduced by a more efficient implementation, or a GPU based solution. The proposed method is not only valuable for choroidal vessel segmentation, but can find use in any type of vessel segmentation when the data signal is weak and the standard approaches may fail.
Acknowledgments
This research was supported in part by Medical University Vienna, Macular Vision Research Foundation (MVRF, USA), European Union project FUN OCT (FP7 HEALTH, contract no. 201880), FWF-NFN ‘Photoacoustic imaging in biology and Medicine’, OENB Jubiläumsfondsprojekt (14294), CARL ZEISS Meditec Inc., Femtolasers GmbH and the Christian Doppler Society (Christian Doppler Laboratory 'Laser development and their application in medicine'). We acknowledge support from the National Institutes of Health (R01-EY011289-26, R01-EY013178-12, R01-EY013516-09, R01-CA075289-15, R01-NS057476-05, R01-HL095717-04) and the Air Force Office for Scientific Research (FA9550-10-1-0551 and FA9550-10-1-0063). The authors also gratefully acknowledge funding of the Erlangen Graduate School in Advanced Optical Technologies (SAOT) by the German Research Foundation (DFG) in the framework of the German excellence initiative.
(C) 2012 OSA 1 January 2013 / Vol. 4, No. 1 / BIOMEDICAL OPTICS EXPRESS 150#177528 - $15.00 USD Received 5 Oct 2012; revised 13 Dec 2012; accepted 15 Dec 2012; published 17 Dec 2012