automatic geo-referencing mobile laser scanning data … · automatic geo-referencing mobile laser...
TRANSCRIPT

Automatic Geo-referencing Mobile Laser Scanning Data to UAV images
Yunlong Gao a, Xianfeng Huang a,*, Fan Zhanga, Zhengwen Fu a, Chong Yang a
a LIESMARS, Wuhan University, China - [email protected]; [email protected];
[email protected]; [email protected]; [email protected]
3rd International Conference on Unmanned Aerial Vehicles in Geomatics 30 August-02 September 2015, York University, Canadian
KEY WORDS: Mobile Laser Scanning; UAV images; Geo-reference; Pairwise Registration; Adjustment; Trajectory
ABSTRACT:
In this paper, a framework for adjusting mobile laser scanning point cloud data to improve the accuracy is proposed by integrating
high resolution UAV images and MLS. First, aerial triangulated images with a few high accuracy ground control points are taken as
control information. Then, a hierarchical strategy is proposed for robust pairwise registration of feature points between point cloud and
images, so as to find the deviation of the point cloud. In the next step, a shape-preserving piecewise cubic interpolating method is
employed to fit the time dependent error model of the trajectory. Finally, experiments are given to prove the effectiveness of proposed
framework.
1. INTRODUCTION
Recently, given the increasing need for smart city and location
based services, the collection of urban spatial information and
civil infrastructure modelling have become hot research topics in
the photogrammetry field. Multiple sensors are employed to
collect data from diverse directions to acquire more complete
information. The MLS system was developed to collect high
precision dense point clouds from a street view to fulfill the
increasing need of street level modelling for real viewing,
navigation, and location based services (Deren, 2006; Fischer and
Gellersen, 2010). In addition, UAV is another very popular tool
developing rapidly and used widely for collecting imageries from
a top view.
The MLS is a typical survey tool that combines laser scanners,
and a position and orientation unit (POS) on a mobile platform.
As a combined survey system, the accuracy of points collected
by MLS suffers from numerous systematic and random errors.
For a well calibrated system with stable laser sensors, the
accuracy of POS plays the dominant role in final data quality.
Regardless of the small influences from target reflectivity
properties and laser-beam incidence angle, the accuracy of
platform position and orientation derived from POS determines
the overall accuracies of collected data (Skaloud and Lichti,
2006). In urban area, the losing lock of GPS problem caused by
dense trees, high buildings and tunnels will greatly influence the
quality of mobile laser scanning data, often lasts but a short time,
the shifts can reach up to meters in X,Y direction and Z direction
(Haala et al., 2008). Other negative factors also affect the
accuracy of the GPS unit, such as a weak GPS satellite
constellation, inadequate reference GPS constellations, and
improper route planning. To improve the accuracy of point
clouds, ground control points are surveyed manually using
traditional methods and then imported to the MLS post-
processing software to adjust the trajectory and point cloud,
which is labour-consuming and time intensive.
* Corresponding author
UAV is a kind of popular fly platform often embedded with light
sensors to collect data from an overhead view. To fulfill
surveying and mapping purposes, many post-processing modules
and software were developed, to process UAV data, e.g.
PhotoModeler Scanner and MICMAC (Deseilligny and Clery,
2011). With the addition of high accuracy GCPs (Ground Control
Points), the theoretical precision of computed object coordinates
can reach centimetre accuracy (Eisenbeiss and Zhang, 2006;
Nagai et al., 2009).
To achieve complete data collection for urban infrastructure
modelling, combining UAV images and MLS data for automatic
extraction and reconstruction of urban infrastructure arouses the
interest of researchers (Zhu et al., 2013). Extending beyond
complete model construction, integrating the two kinds of data
can improve the accuracy of the acquired data. To some degree,
the measured feature points from stereo UAV images can serve
as control points to adjust MLS data. The two data has
characteristic of compensation, UAV providing global control
information which could be used to geo-reference the mobile
point cloud suffering from the lost lock problem in GPS. In this
paper, we propose a method to automatically geo-reference a
point cloud from mobile laser scanning data by integrating it with
UAV images. Our contributions are as follows:
1. A framework of adjusting mobile point clouds through
UAV images automatically.
2. A hierarchical strategy for robust pairwise registration of
feature points between point clouds and images.
The paper is organized as follows: the scheme for the briefly
mentioned methodology is presented in detail in section 2.
Section 3 presents experiments with accuracy evaluation using
point cloud data from an urban environment. Conclusions and
future work are given in Section 4.
The International Archives of the Photogrammetry, Remote Sensing and Spatial Information Sciences, Volume XL-1/W4, 2015 International Conference on Unmanned Aerial Vehicles in Geomatics, 30 Aug–02 Sep 2015, Toronto, Canada
This contribution has been peer-reviewed. doi:10.5194/isprsarchives-XL-1-W4-41-2015
41

2. METHOD
2.1 Method Overview
The basic assumption of our method is that the MLS data suffers
from random errors of the GPS lost lock problem, UAV image
could provide useful global control information to mitigate this
problem. The whole procedure consists of three main phases, as
shown in Figure 1. In the first phase, data pre-processing steps
are performed, which include the Aero-Triangulation (AT) of
UAV images based on GCPs, road area extraction from MLS
data, height and intensity map interpolation. In the second phase,
feature points are extracted from the road area based on intensity
image, and then are registered to the UAV images by an edge-
based template matching method. In the registration procedure,
we propose an outlier removal method. In the third phase, a shape
preservation corrected model is employed to adjust the
trajectories of mobile system, which is finally used to adjust the
MLS point cloud data.
UAV
Images
Boundle
AdjustmentRasterization
MLS Data
3.1
Data
preprocessing
Harris Corner Operator
3.2
Pairewise
registration
Edge based
Template Matching
Neighbor Refinement
RANSAC
3.3
MSL Data
Adjustment
Shape Preserving Error
Model Fitting
MLS Data
Adjustment
Figure 1. Processing-pipeline. Three phases: the data pre-
processing of images and point clouds data, the main procedure
of pairwise registration, and adjustment of the point clouds data.
2.2 Data Pre-processing
Before data adjustment, the given MLS data and UAV data needs
pre-processing. A MLS point cloud is subdivided into blocks,
such as 80 * 80 meters. The pre-processing procedure contains
three steps: road extraction from MLS point cloud, intensity
interpolation and UAV images aerial triangulation.
a) Road point extraction from MLS point cloud data. Road
markings are always very clear and can be identified from the
background in both MLS point cloud intensity data and UAV
images. With sharp corners and strong colour contrast, road
markings have reliable and stable corner point features to
establish corresponding relationships between the ground and
aerial observations. To extract road marking corner points from
MLS intensity data, a filter algorithm is applied to remove non-
terrain points. In our experiment, we assumed that the trajectory
of MLS system has a very stable relative height to the road, or
the “ground”. Based on this assumption, the average height of
neighbouring nodes of trajectory are taken as a threshold, points
with timestamps between the nodal timestamp above the
threshold will be removed.
b) Interpolation of point cloud intensity data. To simplify the
processing, the intensity information of unstructured point cloud
should be interpolated into raster maps (Poullis, 2013). We
employ the resolution of the intensity map as 0.04m, which
corresponds to the average MLS data point cloud density of
interesting area and represent more accuracy of single point
information. For each block of 80m*80m, the intensity map
I𝑥𝑦 = {i|(x, y)} has 2000*2000 pixels. The height map Z𝑥𝑦 ={z|(x, y)} is interpolated by the same method.
c) Aerial Triangulation of UAV images
The camera of the UAV is calibrated using IWitness software
(Fraser and Hanley, 2004). The precise exterior orientation
parameters for aerial images are obtained by MICMAC, an open
source bundle adjustment software for automatic camera
calibration and orientation of set of images, developed by IGN
(Deseilligny and Clery, 2011).
2.3 Pairwise registration of UAV images and point cloud
2.3.1 Feature point extraction. Before the corresponding
points finding between MLS to UAV images, seed points are
extracted. The Harris operator is a classic and efficient corner
detector, widely used for detecting corner points in image
matching and registration (Yu et al., 2008). The intensity image
is interpolated and an improved Harris operator (Zhu and Wu,
2007) is applying to detect corner points. The detection result is
shown as Figure 2.
Figure 2. Feature points detected by the Harris operator from the
intensity image. Red-crosses are the detected corner points,
though there are many random noises in the intensity image.
We must notice that the image characteristics of road marks in
point cloud intensity data have intrinsic differences to that in the
UAV images. The intensity value represents the received energy
of laser beam reflection and UAV image record the reflection of
nature visible light with diffusion effect by camera CCD. From a
visual perspective, the edge of road marks of intensity data and
UAV image are very clear and similar. Thus, we employ edges
as the cues to instead corner to corner matching results.
The International Archives of the Photogrammetry, Remote Sensing and Spatial Information Sciences, Volume XL-1/W4, 2015 International Conference on Unmanned Aerial Vehicles in Geomatics, 30 Aug–02 Sep 2015, Toronto, Canada
This contribution has been peer-reviewed. doi:10.5194/isprsarchives-XL-1-W4-41-2015
42

2.3.2 Point matching using a local template. Edges in our
method are extracted by classic Canny edge detector (Canny,
1986). For processing edge based template matching, a new
method is presented using distance and density to measure spatial
and probabilistic distribution similarities. Given a seed point
𝑝(𝑋𝑖 , 𝑌𝑖) , a small template image is firstly cropped from the
intensity edge image with predefined window size. Then, we try
to find the corresponding points from UAV images.
Given a seed point 𝑞(𝑥𝑖 , 𝑦𝑖) in an intensity image 𝐼 with m
relative UAV images 𝐽 = {𝐼𝑗|𝑗 = 1,2, … 𝑚} , a corresponding
𝑝(𝑋𝑖 , 𝑌𝑖 , 𝑍𝑖) from the intensity image can be computed with the
help of height map. Since each image has its position and
orientation parameters, we can find serial points 𝑞(𝑥𝑖𝑗, 𝑦𝑖
𝑗), 𝑗 =
1,2, … , 𝑀 from the relative image group 𝐽 by ground point
𝑝(𝑋𝑖 , 𝑌𝑖 , 𝑍𝑖) with the help of photogrammetric collinear equation.
Then the point sets 𝑞(𝑥𝑖𝑗, 𝑦𝑖
𝑗), 𝑗 = 1,2, … , 𝑀 are taken as
candidate points group to match the ground seed points. For each
point, a small image block is cropped from the UAV and intensity
images, thus multiple stereo images are involved in seed point
matching using this procedure.
For each matching step, the centre of the template is simply
moved over the matching image and the acceptability value is
computed. The whole procedure for the template matching
process is shown as Figure 3. In the first row of Figure 3-(a) is
the template intensity image with a seed point in a cross marker
and related searching UAV images with a corresponding
projection marker. After edge detection process by Canny edge
detector, Figure 3-(b) shows the corresponding edge images.
Based on the edge template matching, Figure 3-(c) shows the
template edge results in red over the searched images. Based on
our method, the tie point matching results are shown as Figure 3-
(d) with a red marker.
Figure 3. The procedure of template matching.
2.3.3 Outlier removal. For all matched point pairs, a MLS
feature point 𝑝(𝑋𝑖 , 𝑌𝑖) is observed by multiple images with
corresponding points 𝑞(𝑥𝑖k, 𝑦𝑖
𝑘), 𝑘 = 1,2, … 𝐾 in image
coordinate space. Due to the inevitable occurrence of mismatches,
RANSAC algorithm (Fischler and Bolles, 1981) is introduced to
remove the outliers from matching results.
The basic idea of the RANSAC outlier removing procedure is
illustrated as Figure 4. Firstly, we pick two images and
corresponding tie points randomly. Using the orientation
information from the selected images and tie points, a ground
point G is computed based on a forward intersection. Next, a
reverse projection from G to the remaining image is performed
to compute bias 𝑡𝑖, which is the Euclidean distance between the
projected point (spot marker) and matched point (cross marker)
in pixels. The details steps are listed below:
1. Randomly choosing a pair of 𝑞(𝑥𝑖k, 𝑦𝑖
𝑘), k = 1,2, … K.
2. Generating the solution of forward intersection based on
related orientation information and the chosen pair.
3. Taking the solution as ground point and the orientation
information of each, a new point in each image space is
computed with collinear equation corresponding to the
matched point.
4. Comparing with the given threshold, the difference of the
new point and matched point is accepted or rejected as an
inlier and outlier.
5. The process will repeat from step one to four until the
previously set conditions are satisfied.
6. Finally, the solution is output as a ground point (𝑋𝑖′, 𝑌𝑖
′, 𝑍𝑖′)
fitted by least mean square method. In addition, the outlier
removing processing converts the points from image
coordinates to geometric coordinates.
Figure 4. (a) shows the result of template matching as tie
points between the intensity map (the last one ) and UAV
images with the cross marker. (b) illustrates the RANSAC
procedure based on the result of template matching. G
represents a ground point with chosen image 𝑆1 and 𝑆3 .
𝑡𝑖 , i = 1,2,3 is the difference of a spot representing
matched point and a cross representing the computed in 𝑆2,
𝑆4, 𝑆5 respectively.
(a) (c) (b) (d)
𝑆2 𝑆3 𝑆1 𝑆4 𝑆5
𝑡1 𝑡2 𝑡3
(b)
(a)
The International Archives of the Photogrammetry, Remote Sensing and Spatial Information Sciences, Volume XL-1/W4, 2015 International Conference on Unmanned Aerial Vehicles in Geomatics, 30 Aug–02 Sep 2015, Toronto, Canada
This contribution has been peer-reviewed. doi:10.5194/isprsarchives-XL-1-W4-41-2015
43
2.3.4 Point cloud adjustment. The errors of the position
observations of the POS system are time dependent (Zhang et. al.,
2012). From the LiDAR geo-reference equation, the coordinate
bias [∆𝑥, ∆𝑦, ∆𝑧] of a point is decided mainly by POS error. After
outlier removal processing, a set of matched point pairs is
acquired which contain the coordinate bias at a certain time.
These points, which will be used as the key points for point cloud
adjustment, allocate along the trajectory of MLS system with a
non-uniform distributions. Each point represents a point with
independent deviation vector. That means a smooth interpolation
function is needed to adjust the point cloud. In this paper, we
introduce a Shape-Preserving Piecewise Cubic Hermite
Interpolating (SPPCHI) method to generate smooth trajectory
adjustment parameters, originally proposed by (Delbourgo and
Gregory, 1985). SPPCHI is a first order approximation accuracy
interpolation method and its interpolation values between the
maximum and minimum of nodes are more stable as compared
to the traditional high degree polynomial function. The error
model function of time is generated in the 𝑋, 𝑌 𝑎𝑛𝑑 𝑍 directions
separately. Knowing the value of GPS time stamp 𝑡, the position
observation error of each point (∆𝑋(𝑡), ∆𝑌(𝑡), ∆𝑍(𝑡)) can be
computed out. Thus, the new point coordinate
( 𝑋 ‘(𝑡) , 𝑌’(𝑡) , 𝑍‘(𝑡)) after correcting can be computed using
formula:
{
𝑋 ’(𝑡) = 𝑋(𝑡) + ∆𝑋(𝑡)
𝑌‘(𝑡) = 𝑌(𝑡) + ∆𝑌(𝑡)
𝑍’(𝑡) = 𝑍(𝑡) + ∆𝑍(𝑡)
(1)
Where 𝑋(𝑡) is the original coordinate in 𝑋 direction at time 𝑡.
∆𝑋(𝑡) and 𝑋′(𝑡) are the correction and the new point. For the Y
and Z direction, the processing steps are similar.
3. EXPERIMENT
3.1 Test Data
The experimental data was collected in 2012 at the National
University of Singapore (NUS) with high buildings and dense
trees. The data includes both a MLS point cloud and aerial images
from UAV. The point cloud data set was obtained by the RIEGL
VMX 250 system with two VQ-250 laser scanners. The area of
an 80m*80m data block was interpolated into 2000*2000 image
using an average 0.04 meter grid size, which means the entire
range and intensity of values of each point was preserved with
very little loss of information from rasterization. Figure.5 shows
the whole test area and a part of the intensity map.
Figure 5 shows the overview of point cloud data in NUS. Right
figure is the interpolated intensity image, which shows very clear
land marks.
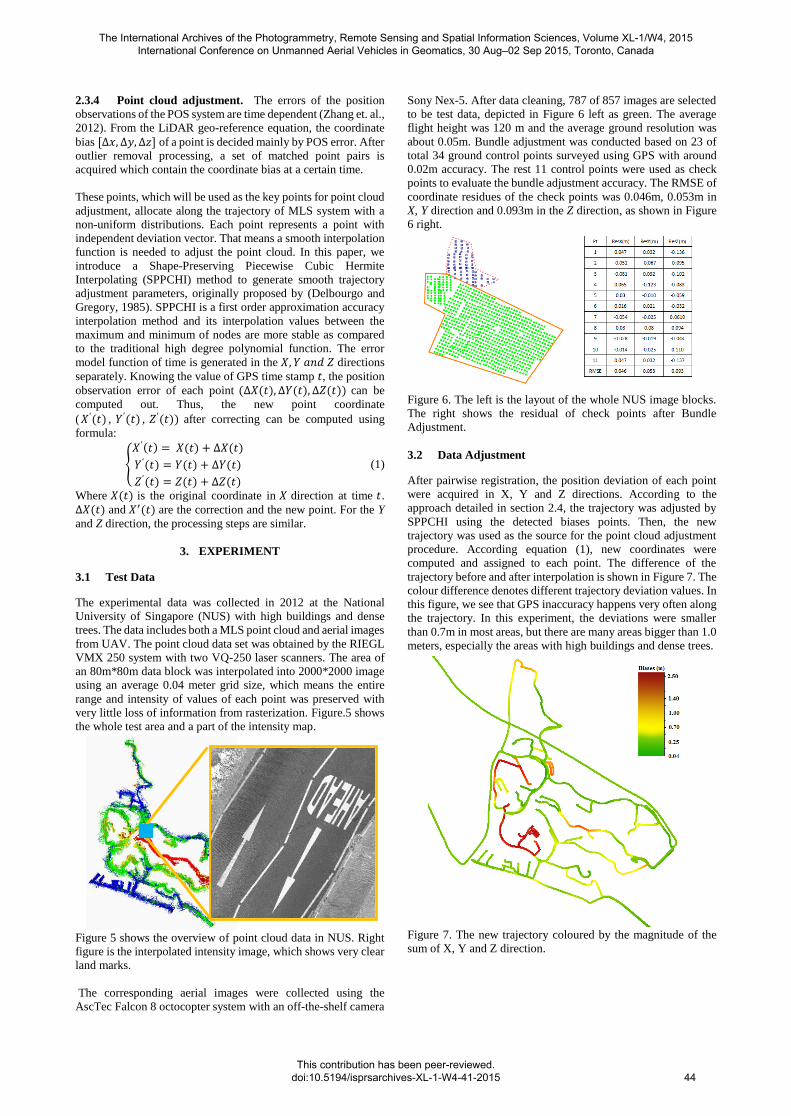
The corresponding aerial images were collected using the
AscTec Falcon 8 octocopter system with an off-the-shelf camera
Sony Nex-5. After data cleaning, 787 of 857 images are selected
to be test data, depicted in Figure 6 left as green. The average
flight height was 120 m and the average ground resolution was
about 0.05m. Bundle adjustment was conducted based on 23 of
total 34 ground control points surveyed using GPS with around
0.02m accuracy. The rest 11 control points were used as check
points to evaluate the bundle adjustment accuracy. The RMSE of
coordinate residues of the check points was 0.046m, 0.053m in
X, Y direction and 0.093m in the Z direction, as shown in Figure
6 right.
Figure 6. The left is the layout of the whole NUS image blocks.
The right shows the residual of check points after Bundle
Adjustment.
3.2 Data Adjustment
After pairwise registration, the position deviation of each point
were acquired in X, Y and Z directions. According to the
approach detailed in section 2.4, the trajectory was adjusted by
SPPCHI using the detected biases points. Then, the new
trajectory was used as the source for the point cloud adjustment
procedure. According equation (1), new coordinates were
computed and assigned to each point. The difference of the
trajectory before and after interpolation is shown in Figure 7. The
colour difference denotes different trajectory deviation values. In
this figure, we see that GPS inaccuracy happens very often along
the trajectory. In this experiment, the deviations were smaller
than 0.7m in most areas, but there are many areas bigger than 1.0
meters, especially the areas with high buildings and dense trees.
Figure 7. The new trajectory coloured by the magnitude of the
sum of X, Y and Z direction.
The International Archives of the Photogrammetry, Remote Sensing and Spatial Information Sciences, Volume XL-1/W4, 2015 International Conference on Unmanned Aerial Vehicles in Geomatics, 30 Aug–02 Sep 2015, Toronto, Canada
This contribution has been peer-reviewed. doi:10.5194/isprsarchives-XL-1-W4-41-2015
44

3.3 Accuracy Evaluation
To evaluate the accuracy of the processed data, a few uniformly
distributed check points were selected manually from the original
point clouds data set using TerraScan software, as well as
corresponding points in corrected data. Control points are
measured manually using LPS software from UAV stereo images
with AT processing. The root mean square value of the
differences between check points and control points is calculated
before and after the trajectory correction.
(a)
(b)
Figure 8. (a) Differences between control points and check
points for the unadjusted data (RMS-△X=0.130m, RMS-
△Y=0.211m, RMS-△Z=0.467m). (b) Difference between
control point and check point from corrected data (RMS-
△X=0.086m, RMS-△Y=0.063m, RMS-△Z=0.106m).
Figure 8-(a) shows the differences between check points and
control points from the unadjusted data. It is very clear that there
are some points of big differences. The vertical variance (0.467m)
is rather higher than the horizontal variance (0.130m and 0.211m),
consistent with RTK surveying experience where the precision of
the vertical is double the precision of position obtained by the
RTK system. Figure 8-(b) shows the results after point cloud
correction. The variance of position of check points in the X and
Y direction are 0.086m and 0.063m, in the vertical direction
about 0.106m. It greatly improved the quality of original point
cloud without spending much labour and time on GPS survey
field work. This procedure can automatically register the original
point cloud to the UAV images, providing a good basis for future
complete modelling processing.
4. CONCLUSION
In this paper, we propose a novel framework to automatically
geo-reference MLS point clouds to UAV data, which can
improve the accuracy of MLS point cloud data. In the proposed
method, all the extracted corresponding feature points on white
road markings are processed robustly to guarantee the quality of
extracted control points using a hierarchical strategy. The
experimental results of registration demonstrate that the proposed
method is practical for urban area data registration using road
markings between images and point clouds. Another benefit of
our work is that it reduces labour intensive field work of control
point surveying. In MLS surveying for dense urban areas, the
average distance between two control points is typically about
100~200 meters. Thus, only a few control points are needed to
adjust the MLS point cloud using UAV images, rather than a
hundred control points along the road, collected under field
conditions.
The robustness of our proposed automatic method depends on the
control point matching results. If the feature differences between
an image and intensity map are too large to obtain satisfactory
point matching results, the robustness of our method will be
influenced. Undoubtedly, such a procedure could improve the
quality of data. But, by addressing the symptoms of problem
rather than its cause, does not allow one to fully realize model
accuracy in MLS system technology.
ACKNOWLEDGEMENTS (OPTIONAL)
The authors would greatly thank Prof. Armin Gruen and the
Future Cities Laboratory (FCL) of Singapore-ETH Centre for
providing the test data set and many valuable help. The authors
conceived this idea during working period in FCL under the
supervising of Prof. Armin Gruen, and developed it in Wuhan
University.
This research was supported by the National Basic Research
Program of China (No. 2012CB725300), National Key
Technology Support Program of China (No. 2012BAH43F02).
REFERENCES
Canny, J., 1986. A computational approach to edge detection,
Pattern Analysis and Machine Intelligence, IEEE Transactions
on, PAMI-8(6):679-698.
Delbourgo, R., and J. Gregory, 1985. Shape preserving piecewise
rational interpolation, SIAM journal on scientific and statistical
computing, 6(4):967-976.
Deren, L., 2006. Mobile mapping technology and its applications
[j], Geospatial Information, 4(4):125.
Deseilligny, M.P., and I. Clery, Apero, an open source bundle
adjusment software for automatic calibration and orientation of
set of images, Proceedings of the ISPRS Symposium, 3DARCH11,
2011.
Eisenbeiss, H., and L. Zhang, 2006. Comparison of dsms
generated from mini uav imagery and terrestrial laser scanner in
a cultural heritage application, International Archives of
Photogrammetry, Remote Sensing and Spatial Information
Sciences XXXVI-5, 90e96.
Fischer, C., and H. Gellersen, 2010. Location and navigation
support for emergency responders: A survey, IEEE Pervasive
Computing, 9(1):38-47.
Fischler, M.A., and R.C. Bolles, 1981. Random sample
consensus: A paradigm for model fitting with applications to
image analysis and automated cartography, Communications of
the ACM, 24(6):381-395.
Fraser, C., and H. Hanley, Developments in close-range
photogrammetry for 3d modelling: The iwitness example,
Presented paper, International Workshop: Processing and
Visualization using High-Resolution Imagery, Pitsanulok, 2004.
Gruen, A., X. Huang, R. Qin, T. Du, W. Fang, J. Boavida, and A.
Oliveira, 2013. Joint processing of uav imagery and terrestrial
mobile mapping system data for very high resolution city
(m)
(m)
The International Archives of the Photogrammetry, Remote Sensing and Spatial Information Sciences, Volume XL-1/W4, 2015 International Conference on Unmanned Aerial Vehicles in Geomatics, 30 Aug–02 Sep 2015, Toronto, Canada
This contribution has been peer-reviewed. doi:10.5194/isprsarchives-XL-1-W4-41-2015
45

modeling, ISPRS-International Archives of the Photogrammetry,
Remote Sensing and Spatial Information Sciences, 1(2):175-182.
Haala, N., M. Peter, J. Kremer, and G. Hunter, 2008. Mobile lidar
mapping for 3d point cloud collection in urban areas-a
performance test, The International Archives of the
Photogrammetry, Remote Sensing and Spatial Information
Sciences, 37:1119-1127.
Nagai, M., T. Chen, R. Shibasaki, H. Kumagai, and A. Ahmed,
2009. Uav-borne 3-d mapping system by multisensor integration,
Geoscience and Remote Sensing, IEEE Transactions on,
47(3):701-708.
Poullis, C., 2013. A framework for automatic modeling from
point cloud data, Pattern Analysis and Machine Intelligence,
IEEE Transactions on, 35(11):2563-2575.
Puente, I., H. González-Jorge, B. Riveiro, and P. Arias, 2012.
Accuracy verification of the lynx mobile mapper system, Optics
& Laser Technology.
Skaloud, J., and D. Lichti, 2006. Rigorous approach to bore-sight
self-calibration in airborne laser scanning, ISPRS Journal of
Photogrammetry and Remote Sensing, 61(1):47-59.
Yu, L., D. Zhang, and E.-J. Holden, 2008. A fast and fully
automatic registration approach based on point features for multi-
source remote-sensing images, Computers & Geosciences,
34(7):838-848.
Zhu, L., A. Jaakkola, and J. Hyyppä, 2013. The use of mobile
laser scanning data and unmanned aerial vehicle images for 3d
model reconstruction.
The International Archives of the Photogrammetry, Remote Sensing and Spatial Information Sciences, Volume XL-1/W4, 2015 International Conference on Unmanned Aerial Vehicles in Geomatics, 30 Aug–02 Sep 2015, Toronto, Canada
This contribution has been peer-reviewed. doi:10.5194/isprsarchives-XL-1-W4-41-2015
46