automatic label removal from digitized …automatic label removal from digitized weld radiographs 3...
TRANSCRIPT
AUTOMATIC LABEL REMOVAL FROM DIGITIZED WELD RADIOGRAPHS 1
Jurnal Teknologi, 47(D) Dis. 2007: 1–14© Universiti Teknologi Malaysia
AUTOMATIC LABEL REMOVAL FROM DIGITIZEDWELD RADIOGRAPHS
SOO SAY LEONG1, MANI MARAN RATNAM2*, ZAHURIN SAMAD3 &MOHD ASHHAR KHALID4
Abstract. This paper presents a methodology to remove labels automatically from digitized weldradiographs as part of the automatic weld defect detection process. An algorithm was developed todetect and remove labels printed onto weld radiographs before weld extraction algorithm or defectdetection algorithm is applied. Normality test was used to determine if the intensity profile parallel tothe weld contains label pixels. Thresholding followed by region filling operations were carried out toremove the labels. The algorithm was tested on 50 weld radiographs with labels and the labels on 90%of these images were successfully removed.
Keywords: Weld radiography, label removal, normality test
Abstrak. Kertas kerja ini membentangkan keadah mengeluarkan label secara automatik daripadaradiograf kimpalan sebagai sebahagian daripada proses pengesanan kecacatan automatik. Suatualgoritma telah dibangunkan untuk mengesan dan mengeluarkan label yang tercetak pada radiografkimpalan sebelum algoritma penyarian kimpalan dikenakan. Ujian kenormalan digunakan untukmenentukan sama ada profil keamatan selari dengan kimpalan mengandungi piksel label. Pengambangandiikuti dengan operasi mengisi kawasan dilakukan untuk mengeluarkan label. Algoritma tersebutdiuji ke atas 50 radiograf kimpalan yang mempunyai label dan label pada 90% daripada imej tersebutdikeluarkan dengan jayanya.
Kata kunci: Radiograpfi kimpalan, pengeluaran label, ujian kenormalan
1.0 INTRODUCTION
A radiograph is a photographic record produced by the passage of X-rays or Gammarays through an object onto a film. The image formed on the film is digitized andconverted into two-dimensional array of picture elements (pixels) before computer-based enhancement or automatic analysis is carried out.
Radiographs are usually marked to clearly indicate the weld number or othertraceable identification [1]. Examples of identification that may appear in a radiograph
1,2,3 School of Mechanical Engineering, Universiti Sains Malaysia, Engineering Campus, Sri Ampangan,14300 Nibong Tebal, Penang, Malaysia.*Corresponding author: Tel.: +6-04-5937788. Fax: +6-04-5941025.Email: [email protected]
4 Intelligent Systems Group, Malaysia Institute of Nuclear Technology Research (MINT), 43650Bangi, Selangor, Malaysia.
JTDIS47D[01].pmd 06/10/2008, 17:381
LEONG S. Y., RATNAM M.N., ZAHURIN & MOHD ASHHAR2
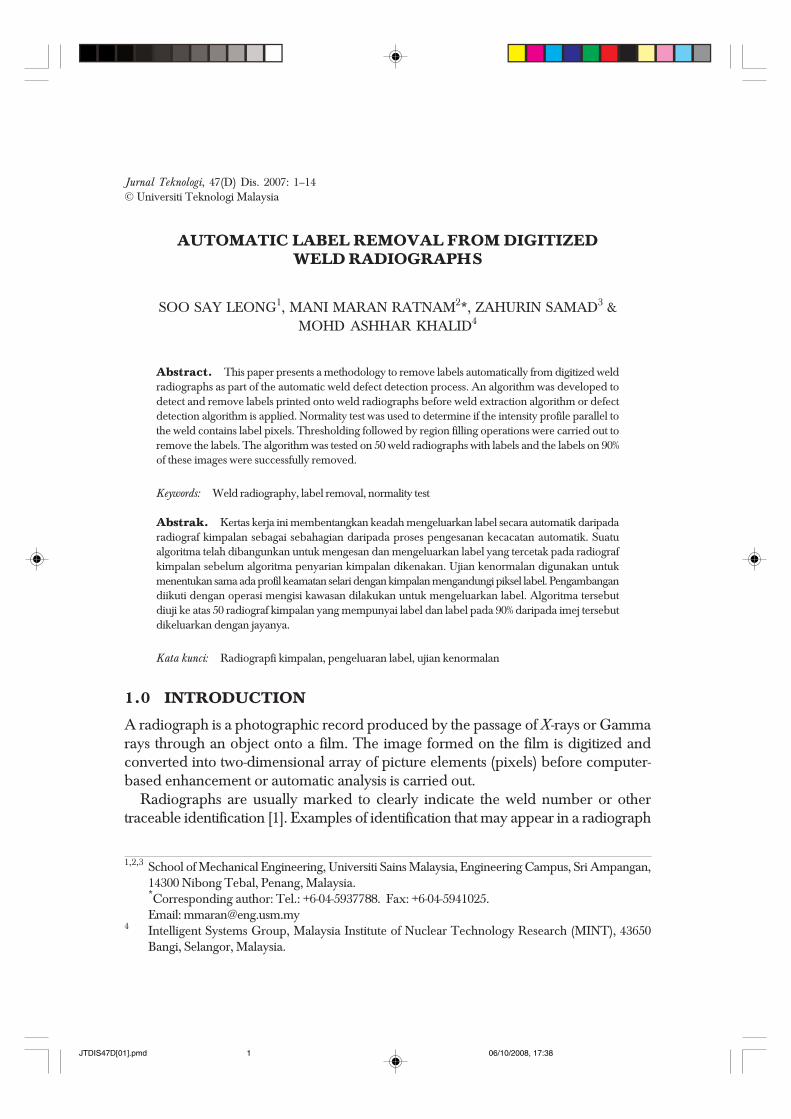
are film number, part number, name and/or logo of the film manufacturer, date ofexamination etc. [2]. In addition, image quality indicators (IQI) are used on the film toprovide information regarding contrast sensitivity and definition of the radiograph.These identifications and IQIs appear in the film as labels as shown in Figure 1.
Although the labels provide important information concerning a radiograph, it isdesirable to remove them before an automatic weld defect detection and interpretationalgorithm is applied to the weld region. This will ensure that subsequent weld extractionand defect detection operations will not be affected by the pixels belonging to thelabels. Although much effort has been made on weld extraction [3-5] and defectdetection [6-9], no previous attempt has been made to remove the labels from weldradiographs automatically. In most of the past research, the label regions were removedmanually or the defect regions cropped out to carry out the defect identification, e.g.[6, 9-10]. The use of manual intervention to define the regions to be processed oromitted in the weld radiographs is an impediment to the automatic interpretation ofthe radiographs. In this work, a methodology to remove labels automatically fromdigitized weld radiographs is proposed.
2.0 METHODOLOGY
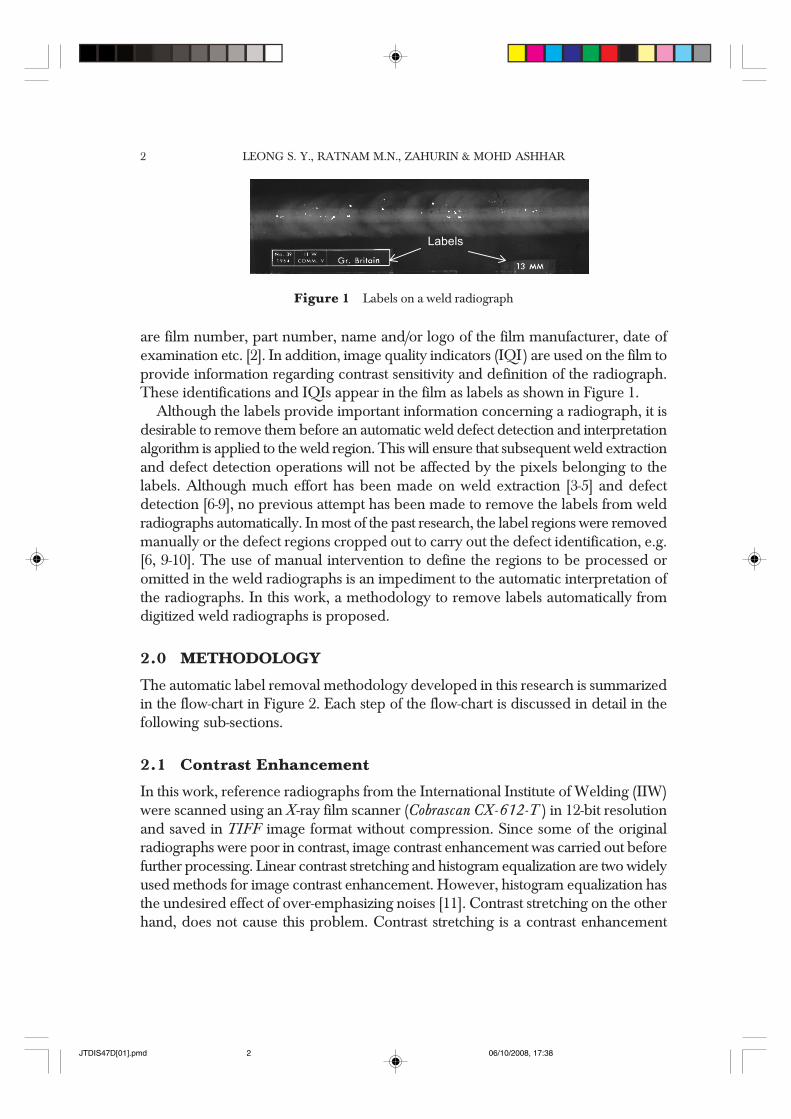
The automatic label removal methodology developed in this research is summarizedin the flow-chart in Figure 2. Each step of the flow-chart is discussed in detail in thefollowing sub-sections.
2.1 Contrast Enhancement
In this work, reference radiographs from the International Institute of Welding (IIW)were scanned using an X-ray film scanner (Cobrascan CX-612-T ) in 12-bit resolutionand saved in TIFF image format without compression. Since some of the originalradiographs were poor in contrast, image contrast enhancement was carried out beforefurther processing. Linear contrast stretching and histogram equalization are two widelyused methods for image contrast enhancement. However, histogram equalization hasthe undesired effect of over-emphasizing noises [11]. Contrast stretching on the otherhand, does not cause this problem. Contrast stretching is a contrast enhancement
�������
Figure 1 Labels on a weld radiograph
JTDIS47D[01].pmd 06/10/2008, 17:382
AUTOMATIC LABEL REMOVAL FROM DIGITIZED WELD RADIOGRAPHS 3
technique for linearly mapping the intensity values of an image to a new range. In thiswork, the intensity value was stretched to a full range of intensity level in an 8-bitimage, which is 0 to 255 gray levels.
2.2 Intensity Profile IQR/stdev Ratio Test
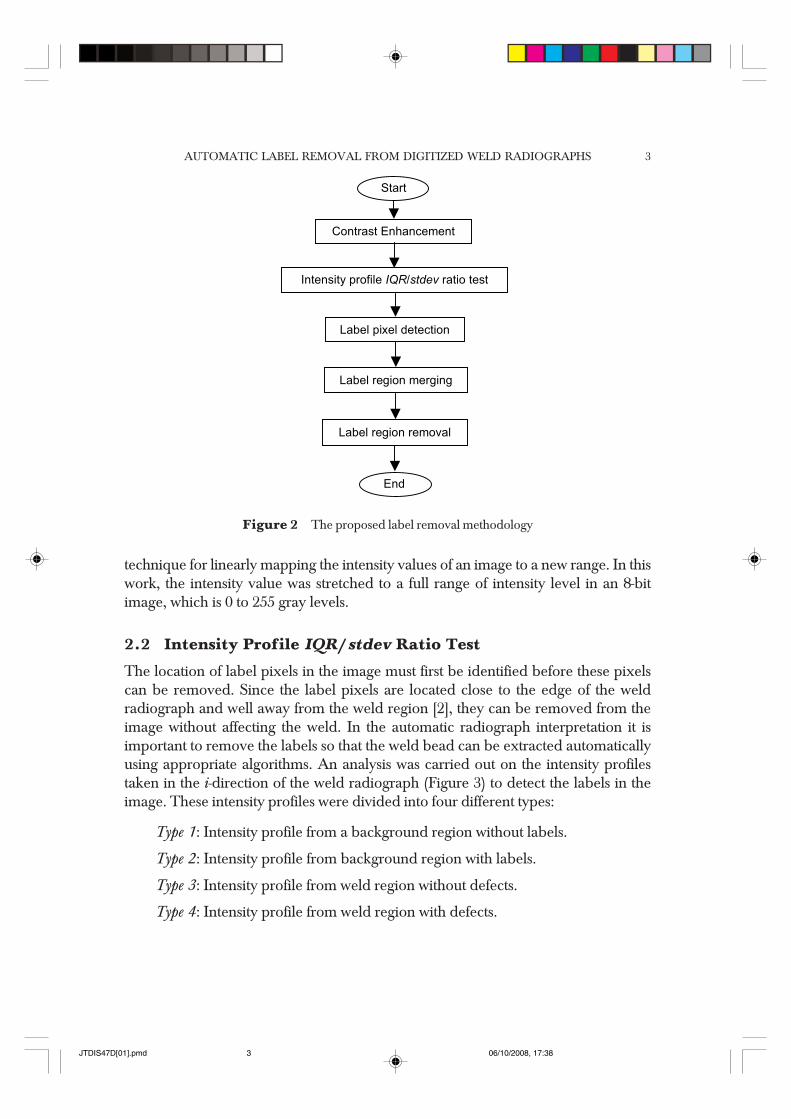
The location of label pixels in the image must first be identified before these pixelscan be removed. Since the label pixels are located close to the edge of the weldradiograph and well away from the weld region [2], they can be removed from theimage without affecting the weld. In the automatic radiograph interpretation it isimportant to remove the labels so that the weld bead can be extracted automaticallyusing appropriate algorithms. An analysis was carried out on the intensity profilestaken in the i-direction of the weld radiograph (Figure 3) to detect the labels in theimage. These intensity profiles were divided into four different types:
Type 1: Intensity profile from a background region without labels.
Type 2: Intensity profile from background region with labels.
Type 3: Intensity profile from weld region without defects.
Type 4: Intensity profile from weld region with defects.
Figure 2 The proposed label removal methodology
���
�� ���� �� ���� �
� � ����������������������������
������������������ �
���������� ����� ���
���������� ���������
� ��
JTDIS47D[01].pmd 06/10/2008, 17:383
LEONG S. Y., RATNAM M.N., ZAHURIN & MOHD ASHHAR4
The aim is to detect Type 2 intensity profiles that occur across labels in the image.Normality test was performed on the intensity values of the profile in order to distinguishType 2 intensity profile from the others. Several methods can be used for the normalitytest. One of the tests is performed by calculating the IQR/stdev ratio of the pixel intensitydata, where IQR is the inter-quartile range of the data while stdev is the standard deviationof the data. The inter-quartile range, IQR is the distance between the upper and lowerquartiles given by,
IQR = QU – QL (1)
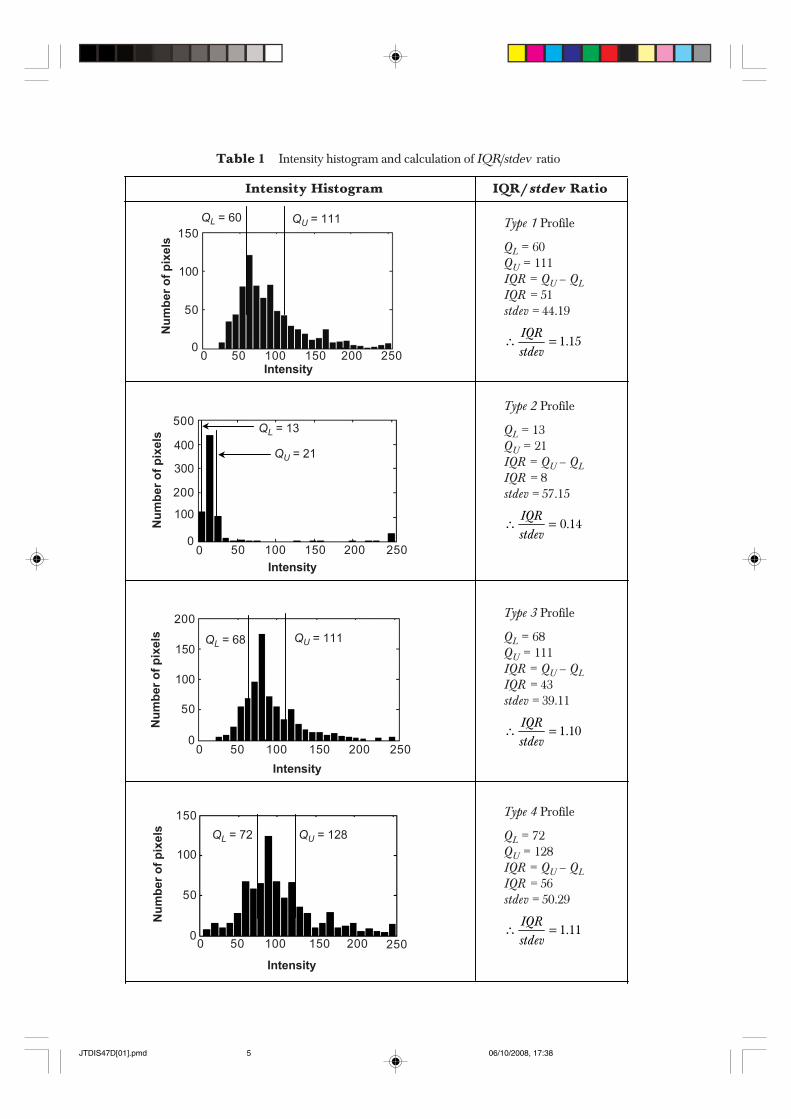
where the upper quartile QU for a data set is the 75th percentile while the lower quartileQL is the 25 percentile of the intensity profile. If the distribution of the data is normal,the IQR/stdev will be equal to 1.34 [12]. Four examples of IQR/stdev ratio calculationsare illustrated for the four types of intensity profiles in Table 1.
Ten sample profiles of each type, i.e. a total of forty samples, were collected randomlyfrom ten weld radiographs. IQR/stdev ratios were calculated for each profile and theresults are presented in Table 2. The average value of IQR/stdev ratio for Type 2 profilewas found to be lower compared to Type 1, Type 3 and Type 4 profiles. The differencebetween the average values of IQR/stdev for each type of intensity profile and the valueof IQR/stdev for a normal distribution profile are 12.58%, 73.78%, 14.68% and 4.81%respectively for Type 1, Type 2, Type 3 and Type 4 profiles. Type 1, Type 3 and Type 4profiles were found to have IQR/stdev values close (within 20%) to the IQR/stdev valuefor the normal distribution profile. Thus, the presence of label pixels can be identifiedbased upon the IQR/stdev ratio due to the difference between the ratio for label pixelsand non-label regions.
Based on the results in Table 1, a threshold value for IQR/stdev ratio was selected inorder to differentiate Type 2 intensity profile from the other three profiles. Since theaverage IQR/stdev value of ten samples for Type 1, Type 3 and Type 4 intensity profilesis 1.483 while the average value for Type 2 of intensity profiles is 0.351, a value betweenthese two ratios, i.e. 0.9, was selected as the threshold. Thus, if the IQR/stdev ratio in a
Figure 3 Location of four types of intensity profiles along i-direction
��� �
�����
����������
��
��
JTDIS47D[01].pmd 06/10/2008, 17:384
AUTOMATIC LABEL REMOVAL FROM DIGITIZED WELD RADIOGRAPHS 5
Intensity Histogram IQR/stdev Ratio
15.1
19.4451
11160
=∴
==
−===
stdevIQR
stdevIQR
QQIQRQQ
LU
U
L
Type 1 Profile
14.0
15.578
2113
=∴
==
−===
stdevIQR
stdevIQR
QQIQRQQ
LU
U
L
Type 2 Profile
10.1
11.3943
11168
=∴
==
−===
stdevIQR
stdevIQR
QQIQRQQ
LU
U
L
Type 3 Profile
11.1
29.5056
12872
=∴
==
−===
stdevIQR
stdevIQR
QQIQRQQ
LU
U
L
Type 4 Profile
QL = 60 QU = 111
Intensity
Num
ber
of p
ixel
s
QL = 13
QU = 21
Intensity
Num
ber
of p
ixel
s
QL = 68 QU = 111
Intensity
Num
ber
of p
ixel
s
QL = 72 QU = 128
Intensity
Num
ber
of p
ixel
s Table 1 Intensity histogram and calculation of IQR/stdev ratio
Nu
mb
er
of
pix
els
Intensity
150
QL = 60 QU = 111
50 100 150 200 25000
50
100
Nu
mb
er
of
pix
els
Intensity
150
QL = 72 QU = 128
50 100 150 200 25000
50
100
Nu
mb
er
of
pix
els
Intensity
200
QL = 68 QU = 111
50 100 150 200 25000
50
150
Nu
mb
er
of
pix
els
Intensity
500QL = 13
QU = 21
50 100 150 200 25000
300
400
200
100
100
Intensity Histogram IQR/stdev Ratio
Type 1 Profile
QL = 60QU = 111IQR = QU – QLIQR = 51stdev = 44.19
1.15IQRstdev
∴ =
Type 2 Profile
QL = 13QU = 21IQR = QU – QLIQR = 8stdev = 57.15
0.14IQRstdev
∴ =
Type 3 Profile
QL = 68QU = 111IQR = QU – QLIQR = 43stdev = 39.11
1.10IQRstdev
∴ =
Type 4 Profile
QL = 72QU = 128IQR = QU – QLIQR = 56stdev = 50.29
1.11IQRstdev
∴ =
JTDIS47D[01].pmd 06/10/2008, 17:385
LEONG S. Y., RATNAM M.N., ZAHURIN & MOHD ASHHAR6
new intensity profile is more than 0.9, this implies that there are no label pixels in theprofile. On the other hand, label pixels are present in the profile if the IQR/stdev ratio isequal to or less than 0.9.
2.3 Label Pixel Detection
From the analysis of IQR/stdev ratio on the intensity profiles, we conclude that if theIQR/stdev ratio is more than 0.9, all the pixels along the profile are non-label pixels. Inthis case, these pixels were assigned to 0 gray value. On the other hand, for profileshaving IQR/stdev ratio less than or equal to 0.9, histogram thresholding operation wasused to extract label pixels from the intensity profile. Thresholding is to define a rangeof brightness values in an image, select the pixels within this range as belonging to theforeground, and reject all of the other pixels to the background [13]. This is illustratedas follows.
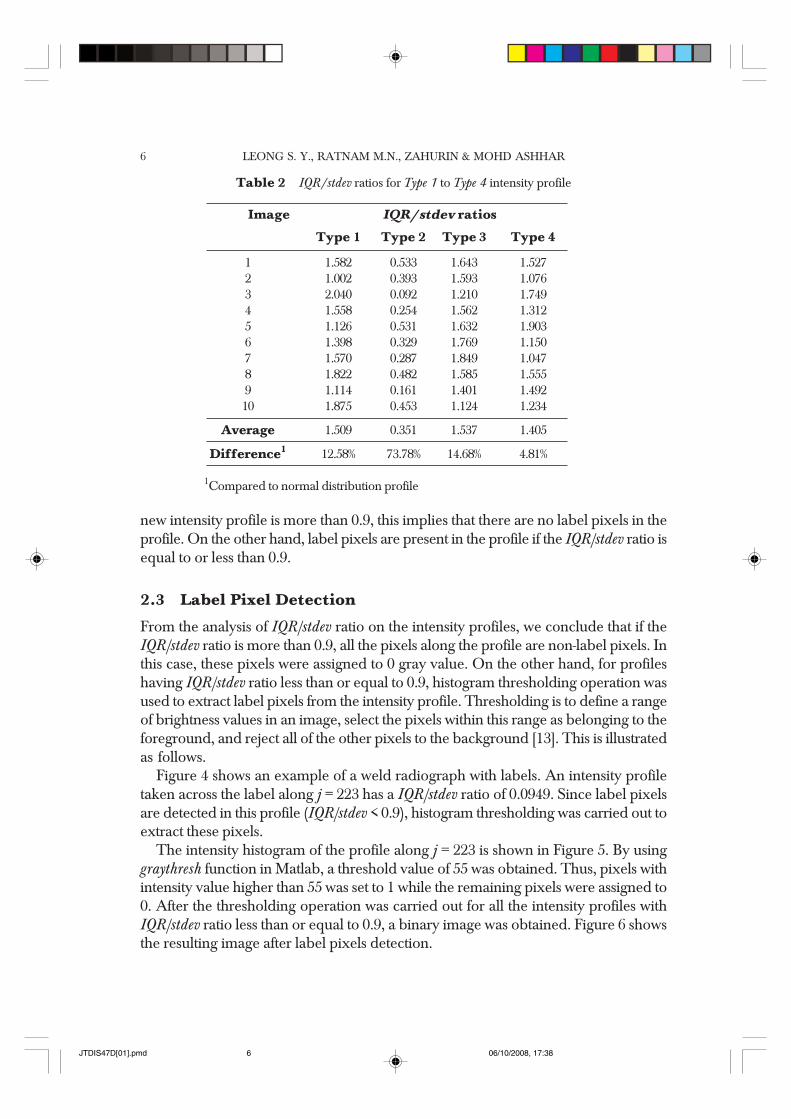
Figure 4 shows an example of a weld radiograph with labels. An intensity profiletaken across the label along j = 223 has a IQR/stdev ratio of 0.0949. Since label pixelsare detected in this profile (IQR/stdev < 0.9), histogram thresholding was carried out toextract these pixels.
The intensity histogram of the profile along j = 223 is shown in Figure 5. By usinggraythresh function in Matlab, a threshold value of 55 was obtained. Thus, pixels withintensity value higher than 55 was set to 1 while the remaining pixels were assigned to0. After the thresholding operation was carried out for all the intensity profiles withIQR/stdev ratio less than or equal to 0.9, a binary image was obtained. Figure 6 showsthe resulting image after label pixels detection.
Table 2 IQR/stdev ratios for Type 1 to Type 4 intensity profile
Image IQR/stdev ratios
Type 1 Type 2 Type 3 Type 4
1 1.582 0.533 1.643 1.5272 1.002 0.393 1.593 1.0763 2.040 0.092 1.210 1.7494 1.558 0.254 1.562 1.3125 1.126 0.531 1.632 1.9036 1.398 0.329 1.769 1.1507 1.570 0.287 1.849 1.0478 1.822 0.482 1.585 1.5559 1.114 0.161 1.401 1.49210 1.875 0.453 1.124 1.234
Average 1.509 0.351 1.537 1.405
Difference1 12.58% 73.78% 14.68% 4.81%
1Compared to normal distribution profile
JTDIS47D[01].pmd 06/10/2008, 17:386
AUTOMATIC LABEL REMOVAL FROM DIGITIZED WELD RADIOGRAPHS 7
Figure 4 Intensity profile taken across labels on j = 223
��
��
��������
Figure 6 Example of label pixel detection: (a) is the original image, (b) detected label pixels
Figure 5 Histogram of intensity profile on j = 223
� � ����������
���
���
!�
��
� "�����������!����##�
$�%�
$�%�
50
50 100 150 200 25000
30
40
20
10
j = 223
j
Pix
er
nu
mb
er
Intensity level
JTDIS47D[01].pmd 06/10/2008, 17:387
LEONG S. Y., RATNAM M.N., ZAHURIN & MOHD ASHHAR8
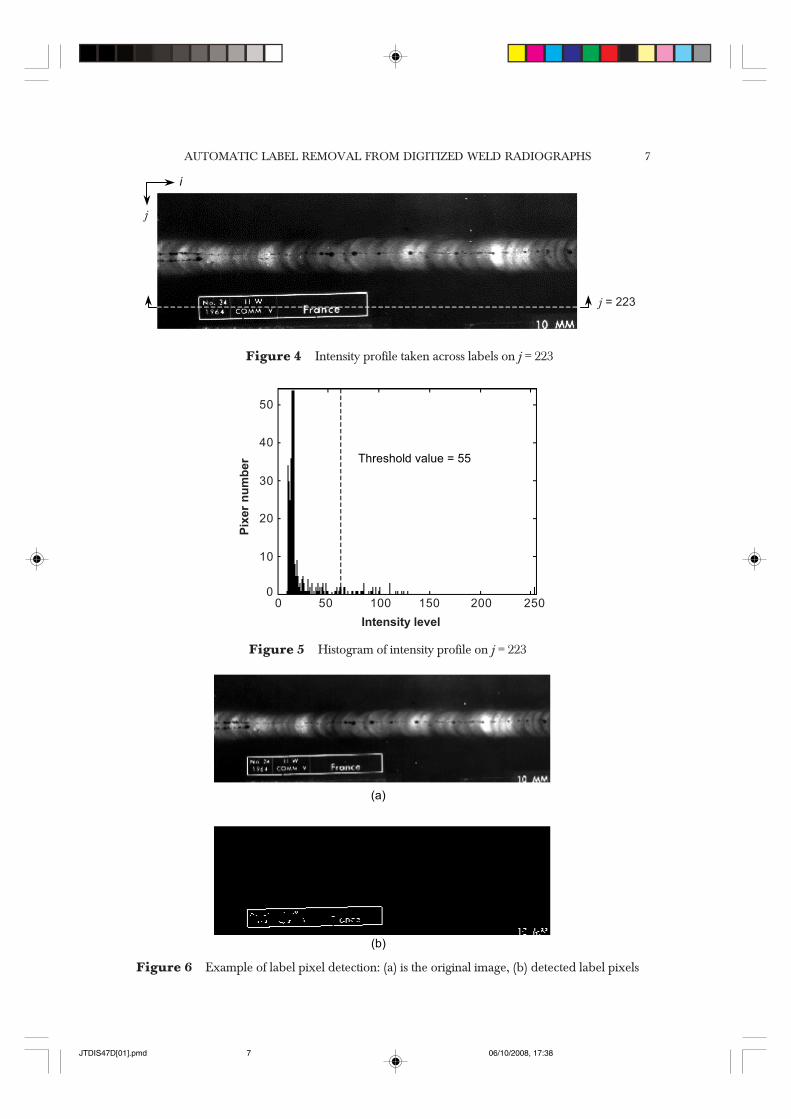
2.4 Label Region Merging
The label pixel detection algorithm was able to extract most but not all the labelpixels in the image. Therefore, label region merging was carried out to merge all labelpixels in the image into connected regions. The detected label pixels that belonged tothe same label in the image were merged into one label region. Dilation techniquewas applied to connect the label pixels. The dilation process involves the use of aconvolution mask known as a structuring element, which acts over both external andinternal object boundary, depending on the size and shape of the structuring element[14].
A rectangular structuring element was chosen in this research based on theobservation that the labels in the weld radiographs are approximately rectangular inshape. In addition, the size of the structuring element also plays an important role. Theselection of the size of the structuring element is crucial because an undersized elementwill not be able to connect all the label pixels, while an oversized element tends toremove useful information from the image. Different sizes of structuring element wastested on the image and the result showed that a 9 × 19 rectangular window structuringelement produced the best result in connecting all the label pixels.
Therefore, dilation operation with 9 × 19 structuring element was carried out on thedetected label pixel binary image shown in Figure 6(b). An image with all mergedlabel regions was obtained as shown in Figure 7, in which the detected label pixelswere merged into several separate label regions. In the subsequent stages, these labelregions were removed from the image to complete the label removal process.
Figure 7 Merging of labels region for image shown in Figure 6(b)
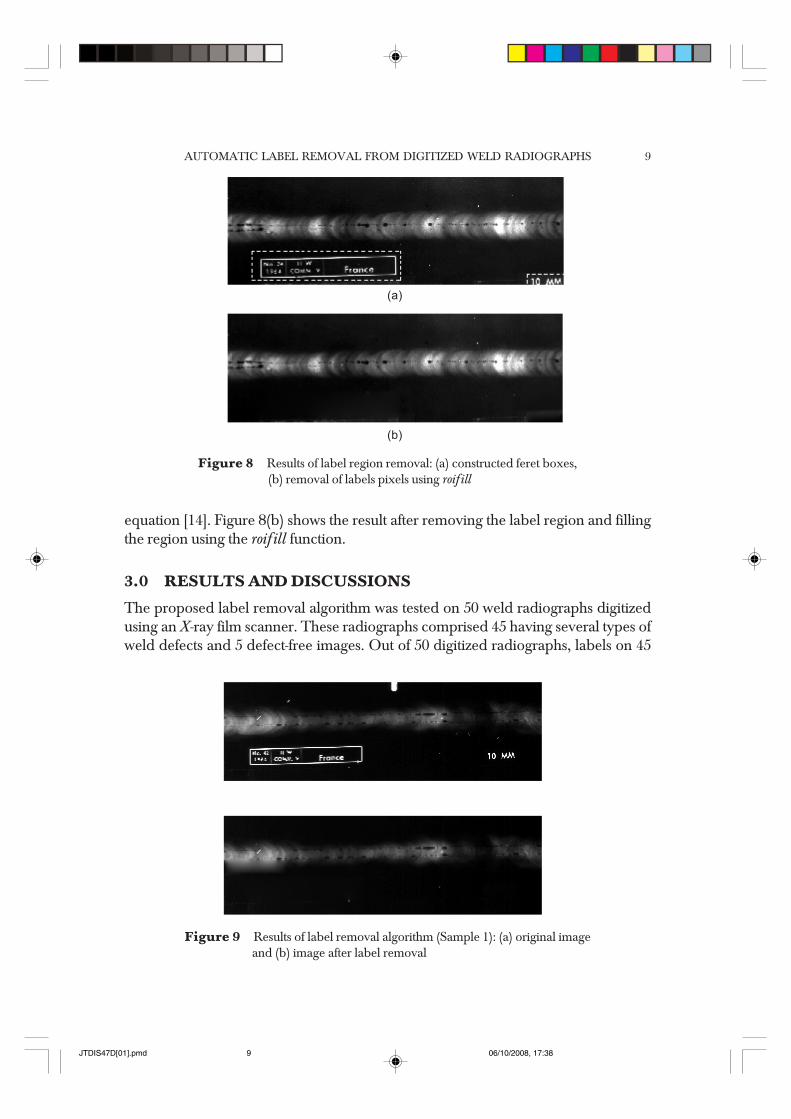
2.5 Label Region Removal
After merging the label regions, the main label areas in weld radiograph were identified.Feret boxes were constructed enclosing the label regions as shown in Figure 8(a). Aferet box is the smallest rectangle orientated according to a specific reference thatencloses the shape [15]. The intensity of the pixels located inside the feret boxes wasfilled using the roifill function in Matlab. The roifill function smoothly interpolatesinward from the pixel values on the boundary of the feret box by solving a Laplace
JTDIS47D[01].pmd 06/10/2008, 17:388
AUTOMATIC LABEL REMOVAL FROM DIGITIZED WELD RADIOGRAPHS 9
equation [14]. Figure 8(b) shows the result after removing the label region and fillingthe region using the roifill function.
3.0 RESULTS AND DISCUSSIONS
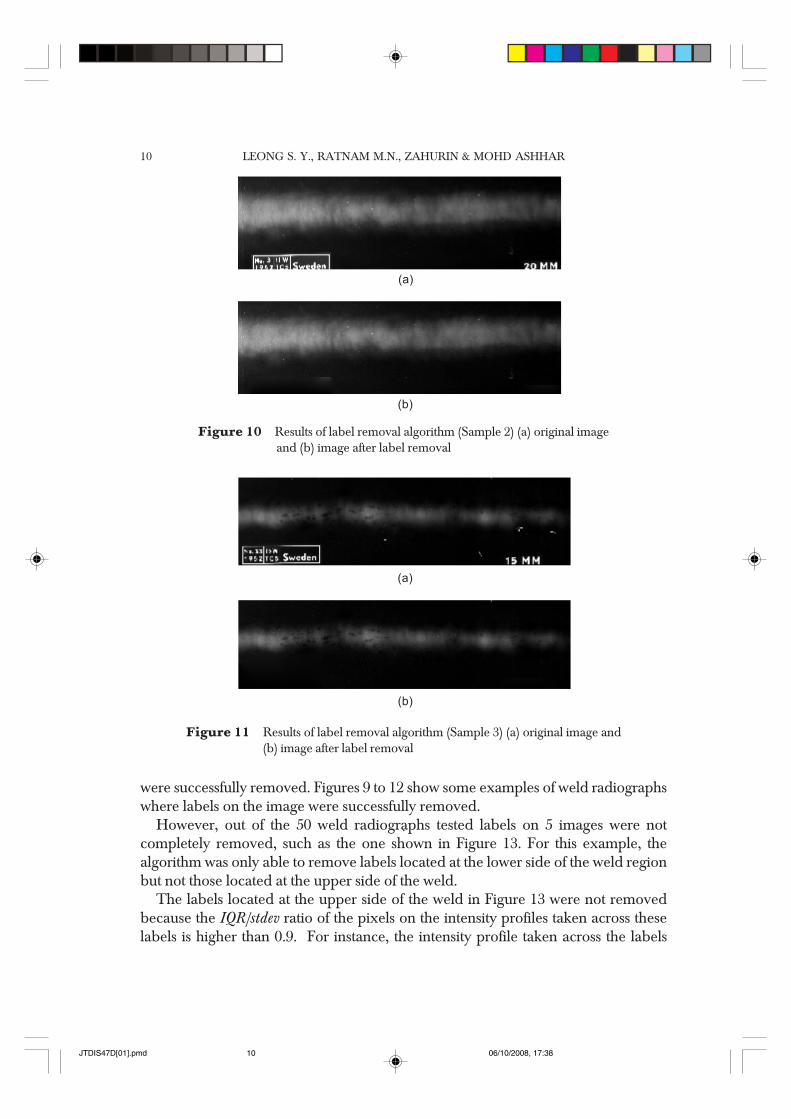
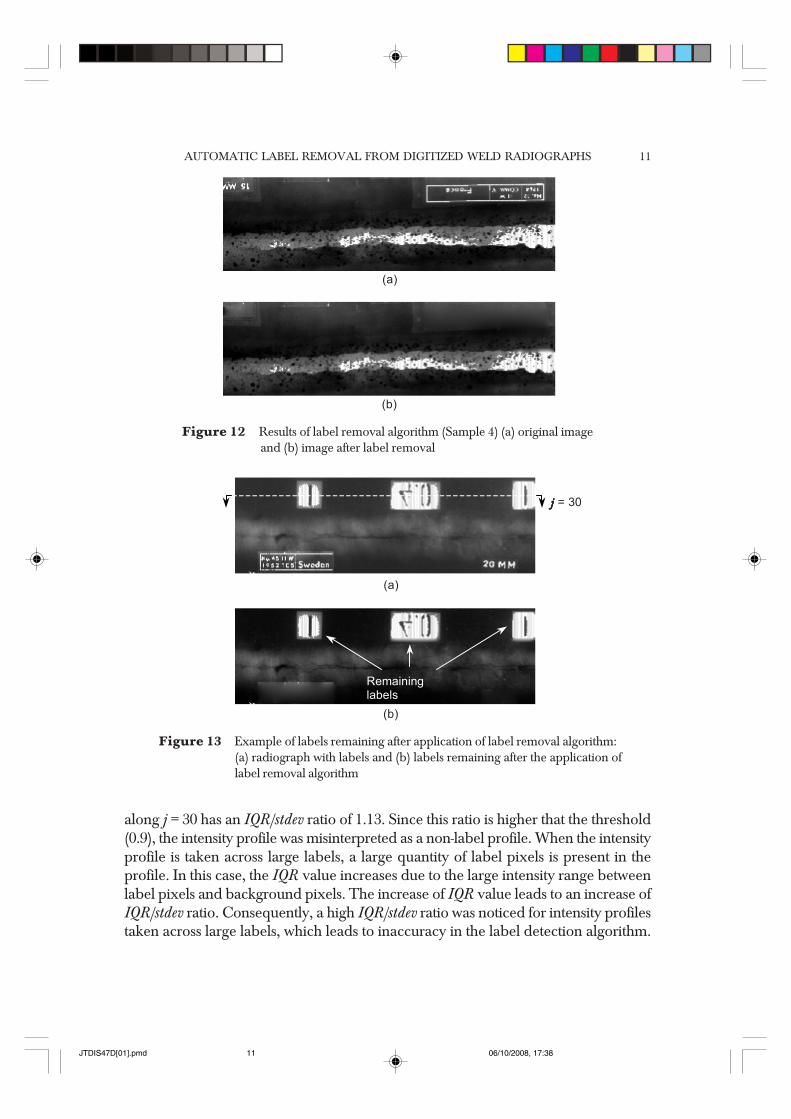
The proposed label removal algorithm was tested on 50 weld radiographs digitizedusing an X-ray film scanner. These radiographs comprised 45 having several types ofweld defects and 5 defect-free images. Out of 50 digitized radiographs, labels on 45
Figure 8 Results of label region removal: (a) constructed feret boxes,(b) removal of labels pixels using roifill
(a)
(b)
Figure 9 Results of label removal algorithm (Sample 1): (a) original imageand (b) image after label removal
JTDIS47D[01].pmd 06/10/2008, 17:389
LEONG S. Y., RATNAM M.N., ZAHURIN & MOHD ASHHAR10
Figure 10 Results of label removal algorithm (Sample 2) (a) original imageand (b) image after label removal
Figure 11 Results of label removal algorithm (Sample 3) (a) original image and(b) image after label removal
.
(a)
(b)
(a)
(b)
were successfully removed. Figures 9 to 12 show some examples of weld radiographswhere labels on the image were successfully removed.
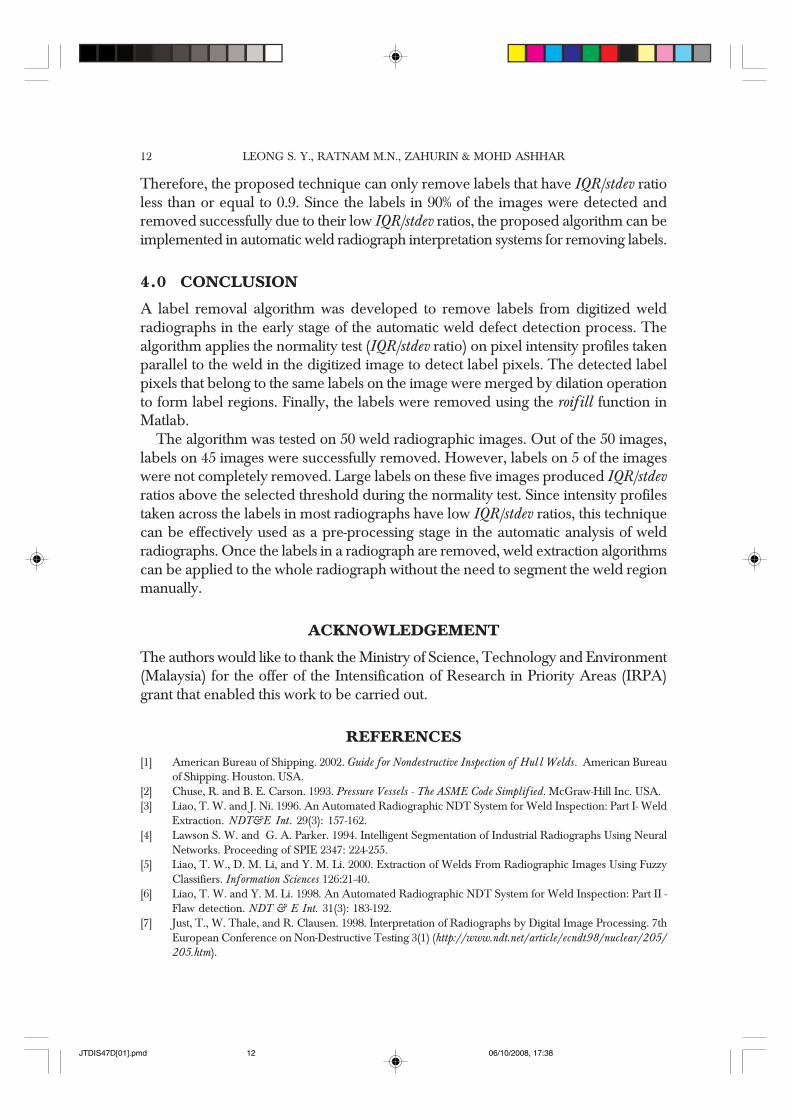
However, out of the 50 weld radiographs tested labels on 5 images were notcompletely removed, such as the one shown in Figure 13. For this example, thealgorithm was only able to remove labels located at the lower side of the weld regionbut not those located at the upper side of the weld.
The labels located at the upper side of the weld in Figure 13 were not removedbecause the IQR/stdev ratio of the pixels on the intensity profiles taken across theselabels is higher than 0.9. For instance, the intensity profile taken across the labels
JTDIS47D[01].pmd 06/10/2008, 17:3810
AUTOMATIC LABEL REMOVAL FROM DIGITIZED WELD RADIOGRAPHS 11
along j = 30 has an IQR/stdev ratio of 1.13. Since this ratio is higher that the threshold(0.9), the intensity profile was misinterpreted as a non-label profile. When the intensityprofile is taken across large labels, a large quantity of label pixels is present in theprofile. In this case, the IQR value increases due to the large intensity range betweenlabel pixels and background pixels. The increase of IQR value leads to an increase ofIQR/stdev ratio. Consequently, a high IQR/stdev ratio was noticed for intensity profilestaken across large labels, which leads to inaccuracy in the label detection algorithm.
Figure 12 Results of label removal algorithm (Sample 4) (a) original imageand (b) image after label removal
(a)
(b)
Figure 13 Example of labels remaining after application of label removal algorithm:(a) radiograph with labels and (b) labels remaining after the application oflabel removal algorithm
(a)
(b)
�����&�
'���� � ���������
jjjjj = 30
JTDIS47D[01].pmd 06/10/2008, 17:3811
LEONG S. Y., RATNAM M.N., ZAHURIN & MOHD ASHHAR12
Therefore, the proposed technique can only remove labels that have IQR/stdev ratioless than or equal to 0.9. Since the labels in 90% of the images were detected andremoved successfully due to their low IQR/stdev ratios, the proposed algorithm can beimplemented in automatic weld radiograph interpretation systems for removing labels.
4.0 CONCLUSION
A label removal algorithm was developed to remove labels from digitized weldradiographs in the early stage of the automatic weld defect detection process. Thealgorithm applies the normality test (IQR/stdev ratio) on pixel intensity profiles takenparallel to the weld in the digitized image to detect label pixels. The detected labelpixels that belong to the same labels on the image were merged by dilation operationto form label regions. Finally, the labels were removed using the roifill function inMatlab.
The algorithm was tested on 50 weld radiographic images. Out of the 50 images,labels on 45 images were successfully removed. However, labels on 5 of the imageswere not completely removed. Large labels on these five images produced IQR/stdevratios above the selected threshold during the normality test. Since intensity profilestaken across the labels in most radiographs have low IQR/stdev ratios, this techniquecan be effectively used as a pre-processing stage in the automatic analysis of weldradiographs. Once the labels in a radiograph are removed, weld extraction algorithmscan be applied to the whole radiograph without the need to segment the weld regionmanually.
ACKNOWLEDGEMENT
The authors would like to thank the Ministry of Science, Technology and Environment(Malaysia) for the offer of the Intensification of Research in Priority Areas (IRPA)grant that enabled this work to be carried out.
REFERENCES[1] American Bureau of Shipping. 2002. Guide for Nondestructive Inspection of Hul l Welds. American Bureau
of Shipping. Houston. USA.[2] Chuse, R. and B. E. Carson. 1993. Pressure Vessels - The ASME Code Simplified. McGraw-Hill Inc. USA.[3] Liao, T. W. and J. Ni. 1996. An Automated Radiographic NDT System for Weld Inspection: Part I- Weld
Extraction. NDT&E Int. 29(3): 157-162.[4] Lawson S. W. and G. A. Parker. 1994. Intelligent Segmentation of Industrial Radiographs Using Neural
Networks. Proceeding of SPIE 2347: 224-255.[5] Liao, T. W., D. M. Li, and Y. M. Li. 2000. Extraction of Welds From Radiographic Images Using Fuzzy
Classifiers. Information Sciences 126:21-40.[6] Liao, T. W. and Y. M. Li. 1998. An Automated Radiographic NDT System for Weld Inspection: Part II -
Flaw detection. NDT & E Int. 31(3): 183-192.[7] Just, T., W. Thale, and R. Clausen. 1998. Interpretation of Radiographs by Digital Image Processing. 7th
European Conference on Non-Destructive Testing 3(1) (http://www.ndt.net/article/ecndt98/nuclear/205/205.htm).
JTDIS47D[01].pmd 06/10/2008, 17:3812
AUTOMATIC LABEL REMOVAL FROM DIGITIZED WELD RADIOGRAPHS 13
[8] Bonser, G. and S. W. Lawson. 1998. Defect Detection in Partially Completed SAW and TIG Welds UsingOnline Radioscopy and Image Processing. Proceedings of SPIE: Process Control and Sensors for Manufacturing.3399: 231-239.
[9] Wang, G. and T. W. Liao. 2002. Automatic Identification of Different Types of Welding Defects in RadiographicImages. NDT&E Int. 35: 519-528.
[10] Shafeek, H. I., E. S. Gadelmawla, A. A. Abdel-Shafy, and I. M. Elewa. 2004. Assessment of Welding Defectsfor Gas Pipeline Radiographs Using Computer Vision. NDT&E Int. 37: 291-299.
[11] Chang, D. C. and W. R. Wu. 1998. Image Contrast Enhancement Based on a Histogram Transformation ofLocal Standard Deviation. IEEE Transactions on Medical Imaging. 17(4): 518-531.
[12] Mendenhall, W. and T. Sincich. 1995. Statistics for Engineering and the Sciences. Upper Saddle River, NewJersey: Prentice Hall.
[13] Russ, J. C. 1999. The Image Processing Handbook. 3rd edition. USA: CRC Press,.[14] MathWorks. 2001. Image Processing Toolbox: User’s Guide. Verison 3. The MathWorks, Inc.[15] Costa, L. F. and R. M. Cesar. 2001. Shape Analysis and Classification. CRC Press. USA.
JTDIS47D[01].pmd 06/10/2008, 17:3813