automatic laser-based identification for uf6...
TRANSCRIPT

Machine Vision and ApplicationsDOI 10.1007/s00138-011-0379-z
ORIGINAL PAPER
Automatic laser-based identification for UF6 cylinders
Jian Yao · Pierluigi Taddei · Mauro R. Ruggeri ·Gunnar Boström · Vítor Sequeira
Received: 8 March 2011 / Revised: 2 August 2011 / Accepted: 28 September 2011© Springer-Verlag 2011
Abstract We present a laser item identification system(L2IS), installed in a real facility on trial, that is capable ofautomatically monitoring all transfers of uranium hexafluo-ride (UF6) cylinders between different process areas. Eachcylinder has a unique ‘fingerprint’ represented by the 3Dmicro-structure of its surface which remains intact even underextreme environmental conditions. L2IS automatically iden-tifies each cylinder through exploring the 3D frontal surfaceacquired by the laser scanner. The system is composed of aportable unit (operated in attended mode) and a fixed installedunit (operated without inspector presence). The efficiencyand accuracy of our identification system were evaluated ona large dataset acquired during several years including a fullyear of field testing.
Keywords Nuclear safeguards · Automatic scanregistration · UF6 cylinders identification · Laser itemidentification system (L2IS)
J. Yao (B) · P. Taddei · M. R. Ruggeri · G. Boström · V. SequeiraInstitute for Transuranium Elements,European Commission-Joint Research Centre (JRC),Ispra (VA), Italye-mail: [email protected]
P. Taddeie-mail: [email protected]
M. R. Ruggerie-mail: [email protected]
G. Boströme-mail: [email protected]
V. Sequeirae-mail: [email protected]
1 Introduction
The large-size, complexity and increasing automation withinthe process areas of enrichment plants have resulted inintensive efforts to identify measures to enhance safeguardapproaches. In particular, product and tails material stored inuranium hexafluoride (UF6) cylinders enter and exit enrich-ment plants posing a substantial challenge to provide con-tinuity of knowledge on field. Currently, UF6 cylinders canonly be manually identified by steel ID plates, welded inthe surface of or riveted/bolted to the front of the cylinders,and cannot be authenticated by any reasonable method. Theneeds, existing techniques and future concepts of UF6 cyl-inders identification and monitoring have been widely pre-sented and discussed in [1–4]. The amount of work requiredto clearly identify and account for the cylinders is substan-tial since the International Atomic Energy Agency (IAEA)inspector would have to maintain a double accountancy: thefacility identification code (no possible trusted authentica-tion of the paper labelling) and the manufacturer labelling ofthe cylinder.
Exploiting existing surveillance cameras to identify UF6
cylinders is not feasible since, in general, their resolution istoo low to allow a unique identification. IAEA used ded-icated unique identification tags proposed in Laser-BasedItem Monitoring System (LBIMS) [5,6] developed at theUS Department of Energy’s Oak Ridge National Labora-tory. However, this approach has significant drawbacks:(1) tags can be tampered and (2) there is no fast, reli-able and cost-efficient way to permanently attach iden-tification tags to the cylinders. Our system (L2IS) uses3D laser acquisitions of the cylinder frontal surfaces toidentify and authenticate individual UF6 cylinders by theintrinsic, 3D spatial characteristics and irregularities of theirsurfaces. This is done through a series of preprocessing
123

J. Yao et al.
operations and an accurate registration with a set of refer-ence acquisition.
The use of three-dimensional laser scanning in the con-text of unique identification of nuclear containers has beenproposed by Bovisio et al. [7]. Laser scanning is also usedfor nuclear containment verification [8–10] as well as theverification of design information [9,11,12]. A summary ofother laser-based technologies in the context of nuclear safe-guards, including spectroscopic methods, optically stimu-lated luminescence and Lidar, can be found in [13].
The L2IS system has been successfully installed in a realfacility on trial. Its first implementation was presented in[10]. Regarding that system, we present several importantimprovements in the currently upgraded system, which canbe summarized as follows:
1. We robustly recovered the cylinder trolley speed despitelarge variations of velocity and possible temporary stops,which improves the 3D surface reconstruction accuracyof the verification cylinder. However in [10], this wassuccessfully achieved only when the trolley carrying thecylinder (see Fig. 3) moved with about constant speed.
2. We improved the robustness of the system through effi-ciently coping with noisy data (induced by intrinsicmanufacturing measurement errors of laser scanners,low/high reflectance, paper tags on the cylinder frontalsurface, etc.) and missing data.
3. We employed an outlier pruning strategy in the identifi-cation process that exploits specific characteristics of thecylinders.
4. We proposed an effective method to automatically reg-ister two normalized cylinder scans for identification by
recovering a full 6DOF (six degrees of freedom) transfor-mation, which relevantly improves the robustness of thetechnique presented in [10] only recovering the z-rotationafter normalization.
The remainder of this paper is organized as follows: Thewhole system setting is briefly described in Sect. 2. The pre-processing approaches for the acquired scans are introducedin Sect. 3. The identification step is described in Sect. 4.Finally, the experimental results are shown in Sect. 5 andconclusions are given in Sect. 6.
2 System description
The goal of the L2IS system is to uniquely identify UF6 cyl-inders through the comparison of their laser scanner acqui-sition with all reference scans recorded in a database. Toachieve an efficient and robust identification the comparisonis performed on compact and preprocessed representatives ofthe scanned surfaces, called normalized scans. Normalizedscans are computed right after the acquisition process andconstitute the fingerprints of UF6 cylinders, which are storedand used for their authentication. The system is thereforecomposed of two sub-systems described in Fig. 1:
• The referencing unit (Unit 1), which acquires the finger-print (reference scan) of a UF6 cylinders by a rotating linescanner as shown in Fig. 2. This unit is intended to createthe database of high-quality reference scans.
• The verification unit (Unit 2), which identifies the finger-print (verification scan) of a UF6 cylinders acquired by
Fig. 1 Diagram of L2IS System
123

Automatic laser-based identification for UF6 cylinders
Fig. 2 L2IS Unit 1 concept andpractice setting for referencescan acquisition
Fig. 3 L2IS Unit 2 concept andpractice setting for unattendedidentification of cylindersentering and exiting the processarea
a vertical line scanner while being transported on a railtrolley, as shown in Fig. 3. The verification unit must belocated in a well-defined ‘key position’ in order to mon-itor the cylinder movements.
For our range sensors we used the laser triangulation-based technique because it offers a highly modular solution,which allows to easily build a sensor optimized towards var-ious requirements like the working range and depth reso-lution. Other competing techniques were evaluated, such as(1) triangulation-based PSD (position sensitive detector) [14]and (2) camera + frame grabber [14]. The first one resultedless precise than ours, while the second one was more com-plicated to engineer since it was difficult to maintain the samereading speed and needed further CPU power and processingcomponents.
The acquisition process is performed by two systemunits employing different surface reconstruction techniques.Unit 1 reconstructs the scanned reference cylinders throughthe 3D calibration and reconstruction process described inSect. 3.1. Unit 2 employs a robust speed recovery method toreconstruct the verification cylinders passing in front of theacquisition device with a non-uniform velocity, as explainedin Sect. 3.2.
After the reconstruction the cylinder surfaces are normal-ized as described in Sect. 3.3. This process is to filter noise,outliers and invalid regions. In addition, a suitable weightmap is computed taking into account prior information on
the cylinder frontal surfaces and the physical characteristicsof the laser scanners.
During identification the normalized verification scan isthen matched against all the normalized reference scansstored in the database through two main steps: (1) scan regis-tration and (2) authentication. As described in Sect. 4.1, thescan registration robustly aligns two scans in a common coor-dinate system using an optimization method that relies on thenormalized 3D data and the weight maps to cope with noiseand outliers. The scan authentication estimates a dissimilaritymeasurement between the verification and a reference scanas explained in Sect. 4.2. The identification is then completedby detecting and evaluating the best authenticated referencescan.
3 Data preprocessing
To perform identification, we first need to pre-process theacquired data to obtain a clean 3D frontal surface for eachscanned cylinder. This step is performed both for the rotatingline scanner in Unit 1 and for the vertical line scanner in Unit2. Moreover, we extract additional information that are usedlater during registration and identification. These informationcomprise of the cylinder’s type, the steel ID plate location,the side profile of the frontal surface and the per-pixel acqui-sition error estimation and noisy measurement.
123

J. Yao et al.
Fig. 4 Configuration of trolleytransporting UF6 cylinders. Thevertical and horizontal linesrepresent the vertical andhorizontal laser line positions,respectively
Coordinates in the y−axis (unit: 1.2213mm)
Tim
esta
mps
(un
it: 0
.003
sec
)
Measured object surface depth (in mm)
100 200 300 400 500 600 700 800 900 1000
500
1000
1500
2000
2500
1200
1220
1240
1260
1280
1300
1320
1340
1360
1380
1400
200 400 600 800 10001000
1100
1200
1200
1250
1300
1350
1400
Coordinates in the y−axis
(unit: 1.2213mm)
Timestampsa
(unit: 0.003 sec)
C
oorid
nate
s in
the
z−ax
is−
mea
sure
d su
rfac
e de
pth
(in m
m)
Fig. 5 A typical example of the speed line raw data: (Left) the 2D map and (Right) line speed raw data at three different timestamps in 3D space
3.1 Calibration and 3D reconstruction
In Unit 1, each profile acquired by the rotating laser linescanner needs to be correctly remapped into a common 3Dcoordinate frame. This requires the knowledge of the rota-tion table position at the time of the profile acquisition, aswell as the exact position and orientation of the rotation axiswith respect to the internal coordinate system of the scanner.Since it is not realistic to mechanically measure at the sub-millimetre accuracy required the position and orientation ofthe rotation axis on the one hand and of the scanner coordi-nate system on the other hand, we employ the auto-calibrationscheme described in [9]. This is based on acquiring severalscans of a planar calibration target from different viewpointsand on estimating the calibration parameters by optimizingthe planarity of the recovered 3D reconstructions.
3.2 Robust speed recovery
In Unit 2, the fingerprint of a cylinder being transported onthe trolley is acquired by the fixed installed vertical laser linescanner as shown in Fig. 3. If the trolley moves with a knownconstant speed, we can easily reconstruct the 3D surface byconsidering the line scan data in the x–z plane and horizon-tal moving distances in the y-axis (the used data coordinatesystem is shown in Fig. 4). However, in practice, the trolleyis manually controlled by an operator and its speed is notknown in advance. To automatically recover the speed, we
employ an additional line scanner placed horizontally. Thisscanner is used to measure the position of a set of roughly(but not exactly) equidistantly distributed buttons placed onthe side front of the trolley. Figure 4 shows the configurationof the two scanners with respect to the trolley and the buttons.
To successfully reconstruct the 3D surface the two linescanners must be synchronized. In fact, we can constructthe 3D cylinder surface only by recovering the trolley’smoving distance between two adjacent sampled timestampsof the vertical line scanner, which can be interpolated fromthe accumulated y-shifts at all timestamps of the synchro-nized horizontal line scanner. We propose a robust methodto optimally estimate the accumulated y-shifts at sub-pixellevel in the following steps:
1. Noise removal and peak location. We consider theline speed raw data acquired from the horizontal line scanner(Fig. 5 shows a typical example). First, we remove noise andoutliers induced by the occluding bars in front of the cylinderas shown in Fig. 4. This is achieved by using prior informationabout approximate size and position of the circular buttons(see Fig. 4). Therefore, the position of the circular buttonsis recovered by considering the local peaks of the speed linedata at each timestamps (corresponding to each row in the2D map shown in Fig. 5). Figure 6 shows filtered speed linedata of the scan from Fig. 5, which was achieved by medianfilter and some additional operations based on prior infor-mation about approximate size and position of the circularbuttons.
123

Automatic laser-based identification for UF6 cylinders
Filtered speed line data
100 200 300 400 500 600 700 800 900 1000
500
1000
1500
2000
25001260
1265
1270
1275
1280
200400
600800
1000
9501000
10501100
11501200
12501255
1260
1265
1270
1275
1280
1285
C
oorid
nate
s in
the
z−ax
is−
mea
sure
d su
rfac
e de
pth
(in m
m)
Timestamps
(unit: 0.003 sec) Coordinates in the y−axis
(unit: 1.2213mm)
Fig. 6 Filtered speed line data. The peaks marked by stars ‘�’ correspond to circular buttons on the side front of trolley
100 200 300 400 500 600 700 800 900 1000
1260
1265
1270
1275
1280
Coordinates in the y−axis (unit: 1.2213mm)
C
oord
inat
es in
the
z−ax
is−
mea
sure
d su
rfac
e de
pths
(in
mm
)
Filtered speed line data at three discrete timestamps
Fig. 7 Filtered speed line data at three discrete timestamps. The peaksmarked by stars ‘�’ correspond to circular buttons on the side front oftrolley
2. Computing initial accumulated y-shifts. Given thespeed line data at two adjacent sampled timestamps (ti , ti+1),
we detect the corresponding peaks exploiting the priorinformation on the trolley’s maximal speed and the mini-mal distance between two adjacent buttons. Then we recoveran initial y-shift using the found peaks as
yshift(ti , ti+1) = 1
Np
Np∑
k=1
(yi+1(p′
k) − yi (pk)), (1)
where (p, p′) denotes a pair of corresponding peaks at time-stamps ti and ti+1, Np denotes the number of correspondingpeak pairs and yi (p) denotes the y-coordinate of the peakp at ti . Figure 7 shows filtered speed line data at three dis-crete timestamps with some time gap in 2D space where thecorresponding peaks can be easily detected.
Therefore, the initial accumulated y-shift yshift(ti ) at tiw.r.t. the starting timestamp t0 is computed asyshift(ti ) = yshift(ti−1) + yshift(ti−1, ti ). For referencing, wedefine yshift(t0) = 0.
3. Locally optimizing y-shift between two giventimestamps. The recovered profile of the horizontal linescanner may not lay on a single depth. This is due to therelative slight inclination of the scanner w.r.t. the rail’s direc-tion.
An example of this effect on the filtered speed linedata at a typical timestamp is shown in Fig. 8a. To solvethe problem we employ the derivative depths zi (y) insteadof the absolute depth zi (y). We define zi (y) at each dis-crete y position using the central difference approximation:zi (y) = zi (y+wh)−zi (y−wh)
2whwhere wh is the approximation
window half size and zi (y) denotes the measured surfacedepth w.r.t. the horizontal line scanner at the y position andthe timestamp ti . Figure 8b shows the derivative depths ofthe example shown in Fig. 8a, such that the optimal y-shiftyshift(ti , t j ) between two discrete timestamps ti and t j can
Fig. 8 Derivative depthsat a typical timestamp
200 400 600 800 1000
1260
1265
1270
1275
1280(a)
y−coordinates (unit: 1.2213mm)
Mea
sure
d ob
ject
sur
face
200 400 600 800 1000−3
−2
−1
0
1
2
3(b)
y−coordinates (unit: 1.2213mm)
Der
ivat
ive
dept
hs (
in m
m)
dept
hs (
in m
m)
123

J. Yao et al.
Fig. 9 a Differences betweenlocally and globally optimizedaccumulated y-shifts;b Recovered local movingspeeds (mm/s) of a trolley.Notice that the trolley wasmoving at a roughly constantspeed at the beginning, thenslowed down and finallyaccelerated
500 1000 1500 2000 25000
0.5
1
1.5
2
2.5
3
Differences between locally and
Timestamps (unit: 0.003 sec)
500 1000 1500 2000 2500100
150
200
250
300
350
400
450
500Trolley’s moving speeds (mm/sec)
Timestamps (unit: 0.003 sec)
(a) (b)globally optimized y−shifts (in mm)
be efficiently estimated by minimizing the following costfunction:
yshift(ti , t j ) = argminyshift(ti ,t j )
z2sum(ti , t j , yshift(ti , t j )), (2)
where z2sum(ti , t j , yshift(ti , t j )) = ∑Ny−1
y=0
(zi (y) − z j (y +
yshift(ti , t j )))2 where Ny denotes the number of discrete y
positions and the linear interpolation is used to obtain thederivative depth z j (y + yshift(ti , t j )). Eq. (2) is solved usinga least square optimization such as the Levenberg–Marquardt(LM) optimization algorithm. We provide as starting solutiony-shift yshift(ti , t j ) = yshift(t j ) − yshift(ti ). Note that we usethe filtered speed line data during the optimization.
4. Globally optimizing accumulated y-shifts at alldiscrete timestamps. To find the optimal accumulated y-shifts at all discrete timestamps, we initially select thelargest set of M sampled timestamps {tkm }M−1
m=0 satisfyingtkm+1 − tkm ≥ tth where tth denotes the minimal time betweentwo sampled timestamps (tth = 2 s was used in our system).Starting from a set of locally optimized accumulated y-shifts{yshift(tkm )}M−1
m=0 achieved by minimizing Eq. (2), we recoverthe globally optimized accumulated y-shifts at these sam-pled timestamps by minimizing the following coupled costfunction:
{y′shift(tkm )}
= argmin{yshift(tkm )}
L∑
l=1
M−1−l∑
m=0
z2sum
(tkm , tkm+l , yshift(tkm , tkm+l )
),
(3)
where yshift(tkm , tkm+l ) = yshift(tkm+l ) − yshift(tkm ), the func-tion z2
sum(•) has the same meaning as in Eq. (2) and L denotesthe maximal gap between two discrete sampled timestamps(L = 4 was empirically used in our system according tothe maximal moving speed of the trolley). Figure 9a showsthe differences between the globally optimized accumulatedy-shifts {y′
shift(tkm )} and their corresponding initial values{yshift(tkm )}. All discrete timestamps {ti } between two adja-cent sampled timestamps tkm and tkm+1 can be optimally
recovered by minimizing the following cost function:
y′shift(ti ) = argmin
y′shift(ti )
(z2
sum
(tkm , ti , y′
shift(tkm , ti ))
+ z2sum
(ti , tkm+1 , y′
shift(ti , tkm+1)) )
, (4)
where y′shift(tkm , ti )= y′
shift(ti )−y′shift(tkm ) and y′
shift(ti , tkm+1)
= y′shift(tkm+1) − y′
shift(ti ). Figure 9b shows the final localmoving speeds of a trolley computed from optimized accu-mulated y-shifts {y′
shift(ti )}.
3.3 Scan normalization
After the calibration (for reference scans) or speed recov-ery (for verification scans) we obtain a correct 3D surfaceas shown in Figs. 10a, c respectively. The frontal surface’sposition and orientation are still arbitrary because the rel-ative position and orientation between the scanner and thecylinder may vary at each acquisition. Therefore, as a finalpreprocessing step, the surface needs to be normalized in sucha way that a direct comparison between two scans becomespossible. Besides verification of position and orientation ofcylinder frontal surface, we also remove noisy points andinvalid regions. Moreover, for each point, we estimate a suit-able weight according to the prior information of the cyl-inder frontal surface and the physical characteristics of theline laser scanner. These point weights will be used for laterregistration between two scans. Thus, each scan will be nor-malized by the following steps:
1. Cylinder rim plane and circle fitting. We initiallyidentify points lying on the rim of the cylinder front, which,ideally, would form a circle by using morphology operators.Then, we use the robust fitting algorithm RANSAC [15] tofit a parametric model of a plane in 3D to the identified rimpoints. This step is followed by another RANSAC optimiza-tion to fit a parametric model of a circle to the projected rimpoints onto the fitted plane. The circle radius can be used fora first sanity check and for determining the type of cylinder(30B, IPC and 48Y) because the rim radii of the differentcylinder types are known in advance. If the radius is valid,then we apply a rigid 3D transformation to the scan to align
123

Automatic laser-based identification for UF6 cylinders
Fig. 10 3D laser raw scans(Left) and normalized scans(Right) of a reference UF6cylinder acquired in Unit 1 (Top)and a verification UF6 cylinderacquired in Unit 2 (Bottom). TheID plate, paper tags and valvescan be clearly seen
the plane of the circle with the x–y plane and the circle centerwith the origin.
2. Accurate central location of cylinder surface. Theabove rim circle fitting is not precise enough for the subse-quent registration. This is due to the fact that we employ onlya small set of points belonging to the cylinder rim dependingon the position and orientation of the scanner (which may bedifferent while acquiring different cylinders).
We use the axial symmetry of the cylinder surface to accu-rately locate its centre. For this operation we exploit all thepoints lying on the cylinder surface providing a more robustsolution. After the initial transformation the surface’s centrec = (cx , cy, cz)
� lays on the z-axis (i.e., cx = cy = 0). LetS = {pi } be the set of transformed scanned 3D points on thecylinder surface. Let C(r, rth) = {pi
∣∣pi ∈ S, |γ (pi ) − r | ≤rth} be the set of 3D points lying around a circle with radius r
in the x–y plane where γ (p) =√
(px − cx )2 + (py − cy)2
and rth is a very small threshold. If the centre of cylinder sur-face is perfectly located, all points in C(r, rth) should lay ona common z-plane, i.e., the points in C(r, rth) have very simi-lar z-coordinates because the cylinder surface is symmetricalw.r.t. the centre c. We exploit this observation to recover amore accurate surface’s centre by conducting a least squareminimization of the following cost function:
c = argminc
Ns∑
s=1
∑
p∈C(rs ,rth)
(pz − zs)2, (5)
where zs denotes the median of z-coordinates of points inC(rs, rth). Note that we iteratively select Ns sampled sets{C(rs, rth) ∈ S}Ns
s=1 with fixed radii {rs} in the optimization
process. Moreover, in Eq. (5), we only optimize the x- andy-coordinates of the surface centre. However, if the rim planeis not perfectly aligned with the x–y plane, the surface centrecannot be correctly located. To improve the result, we iter-ate the RANSAC step that detects the rim plane and the rimcircle and the least square optimization to detect the centrallocation. Finally, we retain the solution with the minimal costdefined in Eq. (5).
As final step, starting from the optimal position we applya rigid 3D transformation to make sure that the centre c lieson the z-axis (i.e., cx = cy = 0).
3. Noise and valve region removal. Scan acquired in Unit2 may contain occluded regions due to the presence of sup-porting bars on the side of the trolley as shown in Figs. 3and 4. Data measured close to these missing regions are notreliable. We remove them using a horizontal erosion filterfrom identified occlusion boundaries. In addition, we auto-matically remove the valves (see Fig. 10) of UF6 cylindersbased on their approximate positions and sizes.
4. ID plate location and vertical orientation rectifica-tion. Most UF6 cylinders mount a steel ID plate on the frontalsurface as shown in Fig. 10. These plates can be classifiedinto two types: the first one is a thin plate welded roughlyat the center of the surface (see Fig. 10a); the second one,riveted/bolted to the front of the cylinders, is flat and sepa-rated from the cylinder surface (see Fig. 10c).
We propose an efficient approach to robustly locate bothtypes of ID plate regions. We can easily identify these twotypes by first uniformly quantising the 3D points in the y–zplane and then locating the points belonging to the secondtype of ID plates by blob filtering. For the first type of ID
123

J. Yao et al.
Fig. 11 Detection and verticalrectification of ID plate:(a) range image; (b) inclinationmap; (c) inclination maskimage; (d) vertically rectifiedmask image with candidate rowsand columns
(a) Range image (depths in mm)
50 100 150 200 250 300 350
50
100
150
200
250
300
350 125
130
135
140
145
150
155Inclination map (in degrees)(b)
50 100 150 200 250 300 350
50
100
150
200
250
300
350
10
20
30
40
50
60
70
Inclination mask image(c)
50 100 150 200 250 300 350
50
100
150
200
250
300
350
Vertically rectified image with candidate lines(d)
100 200 300 400
50
100
150
200
250
300
350
400
Surface’s centre
plates, we first generate a 2.5D range image Rs from the3D scan by uniformly quantising the 3D points in the x–yplane and estimating the depths by surface fitting as shown inFig. 11a. Then we compute an inclination map (see Fig. 11b)from this range image.
We know that these ID plates are rectangle and theirboundaries generally present little higher inclination asshown in Fig. 11b. Thus we can obtain a mask image Mcovering most of boundaries by setting a suitable incli-nation threshold (25o was used in our system) and thenapplying a suitable dilation filter as shown in Fig. 11c.We can vertically rectify the z-orientation in the x–y planeto make sure that the boundaries of central ID plates are par-allel to the x- or y-axis by maximizing the following costfunction:
θz = argmaxθz
(max(H−1
row(Mθz )) + max(H+1row(Mθz ))
+ max(H−1col(Mθz )) + max(H+1
col(Mθz ))), (6)
where Mθz denotes the mask image generated from therotated range image with the rotation angle θz onRs,Hrow(•)
and Hcol(•) denote the sums of rows and columns of themask image, and the superscripts ‘−1’ and ‘+1’ denote thetwo sides of the surface centre, respectively. By optimizingEq. (6) it is possible to recover the mask boundaries corre-sponding to the four sides of the rectangular ID plate. How-
ever, we cannot rely on the mask boundary for the followingreasons. First the presence of outlier may result in a wrongestimation. In addition, due to the supporting bars in Unit 2(see Fig. 4), one of the vertical sides may be occluded in thefinal scan. To solve the problem we detect all candidate rowsand columns of the mask image M
θzthat have enough mask
points and represent local peaks in the horizontal (row) andvertical (column) directions as shown in Fig. 11d. Then webrutally test all combinations of rows and columns in whichthere exist at least three sides of a rectangular ID plate andthe surface centre lies inside the found rectangle. We retainas best rectangular boundaries of the ID plate the ones thatcover as many mask points as possible and at the same timethe ones that cover as few invalid or occluded points as pos-sible. Figure 12 shows several typical detection cases of thesecond type of ID plates on verification and reference scans.To perform a vertical rectification of the first type of ID platewe employ a similar optimization of Eq. (6) with minor mod-ifications. At the end of the normalization the position andorientation of the cylinder surface are rectified in a roughlycommon coordinate frame. The frontal surface of the cylin-der is parallel to the x–y plane and the surface centre lies onthe z-axis. Figure 10b, d shows the normalized representa-tion of the scans from Fig. 10a, c, respectively. The collarhas been removed because it is not used for the subsequentinspection and identification steps.
123

Automatic laser-based identification for UF6 cylinders
Fig. 12 Detection results of ID plates on several typical cylinder surfaces (ID plate regions are highlighted with red colours on the inclination maps)
5. Point weights computation. To efficiently reduce theimpact of noise to later registration, we compute three dif-ferent weighting maps for each scan.
First we compute an inclination map directly from theraw scan (instead of the normalized scan). According to thephysical characteristics of laser line scanners, surface regionswith higher inclination angles w.r.t. the acquisition viewingray are less reliable. To efficiently suppress this measure-ment noise, we apply a suitable exponential function ontothe inclination map to get a inclination-based weighting mapWθ = {Wθ (p) ∈ [0, 1], p ∈ S}.
Second, we measure the axial symmetry of a cylinder sur-face. All inlier 3D points in the normalized scan are clusteredin {C(rc, rth)}Nc
c=1 sets where {rc} are equidistantly distributedradii of circles in the x–y plane (i.e., rc − rc−1 = rc+1 − rc)and rth = 1
2 (rc − rc−1). For each point p ∈ C(rc, rth), wedefine a suitable weight value by
Ws(p) = exp
(−αs
(pz − zc)2
2σ 2c
), (7)
where αs is a constant, zc has the same meaning as in Eq. (5)denoting the median of z-coordinates of points in C(rc, rth)
and the variance σ 2c = 1
|C(rc,rth)|∑
p∈C(rc,rth)(pz − zc)2 where
| • | denotes the set size. Note that, to compute Ws , we do notconsider the symmetry of points belonging to the ID plate.In order to balance Ws , we apply a suitable filter on the IDplate region to extrapolate the corresponding weights basedon some smoothness condition. Exploiting Ws, it is possibleto suppress most of the noise induced by paper tags attachedon the cylinder surface. Paper tags may be moved along thesurface, added or removed. In addition, the paper materialdeforms over time and it is, thus, unreliable. Although thethickness of paper tags is very thin, they will seriously affectthe registration result and identification measurement men-
tioned in the next Sect. 4 because we need a very high match-ing accuracy (in general, in 0.5 mm).
Finally, to suppress the noise introduced by low reflec-tance (because of the low signal-to-noise ratio) and high one(because of saturation issues), we employ a self-reprojectionerror measurement to define a suitable weighting map. Givena normalized scan S, a triangle-based cubic interpolation isused to fit surface data to generate a 2.5D range image Rs
with fixed grid spacings in the x- and y-axes. The depths ofthe range image correspond to the z-coordinates of 3D points.Given each point p ∈ S, its self-reprojection error is definedas e(p) = |pz −Rs(p)| where Rs(p) denotes the depth of thepoint p by linear interpolation on the range image. By apply-ing a suitable exponential function on the self-reprojectionerrors, we compute the self-reprojection based weightingmap Wr .
Finally, we normalize these three weighting maps of eachscan to have a similar level of magnitude. In particular,we rescale each map to make its median value equal to0.98. Finally, the combined weighting map W is definedas the geometric mean of these three weighting maps, i.e.,
W = (WθWsWr )13 . As we stated W is efficiently integrated
into the later registration framework to suppress three typesof major noise induced by high inclination, paper tags andlow/high reflectance, respectively. Figure 13 shows an exam-ple of all these weighting maps of the scan shown in Fig. 10b.
4 Scan identification
4.1 3D–2.5D scan registration
A reliable identification of a verification scan w.r.t. a set ofreference scans requires a precise measure of the difference
123

J. Yao et al.
Fig. 13 a Inclination-basedweighting map;b Symmetry-based weightingmap; c Self-reprojection basedweighting map; d Combinedweighting map
between their surfaces. This can be easily achieved if theverification scan is aligned with the current reference scan inthe same coordinate system. The alignment process is calledregistration, which mainly consists in finding the rigid trans-formation minimizing an error function between two scans.The Iterative Closest Point (ICP) algorithm [16] minimizesthe sum of squared distances between corresponding pointsand has been widely used to align two scans if a good ini-tial transformation is provided. However, one of the mainproblems of registration is to find a good initial pose (coarseregistration) from which devising a fine registration trans-formation. Experiments with several ICP variants [16–18]applied on a set of really matched normalized scans failedin most cases, for two major reasons: (1) the scan surfacedata are very simple and centrally symmetrical; (2) thereexist varying degrees of noise in the scan data. Several reg-istration algorithms were proposed in literature [19], whichmainly differ by the types of visual/geometric matching fea-tures (e.g., feature points, curves or surfaces) and methods.Considering the lack of fixed anchor features and the amountof noise in our models most of the proposed methods arenot suitable to converge to a fine registration. Thus, for ourdata approaches considering global surface information (e.g.,[20,21]) seem to be more promising to achieve good results.
In this section we present a robust 3D–2.5D registrationmethod to accurately align two normalized scans. To copewith missing features and noise, our method relies on weight-ing maps resuming the reliability of the surface points of thescans. Through data reprocessing, each scan is composed offour groups of major data: a 3D normalized scan S, a 2.5Drange image Rs of S, a 1D weighting map W and a 2.5Drange image Rw of W . The depths of Rw correspond to theweights of points in S. Given two normalized scans S and S ′,
the transformation T = (R, t), where R is a 3 × 3 rotationmatrix composing of three rotation angles θ = (θx , θy, θz)
and t is a 3 × 1 translation vector t = (tx , ty, tz)�, from S toS ′ can be optimally recovered by minimizing the weightedsum of point depth differences as
T =argminT
∑
p∈SW(p)R′
w(T p)((T p)z −R′
s(T p))2
, (8)
where W(p) ∈ [0, 1] denotes the weight value of thepoint p ∈ S, T p denotes the transformed point via T(i.e., T p = Rp + t), and (T p)z denotes the z-coordinateof the transformed point T p. R′
w(T p) and R′s(T p) rep-
resent the corresponding weight value and depth value ofthe transformed point T p in S ′, which are linearly interpo-lated from 2.5D range images R′
w and R′s of S ′, respec-
tively. The idea here is straightforward. If S and S ′ are a pairof really matched scans, the optimally recovered transfor-mation T will result in the global minimization of weightedsum of squared differences (SSD) between depths of T Sand S ′. In such a way, we easily locate the correspondingpoint p′ = ((T p)x , (T p)y,R′
s(T p))� of p ∈ S under thetransformation T where (T p)x and (T p)y denote the x- andy-coordinates of the transformed point T p. Thus, Eq. (8)is regarded as the weighted version of standard point-to-point error measure between two sets of corresponding 3Dpoints in which each pair of corresponding 3D points has thesame x- and y-coordinates. From another viewpoint, Eq. (8)can also be explained as the sum of the point-to-surfacedistances between the transformed points set {T p
∣∣p ∈ S}and the surface of the scan S ′to some extent because weintroduced the inclination-based weighting maps in the pointweights.
123

Automatic laser-based identification for UF6 cylinders
Fig. 14 Inspections of averification scan against:a a matching reference scan;b a non-matching reference scan
In practice, to avoid the optimization to stop in a localminima, we optimize the six degrees of freedom (i.e.,θx , θy, θz, tx , ty , and tz) contained in the transformationT using the following strategy: First, we independentlyoptimize the possibly maximal deviated rotation angle θz
(the rotation angles θx and θy are more accurately rec-tified by the rim plane fitting) while fixing the otherfive degrees of freedom using Eq. (8). Then we indepen-dently optimize the translation vector t, θ and tin succes-sion. Finally, we jointly optimize all the rotation anglesand translation component at the same time. In this way,the optimal solution almost always converges to a globalminima.
4.2 Identification and authentication
A reliable transformation between two scans can be recov-ered via registration. Thus, the verification scan to be matchedagainst a reference scan can be transformed by the recoveredtransformation such that the two scans can be directly com-pared to each other. We will refer to this comparison as an“inspection” of a verification scan against a given referencescan.
The task of unique identification and authentication con-sists in matching a given scan against all available refer-ence scans. It remains to be shown how a single scan Sis inspected against a single reference S ′. After normal-ization and recovery of the transformation, we can com-pute the weighted point depth differences D = {D(p) =√
W(p)R′w(T p)((T p)z −R′
s(T p))∣∣p ∈ S} between depths
of the transformed points {T p∣∣p ∈ S} and their corre-
sponding interpolation on the 2.5D range image R′s of S ′
as explained in Eq. (8) and then examine the distribution(histogram) of the found differences. If the two cylinder sur-faces were identical, then we would expect the pixel-by-pixeldifferences to be normally distributed with some small vari-ance under measurement noise alone. Our decision whetherwe will accept an inspection as a match or not is based
on a weighted percentage p(D) of pixels in the differenceimage D which lie outside of this expected normal distri-bution. Experimentally, we found a threshold pth = 0.1%to work well in practice, i.e., if no more than 0.1% (afterweighting with the absolute value of the difference) of thepixels lie outside of what we consider the normal instru-ment uncertainty, then we will accept the inspection as amatch. In experiments, we applied a 3 × 3 erosion filteron the difference map D to further suppress the impact ofnoise before the computation of the weighted percentagep(D).
Figure 14 shows the inspections of a verification scanagainst two reference scans, one matching and another non-matching. The colour of each point represents the absolutedifference |D(p)| on a scale from 0 mm (dark blue) to 1 mmor more (dark red). Figure 14a shows the situation of amatching reference: almost all pixels are in the order ofmeasurement noise of the instrument (dark to light blue).Figure 14b shows a non-matching example: even though thetwo cylinder fronts visually look indiscernible to a humanobserver, there are now much stronger deviations which can-not be explained by measurement uncertainties. Yellow andred areas are present both on the steel ID plate and across thecylinder surface.
To fast identify a scan w.r.t. a large set of referencescans, additional information can be efficiently utilizedto reject outliers (non-matching scans) before performingregistration optimization. First, the type and the size ofthe steel ID plates on the cylinder surfaces and the rela-tive shifts of their rectangular sides w.r.t. the correspond-ing cylinder surface centres can be efficiently utilized toreject outliers. Second, a side profile of the cylinder sur-face without the ID plate can be used. We know that dur-ing computation of the symmetry-based weighting map Ws
a set of median depths {zc}Ncc=1 of equidistantly distributed
circles on the x–y plane is available. This set of mediandepths is defined as the side profile of a cylinder surface.If two cylinders were identical, their surfaces should havevery similar side profiles. A weighted least squares method
123
J. Yao et al.
0 100 200 300 400 500 60050
100
150
200
250
300
Radii of circles in the x−y plane (in mm)
Med
ian
dept
hs (
in m
m)
Side profiles of cylinder surfaces
Verification ScanMatching Reference ScanNonmatching Reference Scan
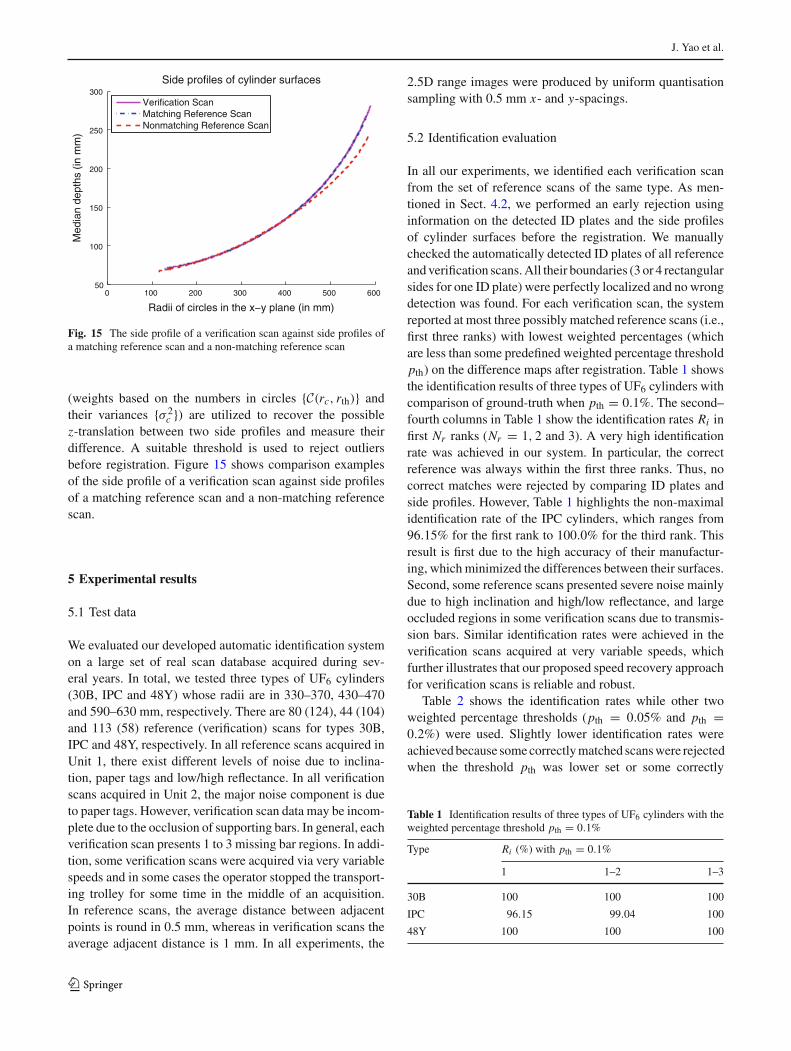
Fig. 15 The side profile of a verification scan against side profiles ofa matching reference scan and a non-matching reference scan
(weights based on the numbers in circles {C(rc, rth)} andtheir variances {σ 2
c }) are utilized to recover the possiblez-translation between two side profiles and measure theirdifference. A suitable threshold is used to reject outliersbefore registration. Figure 15 shows comparison examplesof the side profile of a verification scan against side profilesof a matching reference scan and a non-matching referencescan.
5 Experimental results
5.1 Test data
We evaluated our developed automatic identification systemon a large set of real scan database acquired during sev-eral years. In total, we tested three types of UF6 cylinders(30B, IPC and 48Y) whose radii are in 330–370, 430–470and 590–630 mm, respectively. There are 80 (124), 44 (104)and 113 (58) reference (verification) scans for types 30B,IPC and 48Y, respectively. In all reference scans acquired inUnit 1, there exist different levels of noise due to inclina-tion, paper tags and low/high reflectance. In all verificationscans acquired in Unit 2, the major noise component is dueto paper tags. However, verification scan data may be incom-plete due to the occlusion of supporting bars. In general, eachverification scan presents 1 to 3 missing bar regions. In addi-tion, some verification scans were acquired via very variablespeeds and in some cases the operator stopped the transport-ing trolley for some time in the middle of an acquisition.In reference scans, the average distance between adjacentpoints is round in 0.5 mm, whereas in verification scans theaverage adjacent distance is 1 mm. In all experiments, the
2.5D range images were produced by uniform quantisationsampling with 0.5 mm x- and y-spacings.
5.2 Identification evaluation
In all our experiments, we identified each verification scanfrom the set of reference scans of the same type. As men-tioned in Sect. 4.2, we performed an early rejection usinginformation on the detected ID plates and the side profilesof cylinder surfaces before the registration. We manuallychecked the automatically detected ID plates of all referenceand verification scans. All their boundaries (3 or 4 rectangularsides for one ID plate) were perfectly localized and no wrongdetection was found. For each verification scan, the systemreported at most three possibly matched reference scans (i.e.,first three ranks) with lowest weighted percentages (whichare less than some predefined weighted percentage thresholdpth) on the difference maps after registration. Table 1 showsthe identification results of three types of UF6 cylinders withcomparison of ground-truth when pth = 0.1%. The second–fourth columns in Table 1 show the identification rates Ri infirst Nr ranks (Nr = 1, 2 and 3). A very high identificationrate was achieved in our system. In particular, the correctreference was always within the first three ranks. Thus, nocorrect matches were rejected by comparing ID plates andside profiles. However, Table 1 highlights the non-maximalidentification rate of the IPC cylinders, which ranges from96.15% for the first rank to 100.0% for the third rank. Thisresult is first due to the high accuracy of their manufactur-ing, which minimized the differences between their surfaces.Second, some reference scans presented severe noise mainlydue to high inclination and high/low reflectance, and largeoccluded regions in some verification scans due to transmis-sion bars. Similar identification rates were achieved in theverification scans acquired at very variable speeds, whichfurther illustrates that our proposed speed recovery approachfor verification scans is reliable and robust.
Table 2 shows the identification rates while other twoweighted percentage thresholds (pth = 0.05% and pth =0.2%) were used. Slightly lower identification rates wereachieved because some correctly matched scans were rejectedwhen the threshold pth was lower set or some correctly
Table 1 Identification results of three types of UF6 cylinders with theweighted percentage threshold pth = 0.1%
Type Ri (%) with pth = 0.1%
1 1–2 1–3
30B 100 100 100
IPC 96.15 99.04 100
48Y 100 100 100
123

Automatic laser-based identification for UF6 cylinders
Table 2 Identification results of three types of UF6 cylinders with theweighted percentage threshold pth = 0.05% and pth = 0.2%, respec-tively
Type Ri (%) with pth = 0.05% Ri (%) with pth = 0.2%
1 1–2 1–3 1 1–2 1–3
30B 98.38 98.38 98.38 98.38 98.38 98.38
IPC 93.26 96.15 97.11 94.23 97.11 98.07
48Y 96.55 96.55 96.55 98.27 98.27 98.27
non-matched scans were kept when the threshold pth washigher set.
As we stated before in our previous system presented in[10] the 3D surface data of the verification scans can be accu-rately reconstructed only when the trolley carrying the verifi-cation cylinder moves with about constant speed. There existaround 30% of test verification scans acquired with differ-ent degrees of variable speeds. All these verification scanscannot be correctly identified in our previous system. Evenfor those well-reconstructed verification scans, our currentsystem achieved much higher identification rates than previ-ous one especially in the first rank through efficiently copingwith noisy and missing data and accurate registration.
The core algorithms (speed recovery, scan normalization,registration and identification) of our current L2IS systemwas implemented in Matlab without optimization and thenintegrated into the well-defined C++ GUI system. All theexperiments were executed on a 2.67 GHz Intel machine.The speed recovery for one verification scan took aroundone minute. The normalization for one reference/verificationscan took several minutes. The registration between one ver-ification scan and one reference scan was most achieved inaround one–two minutes. On our used test data set, the iden-tification of one verification scan w.r.t. all the reference scansof the same type took around half an hour because most ofreference scans were early rejected before registration.
6 Conclusions
We developed an automatic laser item identification system(L2IS), which is capable of uniquely identifying and thusmonitoring the complete flow of UF6 cylinders in enrichmentplants in an effective and efficient manner. Our identificationtechnique only depends on the cylinder’s three-dimensionalsurface structure with its intrinsic irregularities and manufac-turing tolerances. The key advantage of this approach is that itis a true “self-authentication” technique, comparable to bio-metric identification techniques for humans (fingerprinting,iris scanning, etc.). It does not rely on dedicated labels, tags,markers or the like, since attaching such dedicated identifi-cation aids is not feasible from an operational point of view
and would yield a natural attack point. Our system efficientlyovercomes some of the known problems of its predecessor[10], which enhances its effectiveness and reliability. In par-ticular, we improved the robustness of the dynamic acquisi-tion of UF6 cylinders mounted on the trolley as well as theirgeneral surface reconstruction and identification by conceiv-ing specific techniques robust with respect to noise outliersand occluded data.
The L2IS system has been successfully installed in a facil-ity on trial and was successfully evaluated on a large set ofverification and reference scans acquired from three typesof UF6 cylinders. Experiments showed the very high iden-tification rate of our system, which is maximal (1900%) for30B and 48Y cylinders and 96.15% for the IPC ones. Thenon-maximal rate demonstrated for IPC cylinders is justifiedby the high accuracy of their manufacturing, severe noiseand large area of missing data, which minimized their sur-face differences. This can be easily overcome by acquiringhigher accurate and precise scanned data for reference cylin-ders. One possible way is to scan the surface of the referencecylinder twice from different viewpoints or with differentpowers and then merge them with data of higher quality bysuppressing noise induced by high inclination and low/highreflectance.
References
1. Babcock, R.A., Whitaker, J.M., Murphy, J., Oakberg, J.: Benefitsof an international database for UF6 cylinders. In: 2008 AnnualMeeting of the INMM, Nashville, Tennessee, July 2008
2. Friend, P., Lockwood, D., Hurt, D.: A concept for a world-widesystem of identification of UF6 cylinders. In: 2009 Annual Meetingof the INMM, Tucson, Arizona, July 2009
3. Eccleston, G., Wonder, Ed.: Monitoring uranium hexafluoride(UF6) cylinders. In: ORNL/TM-2009/128, June 2009
4. White, J.L., Laughter, M.D., Whitaker, J.M.: Next steps in globalUF6 cylinders monitoring. In: Pacific Northwest International Con-ference on Global Nuclear Security, Portland, Oregon, April 2010
5. Kovacic, D., Hayes, S., Burk, D., Whitaker, M., Morgan, J.: UF6cylinders tagging system for a uranium enrichment plant. In:ORNL/TM-2006/98 (2006)
6. Laughter, M.: Safeguard application options for the laser-baseditem monitoring system (LBIMS). Tech. Rep., Oak Ridge NationalLaboratory, Oct 2008
7. Bovisio, E., Sequeira, V., Heppleston, M., Gonçalves, J.G.M.:Identification of nuclear containers using 3D laser technolo-gies. In: 25th ESARDA Symposium on Safeguards and NuclearMaterial Management (2003)
8. Sequeira, V., Busboom, A., Boström, G., Gonçalves, J.G.M.: 3Dtechnologies in safeguards applications. In: IAEA Symposiumon International Safeguards: Addressing Verification Challenges(2006)
9. Busboomm, A., Sequeira, V.: Container integrity verification usinglaser triangulation. In: SPIE-Laser Radar Technology and Appli-cations XII (2007)
10. Busboom, A., Sequeira, V., Langlands, D., Wishard, B., Poirier,S.: Laser item identification system development for a laser based
123

J. Yao et al.
identification of UF6 cylinders. In: The 29th ESARDA Symposium(2007)
11. Agboraw, E., Johnson, S., Creusot, C., Poirier, S., Saukko-nen, H., Chesnay, B., Sequeira, V.: IAEA experience using the3-dimensional laser range finder (3DLRF) for design informationverification (DIV) at the Rokkasho reprocessing plant. In: Inter-national Safeguards Symposium on Addressing Verification Chal-lenges, pp. 721–727 (2007)
12. Boström, G., Fiocco, M., Gonçalves, J.G.M., Puig, D., Sequeira,V., Chartier, B., Kiesser, R., Mariotte, F., Richard, M., Zamora,P.: 3D reconstruction in nuclear security. ESARDA Bull. 38, 17–24 (2008)
13. Haas, E., Khlebnikov, N., Monteith, A., Parise, D.: Laser-basedtechniques for IAEA safeguards detection and verification appli-cations. In: 29th ESARDA Annual Meeting (2007)
14. sensorland.com: The online information center for sensing andmeasurment. http://www.sensorland.com/
15. Fischler, M.A., Bolles, R.C.: Random sample consensus: a para-digm for model fitting with applications to image analysis and auto-mated cartography. In: Communications of the ACM, pp. 726–740(1987)
16. Besl, P.J., McKay, H.D.: A method for registration of 3-Dshapes. IEEE Trans. Pattern Anal. Mach. Intell. 14(2), 239–256 (1992)
17. Gold, S., Rangarajan, A., Lu, C.-P., Pappu, S., Mjolsness, E.: Newalgorithms for 2D and 3D point matching: pose estimation andcorrespondence. Pattern Recognit. 31(8), 1019–1031 (1998)
18. Granger, S., Pennec, X.: Multi-scale EM-ICP: a fast and robustapproach for surface registration. In: European Conference onComputer Vision (ECCV 2002). LNCS. vol. 2353, pp. 418–432.Springer (2002)
19. Matabosch, C., Salvi, J., Fofi, D., Meriaudeau, F.: Range image reg-istration for industrial inspection. In: Machine Vision Applicationsin Industrial Inspection XIII, San Jose, California, USA, January2005
20. Viola, P.A., Wells, W.M. III.: Alignment by maximization of mutualinformation. Int. J. Comput. Vis. 24(2), 137–154 (1997)
21. Umeda, K., Godin, G., Rioux, M.: Registration of range and colorimages using gradient constraints and range intensity images. Int.Conf. Pattern Recognit. 3, 12–15 (2004)
Author Biographies
Jian Yao received his M.Sc.degree in Computer Sciencefrom Wuhan University, Wuhan,Hubei, P.R. China, in 2000 andobtained his Ph.D. degree in Elec-tronic Engineering from the Chi-nese University of Hong Kong,Hong Kong, P.R. China, in 2006.He had worked in ShenzhenR&D Center of City Univer-sity of Hong Kong for 1 yearfrom 2001 to 2002. Dr. Yao hadworked in IDIAP Research Insti-tute, Switzerland, for about twoand half years from 2006 to 2008
as a postdoctoral researcher and in European Commission – JointResearch Centre (JRC) for more than 2 years from 2009 to 2011 asa researcher. Since September 2011, Dr. Yao joined in Shenzhen Insti-tutes of Advanced Technology, Chinese Academy of Sciences, Shen-zhen, Guangdong, P.R. China, as a professor. Dr. Yao has published over30 papers in the fields of computer vision, image processing, machinelearning and artificial intelligence.
Pierluigi Taddei obtained hisPh.D. degree in Computer Sci-ence from Politecnico di Milanoin 2005. He also received hisM.Sc. degree in Computer Engi-neering from the same institutionand M.Sc. degree in ComputerScience from the University ofIllinois, Chicago. He collabo-rated with multimedia compa-nies as software engineer foruser interfaces and for graphicapplications. He is currently aresearcher at the European JointResearch Centre. His research
interests include 3D reconstruction, 3D sensors, and visual odometryusing panoramic and non-central cameras.
Mauro R. Ruggeri receivedhis Ph.D. degree in Computerand Information Science fromthe University of Konstanz(Germany) in 2007. He alsoholds M.Sc. degree in Computerand Information Science fromthe University of Milan (Italy).Since 2000, he has worked inthe field of 3D data processing,3D reconstruction and computergraphics. His research inter-ests include point-based geome-try analysis and processing, 3Dmodel retrieval and point-basedgraphics.
Gunnar Boström received his M.Sc. degree in Engineering Physicsfrom the Royal Institute of Technology (KTH), Stockholm, Sweden,with a focus on Optical Systems, in 1994. Mr. Boström has workedin the industry designing measurement systems, and in 2002 he joinedthe European Commission Joint Research Centre (JRC) for developingsystems for nuclear safeguards applications.
Dr. Vítor Sequeira works for the European Commission Joint ResearchCentre (JRC) where he is Leading the Action for Nuclear Facili-ties Verification. He received his degree in Electronics and Telecom-munications Engineering from the University of Aveiro (P), 1990and a Ph.D. in 3D Reconstruction Technologies from the TechnicalUniversity of Lisbon (P), 1996. Dr Sequeira has more than 15 years ofexperience in developing laser-based verification systems for nuclearsafeguards applications. He is the Project manager of several tasks forthe International Atomic Energy Agency (IAEA) in Vienna, EuropeanCommission’s DG-ENERGY at Luxembourg, US-DoE National Lab-oratories and European research projects. Dr Sequeira has supervisedmany final year projects, M.Sc. and Ph.D. research projects in collab-oration with several European Universities and has published over 50papers in the fields of computer vision, computer graphics, robotics andartificial intelligence.
123