automatic magnetic resonance spinal cord … · automatic magnetic resonance spinal...
TRANSCRIPT
NeuroImage 83 (2013) 1051–1062
Contents lists available at ScienceDirect
NeuroImage
j ourna l homepage: www.e lsev ie r .com/ locate /yn img
Automatic magnetic resonance spinal cord segmentation with topologyconstraints for variable fields of view
Min Chen a,c,⁎, Aaron Carass a, Jiwon Oh b, Govind Nair c, Dzung L. Pham d, Daniel S. Reich b,c, Jerry L. Prince a
a Department of Electrical and Computer Engineering, The Johns Hopkins University, Baltimore, MD, USAb Department of Neurology, The Johns Hopkins School of Medicine, Baltimore, MD, USAc Translational Neuroradiology Unit, National Institute of Neurological Disorders and Stroke, Bethesda, MD, USAd Image Processing Core, Center for Neuroscience and Regenerative Medicine, Bethesda, MD, USA
⁎ Corresponding author at: Dept. of Electrical and CoHopkins University, 105 Barton Hall, 3400 N. Charles St., B
E-mail addresses: [email protected] (M. Chen), [email protected] (J. Oh), [email protected] (G. Nair), d(D.L. Pham), [email protected] (D.S. Reich), prince@j
1053-8119/$ – see front matter © 2013 Elsevier Inc. All rihttp://dx.doi.org/10.1016/j.neuroimage.2013.07.060
a b s t r a c t
a r t i c l e i n f oArticle history:Accepted 24 July 2013Available online 6 August 2013
Keywords:Atlas constructionTopology-preserving segmentationDigital homeomorphismSpinal cord segmentationMagnetic resonance imaging
Spinal cord segmentation is an important step in the analysis of neurological diseases such as multiple sclerosis.Several studies have shown correlations between disease progression andmetrics relating to spinal cord atrophyand shape changes. Current practices primarily involve segmenting the spinal cord manually or semi-automatically, which can be inconsistent and time-consuming for large datasets. An automatic method that seg-ments the spinal cord and cerebrospinal fluid frommagnetic resonance images is presented. The method uses adeformable atlas and topology constraints to produce results that are robust to noise and artifacts. Themethod isdesigned to be easily extended to new data with different modalities, resolutions, and fields of view. Validationwas performed on two distinct datasets. The first consists of magnetization transfer-prepared T2*-weightedgradient-echo MRI centered only on the cervical vertebrae (C1–C5). The second consists of T1-weighted MRIthat covers both the cervical and portions of the thoracic vertebrae (C1–T4). Results were found to be highlyaccurate in comparison tomanual segmentations. A pilot studywas carried out to demonstrate the potential util-ity of this new method for research and clinical studies of multiple sclerosis.
© 2013 Elsevier Inc. All rights reserved.
Introduction
The human spinal cord is a long thin cylindrical structure of the cen-tral nervous system (CNS) extending from themedulla oblongata to thelumbar vertebrae. It is the principal transmission pathway for neuralsignals between the brain and the rest of the body. The primary functionof the spinal cordmakes it of great importance in studying diseases thatlead to deterioration in CNS function, such asmultiple sclerosis (MS). Invivo magnetic resonance imaging (MRI) of the human spinal cord pre-sents a unique diagnostic tool in studying the progression and charac-teristics of such neurological diseases.
The usefulness of MRI based analysis of the spinal cord can be tracedas far back as Losseff et al. (1996) who demonstrated strong associationbetween spinal cord area and disability as measured by Kurtzke's Ex-panded Disability Status Scale (Kurtzke, 1983) (EDSS) (r = −0.7,p b 0.001). Since then, significant progress has been made in both theanalysis and application of MRI in spinal cord imaging. Kalkers et al.(2002) proposed usingMRI derivedmetrics to evaluate neuroprotectivetherapies. Studies from Lin et al. (2003, 2004) demonstrated that
mputer Engineering, The Johnsaltimore, MD 21218, [email protected] (A. Carass),[email protected] (J.L. Prince).
ghts reserved.
changes in edge detectability of the spinal cord boundary are relatedto changes in clinical disability. More recent work (Rocca et al., 2011;Zackowski et al., 2009) has shown the potential of using quantitiesderived from various imaging modalities as biomarkers to characterizepatients with MS. Other studies (Freund et al., 2011) have shown thatcross-sectional area of the spinal cord is well correlated with corticalactivity.
A common requirement for these studies is a full or partial segmenta-tion of the spinal cord (see Fig. 1) for each subject in the study. Such seg-mentations are currently performed manually or semi-automatically byhuman raters, which create two immediate disadvantages. First,human raters are prone to unintended biases and inconsistency in theirwork. This is particularly common when segmenting small structuressuch as the spinal cord, and is evident when replicating a segmentationof the same image or comparing between two separate raters. Second,raters require extensive training and time to perform the task. This im-poses a strict limitation on the scale of future studies and produces po-tentially long delays between acquiring the data and completing theanalyses.
There have been several attempts (Archip et al., 2002; Burnett et al.,2004; Karangelis and Zimeras, 2002; Nyúl et al., 2005) to automate thesegmentation of the spinal cord in computed tomography (CT) imaging.However, suchmethods are limited by a lack of soft tissue contrast in CT,making it difficult to distinguish between the spinal cord itself and thesurrounding cerebrospinal fluid (CSF). Most approaches are restricted

Fig. 1. The center image is an illustration of a spinal cord. The left hand column shows(center) magnetization transfer-prepared T2*-weighted gradient-echo and (top and bot-tom) T1-weighted axial cross-sections of spinal cordMRIs and correspondingmanual seg-mentations. The right-most column shows a sagittal slice of a T1-weighted MRI with afield of view covering the cervical and portions of the thoracic vertebrae. The green linein both the illustration and the sagittal slice on the right demarks the separation betweenthe cervical and thoracic vertebrae.
1052 M. Chen et al. / NeuroImage 83 (2013) 1051–1062
to segmenting only the spinal canal, which is insufficient for analysis ofspinal cord atrophy. This, in addition to concerns for patient safety,makes MRI a superior choice for imaging the spinal cord. However,MR imaging is not without its own difficulties. Inhomogeneities in re-ceiver coil sensitivity can manifest as spatially distributed intensitybiases. Susceptibility may create artifacts in the spinal cord proximalto the posterior fossa region (McGowan and Patel, 2000). Image qualityis also degraded by truncation artifacts (Czervionke et al., 1988), ghost-ing artifacts from the heart and great vessels (Bronskill et al., 1988;Curtin et al., 1989; Hinks and Quencer, 1988; Levy et al., 1988) and con-trast (Lycklama et al., 2003). Non-uniformity correction is particularlyimportant for acquisitions from phased-array coils used to assess spinalcord atrophy (Lin et al., 2004).
These drawbacks have delayed the development of fully automatedMR spinal segmentation tools. As such, the majority of the methodspresented thus far to address this problem have been semi-automatedin nature (Coulon et al., 2002; Horsfield et al., 2010; McIntosh andHamarneh, 2006; Nieniewski and Serneels, 2002; Van Uitert et al.,2005). These approaches vary from the watershed based (Nieniewskiand Serneels, 2002) to applications of deformable models (McIntoshand Hamarneh, 2006). To the best of our knowledge there are onlythree fully automatic methods in the literature for human MRI spinalcord segmentation (Koh et al., 2010, 2011; Mukherjee et al., 2010).Koh et al. (2010) developed a gradient vector flow (Xu and Prince,1998) magnitude approach as part of a computer-aided diagnosis(CAD) system. Their algorithm estimates the spinal cord using themag-nitude of the gradient vector flow edge map, followed by a connectedcomponent analysis to remove any holes in the segmentation. In Kohet al. (2011), the same group developed a different approach tothe problemusing active contourmodels (Kass et al., 1988) based on sa-liency maps. Mukherjee et al. (2010) also applied an active contour ap-proach, but instead evolved an image gradient based, open-endedcontour using dynamic programming-based energy-minimization.They initialize their method using an estimation of the vertebra bonecontour in each 2D slice of the image, which is found using an optimalshortest path directed graph search based on gradient magnitude andgradient orientation. These 2D contours are then evolved under an ac-tive contour model that minimizes an energy based on the symmetry
of the contour and the smoothness between successive contours (i.e.,contours on adjoining 2D slices).
A common deficiency with current automated algorithms is theirlimitation to both a single MR-sequence and a particular field of view.The three existing methods mentioned above are designed to be usedwith T2 and T2*-weighted MRIs because it offers the best soft tissuecontrast (Koh et al., 2010, 2011; Mukherjee et al., 2010). None of themprovide an intuitive and easily generalized approach for addressingMR-sequences or fields of view outside of the particular dataset theywere designed for. This is problematic in spinal cord MR imaging be-cause data is generally only collected across specific subsections of thespinal cord, and the MR-sequence is rarely standardized betweendatasets. Addressing these limitations is one focus of our work.
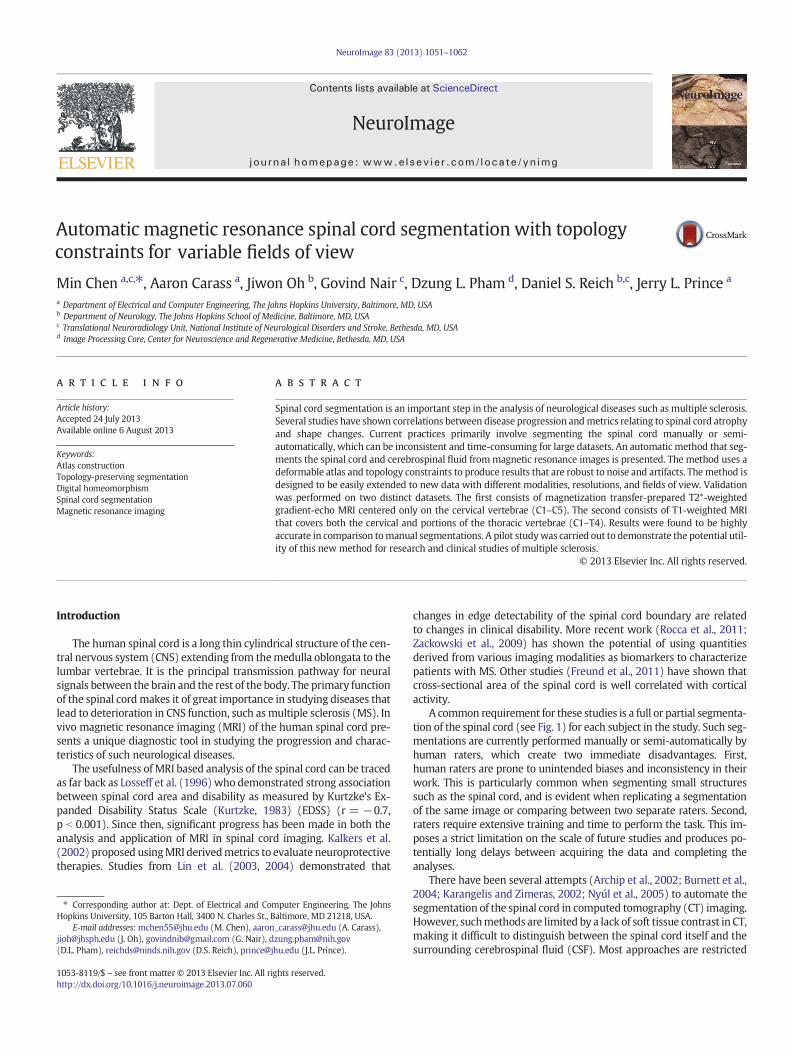
There are various reasons why existing image segmentation tech-nologies cannot be readily applied to spinal cord MRIs. For example,the structure of the spinal cord makes typical atlas-based registrationhighly inaccurate. This happens for two reasons; first, the long thin cy-lindrical nature of the spinal cord and its small size relative to theneck and torso lead to the spinal cord contributing only minimally tothe overall cost function of a registration algorithm. This typically causesthe registration algorithm to prioritize the alignment of other structuresover the spinal cord during the optimization. Second, the spinal cord is aflexible non-rigid structure, which results in a large degree of variabilityin both the shape and curvature of the structure inMRIs (see Fig. 2). Thisvariability removes rigid and affine registrations as viable choices for thetransformation. Even for free-formdeformable registration the accuracyis dramatically limited due to the large deformations often required toproperly align the curvatures. This is particularly true for registrationwith strict regularization constraints on the deformation.
Unsupervised intensity based segmentations encounter a differentset of problems. They are prone to misclassification due to the partialvoluming of nerve roots and the strong intensity inhomogeneitiesfrom the spine coils. The inhomogeneity from the surface coil is primar-ily a result of the MR signal dropping-off for tissues further away fromthe coils. However, the problem is exacerbated by the curvature of thespinal cord. Since the cord is not parallel to the coils, the anatomy inter-acts with the intensity inhomogeneity unevenly. As a result, intensityvalues along the spinal cord are inconsistent and depend on its curva-ture during acquisition. This effect is particularly evident for images cov-ering large fields of view, where both the distance from the coil and thecurvature of the spinal cord is larger. Fig. 3 shows an example of an ax-ially acquired magnetization transfer-prepared T2*-weighted gradient-echo image and a sagittally acquired T1-weighted MRI of the spinalcord, each from separate subjects. Both images have been segmentedwith a fuzzy c-means (Bezdek, 1980) approach (Pham, 2001) which in-cludes gain field correction and regularization. We see that the spinalcord could not be properly segmented in any of the cases, includingthose where the image was manually truncated to include only the spi-nal cord and CSF. The intensity drop-off seen in the examples could notbe handled by the inhomogeneity correction built into the classificationalgorithm, nor by preprocessingwith N3 (Sled et al., 1998), an intensitynon-uniformity correction tool commonly used in whole head MRI.
In this work we present a fully automated spinal cord segmentationalgorithm that combines deformable registration with topology pre-serving intensity classification. Our approach is built upon a methodby Bazin and Pham (2008), which uses a topological and statisticalatlas in the fuzzy c-means model to classify tissues in the brain. We in-troduce a topological atlas that is appropriate for the spinal cord, and astatistical atlas that is dynamically adjusted to match its variability. Inaddition, we augment the framework with an intensity atlas that isused with deformable registration to allow the atlases to be properlyinitialized. Finally, we present a rapid approach for generating the nec-essary topology and statistical atlases from a single manual segmenta-tion. This provides a quick and automatic procedure for adapting ourmethod to better match datasets with very different fields of viewsand MR-sequences (e.g., T1-weighted and T2*-weighted). An early
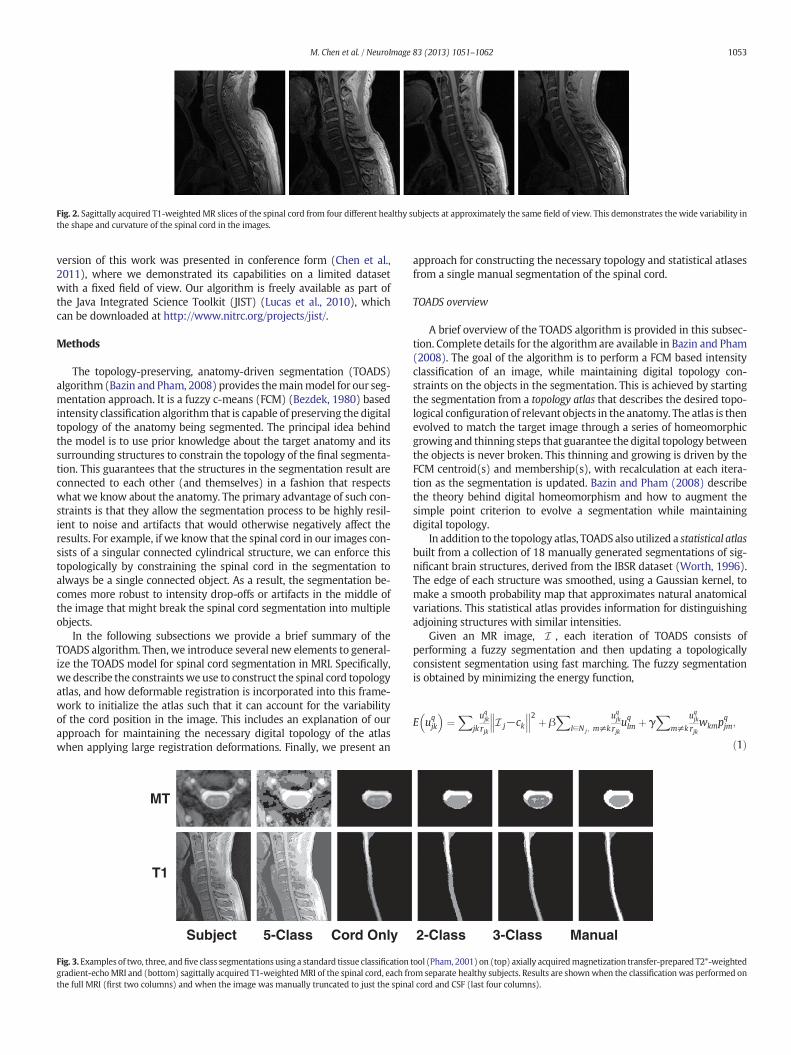
Fig. 2. Sagittally acquired T1-weighted MR slices of the spinal cord from four different healthy subjects at approximately the same field of view. This demonstrates the wide variability inthe shape and curvature of the spinal cord in the images.
1053M. Chen et al. / NeuroImage 83 (2013) 1051–1062
version of this work was presented in conference form (Chen et al.,2011), where we demonstrated its capabilities on a limited datasetwith a fixed field of view. Our algorithm is freely available as part ofthe Java Integrated Science Toolkit (JIST) (Lucas et al., 2010), whichcan be downloaded at http://www.nitrc.org/projects/jist/.
Methods
The topology-preserving, anatomy-driven segmentation (TOADS)algorithm (Bazin and Pham, 2008) provides themainmodel for our seg-mentation approach. It is a fuzzy c-means (FCM) (Bezdek, 1980) basedintensity classification algorithm that is capable of preserving the digitaltopology of the anatomy being segmented. The principal idea behindthe model is to use prior knowledge about the target anatomy and itssurrounding structures to constrain the topology of the final segmenta-tion. This guarantees that the structures in the segmentation result areconnected to each other (and themselves) in a fashion that respectswhat we know about the anatomy. The primary advantage of such con-straints is that they allow the segmentation process to be highly resil-ient to noise and artifacts that would otherwise negatively affect theresults. For example, if we know that the spinal cord in our images con-sists of a singular connected cylindrical structure, we can enforce thistopologically by constraining the spinal cord in the segmentation toalways be a single connected object. As a result, the segmentation be-comes more robust to intensity drop-offs or artifacts in the middle ofthe image that might break the spinal cord segmentation into multipleobjects.
In the following subsections we provide a brief summary of theTOADS algorithm. Then, we introduce several new elements to general-ize the TOADS model for spinal cord segmentation in MRI. Specifically,we describe the constraintswe use to construct the spinal cord topologyatlas, and how deformable registration is incorporated into this frame-work to initialize the atlas such that it can account for the variabilityof the cord position in the image. This includes an explanation of ourapproach for maintaining the necessary digital topology of the atlaswhen applying large registration deformations. Finally, we present an
MT
T1
Subject 5-Class Cord Only
Fig. 3.Examples of two, three, andfive class segmentations using a standard tissue classificationgradient-echoMRI and (bottom) sagittally acquired T1-weightedMRI of the spinal cord, each frthe full MRI (first two columns) and when the image was manually truncated to just the spina
approach for constructing the necessary topology and statistical atlasesfrom a single manual segmentation of the spinal cord.
TOADS overview
A brief overview of the TOADS algorithm is provided in this subsec-tion. Complete details for the algorithm are available in Bazin and Pham(2008). The goal of the algorithm is to perform a FCM based intensityclassification of an image, while maintaining digital topology con-straints on the objects in the segmentation. This is achieved by startingthe segmentation from a topology atlas that describes the desired topo-logical configuration of relevant objects in the anatomy. The atlas is thenevolved to match the target image through a series of homeomorphicgrowing and thinning steps that guarantee the digital topology betweenthe objects is never broken. This thinning and growing is driven by theFCM centroid(s) and membership(s), with recalculation at each itera-tion as the segmentation is updated. Bazin and Pham (2008) describethe theory behind digital homeomorphism and how to augment thesimple point criterion to evolve a segmentation while maintainingdigital topology.
In addition to the topology atlas, TOADS also utilized a statistical atlasbuilt from a collection of 18 manually generated segmentations of sig-nificant brain structures, derived from the IBSR dataset (Worth, 1996).The edge of each structure was smoothed, using a Gaussian kernel, tomake a smooth probability map that approximates natural anatomicalvariations. This statistical atlas provides information for distinguishingadjoining structures with similar intensities.
Given an MR image, I , each iteration of TOADS consists ofperforming a fuzzy segmentation and then updating a topologicallyconsistent segmentation using fast marching. The fuzzy segmentationis obtained by minimizing the energy function,
E uqjk
� �¼
Xjk
uqjk
rjkI j−ck
������2 þ β
Xl∈N j ; m≠k
uqjk
rjkuqlm þ γ
Xm≠k
uqjk
rjkwkmp
qjm;
ð1Þ
2-Class 3-Class Manual
tool (Pham, 2001) on (top) axially acquiredmagnetization transfer-prepared T2*-weightedom separate healthy subjects. Results are shownwhen the classification was performed onl cord and CSF (last four columns).

1054 M. Chen et al. / NeuroImage 83 (2013) 1051–1062
with respect to amembership function, ujkq for each voxel j inI, and eachstructure k being segmented. The parameter q controls the “hardness”or “fuzziness” of the membership functions and is usually set to betwo (Pham, 2001).
The three termson the right side of Eq. (1) can be explained as follows.1) The first term is a data term that compares the intensity I j at eachvoxel against the intensity centroids ck for each structure, where the dif-ferences are weighted by the membership functions for that voxel.2) The second term enforces the smoothness of the membership func-tions. 3) The third term controls the influence of the statistical atlas,which provides the prior probability pjk that a voxel j begins inside struc-ture k. These atlas probabilities are weighted by wkm, which are distancemeasures between the centroids, ck and cm, of two classes; it is designedto be one when ck = cm and decays to zero as ||ck − cm|| → ∞. The vari-ables β and γ in Eq. (1) are weights on the relative importance of eachterm, while rjk takes into account the global and local relationships be-tween structures.
The digitally homeomorphic thinning and growing of the topologyatlas are performed using a fast marching approach (Sethian, 1999).The thinning aims to remove errors from misalignment of the atlas tothe image by only keeping high membership voxels. Then the growingstep expands the skeletally thinned structures until all boundary voxelsare in contact. In thismanner, the segmentation capturesmore details ofthe structure boundaries at each iteration while retaining the topologyof the atlas. The algorithm is assumed to converge when either thechange in the energy function drops below a suitable threshold or amaximum number of iteration is reached.
Extending TOADS for the spinal cord
The flexibility of the TOADS algorithm allows the model to beadapted for the spinal cord; however, wemust overcome several limita-tions in the existing framework. First, we must construct a set of topol-ogy and statistical atlases that are anatomically meaningful in thecontext of the spinal cord and have the flexibility to handle all possiblefields of view. Unlike brain imaging where the whole brain is usuallyimaged, spinal cord MRIs tend to have limited fields of view that gener-ally do not cover the entire cord. This results in possible artificial breaksin the topology when the image ends part way through the cord. Thisneeds to be accounted for during both the construction and the initiali-zation of the topology atlas. Second, TOADS assumes that the brain im-ages have been skull-stripped, e.g., via Carass et al. (2011), prior torunning the algorithm. The absence of non-brain tissue allows TOADSto rigidly register the topology atlas directly to theMRI for initialization.This is clearly not possible in our case, since our primary goal is to sep-arate the spinal cord and CSF from the rest of the image. Hence, wemustwork with the surrounding tissue in the MRI, which makes registeringthe topology atlas (a segmentation image) to theMRI highly unreliable.In addition, the varied curvature of the spinal cord prevents a rigid, oreven affine, transformation from providing an adequate initialization.The following sections will describe our solutions to these twoproblems.
Spinal cord topology and statistical atlases
The topology atlas serves as the topological rule set for the objectsbeing segmented in our algorithm. In our model for the spinal cord,this atlas only contains three objects: 1) the spinal cord with sphericaltopology; 2) the CSF with a spherical shell topology; and 3) a “wrapper”object also with a spherical shell topology. The wrapper object serves asa catch-all object for any structures that immediately surround the spinalcanal, including the vertebrae and surrounding muscles. Since it encom-passes several tissue types, it covers awide range of image intensities. Itsprimary purpose is to provide a boundary that prevents the CSF objectfrom extending past the spinal canal. Everything outside the wrapper
object is treated as background. We represent the topological relation-ships between these objects with just two basic assumptions:
1. The spinal cord is completely surrounded by the CSF.2. The union of the CSF and spinal cord is completely surrounded by the
wrapper object.
Fig. 4 shows examples of this atlas for a sagittally acquired T1-weighted MRI dataset. We note that in our atlas, the CSF forms a “cap”on the top and bottom of the spinal cord, which is not anatomically cor-rect. This is done because the field of view of the MRI forces a cutoff atthe superior and inferior edges of the images. Hence, we mustcompletely cap the ends of the spinal cord object with the CSF objectin order to prevent the background and wrapper objects from beingconnected to the spinal cord. Otherwise, those objectswould be allowedto evolve in between the CSF and spinal cord, effectively separating thetwo objects, which we know should not happen. Similarly, the wrapperobject completely surrounds the CSF object to enforce a similar topolo-gy. Both of these artificial caps are added outside the field of view andremoved at the end of the algorithm. Thus, they do not interfere withthe accuracy of the segmentation at the boundaries.
In addition to the topology atlas, a statistical atlas is used to defineprobabilistic priors on the locations of objects in the topology atlas.This is created by taking multiple spinal cord MR images anddeformably registering them to a common template. Manual segmenta-tions of the structures in eachMR image are then transformed using thesame deformation. This provides an empirical calculation for the proba-bility of each object occurring at each voxel in the template space. Theresulting probabilities are Gaussian-smoothed to reduce discrete drop-offs in the atlas (Bazin and Pham, 2008). Fig. 4 shows a statistical atlasfor the spinal cord, CSF andwrapper objects, constructed from fiveman-ual segmentations. In the Automated atlas construction section we pro-vide an automatic andmore efficient approach for constructing both thetopology and statistical atlases from only a singlemanual segmentation.
Incorporating deformable registration into TOADS
Creating these two spinal cord specific atlases is still not sufficient todirectly apply TOADS for spinal cord segmentation.We also need a newway to initialize the atlases, since the original TOADS relies on a rigid ini-tialization, which cannot fully capture the variability of the spinal cord.To address this limitation,we replace the rigid alignment stepwith a de-formable registration. Unfortunately, this replacement results in twonew difficulties. First, deformable registration between a segmentationimage (the topology atlas) and the MRI is highly unreliable. This isdue to the segmentation image containing only a few structures, eachwith homogeneous intensity, while the MRI includes all the tissue sur-rounding the spinal cord, and contains noise and artifacts. This makesit extremely difficult to find the correct correspondences betweenthese two types of images during registration. The small size of the spi-nal cord relative to the entire image also contributes to the difficulty.
Our solution to this is to introduce an intensity atlas into the TOADSframework. This atlas is directly associatedwith the objects in the topol-ogy atlas, and inmost caseswill be the underlyingMRI that the topologyatlaswas constructed from. The goal is to use deformable registration tolearn a mapping between the intensity atlas and the MRI being seg-mented. This learned deformation is then applied to the topology andstatistical atlases to serve as their initialization in the algorithm. In thiswork, we evaluated two openly available, deformable registration algo-rithms to perform this task. The first is the adaptive bases algorithm(ABA) (Rohde et al., 2003) which models the deformation field using asummation of radial basis functions (RBFs). The algorithm attempts tomaximize the normalized mutual information (NMI) (Studholmeet al., 1999) between two images, a similarity metric commonly usedfor registration of MR images (Wells et al., 1996). An adaptation ofthis algorithm is provided as part of the JIST package (Chen et al.,

Intensity Topology Statistical Statistical StatisticalAtlas Atlas Atlas Atlas Atlas
(Spinal Cord) (CSF) (Wrapper)
Fig. 4. An example of the intensity, topology (spinal cord in light gray, CSF in dark gray, and wrapper in white) and statistical atlases constructed from a T1-weighted MRI.
1055M. Chen et al. / NeuroImage 83 (2013) 1051–1062
2010). The second is SyN, a fluid based registration method that maxi-mizes cross-correlation in order to find symmetric diffeomorphicmaps between images. It was ranked very highly among state of theart registration algorithms in recent evaluations (Klein et al., 2010),and is offered as part of theAdvancedNormalization Tools (ANTS) pack-age (Avants et al., 2011).
Fig. 5 shows examples of spinal cord MRI registrations between anintensity atlas and a subject image using these two registration algo-rithms. As expected, we see significant registration errors in parts ofthe spinal cord. However, they provide sufficient initialization for theTOADS algorithm, which is fairly robust to such errors in the initializa-tion. In the Segmentation comparison against manual raters sectionwe evaluate the effectiveness of both of these registrations algorithmsin addition to their impact on our final segmentation.
Topology preserving atlas deformation
The second issue with including a deformable registration into theframework is that, in general, such registrations do not take into accountthe digital topology of the objects being deformed. The complexity ofmaintaining digital topology during registration is the primary reasonwhy only a rigid alignment was used in the original TOADS algorithm,and even then, the transformation had to be applied carefully. Bazinand Pham (2008) showed that even simple rotations and/or scaling,which are purely homeomorphic in the continuous sense, are not neces-sarily homeomorphic in the digital domain. This demonstrates that sim-ply having a homeomorphic (or diffeomorphic) transformation modelis not sufficient to preserve digital topology. The only way to guaranteethat a registration will produce a digitally homeomorphic transforma-tion is to check the digital homeomorphism criterion at every step ofthe optimization. This is computationally expensive and becomes highlyimpractical for higher order registration that can generate complexdeformations.
In Chen et al. (2011), this was addressed by using a technique, firstpresented in Bazin et al. (2007), that can generate a digitally homeo-morphic approximation of a deformation field. The technique is appliedafter a deformation field is found between the intensity atlas and thetarget image. It starts by resetting the deformation field to zero and
Atlas ABA
Fig. 5. Example of registrations between an intensit
then slowly regrowing each deformation vector in the field back to itsoriginal value. This creates a series of incremental deformations thatare applied to the topology atlas. At every step, the digital homeomor-phism criterion is checked to make sure that an increment does notbreak the topology of the atlas. If incrementing a particular deformationvector will cause a topology break, then that deformation is stoppedfrom entirely growing back. This produces an approximation of the de-formation field that can deform the topology atlas while maintaining itsinitial topology. Since this method is applied after the registration iscompleted, it also has the added advantage of being applicable to anyregistration algorithm.
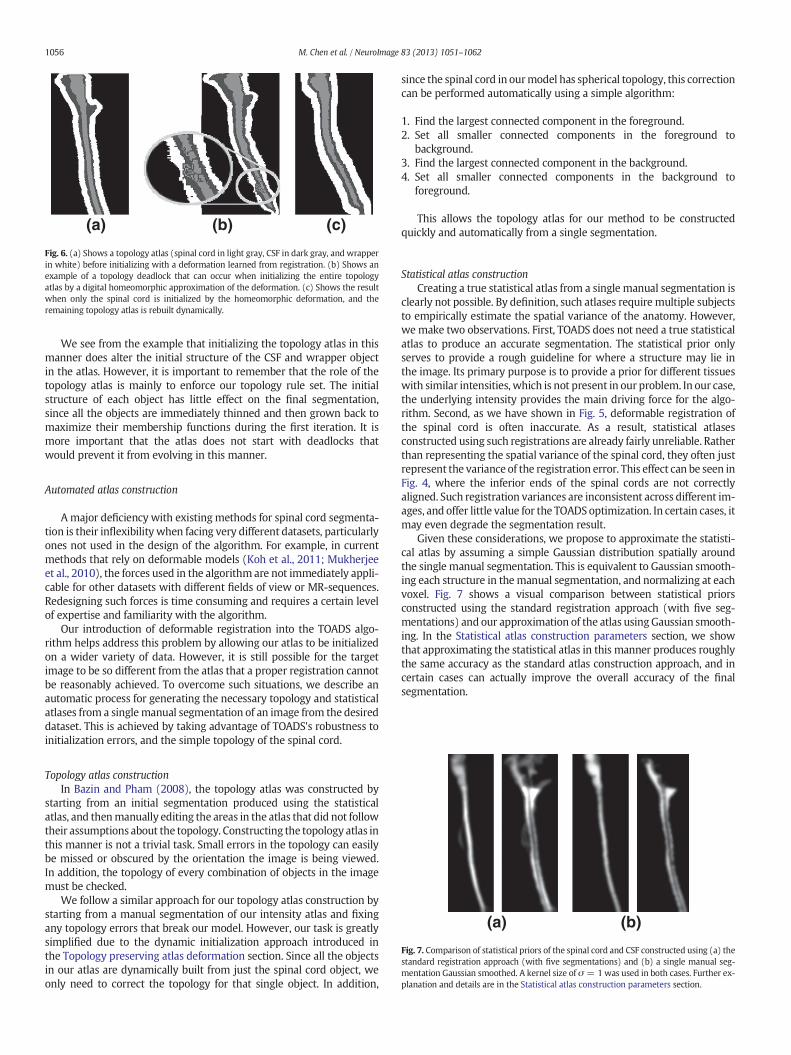
In general, this digital homeomorphic approximation of the defor-mation field is very robust when the deformations are small or theatlas is simple. However, it can potentially introduce considerablesegmentation errors when deforming complex topologies over largedistances. This is a result of topology deadlocks that can occur, wherea set of voxels are stuck in a configuration that prevents them frommoving without breaking the object topology. The problem becomesmore prominent when working with spinal cord MRI with large andvaried fields of view, where the deformations produced by the registra-tion are very large. An example of this is in the thoracic region of the spi-nal cord where the shape and distance can vary greatly between theatlas and target images. Fig. 6(b) shows an example of a topology dead-lock that can be introduced when approximating such a deformation.
To prevent these errors,we introduce a dynamic approach for initial-izing the topology atlas. Instead of applying the learned deformation toall three objects in the atlas, we only apply it to the spinal cord object.After the spinal cord object has been deformed, the other two objectsare then automatically added back to the atlas by following the topologyrules listed in the Spinal cord topology and statistical atlases section.That is, the CSF object is added to the atlas as a dilation of the spinalcord label, and likewise the wrapper object is added as a dilation ofthe union of the spinal cord and CSF labels. Transforming and buildingthe atlas on-the-fly in this manner greatly simplifies the homeomorphicdeformation approximation, thereby allowing us to avoid topologydeadlocks that can be introduced during the initial registration step.Fig. 6(c) shows how initializing the topology atlas in this manner canprevent the deadlock seen before.
SyN Target
y atlas and a target image using ABA and SyN.
(a) (b) (c)
Fig. 6. (a) Shows a topology atlas (spinal cord in light gray, CSF in dark gray, and wrapperin white) before initializing with a deformation learned from registration. (b) Shows anexample of a topology deadlock that can occur when initializing the entire topologyatlas by a digital homeomorphic approximation of the deformation. (c) Shows the resultwhen only the spinal cord is initialized by the homeomorphic deformation, and theremaining topology atlas is rebuilt dynamically.
(a) (b)
Fig. 7. Comparison of statistical priors of the spinal cord and CSF constructed using (a) thestandard registration approach (with five segmentations) and (b) a single manual seg-mentation Gaussian smoothed. A kernel size of σ = 1was used in both cases. Further ex-planation and details are in the Statistical atlas construction parameters section.
1056 M. Chen et al. / NeuroImage 83 (2013) 1051–1062
We see from the example that initializing the topology atlas in thismanner does alter the initial structure of the CSF and wrapper objectin the atlas. However, it is important to remember that the role of thetopology atlas is mainly to enforce our topology rule set. The initialstructure of each object has little effect on the final segmentation,since all the objects are immediately thinned and then grown back tomaximize their membership functions during the first iteration. It ismore important that the atlas does not start with deadlocks thatwould prevent it from evolving in this manner.
Automated atlas construction
Amajor deficiency with existing methods for spinal cord segmenta-tion is their inflexibility when facing very different datasets, particularlyones not used in the design of the algorithm. For example, in currentmethods that rely on deformable models (Koh et al., 2011; Mukherjeeet al., 2010), the forces used in the algorithm are not immediately appli-cable for other datasets with different fields of view or MR-sequences.Redesigning such forces is time consuming and requires a certain levelof expertise and familiarity with the algorithm.
Our introduction of deformable registration into the TOADS algo-rithm helps address this problem by allowing our atlas to be initializedon a wider variety of data. However, it is still possible for the targetimage to be so different from the atlas that a proper registration cannotbe reasonably achieved. To overcome such situations, we describe anautomatic process for generating the necessary topology and statisticalatlases from a singlemanual segmentation of an image from the desireddataset. This is achieved by taking advantage of TOADS's robustness toinitialization errors, and the simple topology of the spinal cord.
Topology atlas constructionIn Bazin and Pham (2008), the topology atlas was constructed by
starting from an initial segmentation produced using the statisticalatlas, and thenmanually editing the areas in the atlas that did not followtheir assumptions about the topology. Constructing the topology atlas inthis manner is not a trivial task. Small errors in the topology can easilybe missed or obscured by the orientation the image is being viewed.In addition, the topology of every combination of objects in the imagemust be checked.
We follow a similar approach for our topology atlas construction bystarting from a manual segmentation of our intensity atlas and fixingany topology errors that break our model. However, our task is greatlysimplified due to the dynamic initialization approach introduced inthe Topology preserving atlas deformation section. Since all the objectsin our atlas are dynamically built from just the spinal cord object, weonly need to correct the topology for that single object. In addition,
since the spinal cord in ourmodel has spherical topology, this correctioncan be performed automatically using a simple algorithm:
1. Find the largest connected component in the foreground.2. Set all smaller connected components in the foreground to
background.3. Find the largest connected component in the background.4. Set all smaller connected components in the background to
foreground.
This allows the topology atlas for our method to be constructedquickly and automatically from a single segmentation.
Statistical atlas constructionCreating a true statistical atlas from a single manual segmentation is
clearly not possible. By definition, such atlases require multiple subjectsto empirically estimate the spatial variance of the anatomy. However,we make two observations. First, TOADS does not need a true statisticalatlas to produce an accurate segmentation. The statistical prior onlyserves to provide a rough guideline for where a structure may lie inthe image. Its primary purpose is to provide a prior for different tissueswith similar intensities, which is not present in our problem. In our case,the underlying intensity provides the main driving force for the algo-rithm. Second, as we have shown in Fig. 5, deformable registration ofthe spinal cord is often inaccurate. As a result, statistical atlasesconstructed using such registrations are already fairly unreliable. Ratherthan representing the spatial variance of the spinal cord, they often justrepresent the variance of the registration error. This effect can be seen inFig. 4, where the inferior ends of the spinal cords are not correctlyaligned. Such registration variances are inconsistent across different im-ages, and offer little value for the TOADSoptimization. In certain cases, itmay even degrade the segmentation result.
Given these considerations, we propose to approximate the statisti-cal atlas by assuming a simple Gaussian distribution spatially aroundthe single manual segmentation. This is equivalent to Gaussian smooth-ing each structure in themanual segmentation, and normalizing at eachvoxel. Fig. 7 shows a visual comparison between statistical priorsconstructed using the standard registration approach (with five seg-mentations) and our approximation of the atlas using Gaussian smooth-ing. In the Statistical atlas construction parameters section, we showthat approximating the statistical atlas in this manner produces roughlythe same accuracy as the standard atlas construction approach, and incertain cases can actually improve the overall accuracy of the finalsegmentation.

1057M. Chen et al. / NeuroImage 83 (2013) 1051–1062
Materials
Our algorithm was applied to two datasets having different popula-tion characteristics, MR protocols and scanners, and fields of view.
T1 cohort
The first dataset used in our experiments consisted of MR images ofthe brain stem and spinal cord from the C1–T4 vertebrae acquired fromseven patients diagnosed with multiple sclerosis (MS). Each image wasacquired using a T1-weighted inversion recovery fast spoiled gradient re-call (FSPGR) on a 3 Tesla GE Signa scanner (GE, MilwaukeeWI) with thefollowing parameters: TR = 7.8 ms, TE = 2.98 ms, TI = 750 ms, andflip angle = 16°. The resolution of the acquired images was 1 mmisotropic.
MT cohort
The second dataset used in our experiments consisted of 238MRIs ofthe cervical spinal cord, acquired from the C2–C6 vertebrae. The datawere acquired from18 healthy controls (HC) and 220 patientswithmul-tiple sclerosis (MS). The scans were performed with a 3 Tesla PhilipsIntera scanner (Philips Medical Systems, Best, The Netherlands) usingbody coil excitation and two-element phased array surface coil recep-tion. The images were magnetization transfer (MT) prepared T2*-weighted gradient echoes, using an MT prepulse applied at 1.5 kHz offresonance (24 ms, five-lobed Sinc-Gauss pulse with maximum ampli-tude 9.5 mT), as described in Smith et al. (2009). Other parameters:TR = 110 ms, TE = 13 ms, flip angle = 9°, echo planar imaging factor3, and SENSE acceleration factor 2. Each image had a through plane res-olution of 2.25 mm and an in-plane resolution of 0.6 × 0.6 mm.
Manual segmentations
All seven images in the T1 cohort were each manually segmented(labeling the spinal cord and the CSF) by two different raters. Twentyimages (18 HC, 2 MS) in the MT cohort were similarly segmented bytwo different raters. Each rater labeled 10 and 14 subjects, respectively,with 4 images in common between the raters.
The image slice numbers corresponding to the C2 and C5 vertebraewere manually identified by a single rater in 146 images in the MT co-hort. This subset was used in our statistical analysis in the Clinicalrelevance and Exploratory study of CSF volumes sections. Table 1shows the detailed demographic information for this subset.
Metrics
We report the accuracy of our method in comparison to humanraters by using the Dice coefficient (Dice, 1945),
Dice H;Að Þ ¼ 2jH∩AjHj þ jAj j ;
for a particular structure (e.g., cord or CSF), where H and A are the seg-mentations generated by the human rater and the algorithm, respec-tively. The Dice coefficient is a measure of set agreement and is
Table 1Detailed demographic description for the 146 subjects in theMT cohort with manual slicenumbers for the C2 and C5 vertebrae (used in the Clinical relevance and Exploratory studyof CSF volumes sections). Key: healthy controls (HC), clinically isolated syndrome (CIS),relapsing–remitting (RR), primary progressive (PP), and secondary progressive (SP).
HC CIS RR PP SP
N (male/female) 15 (5/10) 5 (2/3) 76 (23/53) 16 (8/8) 34 (12/22)Age (SD) 39.4 (9.1) 34.8 (9.6) 38.9 (10.5) 53.4 (6.7) 51.9 (7.3)
commonly used as a volumetric measure for comparing the quality ofautomatic vs. manual segmentations. It has a range of [0.0,1.0], wherea value of 1.0 indicates perfect agreement between the algorithm andthe manual result, while a score of 0.0 represents no overlap betweenthe two.
Experimental results
We perform several experiments to demonstrate the performanceand applications of our spinal cord segmentation tool. Our first experi-ment evaluates the accuracy of our algorithm relative to human raters.It also considers the effect of our registration choice for initializing ouratlases. We then evaluate the impact of our statistical atlas constructionapproach, and the size of the Gaussian smoothing kernel used in its con-struction. Lastly, we perform a large scale evaluation using the MT co-hort to establish the robustness and potential clinical relevance of ouralgorithm.
Segmentation comparison against manual raters
Weevaluated our automated segmentation results against the sevenimages from the T1 cohort and the twenty from theMT cohort that havecorresponding manual segmentations. The Dice coefficient was calcu-lated for the spinal cord, CSF, and the union of the two structures (i.e.,the spinal canal). For each dataset, we evaluated using either ABA orSyN for initialization. Table 2 shows the mean and standard deviationof the Dice coefficient of our results against manual segmentationswhen initializing with each registration algorithm, and for each cohort.
In general, the algorithm performed better on the MT cohort thanthe T1 cohort, particularly for the CSF. This can be largely attributed tothe better tissue contrast and smaller intensity inhomogeneities in theMT cohort images. These differences can be seen in Figs. 8 and 9,which show cropped examples of the original MRI, its manual segmen-tation, and our automatic segmentation results for each cohort. Fromthe figures we see that the automatic results were very similar to themanual segmentations for both cases. However, the automatic resultstended to be overall smoother due to the TOADS regularization. Com-paring between the two figures, we see that the T1 cohort result hadmore areas where the CSF was mis-segmented as the spinal cord thanin the MT cohort result. This is particularly noticeable in the inferiorareas of the T1 image where the intensity inhomogeneity was verystrong, and the contrast between the CSF and spinal cord was lower.
The individual accuracy of each registration algorithmwas also con-sidered by looking at its ability to transfer the atlas segmentation to thetarget image through applying the learned deformation from the inten-sity atlas registration. Table 2 shows the Dice coefficient between thetransferred segmentation from each registration algorithm and themanual segmentation for the target image. We see from these resultsthat ABA generally performed much better than SyN for both datasets.Hence, it was the only registration algorithm considered in theremaining experiments.
Statistical atlas construction parameters
The impact of the two statistical atlas construction approaches de-scribed in the Spinal cord topology and statistical atlases andAutomated atlas construction sections was evaluated by repeating ouralgorithm on five images from each cohort, while using atlases fromboth approaches with increasing kernel sizes (σ) for the Gaussiansmoothing. In general, σ can be seen as a parameter for controlling thecapture range of the statistical atlas. A small value should be used ifthe initialization from the registration is believed to be very accurateand trustworthy. A large value can compensate for bad registrations,but may also cause the method to latch onto the wrong structure or ar-tificially expand the segmentation size. Fig. 10 shows plots of the meanDice coefficient between the manual segmentations and the automatic
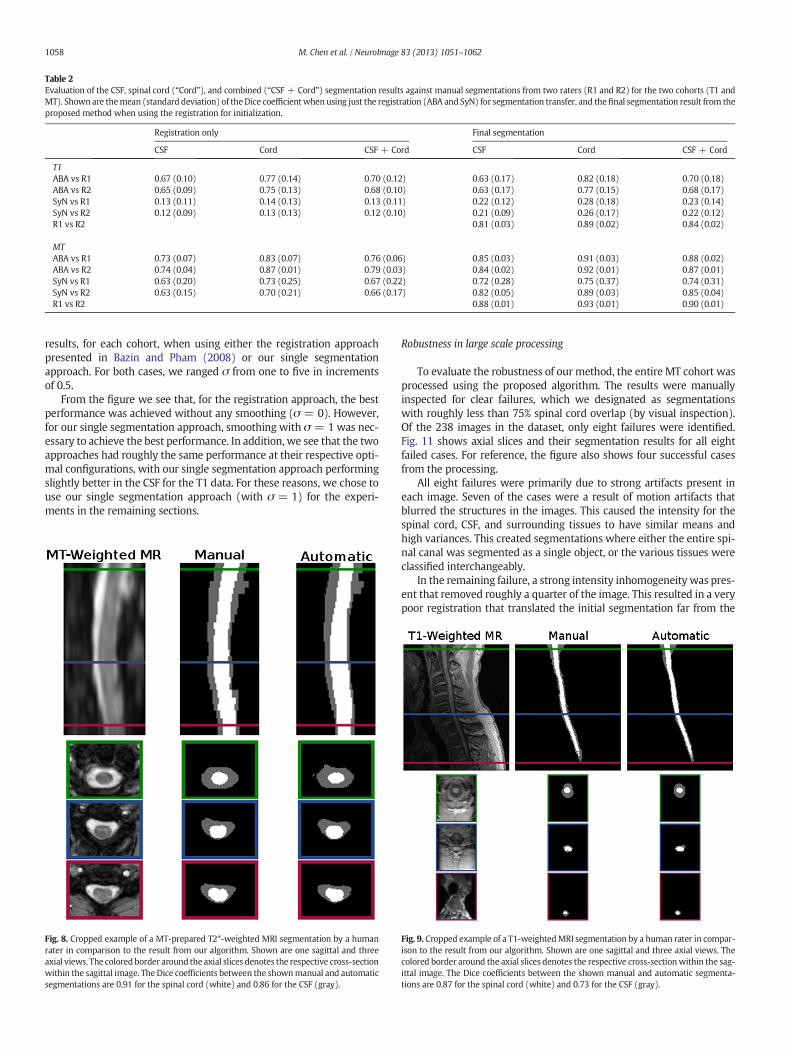
Table 2Evaluation of the CSF, spinal cord (“Cord”), and combined (“CSF + Cord”) segmentation results against manual segmentations from two raters (R1 and R2) for the two cohorts (T1 andMT). Shown are themean (standard deviation) of theDice coefficientwhenusing just the registration (ABA and SyN) for segmentation transfer, and thefinal segmentation result from theproposed method when using the registration for initialization.
Registration only Final segmentation
CSF Cord CSF + Cord CSF Cord CSF + Cord
T1ABA vs R1 0.67 (0.10) 0.77 (0.14) 0.70 (0.12) 0.63 (0.17) 0.82 (0.18) 0.70 (0.18)ABA vs R2 0.65 (0.09) 0.75 (0.13) 0.68 (0.10) 0.63 (0.17) 0.77 (0.15) 0.68 (0.17)SyN vs R1 0.13 (0.11) 0.14 (0.13) 0.13 (0.11) 0.22 (0.12) 0.28 (0.18) 0.23 (0.14)SyN vs R2 0.12 (0.09) 0.13 (0.13) 0.12 (0.10) 0.21 (0.09) 0.26 (0.17) 0.22 (0.12)R1 vs R2 0.81 (0.03) 0.89 (0.02) 0.84 (0.02)
MTABA vs R1 0.73 (0.07) 0.83 (0.07) 0.76 (0.06) 0.85 (0.03) 0.91 (0.03) 0.88 (0.02)ABA vs R2 0.74 (0.04) 0.87 (0.01) 0.79 (0.03) 0.84 (0.02) 0.92 (0.01) 0.87 (0.01)SyN vs R1 0.63 (0.20) 0.73 (0.25) 0.67 (0.22) 0.72 (0.28) 0.75 (0.37) 0.74 (0.31)SyN vs R2 0.63 (0.15) 0.70 (0.21) 0.66 (0.17) 0.82 (0.05) 0.89 (0.03) 0.85 (0.04)R1 vs R2 0.88 (0.01) 0.93 (0.01) 0.90 (0.01)
1058 M. Chen et al. / NeuroImage 83 (2013) 1051–1062
results, for each cohort, when using either the registration approachpresented in Bazin and Pham (2008) or our single segmentationapproach. For both cases, we ranged σ from one to five in incrementsof 0.5.
From the figure we see that, for the registration approach, the bestperformance was achieved without any smoothing (σ = 0). However,for our single segmentation approach, smoothing with σ = 1was nec-essary to achieve the best performance. In addition, we see that the twoapproaches had roughly the same performance at their respective opti-mal configurations, with our single segmentation approach performingslightly better in the CSF for the T1 data. For these reasons, we chose touse our single segmentation approach (with σ = 1) for the experi-ments in the remaining sections.
Fig. 8. Cropped example of a MT-prepared T2*-weighted MRI segmentation by a humanrater in comparison to the result from our algorithm. Shown are one sagittal and threeaxial views. The colored border around the axial slices denotes the respective cross-sectionwithin the sagittal image. The Dice coefficients between the shownmanual and automaticsegmentations are 0.91 for the spinal cord (white) and 0.86 for the CSF (gray).
Robustness in large scale processing
To evaluate the robustness of our method, the entire MT cohort wasprocessed using the proposed algorithm. The results were manuallyinspected for clear failures, which we designated as segmentationswith roughly less than 75% spinal cord overlap (by visual inspection).Of the 238 images in the dataset, only eight failures were identified.Fig. 11 shows axial slices and their segmentation results for all eightfailed cases. For reference, the figure also shows four successful casesfrom the processing.
All eight failures were primarily due to strong artifacts present ineach image. Seven of the cases were a result of motion artifacts thatblurred the structures in the images. This caused the intensity for thespinal cord, CSF, and surrounding tissues to have similar means andhigh variances. This created segmentations where either the entire spi-nal canal was segmented as a single object, or the various tissues wereclassified interchangeably.
In the remaining failure, a strong intensity inhomogeneity was pres-ent that removed roughly a quarter of the image. This resulted in a verypoor registration that translated the initial segmentation far from the
Fig. 9. Cropped example of a T1-weightedMRI segmentation by a human rater in compar-ison to the result from our algorithm. Shown are one sagittal and three axial views. Thecolored border around the axial slices denotes the respective cross-sectionwithin the sag-ittal image. The Dice coefficients between the shown manual and automatic segmenta-tions are 0.87 for the spinal cord (white) and 0.73 for the CSF (gray).
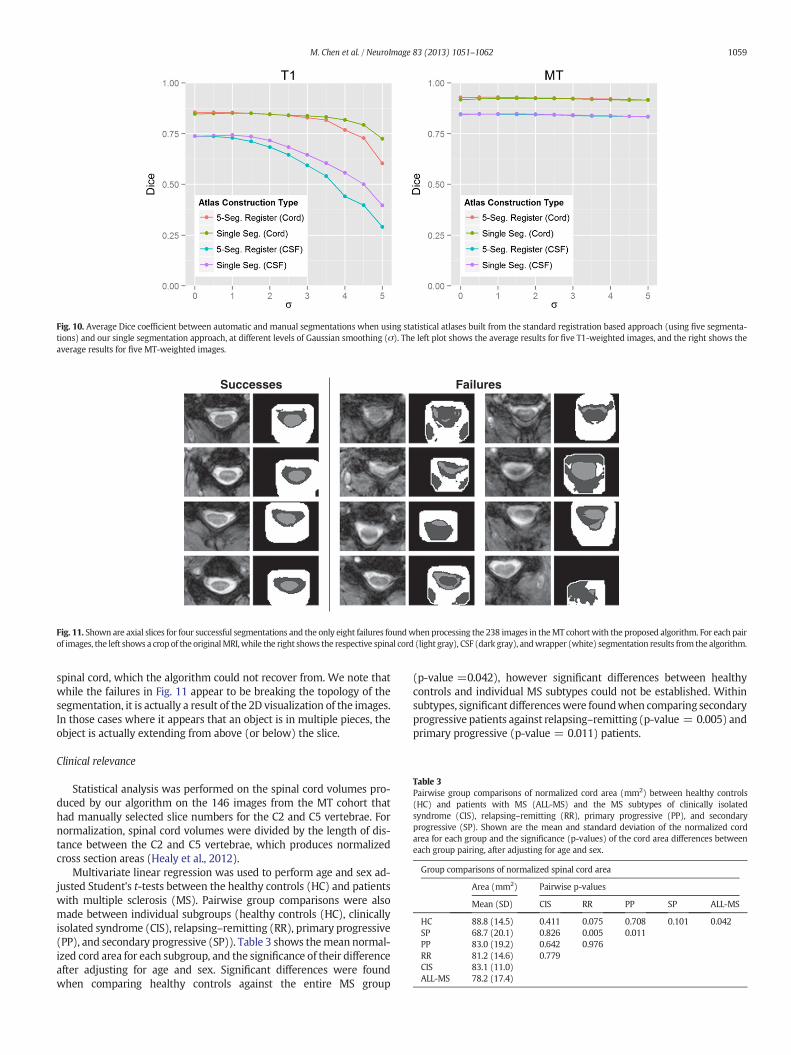
Fig. 10. Average Dice coefficient between automatic and manual segmentations when using statistical atlases built from the standard registration based approach (using five segmenta-tions) and our single segmentation approach, at different levels of Gaussian smoothing (σ). The left plot shows the average results for five T1-weighted images, and the right shows theaverage results for five MT-weighted images.
Successes Failures
Fig. 11. Shown are axial slices for four successful segmentations and the only eight failures foundwhen processing the 238 images in theMT cohort with the proposed algorithm. For each pairof images, the left shows a crop of the originalMRI,while the right shows the respective spinal cord (light gray), CSF (dark gray), andwrapper (white) segmentation results from the algorithm.
Table 3Pairwise group comparisons of normalized cord area (mm2) between healthy controls(HC) and patients with MS (ALL-MS) and the MS subtypes of clinically isolatedsyndrome (CIS), relapsing–remitting (RR), primary progressive (PP), and secondaryprogressive (SP). Shown are the mean and standard deviation of the normalized cordarea for each group and the significance (p-values) of the cord area differences betweeneach group pairing, after adjusting for age and sex.
Group comparisons of normalized spinal cord area
Area (mm2) Pairwise p-values
Mean (SD) CIS RR PP SP ALL-MS
HC 88.8 (14.5) 0.411 0.075 0.708 0.101 0.042SP 68.7 (20.1) 0.826 0.005 0.011PP 83.0 (19.2) 0.642 0.976RR 81.2 (14.6) 0.779CIS 83.1 (11.0)ALL-MS 78.2 (17.4)
1059M. Chen et al. / NeuroImage 83 (2013) 1051–1062
spinal cord, which the algorithm could not recover from. We note thatwhile the failures in Fig. 11 appear to be breaking the topology of thesegmentation, it is actually a result of the 2D visualization of the images.In those cases where it appears that an object is in multiple pieces, theobject is actually extending from above (or below) the slice.
Clinical relevance
Statistical analysis was performed on the spinal cord volumes pro-duced by our algorithm on the 146 images from the MT cohort thathad manually selected slice numbers for the C2 and C5 vertebrae. Fornormalization, spinal cord volumes were divided by the length of dis-tance between the C2 and C5 vertebrae, which produces normalizedcross section areas (Healy et al., 2012).
Multivariate linear regression was used to perform age and sex ad-justed Student's t-tests between the healthy controls (HC) and patientswith multiple sclerosis (MS). Pairwise group comparisons were alsomade between individual subgroups (healthy controls (HC), clinicallyisolated syndrome (CIS), relapsing–remitting (RR), primary progressive(PP), and secondary progressive (SP)). Table 3 shows themean normal-ized cord area for each subgroup, and the significance of their differenceafter adjusting for age and sex. Significant differences were foundwhen comparing healthy controls against the entire MS group
(p-value =0.042), however significant differences between healthycontrols and individual MS subtypes could not be established. Withinsubtypes, significant differenceswere foundwhen comparing secondaryprogressive patients against relapsing–remitting (p-value = 0.005) andprimary progressive (p-value = 0.011) patients.

Table 4Pairwise group comparisons of normalized CSF area (mm2) between healthy controls (HC)and patients withMS (ALL-MS) and theMS subtypes of clinically isolated syndrome (CIS),relapsing–remitting (RR), primary progressive (PP), and secondary progressive (SP).Shown are the mean and standard deviation of the normalized CSF area for each groupand the significance (p-values) of the CSF area differences between each group pairing,after adjusting for age and sex.
Group comparisons of normalized CSF area
Area (mm2) Pairwise p-values
Mean (SD) CIS RR PP SP ALL-MS
HC 128.3 (24.8) 0.850 0.304 0.472 0.040 0.141
1060 M. Chen et al. / NeuroImage 83 (2013) 1051–1062
For the MS patients, semi-partial correlation was used to evaluatePearson's correlation coefficients between normalized cord area forboth the Expanded Disability Status Scale (EDSS) and disease duration,while adjusting for age and sex. Further correlations were evaluated forthe RR, PP, and SP subtypes. The CIS subtype was omitted due to thesmall number of subjects. Fig. 12 shows the relationship of normalizedspinal cord area with EDSS (top plot) and disease duration (bottomplot), after adjusting the values for age and sex. In each case, the blackline shows the relationship for the whole MS group, while coloredlines indicate relationships for a particular MS subtype. Moderatelyweak, but significant relationships were found for normalized spinal
Fig. 12. Correlation plots showing the relationship between normalized spinal cord area(age and sex adjusted) with EDSS (top) and disease duration (bottom) for MS patients.The black line shows the relationship for all MS patients grouped together. The coloredlines indicate the relationship for the specific subtypes — relapsing remitting (RR) ingreen, secondary progressive (SP) in blue, and primary progressive (PP) in red. The corre-lation (r) and significance (p) are given for each line.
SP 168.4 (45.5) 0.128 b0.001 0.999PP 173.7 (65.1) 0.990 0.003RR 136.3 (28.3) 0.207CIS 119.9 (33.5)ALL-MS 148.6 (42.5)
cord area with both EDSS (r = −0.19, p-value = 0.03) and diseaseduration (r = −0.23, p-value = 0.01) when observing the whole MSgroup together. No relationship could be established when looking ateach MS subtype group individually.
Exploratory study of CSF volumes
One advantage of our approach over existing methods is the abilityto generate segmentations of cerebrospinal fluid (CSF) from the spinalcord image. To our knowledge, no study has been performed that ob-serves the volume of spinal CSF with respect to multiple sclerosis. Todemonstrate the potential of such analysis, we provide a basic explor-atory study of such a measure. The data and methods used in this anal-ysis are analogous to that used in the Clinical relevance section for thespinal cord volume. Since there are no clear guidelines for normalizingthe CSF volume, we again normalize by the distance between the C2to C5 vertebrae, producing a normalized CSF area.
Table 4 shows the mean normalized CSF area for each MS subgroup,and the significance of their difference after adjusting for age andsex. No significant differences were found when comparing healthycontrols against the entire MS group. However, several significant dif-ferences could be found when comparing against the progressivecases (SP and PP). The pairs where significant differences were foundare SP vs. HC (p-value = 0.040), SP vs. RR (p-value b 0.001), and PPvs. RR (p-value = 0.003).
Discussion
In this work we have presented a fully automatic approach forsegmenting the spinal cord and cerebrospinal fluid from MRIs. Unlikeexisting methods, our approach is designed to be highly generalizableto spinal cord images of any field of view orMR contrast. The only crite-rion necessary for our algorithm is a reasonable registration between anatlas and the image being segmented. For datawhere such a registrationis unreliable (i.e., if the images differs too greatly from the providedatlas), we have presented a fast and automatic approach for generatinga suitable atlas using a singlemanual segmentation of an image from thedesired dataset.
Accuracy and robustness
Our evaluations showthat theproposedmethodachievedhigh accura-cy and robustness when compared against manual segmentations fromtwo independent raters for twodatasetswith very different image charac-teristics. From Table 2, we see that on average our algorithm achieved a0.91 Dice coefficient for the spinal cord and 0.85 Dice for the CSF whenworking with the MT-prepared T2*-weighted data. Such values are re-markably high, especially considering that the Dice coefficient is very sen-sitive to errors when the structures being compared are long and thin. In

1061M. Chen et al. / NeuroImage 83 (2013) 1051–1062
general, the overlap achieved by our algorithm on this data is on par withinter-rater accuracy for the spinal cord, and slightly lower for the CSF.
The T1-weighted data,which had amuch larger field of view, provedto be more challenging. On average our algorithm achieved a 0.80 Dicecoefficient for the spinal cord and 0.63 Dice for CSF when ran on thisdata. Overall, these values are still considered fairly high for Dice coeffi-cients, particularly for the spinal cord. The lower CSF performance canbe largely attributed to the strong field inhomogeneities in the image,making it difficult to distinguish it from surrounding tissues.
Our large scale evaluation on 238 images shows that the method ishighly robust. Only eight failureswere produced over the entire dataset,and all of them were a result of intense artifacts that rendered theimages unusable. In the context of a clinical trial using the sameMR-sequence, these example failures can provide a preliminary basisin the acquisition protocol for determining when an image containstoo much artifact or distortion to be used with our algorithm. The over-all quality and robustness of our results can be largely attributed to thetopology constraint, which allows the algorithm to better handle thenoise and artifacts that are prevalent in spinal cord MRIs.
Results comparison against existing literature
To our knowledge, none of the currently existing automatic MRI spi-nal cord segmentation algorithms (Koh et al., 2010, 2011; Mukherjeeet al., 2010) nor the data used in their evaluation are openly availablefor download. This prevents a direct comparison against their methods.However, compared against the Dice overlap reported in their work, onaverage our algorithm performed very favorably. Namely, Koh et al.(2010) achieved an average Dice of 0.70 when compared against twohuman raters on 52 images. In the alternative approach presented inKoh et al. (2011), they gained marginal improvements with an averageDice overlap of 0.71. In Mukherjee et al. (2010) a direct overlap valida-tionwas not performed, and instead only values for area correlation be-tween manual raters were presented.
Our statistical results can be compared against several works study-ing the relationship between normalized spinal cord area and MS. Themost relevant of these is the work presented by Horsfield et al. (2010)where a semi-automated approachwas used to perform similar analysisas those we have presented in the Clinical relevance section.
Our analysis when comparing normalized spinal cord volume be-tween healthy control and MS patients produced several conclusionsthat are consistentwith that reported byHorsfield et al. (2010). Namely,we showed significant differences between healthy controls and theentire MS group (p-value = 0.042), significant differences betweenrelapsing–remitting and secondary progressive subtypes (p-value =0.005), and a lack of significant difference between relapsing–remittingMS and healthy controls (p-value = 0.075). In addition, our correlationanalysis with EDSS showed a moderate, but significant relationship be-tween normalized spinal cord area for thewholeMS group, but a lack ofsignificant correlationwhen comparing against individualMS subtypes.Both of these results match those presented in Horsfield et al. (2010).
There are, however, two results that are distinct. Horsfield et al.(2010) found no significant relationship between normalized spinalcord volume anddisease duration,whilewe found a small but significantcorrelation for the relationship. Horsfield et al. (2010) also found signif-icant differences between HC and SP, while we did not (p-value =0.101). This may be due, in part, to our control group being smallerand considerably younger than our SP group. Hence, first adjusting forage and sex might have removed any noticeable effect.
Finally, our analysis of CSF volume shows a capability that, to ourknowledge, has not been expressed before. Our exploratory analysison normalized CSF area showed a considerable trend of higher CSF inthe progressive MS subtypes (SP and PP), with significant differencesbeing found after adjusting for age and sex when compared againstthe RR subtype (p-value b 0.001 and p-value = 0.003, respectively),and between healthy controls and SP (p-value = 0.040).
Adapting to new data
Onemajor advantage of our algorithm is its ability to be quickly andautomatically adapted for use with different spinal cord MRI data. Wehave designed a topology rule set that allows the topology atlas to beautomatically constructed by correcting the topology of the spinalcord object and dynamically generating the remaining structures. Wehave also provided an alternative approach for approximating the sta-tistical atlas, which does not require multiple manual segmentationsto be registered to a common template. In Fig. 10 we show that if weGaussian smooth a single manual segmentation, we can create a statis-tical atlas that provides roughly the same level of performance as anatlas generated through the standard registration approach. In addition,for the T1-weighted data, we see that this approach can actually be su-perior to the standard approach, particularly in the CSF. The main ad-vantage, however, is that now only a single manual segmentation isnecessary to construct all the atlases required for our algorithm to beentirely tailored to a specific dataset.
One important note regarding our algorithm's adaptability is that theperformance of themethod is still heavily reliant on the data being used.Aswe see from the T1 andMT results, the performance is not guaranteedto be preserved when changing between MR-sequences. Our algorithmprovides a rapid way to adapt to new datasets, which can be particularlyuseful if no existing method is available for such data. However, furtherevaluations are still necessary when applied to new MR-sequences andfields of view to ensure that the performance is preserved after theadaptation.
Conclusion
MRI of the spinal cord presentsmany challenges, such as noise and ar-tifacts, which make automatic segmentation of the spinal cord and CSF adifficult task. We have presented a topology preserving approach for ad-dressing this problem, and have shown its effectiveness for both accuracyand robustness. In addition, as spinal cord imaging rarely has a standardfield of view or MR contrast, we assume that the atlases provided withour algorithm are not optimal for every type of spinal cord MRI data.Hence, we have gone to great length to allow our algorithm to be easilyadaptable. This includes providing an automatic and reliable way to con-struct the necessary atlases from a single manual segmentation, and de-signing our framework so that it is not tied to a particular registrationalgorithm for initialization. This provides users with an option to use theregistration algorithmthat performsbest on their particular givendataset.
Finally, our incorporation of deformable registration into TOADS hasimplications that extend beyond our application in the spinal cord.Allowing the atlas to be initialized deformably opens the model for seg-mentation in essentially any anatomy and image contrast where a suc-cessful registration can be achieved. Naturally, a topology and statisticalatlas will have to be built for the specific anatomy, but our contributionhas greatly generalized the framework for other applications. An imple-mentation of the presented segmentationmethod and atlas constructionapproach can be freely downloaded as part of the Java Image ScienceToolkit (JIST) software package at http://www.nitrc.org/projects/jist/.
Acknowledgments
Funding for this work was supported in part by NIH/NINDS grantR01-NS070906, the Intramural Research Program of NINDS, and theNational MS Society (NMSS).
Conflict of interest
The authors have no conflict of interest to report regarding thiswork.

1062 M. Chen et al. / NeuroImage 83 (2013) 1051–1062
References
Archip, N., Erard, P.J., Egmont-Petersen, M., Haefliger, J.M., Germond, J.F., 2002. A knowledge-based approach to automatic detection of the spinal cord in CT images. IEEE Trans. Med.Imag. 21 (12), 1504–1516.
Avants, B.B., Tustison, N.J., Song, G., Cook, P.A., Klein, A., Gee, J.C., 2011. A reproducibleevaluation of ANTs similarity metric performance in brain image registration.NeuroImage 54 (3), 2033–2044.
Bazin, P.L., Pham, D.L., 2008. Homeomorphic brain image segmentation with topologicaland statistical atlases. Med. Image Anal. 12 (5), 616–625.
Bazin, P.L., Ellingsen, L.M., Pham, D.L., 2007. Digital homeomorphisms in deformableregistration. Proceedings of the International Conference on Information Processingin Medical Imaging (IPMI'07), vol. 4584, pp. 211–222.
Bezdek, J.C., 1980. A convergence theorem for the fuzzy ISODATA clustering algorithms.IEEE Trans. Pattern Anal. Mach. Intell. 2 (1), 1–8.
Bronskill, M.J., McVeigh, E.R., Kucharczyk, W., Henkelman, R.M., 1988. Syrinx-like artifactson MR images of the spinal cord. Radiology 166 (2), 485–488.
Burnett, S.S., Starkschalla, G., Stevens, C.W., Liao, Z., 2004. A deformable-model approachto semi-automatic segmentation of CT images demonstrated by application to thespinal canal. Med. Phys. 31 (2), 251–263.
Carass, A., Cuzzocreo, J., Wheeler, M.B., Bazin, P.L., Resnick, S.M., Prince, J.L., 2011. Simpleparadigm for extra-cerebral tissue removal: algorithm and analysis. NeuroImage 56(4), 1982–1992.
Chen, M., Carass, A., Wheeler, M.B., Liu, X., Prince, J.L., 2010. Multi-channel enhancementof the adaptive bases algorithm. 16th Annual Meeting of the Organization for HumanBrain Mapping, p. 1000.
Chen,M., Carass, A., Cuzzocreo, J., Bazin, P.L., Reich, D.S., Prince, J.L., 2011. Topology preserv-ing automatic segmentation of the spinal cord in magnetic resonance images. EighthIEEE International Symposium on Biomedical Imaging (ISBI 2011), pp. 1737–1740.
Coulon, O., Hickman, S.J., Parker, G.J., Barker, G.J., Miller, D.H., Arridge, S.R., 2002. Quanti-fication of spinal cord atrophy from magnetic resonance images via a B-spline activesurface model. Magn. Res. Med. 47 (6), 1176–1185.
Curtin, A.J., Chakeres, D.W., Bulas, R., Boesel, C.P., Finneran, M., Flint, E., 1989. MR imagingartifacts of the axial internal anatomy of the cervical spinal cord. Am. J. Roentgenol.152 (4), 835–842.
Czervionke, L.F., Czervionke, J.M., Daniels, D.L., Haughton, V.M., 1988. Characteristicfeatures of MR truncation artifacts. Am. J. Roentgenol. 151 (6), 1219–1228.
Dice, L.R., 1945. Measure of the amount of ecologic association between species. Ecology26 (3), 297–302.
Freund, P., Weiskopf, N., Ward, N.S., Hutton, C., Gall, A., Ciccarelli, O., Craggs, M., Friston, K.,Thompson, A.J., 2011. Disability, atrophy and cortical reorganization following spinalcord injury. Brain 134 (6), 1610–1622.
Healy, B.C., Arora, A., Hayden, D.L., Ceccarelli, A., Tauhid, S.S., Neema, M., Bakshi, R., 2012.Approaches to normalization of spinal cord volume: application to multiple sclerosis.J. Neuroimaging 22 (3), e12–e19.
Hinks, R.S., Quencer, R.M., 1988. Motion artifacts in brain and spine MR. Radiol. Clin. N.Am. 26 (4), 737–753.
Horsfield, M.A., Sala, S., Neema, M., Absinta, M., Bakshi, A., Sormani, M.P., Rocca, M.A., Bakshi,R., Filippi, M., 2010. Rapid semi-automatic segmentation of the spinal cord from mag-netic resonance images: application in multiple sclerosis. NeuroImage 50 (2), 446–455.
Kalkers, N.F., Barkhof, F., Bergers, E., van Schijndel, R., Polman, C.H., 2002. The effect of theneuroprotective agent riluzole on MRI parameters in primary progressive multiplesclerosis: a pilot study. Mult. Scler. 8 (6), 532–533.
Karangelis, G., Zimeras, S., 2002. An accurate 3D segmentation method of the spinal canalapplied to CT data. CT Images, BVM 2002, Conference Proceedings, Bildverarbeitungfür die Medizin, pp. 370–373.
Kass, M., Witkin, A., Terzopoulos, D., 1988. Snakes: active contour models. Int. J. Comput.Vis. 1 (4), 321–331.
Klein, A., Ghosh, S.S., Avants, B., Yeo, B.T.T., Fischl, B., Ardekani, B., Gee, J.C., Mann, J.J.,Parsey, R.V., 2010. Evaluation of volume-based and surface-based brain image regis-tration methods. NeuroImage 51 (1), 214–220.
Koh, J., Kim, T., Chaudhary, V., Dhillon, G., 2010. Automatic segmentation of the spinal cordand the dural sac in lumbar MR images using gradient vector flow field. InternationalConference of the IEEE Engineering in Medicine and Biology Society, pp. 3117–3120.
Koh, J., Scott, P.D., Chaudhary, V., Dhillon, G., 2011. An automatic segmentation method ofthe spinal canal from clinical MR images based on an attention model and an active
contour model. Eighth IEEE International Symposium on Biomedical Imaging (ISBI2011), pp. 1467–1471.
Kurtzke, J.F., 1983. Rating neurologic impairment in multiple sclerosis: an expandeddisability status scale (EDSS). Neurology 33 (11), 1444–1452.
Levy, L.M., Di Chiro, G., Brooks, R.A., Dwyer, A.J., Wener, L., Frank, J., 1988. Spinal cordartifacts from truncation errors during MR imaging. Radiology 166 (2), 479–483.
Lin, X., Tench, C.R., Turner, B., Blumhardt, L.D., Constantinesc, C.S., 2003. Spinal cord atro-phy and disability in multiple sclerosis over four years: application of a reproducibleautomated technique in monitoring disease progression in a cohort of the interferonβ-1a (Rebif) treatment trial. J. Neurol. Neurosurg. Psychiatry 74 (8), 1090–1094.
Lin, X., Tench, C.R., Evangelou, N., Jaspan, T., Constantinesc, C.S., 2004. Measurement ofspinal cord atrophy in multiple sclerosis. J. Neuroimaging 14 (S3), 20S–26S.
Losseff, N.A., Webb, S.L., O'Riordan, J.I., Page, R., Wang, L., Barker, G.J., Tofts, P.S., McDonald,W.I., Miller, D.H., Thompson, A.J., 1996. Spinal cord atrophy and disability in multiplesclerosis. A new reproducible and sensitive MRI method with potential to monitordisease progression. Brain 119 (3), 701–708.
Lucas, B.C., Bogovic, J.A., Carass, A., Bazin, P.-L., Prince, J.L., Pham, D.L., Landman, B.A., 2010.The Java Image Science Toolkit (JIST) for rapid prototyping and publishing of neuro-imaging software. Neuroinformatics 8 (1), 5–17.
Lycklama, G., Thompson, A., Filippi, M., Miller, D., Polman, C., Fazekas, F., Barkhof, F., 2003.Spinal-cord MRI in multiple sclerosis. Lancet Neurol. 2 (9), 555–562.
McGowan, J.C., Patel, R.S., 2000. Technical issues for MRI examination of the posteriorfossa. J. Neurol. Sci. 172 (S1), S40–S42.
McIntosh, C., Hamarneh, G., 2006. Spinal crawlers: deformable organisms for spinal cordsegmentation and analysis. Medical Image Computing and Computer-Assisted Inter-vention (MICCAI'06), vol. 4190, pp. 808–815.
Mukherjee, D.P., Cheng, I., Ray, N., Mushahwar, V., Lebel, M., Basu, A., 2010. Automaticsegmentation of spinal cord MRI using symmetric boundary tracing. IEEE Trans. Inf.Technol. Biomed. 14 (5), 1275–1278.
Nieniewski, M., Serneels, R., 2002. Segmentation of spinal cord images bymeans of water-shed and region merging together with inhomogeneity correction. Mach Graph. Vis.Int. J. 11 (1), 101–121.
Nyúl, L.G., Kanyó, J., Máté, E., Makay, G., Balogh, E., Fidrich, M., Kuba, A., 2005. Method forautomatically segmenting the spinal cord and canal from 3D CT images. Proc. CAIP2005. Lecture Notes in Computer Science, vol. 3691, pp. 456–463.
Pham, D.L., 2001. Spatial models for fuzzy clustering. Comp. Vision Image Underst. 84 (2),285–297.
Rocca, M.A., Horsfield, M.A., Sala, S., Copetti, M., Valsasina, P., Mesaros, S., Martinelli, V.,Caputo, D., Stosic-Opincal, T., Drulovic, J., Comi, G., Filippi, M., 2011. A multicenter as-sessment of cervical cord atrophy among MS clinical phenotypes. Neurology 76 (24),2096–2102.
Rohde, G.K., Aldroubi, A., Dawant, B.M., 2003. The Adaptive bases algorithm for intensitybased nonrigid image registration. IEEE Trans. Med. Imaging 22 (11), 1470–1479.
Sethian, J., 1999. Level Set Methods and Fast Marching Methods. Cambridge UniversityPress.
Sled, J.G., Zijdenbos, A.P., Evans, A.C., 1998. A non-parametric method for automatic cor-rection of intensity non-uniformity in MRI data. IEEE Trans. Med. Imaging 17 (1),87–97.
Smith, S.A., Jones, C.K., Gifford, A., Belegu, V., Chodkowski, B.A., Farrell, J.A.D., Landman,B.A., Reich, D.S., Calabresi, P.A., McDonald, J.W., van Zijl, P.C.M., 2009. Reproducibilityof tract-specific magnetization transfer and diffusion tensor imaging in the cervicalspinal cord at 3 Tesla. NMR Biomed. 23 (2), 207–217.
Studholme, C., Hill, D.L.G., Hawkes, D.J., 1999. An overlap invariant entropymeasure of 3Dmedical image alignment. Pattern Recogn. 32 (1), 71–86.
Van Uitert, R., Bitter, I., Butman, J.A., 2005. Semi-automatic spinal cord segmentationand quantification. CARS 2005: Computer Assisted Radiology and Surgery, vol. 1281,pp. 224–229.
Wells III, W.M., Viola, P., Atsumi, H., Nakajima, S., Kikinis, R., 1996. Multimodal volumeregistration by maximation of mutual information. Med. Image Anal. 1 (1), 35–51.
Worth, A., 1996. Internet brain segmentation repository. http://www.cma.mgh.harvard.edu/ibsr/.
Xu, C., Prince, J.L., 1998. Snakes, shapes, and gradient vector flow. IEEE Trans. ImageProcess. 7 (3), 359–369.
Zackowski, K.M., Smith, S.A., Reich, D.S., Gordon-Lipkin, E., Chodkowski, B.A., Sambandan,D.R., Shteyman, M., Bastian, A.J., van Zijl, P.C., Calabresi, P.A., 2009. Sensorimotor dys-function in multiple sclerosis and column-specific magnetization transfer-imagingabnormalities in the spinal cord. Brain 132 (5), 1200–1209.