automatic voicemail summarisation for mobile messaging
TRANSCRIPT

Automatic Voicemail Summarisationfor Mobile Messaging
Konstantinos Koumpis
A dissertation submitted for the degree ofDoctor of Philosophy
The University of Sheffield2002

AbstractOne way to overcome the display and bandwidth limitations of today’s mobile environments isto reduce the amount of data transmitted to end-users by selecting only principal content, at thecost of introducing a tolerable information loss. This thesis provides a framework that allowssystematic comparisons and integration of patterns present in voicemail messages for constructingsummaries suitable for mobile messaging applications.
In order to derive a text representation of voicemail messages we employ automatic speechrecognition technology. IBM Voicemail Corpus-Part I is used in our experiments which repre-sents a large vocabulary task over telephone lines with problems that include unknown channels,spontaneous and topic independent speech. We use a hybrid connectionist/HMM approach with acombination of front-ends and multi-style language modelling. This results into a compact systemwith competitive accuracy relative to that produced by more complex systems based on Gaussianmixture models.
Voicemail summarisation differs from conventional text summarisation, since it does not as-sume a perfect transcription and is concerned with summarising brief spoken messages into tersesummaries. We have adopted a word-extractive approach with each word in the transcribed mes-sage represented as a vector of features. The initial realisation of the summarisation component isbased on lexical feature weighting given some summary length restrictions or compression rates.Frequent message terms are compacted and any terms classified as less informative are excludedfrom the summaries. The resulting summaries are then converted into a format suitable for trans-mission over narrowband wireless networks. The platform of choice is WAP Push over SMSthat offers a proactive way to transmit data from servers to mobile devices without explicit userrequests as well as easy and immediate access to particular voicemail messages.
Machine learning methods are then used to investigate the extent to which lexical and prosodicfeatures can be associated with content in voicemail messages. Prosodic features concern the wayin which speech sounds are acoustically realised and the ones we extracted can be broadly groupedas referring to pitch, energy, word duration and pauses. One can identify many potentially relevantbut also interrelated features for this task. We employ a feature selection approach in which weaim to use the data to guide us to an optimal subset of features. Instead of specifying a singleclassifier and feature set – optimised for a particular precision/recall trade-off – we maintain aset of classifiers/feature sets, optimising for all possible precision/recall trade-offs. We achievethis by considering the ROC curves of the trained classifiers (with respect to development data)and forming the convex hull of those ROC curves. The relative contribution of a large numberof features and derived subsets is compared within two summarisation tasks, namely the binarydecision and multi-class tasks. In the former, the goal is to classify words into those carryingprincipal content and those that do not, while in the latter the goal is to further classify the principalcontent words into proper names, telephone numbers, dates/times and other.
A series of objective and subjective evaluations using unseen data is also presented. The ob-jective evaluations show significant improvements over the baseline systems while the subjectiveevaluations show that users are able to determine the message priority and content fairly accu-rately. The perceived difference in quality of summarisation is affected more by errors resultingfrom automatic transcription, than by the automatic summarisation process. This suggests thatthe provision of accurate transcriptions is essential for successful speech summarisation appli-cations. Finally, an evaluation framework is proposed with the aim to determine which metricsmaximise summary quality and minimise delivery costs by combining user data and comparingsystem configurations that make different trade-offs.
i

AcknowledgmentsDuring the course of this research, I was fortunate to interact with a number of great people thatinfluenced the direction and the quality of my work.
First, I would like to express my gratitude to Steve Renals for his outstanding guidance, sup-port and co-operation. Steve was always available to advise me on technical and conceptual prob-lems and gave me every opportunity to extend my professional career. Furthermore, he allowedme absolute freedom to explore new ideas. While this proved difficult, I have come to appreci-ate the wisdom of his way by encouraging me to think for myself and learn from my mistakes.Moreover, he showed me the importance of a balanced professional and personal life.
While carrying out this project I enjoyed being a member of the SPandH research group. Infact, the research problems addressed in this work would not have been possible to study to suchan extent without the work carried out in this group. I wish to thank Phil Green for inviting meat the first place to join the group and all its members who have made SPandH an excellent placeto study and work. Thanks also to the former CDS research group for hosting me for six months.I also wish to say “Mange tak” to Søren Riis and his colleagues at the SIMAL group of NokiaMobile Phones R&D for inviting me to join them two years ago and for creating such a stimulatingreseach environment.
The Department of Computer Science in Sheffield has been a great intellectual environmentwith an exceptional spirit of co-operation and informality of interactions. The discussions withMahesan Niranjan, Yoshi Gotoh, Rob Gaizauskas and Srba Cvetkovic are gratefully acknowl-edged as they helped me to define my topic, suggested new avenues for research and offeredfeedback at various stages. I have also benefited from the numerous exchanges of views withseveral experienced colleagues. In particular, I thank Dan Ellis, Dave Abberley, Tony Robinson,Gethin Williams and Vincent Wan who helped me through the early stages of my induction intosome of the tools used to build the speech recognition component. I would like to give specialthanks to Harry Ladas for sharing his insight in mobile communication protocols and performingthe experiments with the SMS gateway. Many thanks also to Miguel Carreira-Perpinan, TasosKounoudes and Yasser Hifny for their comments and suggestions on parts of this thesis. ValiaSdralia deserves special thanks for providing emotional and technical support throughout thisproject. She was always available to share both excitement and frustrations encountered in myexperiments and attempts to interpret them.
I would like to acknowledge the financial support of the following organisations that allowedme to pursue this research with absolute independence: the University of Sheffield, the Engineer-ing and Physical Sciences Research Council, the European Commission, the Learned SocietiesFund, Nokia Mobile Phones and the International Speech Communication Association.
These acknowledgements would not be complete without thanks to my mother Katerina andbrother Stelios for all the support and encouragement they have given me and the interest theyhave taken in the things I have chosen to do. This thesis is dedicated to the memory of my latefather, a very special and rare man who keeps inspiring me.
ii

Acronyms3G third generation
ARD automatic relevance determination
ATIS air travel information system
ASR automatic speech recognition
ASU automatic speech understanding
AUROC area under the receiver operating characteristic
BN broadcast news
BSC base station controller
BTS base tranceiver station
CART classification and regression trees
CD context dependent
CDMA code division multiple access
CDPD cellular datagram packet data
CI context independent
CMS cepstral mean subtraction
CSD circuit switched data
DARPA defense advanced research projects agency
DET detection error trade-off
DFT discrete fourier transform
DTW dynamic time warping
DUC document understanding conferences
ERB equivalent rectangular bandwidth
FFT fast Fourier transform
FIR finite impulse response
FN false negative
FP false positive
GMM Gaussian mixture model
GPRS general packet radio service
GSM global standard for mobiles
HCI human computer interaction
HMM hidden Markov model
HLR home location register
HSCSD high speed circuit switched data
HTK hidden Markov model toolkit
IE information extraction
iii

iv
IIR infinite impulse response
IP internet protocol
IR information retrieval
LDC linguistic data consortium
LM language model
LPC linear predictive coding
LVCSR large vocabulary conversational speech recognition
LVF Las Vegas filter
MAP maximum a posteriori
MDS multi-document summarisation
MFCC mel-frequency cepstral coefficients
MLLR maximum likelihood linear regression
MLP multi-layer perceptron
MMIE maximum mutual information estimation
MMR maximum marginal relevance
MMS multimedia messaging service
MMSC multimedia messaging service center
MRROC maximum realisable ROC
MOS mean opinion score
MS mobile station
MSC mobile switching centre
MSG modulation-filtered spectrogram
MT machine translation
MUC message understanding conference
NAT network address translation
NE named entities
NIST national institute of standards and technology
NLP natural language processing
NN neural network
OTA over-the-air
OOV out of vocabulary
PAP push access protocol
PARADISE paradigm for dialogue system evaluation
PDA personal digital assistant
PDC personal digital cellular
RASTA relative spectra filtering

v
RMS root mean square
RNN recurrent neural network
ROC receiver operating characteristic
ROS rate of speech
ROVER recognizer output voting error reduction
RVM relevance vector machine
SBS sequential backward selection
SDR spoken document retrieval
SEE summary evaluation environment
SER slot error rate
SFS sequential forward selection
SFFS sequential forward floating selection
SM short sessage
SME short message entity
SMS short message service
SMSC short message service centre
SNR signal to noise ratio
SPRACH speech recognition algorithms for connectionist hybrids
SUMMAC summarisation conferences
TN true negative
TP true positive
TWER targeted word error rate
PAP push access protocol
PDA personal digital assistant
PI push initiator
PLP perceptual linear prediction
PPG push proxy gateway
ToBI tones and break indices
TCP/IP transmission control protocol / internet protocol
TREC text retrieval conference
TTS text-to-speech
UM unified messaging
UMTS universal mobile telephone system
URL uniform resource locator
USSD unstructured supplementary services data
VLR visitor location register

vi
VTA vertex triangulation area
VQ vector quantisation
VUI voice user interface
WAP wireless application protocol
WTA wireless telephony application
WER word error rate
WML wireless mark-up language
WWW world wide web
Contents
Abstract i
Acknowledgments ii
Acronyms iii
Table of Contents vii
List of Figures xi
List of Tables xiv
1 Introduction 11.1 Motivation . . . . . . . . . . . . . . . . . . . . . . . . . . . . . . . . . . . . . . 1
1.1.1 Digital convergence . . . . . . . . . . . . . . . . . . . . . . . . . . . . 21.1.2 Under-utilisation of prosodic cues in speech systems . . . . . . . . . . . 2
1.2 Voicemail and mobile messaging . . . . . . . . . . . . . . . . . . . . . . . . . . 31.2.1 System architecture . . . . . . . . . . . . . . . . . . . . . . . . . . . . . 4
1.3 Objectives of this research . . . . . . . . . . . . . . . . . . . . . . . . . . . . . 51.4 Thesis overview . . . . . . . . . . . . . . . . . . . . . . . . . . . . . . . . . . . 6
2 Hypothesis testing and performance measures 82.1 Pattern recognition . . . . . . . . . . . . . . . . . . . . . . . . . . . . . . . . . 82.2 Hypothesis testing . . . . . . . . . . . . . . . . . . . . . . . . . . . . . . . . . . 9
2.2.1 Confusion matrices . . . . . . . . . . . . . . . . . . . . . . . . . . . . . 102.3 Performance measures . . . . . . . . . . . . . . . . . . . . . . . . . . . . . . . 10
2.3.1 Sensitivity and specificity . . . . . . . . . . . . . . . . . . . . . . . . . 112.3.2 Precision and recall . . . . . . . . . . . . . . . . . . . . . . . . . . . . . 112.3.3 Euclidean distance . . . . . . . . . . . . . . . . . . . . . . . . . . . . . 112.3.4 Word error rate . . . . . . . . . . . . . . . . . . . . . . . . . . . . . . . 122.3.5 Slot error rate . . . . . . . . . . . . . . . . . . . . . . . . . . . . . . . . 12
2.4 ROC analysis . . . . . . . . . . . . . . . . . . . . . . . . . . . . . . . . . . . . 122.4.1 Area under the ROC curve . . . . . . . . . . . . . . . . . . . . . . . . . 142.4.2 DET curves . . . . . . . . . . . . . . . . . . . . . . . . . . . . . . . . . 142.4.3 Limitations of ROC analysis . . . . . . . . . . . . . . . . . . . . . . . . 14
2.5 Misclassification costs . . . . . . . . . . . . . . . . . . . . . . . . . . . . . . . 152.6 Usability testing . . . . . . . . . . . . . . . . . . . . . . . . . . . . . . . . . . . 15
2.6.1 Mean opinion score . . . . . . . . . . . . . . . . . . . . . . . . . . . . . 162.6.2 Kappa statistic . . . . . . . . . . . . . . . . . . . . . . . . . . . . . . . 16
2.7 Concluding discussion . . . . . . . . . . . . . . . . . . . . . . . . . . . . . . . 16
3 Component technologies 173.1 Automatic speech recognition . . . . . . . . . . . . . . . . . . . . . . . . . . . 17
3.1.1 Acoustic front-end . . . . . . . . . . . . . . . . . . . . . . . . . . . . . 203.1.2 Statistical language modelling . . . . . . . . . . . . . . . . . . . . . . . 213.1.3 Pronunciation lexicon . . . . . . . . . . . . . . . . . . . . . . . . . . . 23
vii

CONTENTS viii
3.1.4 Acoustic probability estimators for the HMM paradigm . . . . . . . . . . 243.1.5 Search algorithms . . . . . . . . . . . . . . . . . . . . . . . . . . . . . . 273.1.6 The Abbot/SPRACH system . . . . . . . . . . . . . . . . . . . . . . . . 28
3.2 Automatic summarisation . . . . . . . . . . . . . . . . . . . . . . . . . . . . . . 303.2.1 Text summarisation . . . . . . . . . . . . . . . . . . . . . . . . . . . . . 323.2.2 Speech summarisation . . . . . . . . . . . . . . . . . . . . . . . . . . . 34
3.3 Mobile messaging . . . . . . . . . . . . . . . . . . . . . . . . . . . . . . . . . . 363.3.1 Short message service . . . . . . . . . . . . . . . . . . . . . . . . . . . 363.3.2 Multimedia message service . . . . . . . . . . . . . . . . . . . . . . . . 373.3.3 Wireless application protocol . . . . . . . . . . . . . . . . . . . . . . . . 38
3.4 Hypotheses . . . . . . . . . . . . . . . . . . . . . . . . . . . . . . . . . . . . . 403.5 Concluding discussion . . . . . . . . . . . . . . . . . . . . . . . . . . . . . . . 40
4 Baseline voicemail summarisation system 424.1 Automatic transcription of voicemail speech . . . . . . . . . . . . . . . . . . . . 42
4.1.1 Experimental data . . . . . . . . . . . . . . . . . . . . . . . . . . . . . 434.1.2 Construction of the ASR component . . . . . . . . . . . . . . . . . . . . 44
4.2 Voicemail summarisation . . . . . . . . . . . . . . . . . . . . . . . . . . . . . . 494.2.1 Annotation protocol . . . . . . . . . . . . . . . . . . . . . . . . . . . . 504.2.2 Summarisation through term subtraction . . . . . . . . . . . . . . . . . . 51
4.3 System integration and performance evaluation . . . . . . . . . . . . . . . . . . 574.4 Message submission experiments . . . . . . . . . . . . . . . . . . . . . . . . . . 594.5 Concluding discussion . . . . . . . . . . . . . . . . . . . . . . . . . . . . . . . 61
5 Aspects of speech prosody 625.1 Definitions . . . . . . . . . . . . . . . . . . . . . . . . . . . . . . . . . . . . . . 62
5.1.1 Basic prosodic features . . . . . . . . . . . . . . . . . . . . . . . . . . . 635.1.2 Compound prosodic features . . . . . . . . . . . . . . . . . . . . . . . . 655.1.3 Computational theories of prosody . . . . . . . . . . . . . . . . . . . . . 67
5.2 Differences among languages and speakers . . . . . . . . . . . . . . . . . . . . 675.3 Differences between read and spontaneous speech . . . . . . . . . . . . . . . . . 68
5.3.1 Disfluencies . . . . . . . . . . . . . . . . . . . . . . . . . . . . . . . . . 685.4 Prosody in speech technology . . . . . . . . . . . . . . . . . . . . . . . . . . . 69
5.4.1 Speech synthesis . . . . . . . . . . . . . . . . . . . . . . . . . . . . . . 695.4.2 Speaker recognition . . . . . . . . . . . . . . . . . . . . . . . . . . . . 705.4.3 Automatic speech recognition . . . . . . . . . . . . . . . . . . . . . . . 705.4.4 Boundary detection . . . . . . . . . . . . . . . . . . . . . . . . . . . . . 715.4.5 Detection of speech acts . . . . . . . . . . . . . . . . . . . . . . . . . . 725.4.6 Speech understanding . . . . . . . . . . . . . . . . . . . . . . . . . . . 725.4.7 Speech summarisation . . . . . . . . . . . . . . . . . . . . . . . . . . . 73
5.5 Concluding discussion . . . . . . . . . . . . . . . . . . . . . . . . . . . . . . . 73
6 Feature selection 746.1 Importance of feature selection . . . . . . . . . . . . . . . . . . . . . . . . . . . 746.2 Characteristics of feature selection algorithms . . . . . . . . . . . . . . . . . . . 75
6.2.1 Search organisation . . . . . . . . . . . . . . . . . . . . . . . . . . . . . 766.2.2 Evaluation criteria . . . . . . . . . . . . . . . . . . . . . . . . . . . . . 776.2.3 Filters and wrappers . . . . . . . . . . . . . . . . . . . . . . . . . . . . 78

CONTENTS ix
6.3 Main feature selection paradigms . . . . . . . . . . . . . . . . . . . . . . . . . . 796.3.1 Decision trees . . . . . . . . . . . . . . . . . . . . . . . . . . . . . . . . 796.3.2 Automatic relevance determination . . . . . . . . . . . . . . . . . . . . 806.3.3 Relief and Focus . . . . . . . . . . . . . . . . . . . . . . . . . . . . . . 806.3.4 Boosting and bagging . . . . . . . . . . . . . . . . . . . . . . . . . . . 81
6.4 Feature selection in variable cost environments . . . . . . . . . . . . . . . . . . 826.4.1 Maximum realisable ROC . . . . . . . . . . . . . . . . . . . . . . . . . 826.4.2 The Parcel algorithm . . . . . . . . . . . . . . . . . . . . . . . . . . . . 83
6.5 Hypotheses . . . . . . . . . . . . . . . . . . . . . . . . . . . . . . . . . . . . . 856.6 Concluding discussion . . . . . . . . . . . . . . . . . . . . . . . . . . . . . . . 85
7 Feature selection experiments 877.1 Experimental framework and setup . . . . . . . . . . . . . . . . . . . . . . . . . 87
7.1.1 Computation of prosodic features . . . . . . . . . . . . . . . . . . . . . 887.1.2 Feature space search method . . . . . . . . . . . . . . . . . . . . . . . . 907.1.3 Classifiers used within Parcel . . . . . . . . . . . . . . . . . . . . . . . 917.1.4 Classification thresholds and rejection rates . . . . . . . . . . . . . . . . 93
7.2 The binary decision voicemail summarisation task . . . . . . . . . . . . . . . . . 947.2.1 Effect of training set size . . . . . . . . . . . . . . . . . . . . . . . . . . 947.2.2 Role of classifier type . . . . . . . . . . . . . . . . . . . . . . . . . . . . 957.2.3 The role of individual features . . . . . . . . . . . . . . . . . . . . . . . 957.2.4 MRROC operating points . . . . . . . . . . . . . . . . . . . . . . . . . 97
7.3 The multi-class voicemail summarisation task . . . . . . . . . . . . . . . . . . . 997.3.1 Role of classifier type . . . . . . . . . . . . . . . . . . . . . . . . . . . . 997.3.2 Comparison of individual features . . . . . . . . . . . . . . . . . . . . . 1007.3.3 MRROC operating points . . . . . . . . . . . . . . . . . . . . . . . . . 102
7.4 Summary post-processing . . . . . . . . . . . . . . . . . . . . . . . . . . . . . . 1047.5 Hypotheses . . . . . . . . . . . . . . . . . . . . . . . . . . . . . . . . . . . . . 1067.6 Concluding discussion . . . . . . . . . . . . . . . . . . . . . . . . . . . . . . . 106
8 Evaluation and usability issues 1088.1 Methods for evaluating summarisation . . . . . . . . . . . . . . . . . . . . . . . 108
8.1.1 Subjective evaluation measures . . . . . . . . . . . . . . . . . . . . . . 1098.1.2 Objective evaluation measures . . . . . . . . . . . . . . . . . . . . . . . 1098.1.3 Integrating subjective and objective measures . . . . . . . . . . . . . . . 110
8.2 Subjective evaluation and usability testing of voicemail summarisation . . . . . . 1118.2.1 Mean opinion score on eight types of summaries . . . . . . . . . . . . . 1128.2.2 Comprehension and usability tests . . . . . . . . . . . . . . . . . . . . . 113
8.3 Objective evaluation of voicemail summaries . . . . . . . . . . . . . . . . . . . 1178.3.1 Summaries evaluation based on SER . . . . . . . . . . . . . . . . . . . . 1188.3.2 Summaries evaluation based on ROC analysis . . . . . . . . . . . . . . . 123
8.4 Evaluation framework for voicemail summarisation . . . . . . . . . . . . . . . . 1248.5 Concluding discussion . . . . . . . . . . . . . . . . . . . . . . . . . . . . . . . 126

CONTENTS x
9 Conclusions and future work 1279.1 General approach of the thesis . . . . . . . . . . . . . . . . . . . . . . . . . . . 1279.2 Contributions of the thesis . . . . . . . . . . . . . . . . . . . . . . . . . . . . . 1289.3 Summary of the experimental results . . . . . . . . . . . . . . . . . . . . . . . . 1299.4 Suggestions for future work . . . . . . . . . . . . . . . . . . . . . . . . . . . . . 132
9.4.1 ASR component . . . . . . . . . . . . . . . . . . . . . . . . . . . . . . 1329.4.2 Summarisation component . . . . . . . . . . . . . . . . . . . . . . . . . 1339.4.3 Messaging component . . . . . . . . . . . . . . . . . . . . . . . . . . . 1339.4.4 Evaluation . . . . . . . . . . . . . . . . . . . . . . . . . . . . . . . . . 134
A Annotated test sets 135A.1 test42 . . . . . . . . . . . . . . . . . . . . . . . . . . . . . . . . . . . . . . . . 135A.2 test50 . . . . . . . . . . . . . . . . . . . . . . . . . . . . . . . . . . . . . . . . 140
B Results obtained by using smaller training sets 147
C Summaries used in MOS tests 153
D Summaries used in message comprehension tests 156D.1 HT transcription . . . . . . . . . . . . . . . . . . . . . . . . . . . . . . . . . . . 156D.2 SR1 transcription . . . . . . . . . . . . . . . . . . . . . . . . . . . . . . . . . . 157
References 172
List of Figures1.1 The global architecture of the automatic voicemail summarisation system for mo-
bile messaging (VoiSum). . . . . . . . . . . . . . . . . . . . . . . . . . . . . . . 42.1 The basic components of almost every pattern recognition system. A feature ex-
tractor measures object properties that are useful for classification. The classifieruses these features to assign the observation to a category (class). . . . . . . . . 9
2.2 Confusion matrix for a two-class classification problem. . . . . . . . . . . . . . 102.3 Typical ROC curves of three classification systems: A, B and R. . . . . . . . . . 132.4 Relationship between the classification error rate and the threshold used to make
a decision. . . . . . . . . . . . . . . . . . . . . . . . . . . . . . . . . . . . . . . 133.1 General block diagram for a standard ASR system. The pronunciation, language,
and acoustic model components construct a hypothesis for interpreting a speechsignal. . . . . . . . . . . . . . . . . . . . . . . . . . . . . . . . . . . . . . . . . 18
3.2 The likelihood P x ci vs. the posterior P ci x for two classes c1 c2 , af-ter [Riis, 1998]. . . . . . . . . . . . . . . . . . . . . . . . . . . . . . . . . . . . 27
3.3 An overview of the Abbot/SPRACH ASR system. Only the MLP acoustic classi-fier that was used in this work is depicted. . . . . . . . . . . . . . . . . . . . . . 29
3.4 A high level architecture of a summarisation system depicting the phases of inputanalysis, transformation and synthesis, after [Mani and Maybury, 1999]. . . . . . 31
3.5 The basic network elements and architecture of SMS. . . . . . . . . . . . . . . . 383.6 The basic network elements and architecture of WAP Push. . . . . . . . . . . . 394.1 The number of target words versus the total number of words in the message
transcriptions comprising test42 (top) and test50 (bottom). . . . . . . . . . . . . 524.2 Sample of the tool used to collect summaries produced by different annotators,
which then were analysed regarding their similarity. . . . . . . . . . . . . . . . . 534.3 The frequency of compression rates used by 16 human annotators to summarise 5
random messages within a range of 20-30%. . . . . . . . . . . . . . . . . . . . . 544.4 A schematic outline of the mechanism that assigns scores to each recognised word
reflecting empirical observations regarding a combination of statistics and priorknowledge. Each term in the recogniser output is assigned a score based on aacoustic confidence measure, collection frequency weight and membership of pre-defined NE lists. . . . . . . . . . . . . . . . . . . . . . . . . . . . . . . . . . . . 55
4.5 A schematic outline of the mechanism that removes the words with the lowestscore till the message length restrictions are met. A list of common abbreviationsis also used to compact the text without losing information. . . . . . . . . . . . . 56
4.6 Sample of the MOS evaluation (message 7 of test42). The human transcription isshown on the left while three summaries with compression rates 60%, 40% and20% are shown on the right. . . . . . . . . . . . . . . . . . . . . . . . . . . . . 57
4.7 MOS results on how well each summary retains the information contained in theoriginal transcriptions of the 10 longest messages of the test42. . . . . . . . . . . 58
4.8 Summary retrieval of message vm1dev26 on the display of a WAP phone. Anoptional connection to the voicemail system in order to listen to the particularmessage is provided by the WTA. . . . . . . . . . . . . . . . . . . . . . . . . . 58
4.9 Overview of the testbed used to estimate message summaries submission delays. 60
xi

LIST OF FIGURES xii
4.10 Average setup and submission delays corresponding to the delivery 25 voicemailmessages (50 SMs in total) within each time range. All SMs first get sent to theSMSC from where they are routed to the mobile terminal. . . . . . . . . . . . . . 60
6.1 An overview of filter and wrapper approaches for feature selection. The filter ap-proach is independent of the classification algorithm and optimises simple criteriawhich tend to improve performance. In the wrapper approach a classification al-gorithm is retrained and re-evaluated to estimate the accuracy of different featuresubsets. . . . . . . . . . . . . . . . . . . . . . . . . . . . . . . . . . . . . . . . 78
6.2 The output of a realisable classifier CR is obtained by switching between the out-puts of CA and CB classifiers. The performance of this hybrid classifier surpassesthat of the actual classifiers for some operating conditions. . . . . . . . . . . . . 82
6.3 The operation of the Parcel algorithm with the objective to find the MRROCfor a task with a data set described by the features a , b and c , af-ter [Scott et al., 1998]. It demonstrates how subsets of features are compared un-der different costs according to whether they extend the MRROC. . . . . . . . . 84
7.1 The extractive summarisation approach at a glance. Text summaries of spo-ken messages are constructed using a synchronised combination of lexical andprosodic feature subsets. . . . . . . . . . . . . . . . . . . . . . . . . . . . . . . 88
7.2 SFS for a set of input features, denoted f1 f2 f16 f24. We augment thefeature set as follows. The single best feature is chosen first, and then features areadded one at a time such as that at each stage the feature chosen is the one whichproduces the greatest increase in the AUROC. . . . . . . . . . . . . . . . . . . . 91
7.3 The role of threshold and rejection rates in the classification experiments (onlytwo word classes are assumed). . . . . . . . . . . . . . . . . . . . . . . . . . . . 93
7.4 Schematic representation of the binary decision summarisation task. . . . . . . . 947.5 ROC curves produced by Parcel for the binary decision summarisation task using
the five classifiers described in Table 7.1 and the features listed in Table 7.2 forfour different sizes of training data sets. The accuracy of the classifiers convergesas the amount of training data increases. . . . . . . . . . . . . . . . . . . . . . . 96
7.6 The ROC curves produced for the binary decision summarisation task using asinputs to a linear classifier the individual features of Table 7.2 with respect to fourtraining sets containing different amount of data. . . . . . . . . . . . . . . . . . 97
7.7 The MRROC curves produced by Parcel on the validation set using lexical only,prosodic only and combination of lexical and prosodic features. Three differentfeature subsets with different TP/FP trade-off denoted with A, B, C are also de-picted. Lexical features as classifier inputs clearly dominate prosodic features inthe entire ROC space. The combination of lexical and prosodic features givessuperior accuracy than any single constituent classification system. . . . . . . . . 98
7.8 Schematic representation of the multi-class summarisation task. . . . . . . . . . 1007.9 The ROC curves produced by the Parcel algorithm for the multi-class task on the
validation set using the single layer network and the MLP classifiers after trainingon 800 voicemail messages. . . . . . . . . . . . . . . . . . . . . . . . . . . . . 102
7.10 The ROC curves produced for the multi-class summarisation task using as inputsto a linear classifier the individual features of Table 7.4 with respect to a trainingset containing 800 messages. . . . . . . . . . . . . . . . . . . . . . . . . . . . . 103

LIST OF FIGURES xiii
7.11 The MRROC curves produced by the Parcel algorithm for the multi-class task onthe validation set using the single layer network and MLP classifiers after trainingon 800 voicemail messages. Details of the operating points closer to the optimalclassifier are also shown. . . . . . . . . . . . . . . . . . . . . . . . . . . . . . . 104
7.12 Examples of summarisation errors that the post processing algorithm corrects. . 1058.1 PARADISE’s structure of objectives for evaluating spoken dialogue performance,
after [Walker et al., 1998]. . . . . . . . . . . . . . . . . . . . . . . . . . . . . . 1118.2 Average MOS on 8 types of summaries explained in Table 8.1 for each of 5 mes-
sages contained in test42 as judged by 10 subjects. . . . . . . . . . . . . . . . . 1148.3 A glimpse of the interface we designed for audiovisual assessment of the applica-
tion. Its purpose was first to collect the answers regarding message comprehensionfor comparisons and second to estimate the time needed to read text summariesversus retrieving the original audio messages. . . . . . . . . . . . . . . . . . . . 115
8.4 Message comprehension times comparing accessing the text summaries and orig-inal audio on a WAP phone emulator. Summaries used were produced using bothHT and SR1 transcriptions. . . . . . . . . . . . . . . . . . . . . . . . . . . . . . 118
8.5 A schematic illustration of the 50% overlap criterion used to assess the time align-ment of the hypothesised summary, after [Weintraub et al., 1997]. . . . . . . . . 119
8.6 Extractive summarisation scores on the binary decision task produced by the A800classification systems (Table 8.5) on test42 and test50 respectively for SR1, SR2and HT input transcriptions. . . . . . . . . . . . . . . . . . . . . . . . . . . . . 120
8.7 Extractive summarisation scores for the multi-class task produced by the A800classification systems (Table 8.5) on test42 and test50 respectively for SR1, SR2and HT input transcriptions. . . . . . . . . . . . . . . . . . . . . . . . . . . . . 121
8.8 ROC operating points of the binary decision task summarisers (left graph) whoseoperating points shown in bottom right subplot of Figure 7.7 and the multi-classtask summariser (right graph) whose operating points shown in Figure 7.11 aftercombining them according to the method described in Section 7.3.3. The operat-ing points correspond to test42 and test50 for SR1, SR2 and HT input transcriptions.122
8.9 Evaluation framework of voicemail summarisation for mobile messaging. Its goalis to determine which evaluation metrics maximise summary quality and min-imise delivery costs by combining user data and comparing system configurationswith different trade-offs. The metrics associated with this framework are listed inTable 8.7. . . . . . . . . . . . . . . . . . . . . . . . . . . . . . . . . . . . . . . 124
A.1 The target compression rates for each message contained in test42 broken downinto four classes, namely proper names, telephone numbers, date/time and other.The average rate is 29.3%. . . . . . . . . . . . . . . . . . . . . . . . . . . . . . 139
A.2 The target compression rates for each message contained in test50 broken downinto four classes, namely proper names, telephone numbers, date/time and other.The average rate is 19.4%. . . . . . . . . . . . . . . . . . . . . . . . . . . . . . 146
B.1 ROC operating points of the binary decision task summarisers trained with 200,400 and 600 voicemail messages (see Figure 7.7), respectively. The operatingpoints correspond to test42 and test50 for SR1, SR2 and HT input transcriptions . 151

List of Tables4.1 Recognition performance on test42 after bootstrapping from the BN acoustics and
the effect of combining VMail15 and BN bigrams. . . . . . . . . . . . . . . . . 464.2 Effect of modelling compound words in performance and comparison of different
acoustic features. . . . . . . . . . . . . . . . . . . . . . . . . . . . . . . . . . . 474.3 Compound words modelled in the ASR system and some of their alternative pro-
nunciations. . . . . . . . . . . . . . . . . . . . . . . . . . . . . . . . . . . . . . 484.4 Improvements in transcription accuracy after augmenting both the language model
and vocabulary with task specific compound words and Hub-4 BN and Switch-board sentences that scored low perplexity with respect to the Voicemail trainingset language model. . . . . . . . . . . . . . . . . . . . . . . . . . . . . . . . . . 49
4.5 Words excluded from the summaries during the annotation phase. . . . . . . . . 504.6 Description of the data sets used to perform the summarisation experiments. . . . 514.7 Agreement among 16 annotators on five random messages contained in test42.
The proportion of target and non target tags as well as the Kappa statistic, Po andPe (Section 2.6.2) for each message are shown. . . . . . . . . . . . . . . . . . . 53
4.8 Human transcription, automatic transcription, summary and WML template of thevm1dev26 spoken message. . . . . . . . . . . . . . . . . . . . . . . . . . . . . . 59
7.1 Classifiers used within the Parcel feature subset selection algorithm. . . . . . . . 927.2 Lexical and prosodic features calculated for each word in the voicemail training,
validation and test sets for the binary decision task. The features marked with anasterisk (*) are represented by binary variables (indicating presence or absense ofthe property). . . . . . . . . . . . . . . . . . . . . . . . . . . . . . . . . . . . . 95
7.3 Operating points of the MRROC curves on the validation set after training on 800voicemail messages within the binary decision class. . . . . . . . . . . . . . . . 99
7.4 Lexical and prosodic features calculated for each word in the voicemail training,validation and test sets for the multi-class task. The features marked with anasterisk (*) are represented by binary variables. . . . . . . . . . . . . . . . . . . 101
7.5 Operating points of the MRROC curves for the multi-class task on the validationset after training on 800 voicemail messages. . . . . . . . . . . . . . . . . . . . 105
8.1 The eight types of summarisation methods applied to five random messages intest42. . . . . . . . . . . . . . . . . . . . . . . . . . . . . . . . . . . . . . . . . 112
8.2 Inter-subject agreement on eight summaries for each of five random messagesin test42 as judged by 10 human subjects. The results (Amount of summaries /Kappa statistic) are categorised by score class (1-5) and message number. . . . . 113
8.3 Comparison of the answers given by 16 subjects who were presented with textsummaries and the original audio of 15 voicemail messages. . . . . . . . . . . . 116
8.4 Message priority confusion matrices as determined by 16 subjects who were ini-tially presented with the automatically produced text summaries and later withthe original audio of 15 messages. Each column corresponds to the percentageof messages classified as low/medium/high priority based on text summaries andeach row gives the percentage of messages classified as low/medium/high prioritybased on the original audio. The degree of consistency across judgements can bedetermined by summing up the diagonal values. . . . . . . . . . . . . . . . . . 117
8.5 Extractive summarisation scores for the binary decision task on test42 and test50after training using 800 voicemail messages. . . . . . . . . . . . . . . . . . . . . 119
xiv

LIST OF TABLES xv
8.6 The VTA values for the summarisers whose operating points shown in the graphsdepicted in Figure 8.8. The VTA values have been multiplied by a factor of 100to give a number that is similar to percent classification. The results correspond totest42 and test50 for both speech recognition output and human transcription. . . 123
8.7 Metrics related to the proposed evaluation framework for the VoiSum system. . . 1259.1 Average percentage of correct answers in message comprehension. . . . . . . . . 132B.1 Operating points of the MRROC curves on the validation set after training with
200 voicemail messages. . . . . . . . . . . . . . . . . . . . . . . . . . . . . . . 148B.2 Operating points of the MRROC curves on the validation set after training with
400 voicemail messages. . . . . . . . . . . . . . . . . . . . . . . . . . . . . . . 148B.3 Operating points of the MRROC curves on the validation set after training with
600 voicemail messages. . . . . . . . . . . . . . . . . . . . . . . . . . . . . . . 149B.4 Extractive summarisation scores for the binary decision task on test42 and test50
after training with 200, 400 and 600 voicemail messages. See Table 8.5 for theresults using 800 messages as training set. . . . . . . . . . . . . . . . . . . . . . 150
B.5 Extractive summarisation scores for the multi-class task on test50 having trainedwith 800 and validated with 200 voicemail messages. . . . . . . . . . . . . . . . 152
B.6 The VTA values for the binary task summarisers whose operating points shown inFigure 8.8 (left graph) after training with 200, 400 and 600 voicemail messages.See Table 8.6 for the results using 800 messages as training set. The VTA val-ues have been multiplied by a factor of 100 to give a number that is similar topercent classification. The results correspond to test42 and test50 for both speechrecognition output and human transcription. . . . . . . . . . . . . . . . . . . . . 152

1. Introduction
This chapter describes the motivation behind integrating a system capable of performing voice-mail summarisation with a wireless communication network. Emphasis is given on the digitalconvergence and the under-utilisation of prosodic cues in speech systems. A brief review of se-lected related work in this field during the last decade follows. We then describe the proposedautomatic voicemail summarisation for mobile messaging (VoiSum) architecture and the advan-tages it can offer to both users and service providers. In the last sections we outline the objectivesof this research and give a description of the thesis structure.
1.1 MotivationSpoken and written human language is a very powerful and flexible means of expressing, com-municating and retrieving knowledge. Humans can recognise the gist of what was said ratherthan the precise word sequence. In addition, humans can assimilate information faster throughthe eyes than the ears. Listening to a speech recording requires more effort than visually scanninga document because of the transient and temporal nature of audio. Audio recordings capture therichness of speech, yet it is not easy to directly browse the stored information. At the same time,transcribed spontaneous speech usually includes various kinds of redundant information.
The increased proliferation of audio content has recently motivated several projects in thefield of extracting and accessing information from audio files. The most notable successes havebeen spoken document retrieval (SDR) and named entities (NE) extraction. SDR was evalu-ated as part of the text retrieval conference (TREC) from 1997-2000, giving the important resultthat retrieval performance on automatic speech recognition (ASR) output was similar to that ob-tained using human-generated reference transcripts, with little or no dependence on transcriptionerrors [Garofolo et al., 2001]. This is not the case for all tasks which involve accessing infor-mation in spoken audio: it has been observed that the accuracy of NE identification is strongly
1

CHAPTER 1. INTRODUCTION 2
correlated with the number of transcription errors [Kubala et al., 1998, Gotoh and Renals, 2000a,Palmer et al., 2000].
The automatic summarisation of spoken language is a challenging scientific problem. Theexistence of automatic speech summarisers would enable many practical applications such as theconstruction of automatically annotated audio archives, integrated mixed media communicationsystems and innovative multimodal interfaces.
1.1.1 Digital convergenceWireless communication systems lead to powerful networks in ubiquitous environments, offer-ing advanced services. A new class of devices makes information access and processing easilyavailable regardless of ones physical location. Users are enabled to exchange and retrieve the in-formation they need quickly, efficiently, and effortlessly. In conventional communication systems,telephone calls can either be quite disruptive or do not reach the desired person. In response tothis, mobile networks are being converted from voice-only communication to a rich combinationof voice and messaging and modern phones evolve from a simple person-to-person voice interfaceto powerful network clients. But because limited data storage and display capabilities are avail-able on mobile terminals, large volume data transfers are inappropriate. Further, it is generallydifficult to manage all the different kinds of information that people receive. For instance, theyhave to dial in and pick up emails, pick up their faxes from fax machines, call in and listen tovoicemail messages. With further deployment of unified messaging (UM) solutions mobile userswill be able to access, respond to and manage several forms of communication from a varietyof devices, including landline phones, mobile phones, PDAs and laptop computers. UM is anemerging value-added network service that elevates communication above the technology used tocommunicate – the message content takes precedence over the media and recent progress in ASRcreates new opportunities for messaging solutions.
1.1.2 Under-utilisation of prosodic cues in speech systemsDesigners of ASR systems tend to focus equally on all words, both informative and non-informative. The prosody of speech – among other things its duration, pitch and energy – candisambiguate a text transcription (e.g. question or statement), and add new information (e.g. thespeakers emotional state). However, the current capabilities for integration of higher-level in-formation are quite primitive, except in specialised systems that are designed for very restrictedapplication domains. With few exceptions, automatic speech understanding (ASU) systems arebuilt by linking together separate, stand-alone ASR and natural language processing (NLP) com-ponents. As spoken language interfaces target real-life systems and slowly find their way intothe market, it becomes apparent that such interfaces will need to draw on a variety of cues fromdiverse sources to achieve a robustness and naturalness approaching that of human performance.
In fact, the most successful current speech systems are based on hybrid architectures thatincorporate a broad spectrum of rule-based and machine learning1 from large corpora methods toachieve an adequate level of robustness and accuracy. In the rule-based approach, an expert createsan analytic model and methodology which solves the problem of interest directly. A rule-basedapproach to voicemail summarisation would therefore require one to design a set of decisions toconstruct summaries by extracting words from message transcriptions. Machine learning refers
1A dichotomy between rule-based and machine learning systems can be vague if we consider the intermediateposition for a machine learning algorithm that seeks to simulate some features of human expertise, e.g. supervisedlearning. A differentiating factor is though the large scale computational implementations that allow a cycle of theoryformation, implementation, testing, and reformulation and provide the basis for a scientifically cumulative approach.

CHAPTER 1. INTRODUCTION 3
to a system capable of the autonomous acquisition of domain-specific knowledge. This capacityto learn from experience, analytical observation, and other means, results in a system that cancontinuously self-improve and thereby offer increased efficiency and effectiveness. Since prosodyis independent of word identity, one can expect that it may offer complementary informationduring the task of automatic speech summarisation. However, our knowledge of how the aboverelationships behave in general is still very sketchy. We lack a solid theoretical framework forpredicting which cues will prove useful in practice and for specifying how these cues should becombined to signal or cancel out potential interpretations of spoken messages.
1.2 Voicemail and mobile messagingVoicemail is a conversational interaction between a human and a machine with no feedback fromthe machine. These systems are typically controlled by computers and can be accessed throughtelephone networks. Voicemail systems can record and store voice messages digitally while theuser is away or simply unavailable and can be reviewed when the user returns. Alternatively,the user can call in on a touch tone phone and review stored messages. Voicemail messages aretypically short, convey the reason for the call and a return telephone number. The message shouldcontain the information that the caller requires from the voicemail recipient.
Although, several advances in voicemail retrieval scheme have been proposed,e.g. [Kato, 1994, Paksoy et al., 1997, Hirschberg et al., 2001], the limitations of the old paradigmremain. Users of voicemail systems on the receipt of a notification have to call their voicemail sys-tem and download/listen to their actual/compressed messages.2 However, they are likely to wantto receive their voicemail on handheld terminals – especially for messages taken by voicemailsystems other than the one provided by the network operator, e.g. home or corporate voicemailsystem. The above shows that there is a lot of information that is useful to a user, but which theuser does not see because a) it is not known when it becomes available (i.e. lack of notificationfacility), or b) the notification refers only to changes in status (e.g. arrival of new messages) andnot to actual content. Information contained in voicemail messages is often time sensitive andideally needs to be forwarded to the user either at predefined intervals or as soon as it becomesavailable. In order to achieve this, the following interdependent issues have to be resolved:
access the vast volume of background knowledge that is needed to interpret a random spo-ken message
make it instantly and securely available to its recipient
A major motivation behind this research is to establish an efficient voicemail retrieval schemeby creating and sending summaries of incoming messages on displays of mobile terminals. Ac-cording to our approach the content is delivered to the mobile terminal directly from a sourcewithout an explicit user request. This is also beyond the conventional request/response modelfound in most wireless application protocol (WAP) applications (e.g. [Metter and Colomb, 2000])and the world wide web (WWW), where a user enters a URL (the request) which is sent to aserver, and the server answers by sending a web page (the response) to the user.
A complete speech summarisation system demands both spoken language understandingand language generation, and is well beyond the current state-of-the-art. However, it has beendemonstrated that it is possible to use simpler techniques to produce summaries that are of
2ScanMail, the system proposed by [Hirschberg et al., 2001] allows users to browse and search the full messagetranscription of their voicemail messages by content through a graphical user interface.

CHAPTER 1. INTRODUCTION 4
some use. The earliest reported work in speech summarisation concerned the generation ofcrude summaries based on acoustic emphasis [Chen and Withgott, 1992] and the classificationof parts of dialogue [Rohlicek et al., 1992]. More recently, with the advent of large vocabularyspeaker-independent continuous ASR, speech summarisation research has focused on the appli-cation of text-based methods to ASR output [Valenza et al., 1999, Koumpis and Renals, 2000,Hori and Furui, 2000]. At the same time, researchers have begun to use prosodic infor-mation for tasks such as identification of speech acts [Warnke et al., 1997], sentence andtopic segmentation [Hirschberg and Nakatani, 1998, Shriberg et al., 2000] and NE identifica-tion [Hakkani-Tur et al., 1999]. The above work is based on the hypothesis that the combinationof prosodic, acoustic and language information can achieve results that are more robust than thoseof single sources.
Gateway
Mobile Network
OUTPUT:Text on display
INPUT:Telephone Speech
Voicemail System
Mobile Ter minal
Content Server
Internet
Speech RecogniserMessage SummariserMessage Init iator
Intranet
Figure 1.1: The global architecture of the automatic voicemail summarisation system for mobilemessaging (VoiSum).
1.2.1 System architectureThree component technologies namely ASR, automatic summarisation and mobile messaging areincorporated into the system’s architecture which is depicted in Figure 1.1 and encompasses threedistinct phases of processing:
1. transcription of voicemail messages
2. construction and formation of text summaries
3. delivery of text summaries via a wireless network
The spoken messages collected by the voicemail system are forwarded to the content server wherethey are automatically transcribed and summarised. There is clearly no restriction on where the

CHAPTER 1. INTRODUCTION 5
voicemail system is located and will most likely not to be located anywhere geographically closeto the content server, allowing access to answering services other than the one provided by thenetwork operator. The message initiator contacts the gateway over the Internet and delivers themessages. The gateway examines the message and performs the required encoding and transfor-mation. The messages are then transmitted hop-by-hop in the mobile network to the mobile client.The message initiator is then notified by the gateway about the final outcome of the operation.
Advantages for usersAutomatically produced text summaries from spoken messages can serve multiple goals. Theyprovide condensed versions of the original messages for rapid digestion and indexing of infor-mation contained therein. This would enable the message recipient to quickly determine the im-portance of an incoming message and take appropriate action. Text summaries can also be usedfor browsing contents of a full message transcription, with the intention of retrieving the corre-sponding portions of a message transcription when more information is needed. Another usageis related to the removal of non-essential or incorrect information from message transcriptions.In general, proactive delivery of text voicemail summaries to mobile terminals can reduce delaysto important decision-making by capturing and distributing information quickly, no matter one’slocation and without human intervention. This makes voicemail retrieval on the move much moreefficient and cost effective. Additionally, the proposed system offers uninterrupted informationflow in noisy places (e.g. crowded streets, train stations, airports) or in so called ‘mobile phonefree’ environments (e.g. conferences or meeting rooms), better message management, i.e. visuallisting of messages and lower cost of receiving calls while roaming abroad.
Advantages for service providersAutomatic voicemail summarisation for mobile messaging is a new value-added service for mo-bile service providers. Such services are essential because improved user experience can boostservice usage and strengthen existing customer relationships resulting in increased revenue. Thepush model adopted in our architecture minimises unecessary request activities by users whichin wireless environments would simply mean inefficient and wasteful use of network resources.Furthermore, by offering an advanced voicemail service, providers can differentiate from theircompetitors and build competencies in potentialy important areas such as ASR and informationextraction (IE).
1.3 Objectives of this researchThe objectives of the research reported in this thesis are as follows:
1. Design an architecture that overcomes the limitations of the existing voicemail retrievalparadigm. Identify suitable component technologies and conduct an extended literaturereview to establish their advantages and limitations.
2. Annotate a large number of messages contained in the IBM Voicemail Corpus to createreference summaries for training, validation and testing purposes. Study any patterns in thesummarisation style and the degree of agreement among different annotators.
3. Implement a compact ASR system with competitive performance. Investigate ways to in-crease its recognition accuracy.

CHAPTER 1. INTRODUCTION 6
4. Perform a feasibility study by constructing a rule-based summarisation system that useslexical information and acoustic confidence to remove the least informative words fromthe transcriptions. Examine the validity of the architecture and evaluate the summariesproduced using a subjective method.
5. Review the role of prosody in spoken language systems. Construct a methodology to au-tomatically extract a large number of prosodic features and associate them with the ASRoutput.
6. Design two summarisation tasks and use them to conduct all subsequent experiments. Studythe role of individual features on discrimination between word classes using a linear classi-fier and estimate the contribution of prosodic ones.
7. Identify and implement a powerful feature subset selection framework and conduct experi-ments with a variety of configurations e.g. classifiers, thresholds and rejection rates.
8. Establish the degree of correlation between individual features and the content words andstudy the role of training set size, type of classifier by comparing the results in a systematicway.
9. Review existing evaluation methods for summarisation systems. Evaluate the quality of thesummaries produced using purpose designed subjective and objective measures. Propose aframework for voicemail summarisation that integrates the above measures.
10. Discuss the experiences from the design and implementation of the voicemail summarisa-tion system for mobile messaging and identify areas of future work.
1.4 Thesis overviewThis thesis is concerned with the automatic summarisation of voicemail messages and makes sci-entific and technical contributions to the use and interaction of ASR, speech summarisation andmobile messaging technologies. A rule-based method is used to construct the baseline systemwhich we then augment with information derived from prosodic cues using machine learning ap-proaches. The remainder of this thesis is organised into eight chapters, in which we investigatetheoretical and practical issues related to the design and implementation of the VoiSum architec-ture (Figure 1.1).
Chapter 2: Hypothesis testing and performance measures provides an introduction intopattern recognition and discusses the need for hypothesis testing during the design of related sys-tems. It continues with the definitions of several objective and subjective performance measuresthat are used to evaluate the outcome of experiments throughout the thesis.
Chapter 3: Component technologies comprises three main sections and provides technicalbackground for the thesis. The first section gives an overview of the ASR problem with em-phasis on the hybrid connectionist/hidden Markov model (HMM) approach. The second sectiondescribes the task of automatic summarisation providing an overview of the main challenges andmethodologies and identify outstanding problems related to the voicemail task. The third sec-tion describes the characteristics of present day’s mobile messaging and the limitations that thisintroduces to the amount of information that can be delivered.
Chapter 4: Baseline voicemail summarisation system describes the implementation of thebaseline voicemail summarisation system. The evaluation of the ASR component shows that a

CHAPTER 1. INTRODUCTION 7
hybrid connectionist/HMM approach offers good performance using fewer parameters than alter-native systems. We then define the problem of voicemail summarisation and describe the annota-tion of messages for training, validating and testing purposes. A simple weighting of lexical andaudio-specific features is used to score words. The lowest scoring words are being removed toform summaries of messages.
Chapter 5: Aspects of speech prosody presents definitions of prosodic phenomena and at-tempts a basic taxonomy. We then give an overview of the main theoretical and experimentaldevelopments of research in prosody from the view point of practical applications in speech tech-nology. We argue that computational models of prosody can be useful in automatic speech sum-marisation because speech processing systems do not have a detailed semantic representation andextensive knowledge resources to help them recover from errors and ambiguities.
Chapter 6: Feature selection reviews some of the major paradigms for selecting differenttypes of features and focuses on variable cost domains using ROC analysis. As many tens oflexical and prosodic features can be identified and calculated, it is desirable to select a subset ofsuch features and to discard the remainder. This can be useful if there are features which carrylittle useful information for the particular task, or if there are very strong correlations betweensets of inputs so that the same information is repeated in several features. Reduced dimensionalityalso makes the classification calculations quicker, saves storage space and permits rapid featureextraction.
Chapter 7: Feature selection experiments presents a set of experiments specific to the de-velopment of the voicemail summarisation component. We start by describing the experimentalsetup, the data sets and the calculation of the features used to identify content words. We thenexplain how multiple knowledge sources encoded as lexical and prosodic features are integratedin a transparent way at the word level to generate summaries. Two main tasks are presented andcompared in order to establish the contribution of individual features and study the effect of theamount of training data and types of classifiers employed. A post-processing algorithm that isapplied over the automatically generated summaries to increase their quality is also presented.
Chapter 8: Evaluation and usability issues starts by reviewing approaches and measuresfor objective and subjective summary evaluation in general and presents results on the two sum-marisation tasks. It also proposes a framework for evaluating and comparing the performanceof voicemail summarisation systems for mobile messaging. The framework combines messageattributes in a way that constructs and delivers summaries that satisfy most of the users most ofthe time.
Chapter 9: Conclusions and future work reviews the contributions of the thesis and sum-marises the key findings. It also describes potential future extensions to this work.The thesis also contains four appendices which list data and results that omitted from the abovechapters for the sake of brevity.

2. Hypothesis testing and performancemeasures
This chapter provides an introduction to the principal concepts of pattern recognition, whichwill be central to our approach in ASR and automatic speech summarisation problems. We thendiscuss the need for hypothesis testing when designing pattern recognition systems. Throughoutthe thesis we shall come up with a series of hypotheses which will be followed by experiments toexamine their validity. We continue with the definitions of several performance measures relatedto error rates that are used to evaluate the outcome of the experiments. Emphasis is given onreceiver operating characteristic (ROC) analysis, a nonparametric test statistic, which is simpleyet effective in comparing classification rules even in variable cost domains. We then discussissues related to subjective evaluations that examine the extent to which the intended user canmeet his or her goals using the system being tested.
2.1 Pattern recognitionPattern recognition is the research area that studies the operation and design of systems thatrecognise patterns in data. In a narrow sense, the pattern recognition can be parcelled to dataacquisition and preprocessing, feature extraction and classification. Using a broad enough in-terpretation, we can find pattern recognition in every intelligent activity. There are many kindsof patterns – visual patterns, temporal patterns, logical patterns. In addition to general refer-ences such as [Bishop, 1995, Hand, 1997, Duda et al., 2000], issues of pattern recognition areextensively covered in the literature of many specific application areas such a speech and imagerecognition. No single theory of pattern recognition can possibly cope with such a broad rangeof problems. However, there are several standard models, including: statistical or fuzzy patternrecognition [Fukunaga, 1990], syntactic or structural pattern recognition [Schalkoff, 1992] and
8

CHAPTER 2. HYPOTHESIS TESTING AND PERFORMANCE MEASURES 9
knowledge-based pattern recognition [Stefik, 1995]. We are going to delimit this research into thestatistical approach viewing pattern recognition as a classification model or classifier – mappingan input to a predicted category or class.
What makes classification problems hard is that there can be a large degree of variability of in-puts that belong in the same class, relative to the differences between patterns in different classes.Furthermore, due to the curse of dimensionality [Bellman, 1961], increasing the dimensionalityof the feature space enhances the training set discrimination but rapidly leads to sparseness of thetraining data, poor representation of the vector densities, and thereby decreasing classication per-formance. One way to cope with such problems is to look for characteristic properties or features.This leads to the following classical model for pattern recognition: a system or program called thefeature extractor processes the raw data to determine the numerical values for a set of d featuresx1 x2 xd which comprise the components of a feature vector X. A system or program calledthe classifier receives x and assigns it to one of c categories, C1 C2 Cc.
Raw data Featureextractor Classifier
x 1
x 2
...
x d
Featurevector
C1 ...C2 Cc| |Class
Figure 2.1: The basic components of almost every pattern recognition system. A feature extractormeasures object properties that are useful for classification. The classifier uses these features toassign the observation to a category (class).
The design of the feature extractor is very problem dependent. The ideal feature extractorwould produce the same feature vector x for all patterns in the same class, and different featurevectors for patterns in different classes. In practice, different inputs to the feature extractor willalways produce different feature vectors, but we hope that the within-class variability is small rela-tive to the between-class variability, or at least that the classes are well separated. Efficient featureextraction is crucial for reliable classification and, if possible, these two subsystems should bematched optimally in the design of a complete pattern recognition system. The best classifier fora given task can be found by experimenting with different designs and a choice of criteria which,in addition to classification accuracy (Section 2.3), can include other issues such as computationalcomplexity and feasibility of efficient implementation.
2.2 Hypothesis testingHypothesis testing is the ability to construct experiments and assess the outcome of those experi-ments. Hypothesis testing involves conducting a test of statistical significance and quantifying thedegree to which random variability may account for the observed results. The reason for usingerror metrics to measure system performance is that error metrics represent the cost to the userwhen the system makes those errors. Improvements in system performance can then be trackedby measuring the relative decrease in error rate.

CHAPTER 2. HYPOTHESIS TESTING AND PERFORMANCE MEASURES 10
A hypothesis test is a mapping of the observed data to a decision as to which of many hy-potheses is most likely true. We may write this mapping abstractly as D H , where D is thedata domain and H is the (finite) set of hypotheses. When there are exactly two hypotheses, H0and H1, the problem is said to be binary hypothesis testing. When there are M 2 hypotheses, theproblem is said to be M-ary hypothesis testing. Most of the essential aspects of hypothesis testingare revealed in the study of the simpler binary hypothesis testing, although the concepts generaliseto the M-ary case. In the binary hypothesis testing exactly one of the events H0 and H1 is true. Thetwo events are interpreted as two hypotheses about reality. The event labelled H0 is called nullhypothesis while the event H1 is called alternative hypothesis. If for every possible criterion valuewe select to discriminate between the two populations, there will be some true cases that do meetthe criterion and classified as positive (true positives (TP)), and some false cases that do not meetthe criterion and classified as negative (false negatives (FN)). On the other hand, some false casesthat do not meet the criterion will be correctly classified as negative (true negatives (TN)), whilstsome false cases that do meet the criterion will be classified as positive (false positives (FP)).1
2.2.1 Confusion matricesThe various combinations of the actual states and observed test results for a series of decisions in abinary hypothesis testing problem may be recorded in a 2 2 confusion matrix such as that shownin Figure 2.2. Since our goal is to build classifiers that make as few errors as possible we needthe probabilities of correct predictions, TP and TN, to be large, and the probabilities of wrongpredictions, FP and FN, to be small. Due to the difficulties in comparing such 2 2 confusionmatrices for a large number of trials, several standard performance measures have been derived.These performance measures compute a single value from the four values in the matrix. As thisprocess of transforming four values into a single value causes some loss of information, there aresituations where certain performance measures may be preferred over others.
PredictedNegative Positive
Negative true negative (TN) false negative (FN)ActualPositive false positive (FP) true positive (TP)
Figure 2.2: Confusion matrix for a two-class classification problem.
2.3 Performance measuresA classic metric for reporting performance of classification algorithms is accuracy AC which isdefined as the proportion of the total number of classifications that are correct:
ACTN TP
TN FN FP TP(2.1)
Accuracy reflects the overall correctness of the classifier while the overall error rate is (1-accuracy). Accuracy has many disadvantages as a measure. The two basic shortcomings are
1False negatives and false positives are also known as type I error and type II error, respectively.

CHAPTER 2. HYPOTHESIS TESTING AND PERFORMANCE MEASURES 11
that it ignores differences between error types and that is strongly dependent on the probabilitydistribution of the data sets rather than the characteristics of the examples. If both types of er-rors, i.e. FP and FN, are not treated equally, a more detailed breakdown of Equation 2.1 becomesnecessary.
2.3.1 Sensitivity and specificityMore common metrics for evaluation of classification systems are sensitivity and specificity. Theseovercome the negative sides of accuracy (error type resolution and relative frequency of eachclass). Sensitivity is the accuracy among positive instances and specificity among negative. Usingthe notation of Figure 2.2, sensitivity and specificity can be expressed as:
sensitivityTP
TP FNtrue positive rate (2.2)
specificityTN
TN FPtrue negative rate (2.3)
2.3.2 Precision and recallIn some tasks such as information retrieval (IR), true positives is small when compared with truenegatives, and therefore specificity is not an adequate metric. In such cases precision can becalculated instead:
precision TPTP FP
(2.4)
Sensitivity is also called recall and as such:
recall TPTP FN
sensitivity true positive rate (2.5)
When comparing different systems with different values of precision and recall, one usually has totrade-off between the two in order to decide which is better. This has lead to performance measuresthat compute a single value that incorporates both precision and recall. One such measure isF-measure [Rijsbergen, 1979], a weighted harmonic mean of precision and recall, defined as:
F-measureβ2 1 precision
β2 precision recall(2.6)
where β is set according to the relative importance of precision and recall. In the literature nearlyalways β is set to 1, so that precision and recall are weighted equally.
2.3.3 Euclidean distanceAnother way of comparing classification systems is by using the weighted Euclidean distancefrom the perfect classifier, which is defined as:
ACd 1 C 1 TP 2 1 C FP2 (2.7)
where C is a cost factor, ranging from 0 to 1, that is used to assign relative importance to FPand FN. ACd ranges from 1 for the perfect classifier to 0 for a classifier that classifies all casesincorrectly. ACd differs from F-measure in that it is equal to 0 only if all cases are classifiedincorrectly. Hence, a classifier evaluated using ACd gets some credit for correct classification ofnegative cases, regardless of its accuracy in correctly identifying positive cases.

CHAPTER 2. HYPOTHESIS TESTING AND PERFORMANCE MEASURES 12
2.3.4 Word error rateThe word error rate (WER) measures the output of an ASR system on a word-by-word basis. Thewords in the output are automatically aligned against a given reference transcription of the spokenutterance. With this alignment each word in the output is categorised into four classes: correct,substitution, insertion and deletion. The WER is then computed as:
WERSUB DEL INS
N(2.8)
where N is the total number of words in the test set, and SUB, INS, and DEL are the total numberof word substitutions, insertions, and deletions, respectively. WER differs from the measuresdiscussed so far since it is based on a sequence comparison, whereas the others apply to staticpattern classification. The simplicity and utility of WER in measuring the relative improvementsin performance has made it the default evaluation metric for ASR systems.
2.3.5 Slot error rate[Makhoul et al., 1999] showed that F-measure exhibits certain undesirable behaviours in IE tasks,i.e. implicitly deweights deletion and insertion errors compared with substitution errors. Theyproposed the slot error rate (SER) measure, which equally weights the three types of errors di-rectly, without having to resort to precision and recall as preliminary measures. SER is simply theratio of the total number of slot errors divided by the total number of slots in the reference, whichis fixed for a given test. Hence, SER is obtained by:
SER SUB DEL INSN
(2.9)
where N is the total number of slots in the test set, and SUB, INS, and DEL are the total number ofslot substitutions, insertions, and deletions, respectively. Since N is fixed, SER is a linear functionof all types of errors. For particular applications, certain types of error may be deemed as more orless important than others. In that case, the definition of the SER can be modified by multiplyingthe different types of errors by different weights.
SER is exactly analogous to the WER which has been in use as the primary measure of ASRperformance for years. SER is also partially related to the targeted word error rate (TWER).TWER is the WER metric calculated only for regions in a transcribed message which containstypes of target constructions [Hirschman et al., 1999]. TWER provides another diagnostic tool todetermine the contributions of ASR characteristics, such as lexicon size and language model tocontent extraction performance.
2.4 ROC analysisAlthough sensitivity and specificity describe the true performance of a classification systemwith greater clarity than accuracy (equation 2.1), they too have disadvantages. For a partic-ular classifier they represent two separate measures, one for TP and one for TN cases. Acompound measure can be given visually through ROC analysis.2 Since FN is complementto TP and TN is the complement of FP, a ROC curve encapsulates all information containedin a confusion matrix. A major advantage of ROC curves is that they quantify the accuracy
2ROC analysis is a classic methodology from signal detection theory which was originally developed during WorldWar II. It was first used by radar operators to differentiate between a signal and noise.

CHAPTER 2. HYPOTHESIS TESTING AND PERFORMANCE MEASURES 13
of classification systems without regard to the probability distributions of the training and testset pattern vectors or decision bias. A comprehensive description of ROC analysis is givenin [Zweig and Campbell, 1993, Provost and Fawcett, 2001].
ROC curves can be obtained, if we plot the sensitivity and [1-specificity] values to the verticaland horizontal axes, respectively, for various thresholds (decision criteria) of a classification task.For a strict threshold the sensitivity will be low while the specificity very high. If the threshold islowered, specificity will fall while sensitivity will rise. In this way we can compare two classifiersover a broad range of threshold conditions, as shown in Figure 2.3. The point 0 0 represents aclassifier that predicts all cases to be negative, while the point 1 1 are produced by a classifierthat predicts every case to be positive. Points 0 1 and 1 0 correspond to classifiers that arecorrect and incorrect for all classifications, respectively. The figure exemplifies the curves forthree systems: A, B and R. Clearly, the performance of curve B is consistently superior to that ofcurve A, and R corresponds to the limiting case of purely chance performance. On the other hand,the relationship between the threshold and the two kinds of errors is shown in Figure 2.4. Point ain Figures 2.3 and 2.4 corresponds to the case in which a strict threshold is employed, and pointb corresponds to that wherein a lax criterion is used. The threshold during experiments is usuallyset to match up the two types of error rates, FN and FP, as indicated by t in Figure 2.4. Howeverthe threshold in practical applications should be determined according to the costs of decisionerrors (Section 2.5). A graphical way of finding the optimal performance of a given classifier forspecified costs is illustrated in [Hand, 1997].
sens
itivi
ty
(0, 1)
(0, 0)
AUROC
B
A
R
A
a
b
IdealRandom
(1,1)
(1, 0)
AUROC
B
1-specificity
Figure 2.3: Typical ROC curves of threeclassification systems: A, B and R.
t ba
FN
erro
r rat
e
1
0 threshold
FP
Figure 2.4: Relationship between the classi-fication error rate and the threshold used tomake a decision.
By comparing ROC curves one can study dominance relationships between classifiers. For agiven specificity, the curve which has greater sensitivity will be superior. Similarly, for a givensensitivity, the curve which has greater specificity will be better. If and only if two curves touchor cross at a point they will have identical performance (at the threshold values corresponding tothe point of intersection). Sometimes the curve for one classifier dominates that for another at allvalues of the threshold as in Figure 2.3 where classifier B dominates A throughout the ROC space.The more common situation, however, is that one curve dominates in some interval of thresholdsand another dominates in other intervals. Then one can examine which curve dominates withinthe range which is thought to be realistic for the specific problem.

CHAPTER 2. HYPOTHESIS TESTING AND PERFORMANCE MEASURES 14
2.4.1 Area under the ROC curveAn alternative criterion, which does consider the curve in its entirety, is given by area under thereceiver operating characteristic (AUROC). If one curve dominates another then the dominantcurve would have a larger such area. For instance, in Figure 2.3 since ROCB dominates ROCA(i.e. has higher sensitivity at all specificities) then AUROCB AUROCA. This criterion has along history in signal detection theory, e.g. [Green and Swets, 1966]. [Provost and Fawcett, 2001]call this a “whole-curve metric” to differentiate it from metrics which compare single operatingpoints on the ROC curve such as the Euclidean distance (Equation 2.7). AUROC has become thestandard approach to evaluate detection systems and have been used in fields as diverse as math-ematical psychology, language and speaker identification, medical risk prediction and machinelearning [Bradley, 1997]. Since the AUROC is a portion of the area of the unit square, its valuewill always be between 0 and 1.0. However, because random guessing produces the diagonal linebetween (0,0) and (1,1), which has an area of 0.5, no realistic classifier should have an AUROCless than 0.5. The value for the AUROC can also be interpreted as follows: an area of 0.85, forexample, means that a randomly selected object from the positive class has a test value larger thanthat for a randomly chosen object from the negative class in 85Of course, any reduction of twomeasures to a single measure is inevitably risky. It is possible for a classifier with a large AUROCto perform worse in a specific region of ROC space than one classifier with a smaller AUROC, butin practice the AUROC performs very well and is often used when a general measure is desired.
The AUROC has an appealing statistical property as it is equivalent to the probability that aclassifier will rank a randomly chosen positive instance higher than a randomly chosen negativeinstance. This is equivalent to the Wilcoxon (or Mann Whitney) rank order test for randomlyselected instances of H0 and H1 [Hanley and McNeil, 1982]. The AUROC is also completely in-dependent of the threshold and insensitive to the priors and/or Bayes costs which the end-usermight associate with decision errors. Several methods exist to calculate the AUROC with var-ious complexities including the trapezoidal method and maximum likelihood estimation meth-ods [Centor and Schwartz, 1985].3
2.4.2 DET curvesIf the hypothesis tests provide similar performance, the ROC curves will form a closely spacedcluster and the plot will become difficult to compare. [Martin et al., 1997] proposed the detectionerror trade-off (DET) curves. DET curves are plots of the FN (type I error) rate against theFP (type II error) and show essentially the same information as ROC curves but on a differentscale: ROC uses a linear scale, whereas DET uses a normal deviate scale. DET curves have theadvantage that they can distinguish better between different well-performing systems, and showlinear behaviour when the score distributions are normal. Although the performance of a systemis properly described by a DET curve, the need for a one-dimensional error figure still exists.
2.4.3 Limitations of ROC analysisThere are a number of limitations related to ROC analysis of statistical data. A ROC curve per-forms a lossy (irreversible) representation of a 2 2 confusion matrix due to the interpolation ofoperating points. Further information is lost when an ROC curve is itself described using theAUROC. The calculation of any probabilities from a 2 2 confusion matrix also requires theassumption that each application of the hypothesis test is independent. This assumption is notstrictly accurate when applying a hypothesis test to successive outputs of a ASR or automatic
3In our experiments we used Matlab’s convhull function that is based on triangulation.

CHAPTER 2. HYPOTHESIS TESTING AND PERFORMANCE MEASURES 15
summarisation system, since errors in word sequences tend to form contiguous blocks and canthus be highly correlated.
2.5 Misclassification costsThe primary performance measures for classification systems are related to error rates. There are,however, a number of alternatives, extensions, and variations possible on the error rate theme.An alternative is misclassification costs. Instead of designing a classification system to minimiseerror rates, the goal would be to minimise misclassification costs. A misclassification cost issimply a penalty for making a particular type of error. For example, in the binary hypothesissituation, a cost of one might be assigned to a FP error, and a cost of two to a FN error. Anaverage misclassification cost can be obtained by weighting each of the costs by the respectiveerror rate. Computationally this means that errors are converted into costs by multiplying an errorby its misclassification cost, i.e. the expected cost of a decision is given by:
Cost FP c FP FN c FN (2.10)
where c FP and c FN are the two cost functions. A cost function relies crucially upon an accurateassessment of the relative importance of each type of classification errors, and this can sometimesbe difficult, or impossible, to obtain. In a number of environments, the users of a system wouldlike to be able to set a cost trade-off dynamically; to have the freedom to alter the trade-off,perhaps in response to changes in operating circumstances, or in personal opinion as to the effectsof misclassification. The use of a reject class can help reduce the misclassification rate in taskswhere exceptional handling (e.g. by a human expert) of particularly ambiguous cases is feasible.
2.6 Usability testingThe engineering-oriented evaluation metrics described so far are general, well founded but forsome application domains can be rather shallow. It is often necessary to find out what end usersof classification systems think of them, both in comparative and absolute terms and how thiscorrelates with engineering metrics. Usability is the extent to which the intended user can meethis or her goals using the system being tested. Usability testing has well recognised benefits intraditional software and WWW domains, such as easier access to needed features, reduced errorrates and increased user satisfaction. However due to limitations of usability testing i.e. a) areexpensive, b) are not easily repeatable, and c) possess inherent variability in interpretation of therating scale by humans, this evaluation must be seen as complementary rather than a stand alone.
Usability testing has not yet become a standard part of voice user interface (VUI) design. Thisis because users bring a large set of expectations about spoken language into their interactionswith speech applications. More than graphical user interfaces or touch-tone, people expect VUIto complete tasks the way humans do. VUI seem deceptively simple because we all have vastexperience using spoken language. Thus when a VUI violates the user’s expectations, the negativeimpact can be significant. In the following paragraphs we present some of the methods we usedto analyse data gathered from usability tests.

CHAPTER 2. HYPOTHESIS TESTING AND PERFORMANCE MEASURES 16
2.6.1 Mean opinion scoreThe mean opinion score (MOS) ratings4 are based on human responses and perception. They usean absolute category rating procedure to determine the general acceptability or quality of systemsor products. Under absolute category rating procedures, evaluators are required to rate the overallquality of a system. Subjects use a five-category rating scale (i.e. excellent, good, fair, poor, andbad) with points assigned for each level, as shown below: 5-excellent, 4-good, 3-fair, 2-poor, and1-bad). Following the evaluation, a numerical MOS score for overall quality is calculated.
A large number of subjects is normally required, so that a reasonable assessment can be madeabout system performance. This can be time consuming and expensive. Hence, various objectivemeasures have been developed that are aimed at returning the same result as would have beenreturned by exhaustive subjective testing. Scores from different test sources should not be com-pared with one another. The dynamics of each test environment and its evaluators will establish adifferent baseline, which invalidates score comparisons. Only the scores within one group of testsshould be compared.
2.6.2 Kappa statisticIn order to assess in a definitive way the reliability of evaluators’ decisions the Kappa statistic iswidely used in classification experiments. This statistic measures the percent agreement betweenevaluators but adjusts it by the percent chance agreement for a particular classification task, takinginto account the relative frequency of each class [Cohen, 1960]. The Kappa statistic is defined as:
Kappa Po Pe1 Pe
(2.11)
where Po is the proportion of times the judges agree and Pe is the proportion of times we ex-pect them to agree by chance, corrected for chance agreement. In general, Kappa 0 75 1 ,Kappa 0 40, and Kappa 0 40 indicate excellent, good and poor agreement, respectively. AKappa 0 0 means that the ratings are independent while a Kappa 0 0 indicates that the dis-agreement is larger than the agreement. Finally, a Kappa 1 0 denotes the absolute dissagree-ment between subjects. [Carletta et al., 1997] only gives examples of Pe for the case when thereare only two annotators. When the number of annotators is larger than 2, the Pe has to take thenumber of annotators into account as well as the number of categories.5
2.7 Concluding discussionThis chapter introduced the statistical hypothesis framework and related measures which will beused to perform and assess the outcome of experiments in the subsequent chapters. In particular,we shall use the WER measure to estimate the accuracy of the ASR component. Central to theconstruction of the summarisation component is the ROC analysis which is an important tool forevaluation and comparison of classifiers when the operating characteristics, e.g. class distributionand cost parameters, are not known at training time. SER will be employed as an objective mea-sure to evaluate the summarisation component while MOS ratings will be performed by humansubjects to evaluate the automatically produced summaries. Finally, the Kappa statistic will alsobe used to assess the agreement between different evaluators.
4MOS is also known as absolute category rating.5For the calculation of the Kappa statistic for more than two annotators we used P. Bonnardel’s software available
from http://kappa.chez.tiscali.fr

3. Component technologies
The need to deliver spontaneous and task independent speech content in a format suitable forviewing on display-restricted mobile environments makes VoiSum a highly interdisciplinary ar-chitecture. This chapter comprises three main parts and is intended to provide the context forthe understanding of the rest of the thesis. We review a number of fundamental concepts relatedto the three major technologies that form the core of the system. In the first part, we give anoverview of the ASR problem with emphasis on the hybrid connectionist/HMM approach. Thisapproach capitalises on the strength of the sequential modelling capabilities of the HMM and thestatic classification or function approximation capabilities of neural networks. This includes ashort description of the Abbot/SPRACH system that was used in this work. In the second partwe describe the task of automatic summarisation and provide an overview of the main challengesand methodologies. We also identify outstanding problems related to the voicemail task. Finally,the third part describes the characteristics of mobile messaging with emphasis on WAP over shortmessage service (SMS) and the limitations that this introduces to the amount of information thatcan be delivered.
3.1 Automatic speech recognitionResearch in ASR aims to develop methods and techniques that enable computer systems to acceptspeech input and to derive a sequence of words from the stream of acoustic information. ASRresearch started in the 1950s1 with an attempt to decode isolated words from a small vocabulary.As time progressed, the research community began working on large vocabulary and continuousspeech tasks. However, only recently have practical versions of such systems become moderatelyusable and commercially successful. Researchers have also been concerned with applications of
1For a detailed historical review reporting developments from as early as the 1920s see [Gold and Morgan, 1999],Chapter 4.
17

CHAPTER 3. COMPONENT TECHNOLOGIES 18
automatic speech understanding, where the goal is not simply to transcribe the speech input but totransform its contents into some sort of knowledge representation that forms the basis for furtherlinguistic or cognitive tasks such as question-answering or translation into another language.
ASR can be seen as a multi-level pattern recognition task in which acoustic signals are ex-amined and structured into a hierarchy of sub-word units, words, phrases and sentences. Eachlevel may provide additional constraints, (e.g. pronunciation of known words or legal sentences),which can compensate for errors of uncertainties at lower levels. This hierarchy of constraints canbe best exploited by combining decisions probabilistically at all lower levels, and making discretedecisions only at the highest level. The structure of an ASR system is depicted in Figure 3.1. ASRcan be broken into modelling (of acoustic units and of sequential constraints), inference (findingthe parameters of the models using training data), and search (finding the best solution or a goodapproximation) given the time and memory limitations. The fact that the models are expressed us-ing probability theory enables us to combine information from diverse sources (such as acoustics,phonetics and syntax) that would otherwise be difficult to reconcile.
Front end Word-level match Sentence-levelmatch
Pronunciation model
Sub-wordmodels
Featurevector
Speech input
Recognisedwords
Dictionary Grammar Semantics
Global decoder
Language model
Figure 3.1: General block diagram for a standard ASR system. The pronunciation, language, andacoustic model components construct a hypothesis for interpreting a speech signal.
An utterance that is input to an ASR system is recorded as acoustic signal and digitally sam-pled and quantised into some representation vector X x1 xn xT , where T depends onthe length of the utterance. If the range of all possible utterances is M , the speech recognitionproblem can be stated formally as what is the string of words M that has the highest probabilitygiven the input acoustic waveform:
M argmaxM M
P M X (3.1)
In general, this maximisation is computationally infeasible. Bayes’ rule allows us to decomposethe most likely sequence of words in the speech signal, the term on the left below, into the termson the right.
argmaxM M
P M X argmaxM M
P X M P MP X
(3.2)
∝ argmaxM M
P X M P M (3.3)

CHAPTER 3. COMPONENT TECHNOLOGIES 19
During recognition, once the signal X has been recorded, P X is constant over all hypothesisedutterances M and therefore the prior probability of the acoustics P X in the denominator of Equa-tion 3.2 may be removed. That is, the most likely sequence of words in a speech signal is equal tothe probability of the measured acoustics given the word sequence multiplied by the probability ofthe word sequence. Thus, the ASR system must model two probability distributions: a) the prob-ability of the acoustics matching the particular hypothesis P X M , and b) the prior probabilityof the hypothesis P M . Modelling the likelihood P X M directly would involve modelling therelationship between all acoustic sequences and all possible utterances. Instead, conditional inde-pendence assumptions are made to subdivide the models into a succession of discrete stationarystates. A state sequence Q of sub-word units represents the total joint probability of the acousticsX and model M of a sequence of words.
Using probability theory, Equation 3.3 is transformed to Equation 3.4. To further reducethe number of parameters (and, consequently, the required amount of training material) and toavoid the need of new training each time a new word is added to the lexicon, we assume thatthe acoustic data is independent of the word models given the state sequence (Equation 3.5).This leads to significant savings in the representation space as the lexicon size can be in order ofthousands while the sub-word units are in the range of 50.2 In order to restrict the search spaceover the models, a Viterbi approximation is often employed, where the summation is replaced witha maximum over the state sequences (Equation 3.6).
argmaxM
P X M argmaxM
∑Q
P X Q M P Q M (3.4)
argmaxM
∑Q
PA X Q PP Q M PL M (3.5)
argmaxM
maxQ
PA X Q PP Q M PL M (3.6)
The terms of Equation 3.6 can be modelled by three distinct components within an ASR system:
PA X Q : the probability of observing the acoustic signal X given phone states (known asthe acoustic model).
PP Q M : the probability of phone states given the words (known as the pronunciationlexicon).
PL M : the prior probability of word sequences (known as the language model).
The following sections outline some of the methods used to model the above components.Acoustic front-end explains how the speech signal is represented by a vector X which is robustto acoustic variations but sensitive to acoustic content. Statistical language modelling describes asimple algorithm to estimate PL M . The pronunciation lexicon describes how the words can bebroken into smaller characteristic units of speech to model PP Q M . The HMM paradigm showshow the acoustic likelihoods PA X Q can be calculated by a Gaussian mixture model (GMM) or aneural network (NN) model.3 Finally, search algorithms outline the existing methods to calculatethe most probable interpretation of input speech given the constraints imposed by the acoustic,pronunciation, and language models.
2This applies to CI systems such as the one described in this thesis. In case of context dependent (CD) systems thenumber of phoneme models can be several times larger.
3Pure connectionist systems proved to be unsuccessful due to the following unresolved problems: a) how to detectthe segment of the recorded speech that should be used as input to the neural net, b) how to handle dynamics (timewarping, time alignment) and c) how to deal with large numbers of classes (large vocabulary).

CHAPTER 3. COMPONENT TECHNOLOGIES 20
3.1.1 Acoustic front-endIn theory, it should be possible to recognise speech directly from the digitised waveform. How-ever, because of the large variability of the speech signal, it is necessary to perform some formof feature extraction that would reduce that variability (Section 2.1). Feature extraction aims torepresent the speech signal in a way that is robust to acoustic variations but sensitive to acousticcontent. Typically, a sequence of so-called short term spectral vectors is computed from eithera bank of band-pass filters or via a discrete fourier transform (DFT). The calculation takes placeover a window, which is moved over the signal in increments of 10 to 20 ms. The time slicescorresponding to these increments are called frames. Moreover, to capture the changes in the sig-nal, a feature-vector for one frame can additionally contain features of neighbour frames or thedifference between features of the predecessor and successor frames. Usually, filter centre fre-quencies and bandwidths are calculated to approximately match the resolution and sensitivenessof the human auditory system (e.g. Mel scale).4
Feature extraction algorithms differ in their ability to distinguise linguistically relevantfrom irrelevant information (such as speaker identity), their robustness to noise and distor-tion, and their ability to produce vectors that make the ASR task easier. Further detailsand comparisons of feature extraction methodologies can be found in [Gold and Morgan, 1999,Rabiner and Juang, 1993]. A description of the most well known ones follows.
power spectral analysis is one of the most common techniques of representing a speech signalis via the power spectrum. The power spectrum of a speech signal describes the frequencycontent of the signal over time. The first step towards computing the power spectrum ofthe speech signal is to perform a DFT which computes the frequency information of theequivalent time domain signal. Since a speech signal contains only real point values, wecan make use of this fact and use a real-point fast Fourier transform (FFT) for increasedefficiency. The resulting output subject to a window size can contain both the magnitudeand phase information of the original time domain signal.
linear predictive coding (LPC) analysis is based on the idea that a specific speech sample at thecurrent time can be approximated as a linear combination of past speech samples. Throughminimising the sum of squared differences (over a finite interval) between the actual speechsamples and linear predicted values a unique set of parameters or predictor coefficients canbe determined. These coefficients form the basis for linear predictive analysis of speech. Inreality the actual predictor coefficients are never used in recognition, since they typical showhigh variance. The predictor coefficient are transformed to a more robust set of parametersknown as cepstral coefficients.5
perceptual linear prediction (PLP) is similar to LPC analysis and is based on the short-termspectrum of speech. In contrast to pure linear predictive analysis of speech, which esti-mates the smoothed spectral envelope of the speech power spectrum equally well at all
4Recently, it has even been questioned whether acoustic front-ends really have benefitted from detailed simulationof properties of the human auditory system. [Hunt, 1999] argued that their properties can be better understood in purelysignal processing terms, or in some cases in terms of the acoustic properties of the speech production process.
5[Bogert et al., 1963] observed that the logarithm of the power spectrum of a signal containing an echo has anadditive periodic component due to the echo, and thus the FFT of the logarithm of the power spectrum should exhibita peak at the echo delay. They called this function the cepstrum, interchanging letters in the word spectrum.
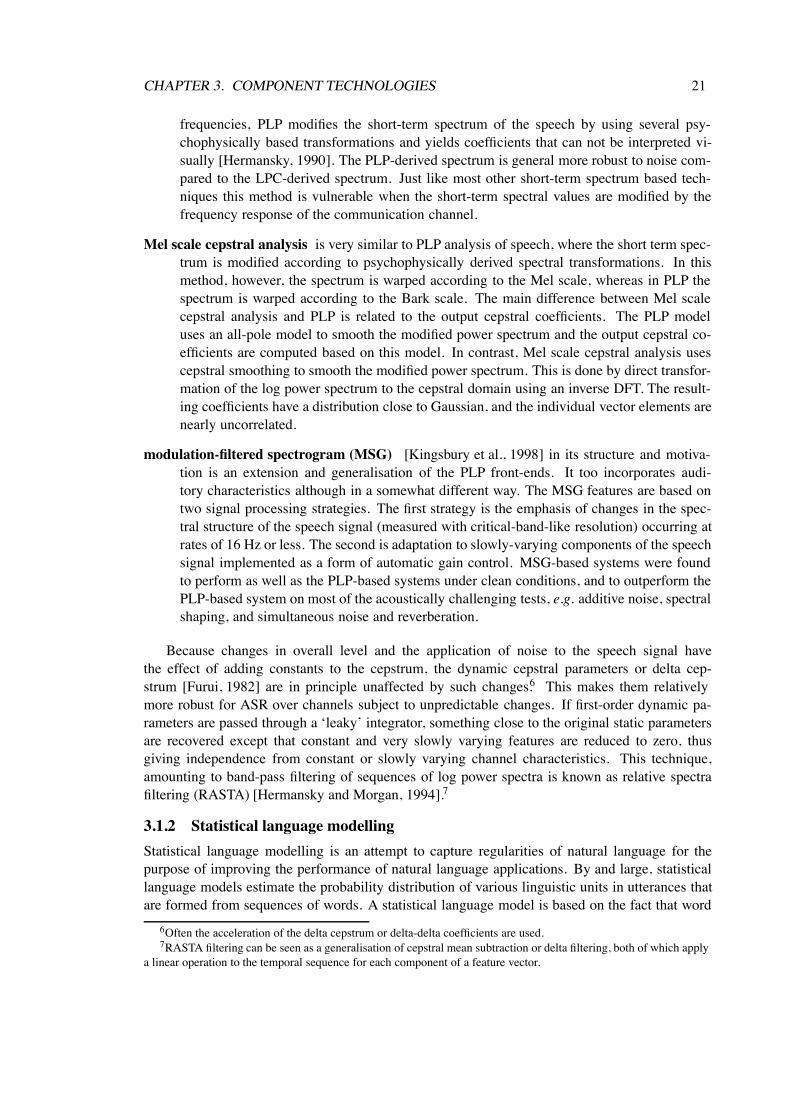
CHAPTER 3. COMPONENT TECHNOLOGIES 21
frequencies, PLP modifies the short-term spectrum of the speech by using several psy-chophysically based transformations and yields coefficients that can not be interpreted vi-sually [Hermansky, 1990]. The PLP-derived spectrum is general more robust to noise com-pared to the LPC-derived spectrum. Just like most other short-term spectrum based tech-niques this method is vulnerable when the short-term spectral values are modified by thefrequency response of the communication channel.
Mel scale cepstral analysis is very similar to PLP analysis of speech, where the short term spec-trum is modified according to psychophysically derived spectral transformations. In thismethod, however, the spectrum is warped according to the Mel scale, whereas in PLP thespectrum is warped according to the Bark scale. The main difference between Mel scalecepstral analysis and PLP is related to the output cepstral coefficients. The PLP modeluses an all-pole model to smooth the modified power spectrum and the output cepstral co-efficients are computed based on this model. In contrast, Mel scale cepstral analysis usescepstral smoothing to smooth the modified power spectrum. This is done by direct transfor-mation of the log power spectrum to the cepstral domain using an inverse DFT. The result-ing coefficients have a distribution close to Gaussian, and the individual vector elements arenearly uncorrelated.
modulation-filtered spectrogram (MSG) [Kingsbury et al., 1998] in its structure and motiva-tion is an extension and generalisation of the PLP front-ends. It too incorporates audi-tory characteristics although in a somewhat different way. The MSG features are based ontwo signal processing strategies. The first strategy is the emphasis of changes in the spec-tral structure of the speech signal (measured with critical-band-like resolution) occurring atrates of 16 Hz or less. The second is adaptation to slowly-varying components of the speechsignal implemented as a form of automatic gain control. MSG-based systems were foundto perform as well as the PLP-based systems under clean conditions, and to outperform thePLP-based system on most of the acoustically challenging tests, e.g. additive noise, spectralshaping, and simultaneous noise and reverberation.
Because changes in overall level and the application of noise to the speech signal havethe effect of adding constants to the cepstrum, the dynamic cepstral parameters or delta cep-strum [Furui, 1982] are in principle unaffected by such changes.6 This makes them relativelymore robust for ASR over channels subject to unpredictable changes. If first-order dynamic pa-rameters are passed through a ‘leaky’ integrator, something close to the original static parametersare recovered except that constant and very slowly varying features are reduced to zero, thusgiving independence from constant or slowly varying channel characteristics. This technique,amounting to band-pass filtering of sequences of log power spectra is known as relative spectrafiltering (RASTA) [Hermansky and Morgan, 1994].7
3.1.2 Statistical language modellingStatistical language modelling is an attempt to capture regularities of natural language for thepurpose of improving the performance of natural language applications. By and large, statisticallanguage models estimate the probability distribution of various linguistic units in utterances thatare formed from sequences of words. A statistical language model is based on the fact that word
6Often the acceleration of the delta cepstrum or delta-delta coefficients are used.7RASTA filtering can be seen as a generalisation of cepstral mean subtraction or delta filtering, both of which apply
a linear operation to the temporal sequence for each component of a feature vector.

CHAPTER 3. COMPONENT TECHNOLOGIES 22
sequences are not equally likely to occur. For example, the word sequence “give me a call” ismore likely than “give call a me”. A language model imposes large constraints on the sequenceof words and guides the search during decoding.
Ironically, the most successful statistical language modelling techniques use very little knowl-edge of what language really is. The most popular language model, a Markov chain referred to asn-gram language model, takes no advantage of the fact what is modelled is language – it could beas well a sequence of arbitrary symbols, with no deep structure, intention or thought behind it.
Such a statistical model PL M for a given word model sequence M m1m2 mk is esti-mated by computing the conditional probability for observing a word model given its predecessorsin a large corpus, as follows:
PL Mk
∏i 1
P mi m1m2 mi 1k
∏i 1
P mi mi 1i (3.7)
The dependence of the conditional probability of observing a word mi at a position i is assumedto be restricted by its immediate n 1 preceding words mi n 1 mi 1. For n=1, n=2 and n=3 themodel is referred to as unigram, bigram and trigram, respectively. The conditional probabilitiesP mi mi 1
i n 1 is estimated by the simple relative frequency:
P mi mi 1i n 1
C mi n 1i
C mi n 1i 1
(3.8)
where C is the number of occurrences of the particular string in the given training corpus.Since, n-gram probability distributions can be computed directly from text data, explicit lin-
guistic rules are not required. One could even argue that syntax, semantics and pragmatics aresimultaneously encoded in n-grams. This makes n-grams very effective for languages such asEnglish where word order is important and the strongest contextual effects tend to come fromnear neighbours. Because of the categorical nature of language, and the large vocabularies peopleuse, statistical techniques must estimate a large number of parameters, and consequently dependcritically on the availability of large amounts of training data. Although over the past twenty yearssuccessively larger amounts of text data have become available, the improvements in quality oflanguage models are now beginning to asymptote [Rosenfeld, 2000].
A problem in the use of n-grams is the handling of unseen events. A variety of discount-ing [Ney et al., 1994], linear interpolation [Brown et al., 1992] and back-off [Katz, 1987] tech-niques are employed in n-gram language models to reduce the effects of the data sparsity prob-lem. A thorough overview and systematic investigation of current techniques (e.g. variable lengthn-grams, vocabulary clustering, decision trees, probabilistic context free grammar, maximum en-tropy models) is provided by [Rosenfeld, 2000]. Most of them attack the problem of coping withsparse training data directly, although some techniques also focus on improving the basic modelby capturing longer range dependencies in language.
The degree of constraint that a language model imposes is usually measured in terms of per-plexity [Jelinek et al., 1977] which is roughly the geometric mean of all branching factor for aword, i.e. the average number of words that can follow any other word. Several attempts have beenmade to devise new metrics that measure the quality of a given language model [Chen et al., 1998].For now perplexity continues to be the preferred metric for practical language model construction.

CHAPTER 3. COMPONENT TECHNOLOGIES 23
3.1.3 Pronunciation lexiconThere are three systems to represent words: The lexical writing system - words specified as se-quences of letters obtained from a dictionary; the phonetic pronunciation system – words pro-nounced as sequences of sound units accepted as standard within a dialect; and the phonemiclanguage system – words stored as sequences of phonemes in the minds of individuals sharing acommon language. In order to simplify the computation of the pronunciation model PP Q M , thewords of the word sequence can be broken into smaller characteristic units of speech. Althoughthere are good linguistic arguments for choosing units such as syllables or semi-syllables, the unitsmost commonly used are phones that are acoustic realisations of the linguistic categories calledphonemes.8 A phoneme is defined as any of the abstract units of the phonetic system of a languagethat correspond to the set of similar speech sounds. Phones may be shared across languages whilstphonemes are by definition language specific. Sounds that are separate phonemes in one languagemay be a single phoneme in another.9
It has been found that abnormal speaking rates correlate well withWER [Siegler and Stern, 1995, Mirghafori et al., 1996]. Another factor that affects pronun-ciation models is function words (high-frequency words including some prepositions andpronouns), which often contain little semantic content and have a wide variation of pronuncia-tions within conversational speech. In a recent pronunciations survey of the ten most frequentwords10 within a transcribed portion of the Switchboard corpus, [Greenberg, 1997] cites anaverage of over 60 pronunciations per word. If there is more than one common pronunciationfor a word, alternative variants can be introduced into the lexicon. Probabilities are typicallyassociated with these multiple pronunciations. However, modelling too many pronunciationscan decrease performance due to increased confusability. Although a search can easily findphonetic representations for commonly used words in various sources, task-dependent jargonoften requires writing out pronunciations by hand.
In spontaneous speech many words are not pronunced the way a standard dictionary wouldpredict. This is mainly due to various forms of coarticulation, the individual’s speaking style,particular dialect, speaking rate, the semantic content of what is being said and personal prefer-ences. How to build accurate pronunciation models for ASR systems remains a research issue.The use of phonological rules e.g. [Tajchman et al., 1995, Lamel and Adda, 1996] takes advan-tage of the work of linguists, but searching and writing in all rules is a tedious task. Decision treeshave also been used as statistical models e.g. [Chen, 1990, Riley, 1991] for learning pronuncia-tion rules from data. This approach saves the work of trying to find all rules but may miss somegeneralisations that have little data, and it requires hand-transcribed data, which is expensive toobtain. Machine alignments have been used by [Schmid et al., 1993, Sloboda and Waibel, 1996]instead of hand transcriptions in order to obtain enough data to build word models. The twoabove approaches have been combined by [Fosler et al., 1996] and allow phonological processesto occur across words in a dynamic approach according to the surrounding words. For modellingproblematic words or phrases a reverse engineering approach can also be employed using text-to-speech (TTS) systems. A general framework for building letter to sound rules from word lists in alanguage is proposed in [Black et al., 1998] with results better for some languages than others.11
8For a well defined distinction of phones and phonemes see [Fosler-Lussier, 1999], p.15.9For example, [r] and [l] are separate phonemes in English, but count as one phoneme in Japanese.
10These were found to be: I, and, the, you, that, a, to, know, of, it.11The generated models achieved 75%, 58%, 93% and 89%, for English (UK and US), French and German held out
data, respectively.

CHAPTER 3. COMPONENT TECHNOLOGIES 24
3.1.4 Acoustic probability estimators for the HMM paradigmGiven the statistical nature of speech, speakers do not utter a word the same way twice. Thevariation in a word’s or phoneme’s pronunciation manifests itself mainly in two ways: durationand spectral content, also known as acoustic observations. Further, phonemes in the surroundingcontext can cause variations in a particular phoneme’s spectral content, i.e. coarticulation.
A variety of techniques is currently available for modelling speech’s stochastic aspects. Tech-niques such as expert systems [Haton, 1985] and dynamic time warping (DTW) [Vintsyuk, 1968]possess some desirable properties, but the HMM is by far the most powerful approach. HMMsfunction as probabilistic finite state machines. The structure of HMMs and the training algo-rithm used to determine the recognition parameters make the approach well suited to speaker-independent, continuous-speech and large-vocabulary applications. The use of HMMs in ASRwas pioneered by Baker, Jelinek and colleagues from IBM in the 1970’s and the basic methodshave changed little since.12 Since an understanding of the HMM training/decoding algorithms isnot required for the work presented in this thesis, they will not be described in detail here. Anexcellent tutorial can be found in [Rabiner, 1989].
The HMM paradigm defines two concurrent stochastic processes: the sequence of states (mod-elling the sequential structure of speech), and a set of state output processes (modelling the locallystationary character of the speech signal). The HMM is called a “hidden” Markov model becausethe underlying stochastic process, i.e. the sequence of states, is not directly observable, but stillaffects the observed sequence of acoustic features. Thus, HMMs are specified by:
states: a set of L states Q q1 q2 qL
transition probabilities: a set of probabilities p qj qi for each permissible transition stateqi to state qj. The set of these is the transition probability matrix.
observation likelihoods: a set of likelihoods bi xt , each referring the probability of anobservation xt being generated from a state i.
Each new observation frame can in principle be associated with any state, however the topol-ogy of the HMM and the associated transition probabilities provide sequential constraints. Forinstance, a high self-loop probability for a state means that it will tend to be repeated more thanonce, and a directed connection between [ae] and [m] in a word model means that pronunciationswith [ae] followed by [m] are permitted. These models are also typically constrained to be left toright; that is the state transitions have some temporal order.
In order to model speech with HMMs, we need to turn acoustic observation feature vectorsinto probabilities. The most widespread method is the use of Gaussian probability density func-tions, in the simpler version of which each state has a single Gaussian function which maps theobservation vector to a probability. An alternative approach is the use of neural networks, whichcan also be trained to assign probability to a real-valued feature vector. HMMs with Gaussian ob-servation probability estimators are determined with maximum likelihood HMM training via theforward-backward or Baum-Welch algorithm [Baum et al., 1970].13 HMMs with neural network
12One major weakness of HMMs lies in the fact that it is not known how to induce their structure automatically fromtraining data. Typically, the HMM topology is fixed in advance and the model parameters are estimated by the forward-backward algorithm in this context. [Stolcke and Omohundro, 1993] proposed an inference of the model structure bymerging states and retraining the model to see if any advantage has been gained.
13This is a special case of the expectation-maximisation (EM) algorithm [Dempster et al., 1977] which re-estimatesthe parameters of the current model using the training set sequences (the expectation step) and then replaces the currentmodel with the re-estimated model (the maximisation step).

CHAPTER 3. COMPONENT TECHNOLOGIES 25
observation probability estimators are trained by a completely different algorithm known as errorback-propagation.
Gaussian mixture model estimators for HMMsIf we assume that the possible values of the observation feature vector xt are normally distributed,the observation probability function bj xt representing a different type of speech frame as a Gaus-sian curve with mean vector µj and covariance matrix ∑j can be writen as:
bj xt1
2π ∑j
e xt µj ∑ 1j xt µj (3.9)
This model can then be used to find the probability of any unknown vector which can be assignedto the model that has the highest probability.
A popular approach, known as continuous density HMM, for correcting the problem of anassumed parametric form is to use different basic densities for the HMM emission probabilities. Itcan be shown that any arbitrary probability density can be modelled by a mixture of basic densitiesif the number of used mixture components is large enough. In practice, the number of parametersthat may be employed by a model and hence the number of mixture components is limited by theamount of available training data. Too few components will yield a distribution with insufficientflexibility to model the complex likelihood distributions observed for the speech signal. However,if too many components are used, can lead to poor generalisation. As a consequence of limitedtraining data, a vast number of parameter saving permutations on the mixture model theme existand many have been tried in practice.
Another approach is the discrete density HMM, where the continuous feature space is subdi-vided by applying vector quantisation (VQ) on the mixtures of Gaussians [Bocchieri, 1993]. Typ-ically the VQ is constructed by an unsupervised cluster algorithm such as k-means. In this casea VQ partition is associated with the label qj and any feature vector in this partition is mappedon qj. The discrete symbols are then used as inputs to the HMM. In practice, the discrete HMMswork faster than the continuous systems since each HMM state must model only a finite numberof symbols, the probabilities of which can be calculated rapidly by table lookup. On the otherhand, the coarseness of the VQ process can cause errors and lead to a degradation of recognitionaccuracy.
Another parameter saving strategy is the use of tied mixture14 or semi-continuousHMMs [Huang et al., 1990, Bellegarda and Nahamoo, 1990] in which all mixtures are expressedin terms of a common set (codebook) of base densities. Typically the semi-continuous systemsuse less parameters compared to the untied continuous systems and the parameters can be betterestimated in a robust way even when the amount of training data is limited. Yet another commonlyemployed strategy to improve efficiency is to equip Gaussian components with diagonal only co-variance matrices, i.e. all components off the principle diagonal of the feature covariance matrixare set to zero [Bahl et al., 1987]. Implicit in the assignment of a diagonal covariance matrix toa single Gaussian distribution is the assumption that the feature vector elements are statisticallyindependent, which will be false for spectrally derived features.15
14Tied mixtures (or parameter tying) is very similar to weight sharing in neural networks (e.g. [Bishop, 1995]).15Mixtures of diagonal distributions can however model non-diagonal distributions. Given a sufficient number of
components in the mixture they can approximate not only rotation of the distribution (that full covariance matrix canmodel as well), but also nonGaussian distributions and/or multimodal distributions (that full covariance matrix can notmodel).

CHAPTER 3. COMPONENT TECHNOLOGIES 26
Neural network estimators for HMMsOne drawback of the continuous HMMs is the assumption that the acoustic feature distributionscan be modelled by mixtures of Gaussians, which is not true for a small number of mixture com-ponents. In recent years, researchers have established the viability of so called hybrid NN/HMMlarge vocabulary, speaker independent continuous speech recognition systems, where neural net-works, typically a multi-layer perceptron (MLP) or a recurrent neural network (RNN), are usedfor the estimation of the posterior probability of a phone given the acoustic data.16 The input tothese networks is a representation of the signal at a time t and some surrounding window. Thenetworks have one output for each phoneme. By constraining the values of all output units to sumto 1, the networks can be used to compute the probability of a state j given and observation xt,or P qj xt . But the observation likelihood we need for the HMM, bj xt is P xt qj . Using theBayes’ rule, though, we can compute one from the other. The network is computing:
p qj otP ot qj p qj
p ot(3.10)
These probabilities may be transformed to scaled likelihoods after dividing by the class priors:
p qt ojp ot
P qj otp qj
(3.11)
The two terms on the right-hand side of Equation 3.11 can be directly computed; the numera-tor is the output of the network, and the denominator is the phoneme prior probabilities. Thesescaled likelihoods can be used as the output distribution in an HMM. The error back-propagationalgorithm for training a network requires that we know the correct phoneme label qj for each ob-servation ot. Given a large training set of observations and correct labels, the algorithm iterativelyadjusts the weights in the network so as to minimise the error on a validation set.
The resulting model is efficient in terms of parameter usage due to the difference betweenlikelihoods and posteriors. Suppose we have two classes, c1 and c2. The likelihood P x ci de-scribes the distribution of the input x given the class, while the posterior P ci x describes theprobability of each class ci given the input. This means that likelihoods are independent densitymodels, while posteriors are indicators of how a given class distribution compares to all others.For likelihoods we have x P x ci 1, while for posteriors we have ∑i P ci x 1. As illustratedin Figure 3.2, likelihoods model the surfaces of distributions, while posteriors model the bound-aries between distributions. Thus, likelihood models (as used in the states of a GMM/HMM) mayhave to waste their parameters modelling irrelevant details, while posterior models (as providedwithin the NN/HMM) can represent critical information more economically leading to compactacoustic models.
Other advantages of the hybrid approach over traditional GMM/HMM systems include dis-criminative training, better robustness to insufficient training data, contextual inputs and fastersentence decoding (in terms of CPU and memory run-time requirements). However, NN/HMMsystems usually have training times that are orders of magnitude higher than those observed inGMM/HMM systems. This is largely due to the costly, gradient-based error back-propagationlearning algorithm applied to very large neural networks which often requires the use of spe-cialised parallel hardware. We achieved faster training by using a dedicated fixed point neuralnetwork and signal processing accelerator board known as SPERT T0 [Wawrzynek et al., 1996].
NN/HMM approaches have been compared with the best GMM/HMM approaches on a num-ber of tasks. In small/medium vocabulary tasks NN/HMM systems have performed as well as
16[Morgan and Bourlard, 1995] reviewed in detail other approaches and subproblems in the NN/HMM approach.

CHAPTER 3. COMPONENT TECHNOLOGIES 27
Like
lihoo
dPo
sterio
r
P(x|c )
P(c |x)
i
i
x
x
C1 C2
C1 C2
Figure 3.2: The likelihood P x ci vs. the posterior P ci x for two classes c1 c2 , af-ter [Riis, 1998].
or better than GMM/HMM systems, e.g. [Renals et al., 1994, Robinson et al., 1996]. However,in large vocabulary tasks such as Hub-4 broadcast news (BN) [Graff, 1997], GMM/HMM sys-tems have performed significantly better. A major source of improvements in BN systems overthe past few years has been through local adaptation of acoustic models to the characteristics ofeach segment, where a segment is defined as an utterance by a single speaker in constant acousticconditions. The most popular technique used for this purpose with GMM is maximum likelihoodlinear regression (MLLR) [Leggeter and Woodland, 1995], but since neural network models donot have an explicit representation of class means, that algorithm can not be directly employed.Gradient-based adaptation techniques have also been used to similar effect for NN/HMM systems[Neto et al., 1995], but with limited success.
3.1.5 Search algorithmsThe search problem in ASR can be defined as the estimation of the most likely word sequencegiven a sequence of acoustic observations, an acoustic model and a language model. This is ademanding problem since word boundary information is not available in continuous speech andeach word in the dictionary may be hypothesised to start at each frame of acoustic data. The prob-lem is further complicated by the vocabulary size and the structure imposed on the search spaceby the language model. Direct evaluation of all the possible word sequences imposes formidablecomputation and storage capability. Thus the search algorithm needs to restrict the search spacewithout compromising system performance. Most popular techniques for restructuring the searchspace involve effective ways to share information amongst active hypotheses. Use of approxi-mations forces the decoder to make suboptimal choices. However, it has been observed that asuboptimal solution often does not impact recognition accuracy. In the rest of this section wereview some popular search techniques. Some of the most popular search algorithms are the
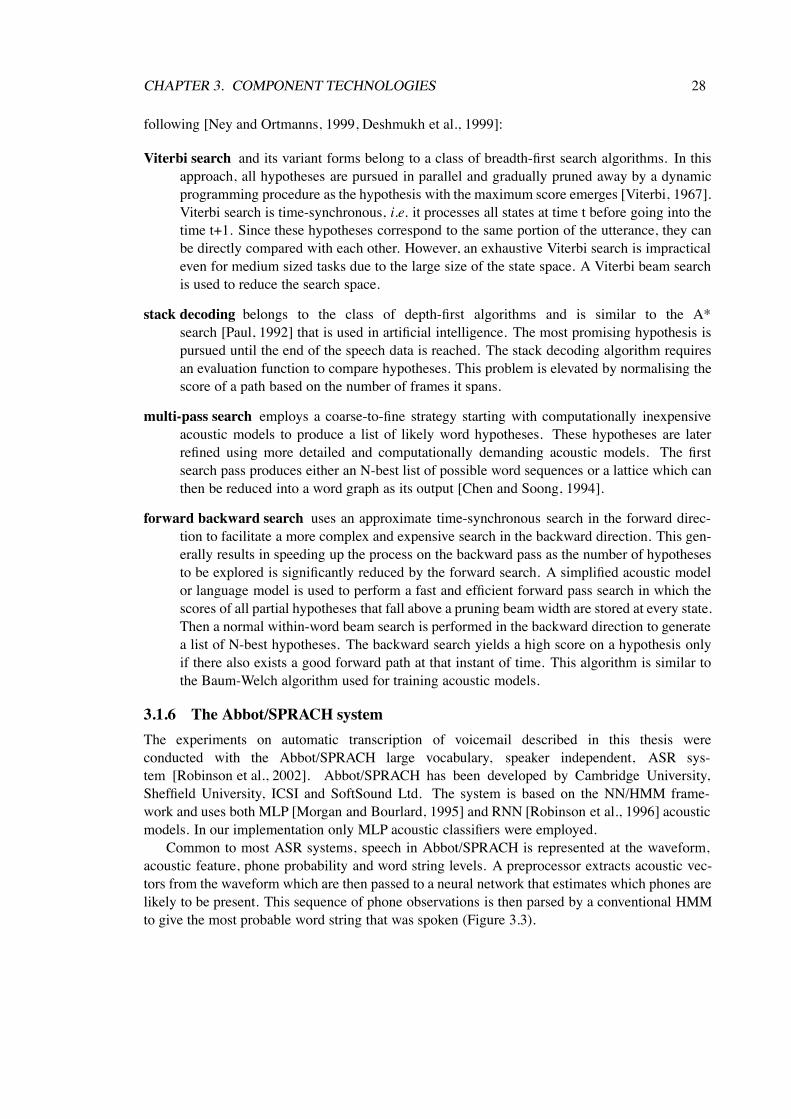
CHAPTER 3. COMPONENT TECHNOLOGIES 28
following [Ney and Ortmanns, 1999, Deshmukh et al., 1999]:
Viterbi search and its variant forms belong to a class of breadth-first search algorithms. In thisapproach, all hypotheses are pursued in parallel and gradually pruned away by a dynamicprogramming procedure as the hypothesis with the maximum score emerges [Viterbi, 1967].Viterbi search is time-synchronous, i.e. it processes all states at time t before going into thetime t+1. Since these hypotheses correspond to the same portion of the utterance, they canbe directly compared with each other. However, an exhaustive Viterbi search is impracticaleven for medium sized tasks due to the large size of the state space. A Viterbi beam searchis used to reduce the search space.
stack decoding belongs to the class of depth-first algorithms and is similar to the A*search [Paul, 1992] that is used in artificial intelligence. The most promising hypothesis ispursued until the end of the speech data is reached. The stack decoding algorithm requiresan evaluation function to compare hypotheses. This problem is elevated by normalising thescore of a path based on the number of frames it spans.
multi-pass search employs a coarse-to-fine strategy starting with computationally inexpensiveacoustic models to produce a list of likely word hypotheses. These hypotheses are laterrefined using more detailed and computationally demanding acoustic models. The firstsearch pass produces either an N-best list of possible word sequences or a lattice which canthen be reduced into a word graph as its output [Chen and Soong, 1994].
forward backward search uses an approximate time-synchronous search in the forward direc-tion to facilitate a more complex and expensive search in the backward direction. This gen-erally results in speeding up the process on the backward pass as the number of hypothesesto be explored is significantly reduced by the forward search. A simplified acoustic modelor language model is used to perform a fast and efficient forward pass search in which thescores of all partial hypotheses that fall above a pruning beam width are stored at every state.Then a normal within-word beam search is performed in the backward direction to generatea list of N-best hypotheses. The backward search yields a high score on a hypothesis onlyif there also exists a good forward path at that instant of time. This algorithm is similar tothe Baum-Welch algorithm used for training acoustic models.
3.1.6 The Abbot/SPRACH systemThe experiments on automatic transcription of voicemail described in this thesis wereconducted with the Abbot/SPRACH large vocabulary, speaker independent, ASR sys-tem [Robinson et al., 2002]. Abbot/SPRACH has been developed by Cambridge University,Sheffield University, ICSI and SoftSound Ltd. The system is based on the NN/HMM frame-work and uses both MLP [Morgan and Bourlard, 1995] and RNN [Robinson et al., 1996] acousticmodels. In our implementation only MLP acoustic classifiers were employed.
Common to most ASR systems, speech in Abbot/SPRACH is represented at the waveform,acoustic feature, phone probability and word string levels. A preprocessor extracts acoustic vec-tors from the waveform which are then passed to a neural network that estimates which phones arelikely to be present. This sequence of phone observations is then parsed by a conventional HMMto give the most probable word string that was spoken (Figure 3.3).

CHAPTER 3. COMPONENT TECHNOLOGIES 29
Acoustic Model Lexicon Language Model
Posteriorprobabilities
Recognised words
h#pclbcltcldcl...
C0
C1
C2
C3
C4
C5
tn+w
.tn
..
HMMdecoder
Speech input
Front end
Featurevector
Figure 3.3: An overview of the Abbot/SPRACH ASR system. Only the MLP acoustic classifierthat was used in this work is depicted.
Acoustic front-endAs a basic technique to compute a simple auditory spectrum Abbot/SPRACH uses PLP andMSG features, which provide a more robust representation than mel-frequency cepstral coeffi-cients (MFCC).17.
Acoustic modelsPhone probabilities are estimated using an acoustic model, which transforms the acoustic vectorsinto phone probability vectors. The transformation is carried out using an MLP. The state layeroutput along with the acoustic input is connected to the output layer. The MLP is trained usingback propagation through time. The training of the systems is slower than the HMM counterpart,but this is made up for by faster execution at recognition time. The NN/HMM system also has rel-atively few parameters, and these are used in a simple multiply and accumulate loop so hardwareimplementation is more plausible.
Search algorithmsAbbot/SPRACH supports large vocabulary decoding of arbitrary finite state grammars and largevocabulary decoding using n-gram language models. The decoder’s task is to find the most likelyword sequence subject to all constraints. The two main tools for decoding are:
NOWAY is single-pass stack decoder [Renals and Hochberg, 1999] that is naturally factoredinto time-asynchronous processing of the word sequence and time-synchronous processing of theHMM state sequence. The architecture enables the search to be decoupled from the languagemodel while still maintaining the computational benefits of time-synchronous processing. In aprecursor to the acoustic confidence measure research [Williams and Renals, 1999], a pruningtechnique, referred to as phone deactivation pruning was employed. This method – which iscomplementary to other beam search and language model pruning methods – uses the phoneposterior probability estimates output by a connectionist acoustic model directly. A threshold isplaced on the phone posteriors, and those phones below the threshold are pruned. This approachenabled a search space reduction by more than 40%, with a relative search error of less than2% [Renals and Hochberg, 1999].
17D. Ellis’ report (Jul. 1999) at http://www.icsi.berkeley.edu/ dpwe/respite/multistream/msgmfcc.html

CHAPTER 3. COMPONENT TECHNOLOGIES 30
CHRONOS is a low-memory stack decoder [Robinson and Christie, 1998] which employes atime first search approach. It allows real-time large vocabulary search to be performed with amodest (approx. 5%) increase in the number of errors while it requires very little operationalmemory. CHRONOS differs from other implementations in that a stack item consists of a groupof partial paths, all of which have the same language model state. This results in more efficientimplementation as fragmentation of language model unique paths occurs much less frequently.
3.2 Automatic summarisationAutomatic summarisation is the process of distilling the most important information from a source(or sources) to its most essential points by using computational approaches to produce an abridgedversion for a particular user (or users) and task (or tasks) [Mani and Maybury, 1999]. In a similarway that ASR tries to match human performance in transcribing speech, automatic summarisationis a challenging task because humans are good summarisers having the capacity to condenseinformation. They are particularly good in learning the global structure of an archive althoughthey have difficulty in remembering specific information [Whittaker et al., 1999]. A large portionof all available information today exists in an unstructured form such as books, magazine articles,research papers, product manuals, memorandums, emails, audio/video archives, movies and ofcourse the WWW. Analysing huge amount of information is often involved in making informedand correct decisions. Solving the task of summarising such information can provide means forautomated intelligent processing of information that require every day human attention.
Several scientific disciplines such as linguistics, artificial intelligence and information the-ory contribute to the study of automatic summarisation. Most research so far has been onsummarisation of written text. However, there is an increasing need for summarisation of newdomains, stimulated by the growth of computerised information and communication systems.Computerised information is also driving summarisation researchers to consider audio and vi-sual media and thus to expand from text to multimedia summarisation.18 The process of au-tomatic summarisation can be decomposed into three phases (Figure 3.4): analysing the input,transforming it into a summary representation, and synthesising an appropriate output form.An important parameter to summarisation is compression rate, which is defined as the ratio ofsummary length over source length. As compression rate decreases, more information is lost.There are several dimensions which have to be considered when talking about summarisation(cf. [Sparck Jones, 1999, Mani and Maybury, 1999, Hahn and Mani, 2000]), such as the follow-ing:
extracts vs. abstracts Extracts are summaries consisting entirely of material copied from theinput while abstracts are summaries where at least some material is not present in the input,e.g. subject categories or paraphrase of content. Abstracts can result in summarisation at amuch higher degree of compression than extracts. For a computational approach extracts arean easier target than abstracts, since the system does not have to create new text. Althoughextracts are often fragmentary in nature, extraction is relatively low cost solution, comparedto additional knowledge resources required to construct abstracts. This has resulted in muchmore attention paid to the automatic production of extracts.
18Another approach that does not concern this thesis is based on techniques for structuring, filtering, and present-ing recorded speech. SpeechSkimmer [Arons, 1997] included pause removal for faster playback, pitch emphasisdetection for highlighting important sections and phase vocoding for improved playback of time compressed audio.[He et al., 1999] also performed video skimming on multimedia presentations by using different types of hints, e.g.slide translations, pitch emphasis and user access patterns.

CHAPTER 3. COMPONENT TECHNOLOGIES 31
Input
Synthesis
Transformation
Analysis
Text summaries
compresionrate
Figure 3.4: A high level architecture of a summarisation system depicting the phases of inputanalysis, transformation and synthesis, after [Mani and Maybury, 1999].
indicative vs. informative Indicative summaries provide a reference function for selecting mate-rial for more in-depth reading, while informative summaries cover all the salient information(e.g. main results or conclusions) in the source at some level of detail. In the latter, the usermay be able to glean useful information without needing to refer to the full document at all.
generic vs. user-focused Generic summaries aim at a particular but usually broad readershipcommunity and provide an unbiased view of the most relevant information in a source. Asthe computing environments have continued to accommodate full text searching, browsingand personalised information filtering, user-focused summaries have assumed increasingimportance. Such summaries rely on a specification of a user information need, such as anarea of interest, topic or query. If it is a query-driven summary it should reflect the specificterms contained in the user’s query. The notion of truly generic summary is problematic,since some background assumptions of an audience are involved in every case.
single vs. multiple documents Summarisation of a single document requires the selection of acentral topic while in multiple documents the selection of themes is required. It is necessaryto process all the documents to find the themes as what is central in one document may beperipheral in another.
single vs. multiple topics Occasionally large or complex documents might have several partscorresponding to different thematic clusters. Such documents can be treated as multi-topic,or they can be split in separate parts. Methods have to be established to reflect the multi-topicality in the summary which often requires separate knowledge resources.
text-only vs. multimedia Multimedia summarisation instead of just using text as input/outputconsists of a combination of different media types, such as text, audio, pictures, diagramsand video.

CHAPTER 3. COMPONENT TECHNOLOGIES 32
entity vs. discourse vs. surface Entity level approaches build an internal representation for text,modelling text entities and their relationships. These approaches tend to represent patternsof connectivity in the text (e.g. graph topology) to help determine what is salient. Discourselevel approaches model the global structure of the text, and its relation to communicativegoals. In this thesis we have focused on surface-level approaches that tend to representinformation in terms of shallow features which then selectively combined together to yielda salience function used to extract information.
3.2.1 Text summarisationResearch in automatic summarisation dates back to the late 1950’s. Over the years a varietyof summarisation approaches, including both shallow and knowledge-rich methods leveraginglinguistic and statistical information, have been proposed. Early systems are characterised bya surface-level approach. There have been many suggestions as to which low level featurescan help determine the importance of a sentence in the context of a source text. These in-clude stochastic measurements for the significance of key words in the sentence [Luhn, 1958],location in the source text [Baxendale, 1958, Edmundson, 1969] or connections with other sen-tences [Skorochodko, 1972] and the presence of cue or indicator phrases [Paice, 1981] or of titlewords [Edmundson, 1969].
The 1980s enjoyed an explosion of a variety of different work, especially entity-level ap-proaches based on artificial intelligence such as the use of scripts [Lehnert, 1981, DeJong, 1982]logic and production rules [Fum et al., 1985], semantic networks [Reimer and Hahn, 1988], aswell as hybrid approaches [Rau et al., 1989, Aretoulaki, 1994]. The late 1990s represents a re-naissance of the field; all types of approaches (entity, discourse and surface) have been ex-plored aggressively, fuelled by government and commercial interest. Work in that period hasalmost exclusively focused on extracts rather than abstracts along with renewed interest in earliersurface-level approaches. Such systems typically extract sentences from the original document,e.g. [Paice, 1990]. Sentence extraction involves assigning importance scores to sentences based onterm frequency and other document characteristics. Then the system collects only those sentenceswhich have a score higher than a certain adjustable threshold value. The size of the summary iscontrolled through changing the sentence selection threshold.
[Kupiec et al., 1995] described a corpus-based method that can be used to obtain term statis-tics and to decide on an appropriate combination of features. Assuming that sentences of a doc-ument are independent, a maximum likelihood classifier is trained on feature vectors constructedfrom full-text sentences which are labelled as extract-worthy based on comparison with abstracts.[Edmundson, 1969] found on their data that location was the best individual feature and that thebest feature set comprised location, cue phrase and sentence length. A variant of this approachwas applied in Korean technical texts [Myaeng and Hang, 1999], where it was found that using acombination of cue words, sentence location and presence of title words in a sentence led to thebest results. This suggests that features examined in [Edmundson, 1969] are not language spe-cific. Additional work focused on building more complex, structured models such as probabilisticsyntax trees to compress single sentences [Knight and Marcu, 2000]. A method for automaticallyconstructing decision trees to predict whether a sentence should or should not be included in adocument’s summary is proposed in [Mani and Bloedorn, 1998]. They use three machine learn-ing algorithms and a neural network classifier to determine which sentences should be extractedfrom the text.
It is not possible to produce a coherent document summary shorter than a single sentence, or to

CHAPTER 3. COMPONENT TECHNOLOGIES 33
produce a summary that conforms to particular stylistic constraints using pure extractive summari-sation techniques. Ideally, one would prefer to understand the text, and to generate an appropriatesummary directly from the results of that understanding. Without a comprehensive natural lan-guage understanding system, an approximation must be used. [Witbrock and Mittal, 1999] werethe first to use generative statistical models for text summarisation. Their model jointly appliesstatistical models of the term selection and term ordering process to produce brief coherent sum-maries in a style learned from a training corpus.
A ‘noisy channel’ view of summarisation was proposed by [Berger and Mittal, 2000]. Thiswas inspired from the noisy channel model in information theory. A summary is sent across anoisy channel, producing a garbled ‘verbose translation’ in the form of a ‘source’ document. Thetask of summarisation is to decode the summary from this document and this could be seen asa machine translation problem (translating from source to summary, via a generative model ofsource given the summary). The summarisation problem can be decomposed into generic anduser-focused summarisation. However, the model tends to rely on large quantities of data, whichis hard to collect and annotate.
Another emerging area is that of multi-document summarisation (MDS) where content isextracted from an information source that is a collection of related documents by remov-ing redundancy and taking into account similarities and differences in information content.[Salton et al., 1999] compared paragraphs from one or more documents in terms of similar-ity of vocabulary and those paragraphs above a particular similarity threshold were linked toform a ‘text relationship map’, which could be traversed in various ways to extract summaries.[McKeown and Radev, 1999] studied relationships between different news stories on terrorist in-cidents by operators that aggregate together similar extracted templates based on logical relation-ships such as agreement and contradiction. A morphological level approach to topic focused MDSis that of maximum marginal relevance (MMR) [Goldstein and Carbonell, 1998]. In this frame-work, multiple texts can be ranked in terms of relevance to a query. Once the user has scannedsome of these, the remaining texts can then be reranked so as to maximise their dissimilarity fromthe ones already seen. This is achieved through a linear combination of relevance and novelty.A document has high marginal relevance if it is both relevant to the query and is dissimilar toother relevant documents. The various similarity metrics are based on cosine similarity, but allowfor different weighting schemes when comparing documents versus comparing a query against adocument.
NLP based approachesNLP approaches to text summarisation systems first attempt to model how text represents con-tent using deeper notation and then manipulate this model to produce a summary. Rules for textanalysis and manipulation are needed at all levels. The main strength of this approach is higherquality of summarisation and the support of abstracting. The main drawback of systems employ-ing deep NLP approaches is brittleness. They may fail when confronted with a text that reacheseven slightly beyond their linguistic or domain knowledge. This approach is also labour-intensiveand computationally costly. In addition, knowledge acquisition for such systems can not be au-tomated until a non-trivial critical mass of knowledge has been accumulated. Some success hasbeen reported in NLP-style text summarisation for audio/video browsing, but those systems relyon using almost exclusively error-less human transcriptions of the audio, such as those producedfor closed-captioning, e.g. [Ehara et al., 1997]. These efforts primarily generate indexes of singlewords and NE and not the phrase- or sentence-length units favoured in summarisation literature.In particular, rule-based systems for NE identification make use of punctuation, capitalisation and

CHAPTER 3. COMPONENT TECHNOLOGIES 34
other features found in text and would thus be difficult to apply to raw ASR output.Of particular importance in NLP based summarisation is the notion of lexical or coreference
chain [Barzilay and Elhadad, 1997] which is essentially a sequence of related words spanning atopical unit of text. By grouping words together into lexical chains, it is expected that a readermight get a better identification of the topic rather than simply picking the most frequent wordsin the text. These lexical chains also serve as their source representation, from which a summaryrepresentation is produced using heuristics for choosing the ‘best’ lexical chains. From thesethe summary is produced by employing a further heuristic to select the ‘best’ sentences fromeach of the selected lexical chains. [Azzam et al., 1999] used lexical chains for template-basedsummarisation.
3.2.2 Speech summarisationWhile the majority of summarisation research has focused so far on written documents (mostlynews articles or scientific papers), three areas of spoken language have attracted interest recently:a) summarisation of spoken dialogues in restricted domains, b) summarisation of spoken dialoguesin unrestricted domains, and c) summarisation of spoken news. The type of data output by a ASRsystem is fundamentally different from written text, even though both consist primarily of words.There are important orthographic differences, since spoken language transcription lack many fea-tures present in written language, such as punctuation and capitalisation. In addition, there is aninherent uncertainty in spoken language transcriptions, which almost always contain substitution,deletion and insertion errors. The WER for current speaker-independent ASR systems can rangefrom very low (0-5%) to very high ( 40%), depending on the domain, a factor which needs tobe weighted heavily in considering how to produce summaries. Since it is impossible to identifyall the words transcribed correctly in decoded audio, we can not depend heavily on sentence-levelparsing because even a single incorrect word can completely garble syntactic structure. Insteadinformation is needed to be chosen in another way that does not depend on syntactic or semanticanalysis. In the following paragraphs we discuss developments related to summarisation using asinput automatic transcriptions.
Summarisation of spoken dialogues in restricted domainsDuring the past decade, there has been significant progress in the area of closed do-main spoken dialogue translation and understanding, even with automatically transcribedspeech. Example systems include Verbmobil [Noth et al., 2000], JANUS [Lavie et al., 1997] andMIMI [Kameyama and Arima, 1994] systems, an overview of which follows.
Within Verbmobil a knowledge-rich approach was used. The domain was travel planning andnegotiation of a trip. In addition to finite state transducers for content extraction and statisticaldialogue act recognition, they also use a dialogue processor and a summary generator which haveaccess to a world knowledge database, a domain model, and a semantic database. The abstractrepresentations built by this summariser allow for summary generation in multiple languages.
The JANUS speech translation system operates on a number of limited domains such as ap-pointment scheduling, hotel reservation, or travel planning. Speech translation is guided by thegeneral principle that spoken utterances can be analysed and translated as sequential collectionof semantic dialogue units, each of which roughly corresponds to a speech-act. Each semanticdialogue unit is processed to capture the meaning. In order to disambiguate among multiple in-terpretations, they apply a late stage disambiguation which utilises knowledge from the machinetranslation components – acoustic and language models, parser scores and contextual informationobtained from discourse analysis. Each of these components provided a score for each possible

CHAPTER 3. COMPONENT TECHNOLOGIES 35
analysis of an ambiguous input.The MIMI system was designed specifically for automatic summarisation of human-human
spontaneous spoken dialogues. It recognises key linguistic patterns and merges information toconstruct a summary of conference room scheduling dialogues. Dialogues about single reserva-tions are summarised with a simple merging scheme, but several extensions and changes neededin order to cope with the aboutness complexity in unrestricted dialogues – knowing exactly howmany reservations are being discussed and which reservation values must be updated by subse-quent utterances.
Summarisation of spoken dialogues in unrestricted domainsThe Meeting Browser [Waibel et al., 1998] allows the user to review and browse the content ofmeetings which are transcribed using a recogniser trained on Switchboard corpus with a 30%WER. They employed an algorithm inspired from MMR [Goldstein and Carbonell, 1998]. How-ever, they did not address any dialogue or speech related issues in their summariser. In a question-answer test with summaries of five dialogues, subjects could identify most of the key conceptsusing a summary size of only five turns. These results varied widely across five different dia-logues tested in this experiment (20-90% accuracy). The above work was followed by a prototypesystem called DiaSumm [Zechner and Waibel, 2000, Zechner, 2001]. This system segments doc-uments into sentences, uses MMR to rank the sentences and finally extracts the highest rankingsentences in order of appearence in the original transcription.
Summarisation of spoken newsWithin the context of the TREC SDR conferences as well as the recent DARPA BN workshops, anumber of research groups have been developing multimedia browsing tools for text, audio, andvideo data, which facilitate the access to news data by combining different modalities.
The Informedia project [Hauptmann and Witbrock, 1997] used a combination of ASR, im-age analysis and keyword searching techniques to extract meaningful content that can be used invideo indexing and retrieval. The Broadcast News Navigator system [Merlino et al., 1997] is atool for searching, browsing and summarising TV news broadcasts. It uses a number of mixedmedia presentation strategies, combining key frames extracted automatically from the video withsummaries of the accompanying closed-captioned text along with key organisations, locations andpeople involved. Their experiments indicated that the speed with which a user could retrieve wellsegmented relevant stories was orders of magnitude greater than the speed of linear search or evena flat keyword based search.
A basic architecture for audio summarisation was proposed by [Valenza et al., 1999] accord-ing to which speech is transformed to text and summarised using text processing techniques.Acoustic confidence scores are combined with simple IR techniques to accept/reject words andphrases for inclusion in summaries. Their evaluation showed that human judges prefer summarieswith a compression rate of about 15% whilst the WER of the summary was significantly lowerthan the WER of the full transcript.
A method for automatic speech summarisation that also uses salient features in combinationwith linguistic information was proposed by [Hori and Furui, 2000]. Their summarisation processis performed sentence by sentence, and extracts words that maximise a summarisation score con-sisting of word significance measure (relevant only to nouns), linguistic likelihood, acoustic con-fidence measure and modification score. The latter score is determined by a so-called stochasticdependency context free grammar and the extraction is performed using a dynamic programmingtechnique [Ney and Aubert, 1996]. Their results showed that this method can reduce Japanese BNcaptions by about 30-40% while keeping the meaning of about 72% of all sentences in the test set.

CHAPTER 3. COMPONENT TECHNOLOGIES 36
This summarisation method has recently been applied to lecture recordings and US English BNdata [Hori et al., 2002].
3.3 Mobile messagingIn recent years, there is a growing interest in mobile communication systems that allow users touse their voices to do more than simply talk to other users. Besides pure voice communication,there are several ways for transmitting and accessing information through a wireless network.Data communication is used to transfer information between devices or a device and a network.The main mobile messaging platforms are the following (in chronological order of appearance):
paging is one way of sending data to a recipient allowing only a notification and a call backnumber to be delivered.
SMS allows up to 160 characters to be transmitted with one message from and to a global standardfor mobiles (GSM) phone.
GSM data is part of the GSM specification and can be used for data or fax transmission at9.6 Kbps.
high speed circuit switched data (HSCSD) is circuit-switched wireless data transmission withrates up to 38.4 Kbps, four times faster than the standard data rates of the GSM data stan-dard.
WAP is an application environment and a set of communication protocols optimised for viewingcontent over mobile networks.
general packet radio service (GPRS) is a packet oriented-standard offering transmission rateswith a theoretical maximum of 171.2 Kbps.
multimedia messaging service (MMS) enables sending of messages with rich media such asaudio, images and video clips.
From the platforms listed above, SMS had an unprecedented and unexpected user-driven suc-cess.19 This is in contrast to the technology and industry driven approaches to other non-voiceservices such as WAP. In the following sections we give further details about the above mobilemessaging platforms and explain their applicability to our architecture.20
3.3.1 Short message serviceSMS is a wireless data delivery platform, allowing text or data packets to be exchanged betweenmobile devices and external entities. SMS is the biggest profit-generating data service for mo-bile operators today. It is available on GSM, code division multiple access (CDMA), the NorthAmerican IS-136 and the Japanese personal digital cellular (PDC) system among other networks.Although the underlying protocols may vary [Peersman et al., 2000], all of them define a mech-anism for sending and receiving short text messages. In this thesis we focus on SMS within the
19According to the GSM Association April 2002 report, 75 billion text messages were sent globally in Q1 2002, anincrease of more than 50% over the same period of 2001.
20Paging, GSM data, HSCSD and GPRS are beyond the scope of this thesis and are mentioned for the sake ofcompleteness.

CHAPTER 3. COMPONENT TECHNOLOGIES 37
GSM, in which the maximum length of each short messages is 140 octets, sufficient coding for160 7-bit ASCII characters while non-text based short messages are also supported. AlthoughSMS has mainly been used for person-to-person messaging, services from application to personare also very popular. Short messages can be sent and received simultaneously with voice, dataand fax calls. This is possible because voice, data and fax calls take over a dedicated radio channelfor the duration of a call, while short messages travel over and above the radio channel using thesignalling path. The signalling path is always active monitoring phones and passing informationacross the mobile network and therefore it rarely gets busy on peak network usage times.21 TheSMS is a store and forward service. In other words, short messages are not sent directly fromsender to recipient, but always via an short message service centre (SMSC) instead. This allowsmessage storage if the recipient is not available. A short beep or an icon on the display screenindicates that a message has arrived. Perhaps the single best feature of SMS is that it is discreet.The message is permanently stored in the user’s inbox so that it can be selected at some later time,until it is deleted from the inbox.
The basic network structure of the SMS is depicted in Figure 3.5 while the functionality todeliver mobile-terminated messages is as follows:
1. The short message is submitted through a SMS gateway to the SMSC which stores it.2. The SMSC contacts the home location register (HLR) which contains the subscription and service
profiles and receives the routing information for the mobile subscriber.
3. The SMSC sends the short message to the mobile switching centre (MSC) using theforwardShortMessage operation.
4. The MSC retrieves the subscriber information from the visitor location register (VLR). This opera-tion may include an authentication procedure.
5. The MSC transfers the short message to the base station controller (BSC) and base tranceiver station(BTS) via a radio link.
6. The MSC returns to the SMSC the outcome of the forwardShortMessage operation.
7. If requested by the short message entity (SME), the SMSC returns a confirmation of short messagedelivery.
The two types of short message delivery available are point-to-point and cell broadcast. Dur-ing the first, short messages can be sent between mobile phones (including confirmation messages)or from a PC to a mobile phone and vice versa. In cell broadcasting text messages are sent to allmobile phones present in a cell. This service is unidirectional and is used for broadcasting mes-sages regarding, for instance, weather or traffic conditions.
3.3.2 Multimedia message serviceSMS is evolving towards MMS that is accepted as a standard by the next generation mobile net-works [mms, 2001]. MMS enables the sending of messages with rich media such as audio, imagesand video clips. Initially MMS will be very similar to a short PowerPoint presentation on a mobilephone, i.e. a series of slides featuring colour graphics and sound. Similar to an SMS, the recipientreceives a notification and when the full message is received, the presentation starts running. Vi-sually, the presentation looks like a slide show with still images and sound. MMS will emerge intwo phases. The first phase is based on GPRS as a bearer, rather than third generation (3G). Once3G is deployed, more sophisticated features like streaming video will be introduced.
Message delivery within MMS is slightly different than SMS:21The constraints for supporting a large number of simultaneous users are associated more with the capacity of the
SMSC than the signalling path.

CHAPTER 3. COMPONENT TECHNOLOGIES 38
BTS
BTS
BTSBSC
BSC MSC
PSTN
VLRHLREIR AUC
SMSC
SME Short Message EntityBTS Base transceiver stationBSC Base station controllerGMSC Gateway MSCSMSC SMS centreMSC Mobile switching centreHLR Home location registerVLR Visited location registerAUC Authentication centreEIR Equipment Identity RegisterPSTN Public Switched Telephone Network
SME
SME
SME
Figure 3.5: The basic network elements and architecture of SMS.
1. The sender sends a message to the multimedia messaging service center (MMSC).
2. When the MMSC receives the message, the MMSC sends confirmation. The sender then gets amessage sent.
3. MMSC sends the receiver a notification that a new message is waiting.
4. The receiver can then download the message immediately or later.
5. Once the message is successfully downloaded, the receiver gets a messageReceived notification.
6. Once the receiver has successfully downloaded the message, the sender gets a messageDeliverednotification.
In SMS, storage of messages is not an issue since the size of a message is small and the issueof storing a message arises only when the recipient is not available. In contrast, MMS messagescan be longer. Also, they may be stored in the recipient’s MMSC for longer (since they may notbe downloaded immediately) introducing a cost. Further, users may wish to store messages in apermanent form e.g. photo albums. Unlike SMS, MMS communication will not be discreet dueto the rich media used. SMS does not have a concept of a user profile whereas in MMS, the notionof user profile is central, e.g. determines when a message will be downloaded. Finally, copyrightprotection is much more significant in the MMS environment.
3.3.3 Wireless application protocolWAP is an application environment and a set of communication protocols for wireless terminalsdesigned to overcome resource limitation issues such as low processing capabilities, high bit errorrate, limited memory and operation over a variety of bearer networks. WAP takes a client serverapproach by incorporating a relatively simple micro-browser into the mobile phone while servicesand applications reside temporarily on WAP gateway servers, rather than permanently in phones.

CHAPTER 3. COMPONENT TECHNOLOGIES 39
WAP comprises a five-layer model, consisting of transport, security, transaction, session and ap-plication layers [wap, 1998]. WAP does not force applications to use the entire protocol stack. Ifan application, for example, does not require security but reliable data transmission, it can use aservice of the transport layer without using the security layer.
WAP push frameworkA feature of WAP that makes it attractive as a voicemail summarisation delivery platform is thepush access protocol (PAP). PAP outlines a proactive way to send information from Internetservers to WAP-enabled mobile devices without the user having to actively request it. Typicalexamples include alerts to which the user has subscribed, small adverts, and email notifications.Combined with other applications, such as location-based services, PAP becomes a powerful wayof providing users with valuable real-time information.
Push services already exist in mobile phone networks, using the SMS and the cell broadcastmechanism in GSM networks. Many people already use SMS regularly, for information on keynews items, or notification that a new message has arrived in their voicemail box. However, thereis a very important element missing in the above: the service is not interactive. WAP provides therequired interactive behaviour through specifications such as the wireless telephony application(WTA).
Within the push framework, the protocols used by the server that initiates the push of contentare separated from the protocols used in the WAP domain. This is achieved by placing an inter-mediary known as the push proxy gateway (PPG) between the push origin server, known as thepush initiator (PI) and the WAP client on the wireless device (Figure 3.6). If the push message isunread, it may be silently replaced by subsequent push messages under the control of the PI, en-suring that up-to-date content is always in the handset. The PAP is designed to work on top of oneof the application level protocols, like HTTP or SMTP on the Internet. Push over-the-air (OTA)protocol that is used for delivering the push content from the PPG to the device over the wirelessnetwork is a thin protocol layer that is implemented in both the mobile device and the PPG. Inaddition to the two push specific protocols, PAP and Push OTA, the PPG implements the entireWAP protocol stack.
Push Proxy Gateway (PPG)SME
Internet
Push Initiator (PI)
Push Access Protocol (PAP)Push Over-the-Air (OTA) Protocol
Mobile Network
Figure 3.6: The basic network elements and architecture of WAP Push.
WAP is used with MMS as an underlying protocol. Future versions of MMS will be based onthe standard Internet protocols such as HTTP over TCP/IP. However, currently WAP is the onlyeffective mechanism to terminate a push message.
Optimal bearers for WAP pushNone of the existing GSM bearers for WAP – SMS, unstructured supplementary services data(USSD), cellular datagram packet data (CDPD), GPRS and circuit switched data (CSD) – are

CHAPTER 3. COMPONENT TECHNOLOGIES 40
optimised for this protocol [Buckingham, 2001]. Although, SMS can be used as a bearer for WAPbrowsing, it is just too slow for practical use. Instead, operators rely on IP-based bearers for goodperformance. However, for push we expect SMS to be the most widely used bearer, due to severallimitations with IP in the current mobile systems.
With the exception of SMS, the existing bearers are inappropriate for push services because aconnection establishment requires the mobile client to act as a remote access server. This featureis not supported by today’s mobile terminals so as to keep the client’s processing load low. Buteven if mobile terminals had this feature, those bearers lack immediacy in the sense that theyrequire a certain amount of time to establish connection and reserve the voice channel prohibitingvoice calls to be placed at the same time. Although GPRS, the new packet-based bearer, is oftendescribed as ‘always on’, that is unlikely to be true for IP connections in the near future. Theuser has to start the WAP browser in the handset before the IP connection is established, andthe connection is usually dropped if there are several minutes of inactivity. Even if an operatordoes offer long-lasting IP sessions for thousands of WAP users, they are going to have troublefinding enough IP addresses for them. Until the 128 bit long addresses of IPv6 become common,the solution has to rely on network address translation (NAT). This is a technique that allowsmany devices to share a single public IP address. Although that is sufficient when the handset isbrowsing, but there is no way for push messages to reach them.22 For the above limitations of theother bearers and the simplicity and effectiveness of SMS, we selected it as an adequate bearer forWAP push for the purpose of delivering voicemail summaries.
3.4 HypothesesFollowing the description of the technologies that compise VoiSum’s architecture, we can makethe following hypotheses:
H1 A hybrid connectionist/HMM system can provide good performance on the Voicemail task. Weexpected that a relatively simple ASR system with components trained using the Voicemailcorpus and other existing databases would give adequate recognition accuracy. Further,the rich transcription output from our own system would be the basis for designing thesummarisation component.
H2 SMS is adequate for transmitting voicemail summaries. We predicted that key content of anaverage voicemail message could be encapsulated in a couple of SMS messages and thetime required for creating and transmitting the summaries would be kept minimal.
In the next chapter we shall examine the validity of the above hypotheses experimentally.
3.5 Concluding discussionThis chapter introduced the diverse fields of ASR, automatic summarisation and mobile messag-ing. In order to implement the VoiSum architecture we need to look closely at the characteristicsof these technologies and use them together in creative ways, each building on the strengths ofthe others. With the exception of SMS, the existing bearers are inappropriate for push services.At the same time, selecting SMS as a message transmission mechanism introduces an essential
22The push message would be sent to a pre-defined port. However, when the NAT server receives a connection toport on its public IP address, it has no way of knowing which terminal it should be routed to.

CHAPTER 3. COMPONENT TECHNOLOGIES 41
limitation on the length of a text summary. Domain, size and complexity of the spoken mes-sages will affect the summarisation component. For example, speech of a restricted domain iseasier to summarise than multi-topical, because it might be feasible for the former to find andcodify the rules-templates which produce the summaries. Further due to transcription errors, thesummariser must capable of generating summaries using reliably transcribed words. Additionally,short spoken messages require different summarisation techniques from long ones while statisticalapproaches require a large and homogeneously annotated corpus.

4. Baseline voicemail summarisationsystem
This chapter describes the baseline voicemail summarisation system and attempts to examine thevalidity of the hypotheses we have just made. We describe the construction of the ASR componentwhich is based on a parameter efficient hybrid connectionist/HMM approach. We then define theproblem of voicemail summarisation and describe the annotation of the messages for training,validation and testing. A weighting of lexical and audio-specific features is used at this stageto score words. According to it, the lowest scoring words in message transcriptions are beingremoved to form summaries. After a voicemail summary has been produced, it is fitted into a tem-plate which encapsulates it within the appropriate protocol headers so that it can be transmittedover a mobile netowork’s signalling path. We finally discribe the testbed we used to estimate thetext summaries submission delays.
4.1 Automatic transcription of voicemail speechCurrent ASR systems perform acceptably in controlled environments. Voicemail datais characterised by a variety of speaking rates, accents, tasks and acoustic condi-tions [Padmanabhan et al., 1997]. Additionally, phenomena such as a wide variability in speakingrate and in vocal effort as well as an increase in disfluencies (e.g. false starts, repetitions, brokenwords) are common. In contrast to natural dialogue, voicemail speech is a “one-way” communi-cation: speakers do not receive any direct feedback when they leave messages, resulting in manyquestions and instructions which are not present in conversational or dictated speech. Since im-mediacy is of primary importance while recording a voicemail message, the speakers do not haveenough time to complete message and utterance planning, and often speak without a good plan.A motivated user tends to speak more clearly and the speech is a little more formal in its nature,
42

CHAPTER 4. BASELINE VOICEMAIL SUMMARISATION SYSTEM 43
without the problems of cross-talk and barge-in.There are no restrictions in location or type of phone used to leave a voicemail message.
The telephone channel provided on any particular call has spectral and temporal effects on thetransmitted speech signal. These sources of variability are particularly a problem for cellularand cordless telephones. Background noise and acoustics in the environment that a telephonespeaker is in have also tangible effects on the signal. Different handsets, or in general differentmicrophones, have different frequency response which is also affected by tilting a microphoneat different angles. Finally some degradation is due to the file compression method used by thevoicemail systems.
4.1.1 Experimental dataVoicemail data is difficult to collect because of privacy and legal issues. The largest corpora knownto be available have been collected by AT&T and IBM. AT&T have reported ASR and indexing re-sults using a database of 10 000 voicemail messages from 2 500 speakers [Hirschberg et al., 2001].We use the Voicemail Corpus-Part I that was recorded from volunteers at various IBM sites in theUnited States and is available through the linguistic data consortium (LDC) (LDC98S77). Thedatabase is not quite gender balanced, with the percentage of male speakers being 38%. The top-ics covered in the collected data ranged from personal messages to messages with technical orbusiness related content. In this sense the Voicemail corpus is different from the Switchboard cor-pus [Godfrey et al., 1992] where the speakers were asked to talk about a specified topic (1 of 35topics), and gives a distribution of topics in real-world voicemail. The messages were subjectivelycategorised as follows: 27% business related (e.g. schedule of a meeting), 25% personal (e.g. ‘getback home before 9pm. . . ’), 17% work-related (e.g. maintenance schedule for a lab), 13% tech-nical (messages containing technical information about programming) and 18% miscellaneous(messages not falling in any of the above categories). We also observed that a large number of thespeakers in the corpus had strong dialects and non-native accents.1
The average length of a voicemail message is 31 sec and has about 100 words, however thepeak of the histogram of voicemail durations occurs at 18 sec. The average rate of the speechis approximately 190 words per minute. Each voicemail message typically has a click at thebeginning or end of the message arising of the caller hanging up. The data was sampled at 8 kHz,and recorded in 8 bit µ-law compressed format. As the messages were retrieved from the voicemailsystem, they had been compressed by the proprietary compression techniques used by the ROLMvoicemail system that is used in various IBM locations. [Padmanabhan et al., 1997] showed thatalthough the voicemail compression has some effect on the speech recognition error rate, it isgenerally small for most speakers.
Datasets and dictionaryThe system presented herein is trained using the 14.6 hours of speech contained in the VoicemailCorpus Part I and we refer to this set as Vmail15. This corpus comprises 1801 messages in thetraining set and in our implementation the first 1601 messages are used as training set and theremaining 200 as validation set. For evaluation purposes, we use the development test set ofthis corpus comprising 42 messages (test42, 2 000 words) and a second test set containing 50messages (test50, 4 000 words).2 The messages in the test50 set are on average twice as longas those in test42. The difference between validation and test data is very important. If every
1Non-native speakers, in general, exhibit a large acoustic variability, reduced grammar, slower speaking rate, andtheir pronunciations are located in a speaker specific space that is less discriminative.
2M. Padmanabhan is acknowledged for providing us with test50.

CHAPTER 4. BASELINE VOICEMAIL SUMMARISATION SYSTEM 44
potential improvement is evaluated on the same test set that is used for the final evaluation, thenone runs the risk of ‘tuning’ the recogniser/summariser to that data.
Vmail15 corpus contains approximately 150 000 words, 10 000 of which are unique entries.Our basic pronunciation dictionary was derived from a subset of the 65 000 word dictionary usedin the Abbot/SPRACH Hub-4 BN transcription system [Robinson et al., 2002] that contained anaverage of 1.3 pronunciations for each word. There were about 1 000 new words in Vmail15for which pronunciations were constructed manually following sub-word rules of the 1998 Ab-bot/SPRACH Hub-4 BN dictionary. The out of vocabulary (OOV) rate of the test42 and test50with respect to the the above dictionary was 2.2% and 2.7%, respectively.3
4.1.2 Construction of the ASR componentAlthough the majority of ASR systems use parametric distribution models to estimate the like-lihoods of particular feature vectors given a particular speech class, we constructed the ASRcomponent using the NN/HMM framework (Section 3.1.6). This will allow us to examine thevalidity of the H1 hypothesis. According to this approach a neural network serves as the acous-tic model, estimating discriminative posterior probabilities for each context independent (CI)phoneme class [Robinson et al., 2002]. These probabilities, converted into likelihoods (Equa-tion 3.11), are then used in a conventional HMM decoder to find the most likely word sequence.One of the reasons behind selecting this approach is historical since SPandH is one of the labs(along with Cambridge, Faculte Polytechnique de Mons, ICSI and IDIAP) where NN/HMM mod-els have been held on despite the proliferation of techniques and tools specific to GMM systems.But there are also other advantages:4
performance NN/HMM systems are comparable in performance to other architectures. On smallvocabulary tasks, the differences are marginal. On large vocabulary tasks such as BN, theNN/HMM systems may make as many as 50% relative more errors than the best performingsystems (which are GMM based), but the best systems are much more complex e.g. speakeradaptation and context-dependence.
simplicity The structure of a NN/HMM system is rather simple: a single neural network witha few tens of outputs, each of which has a direct interpretation as a particular phone.GMM/HMM systems typically rely on a rather fine sub-phonetic state division, and in con-sequence have complicated state-tying infrastructure to maximise training efficiency. Muchof the complexity of context-dependence, phoneme states and parameter sharing is accom-plished automatically within the single network-training operation, and is hidden from theuser. Further, while GMM/HMM systems typically make use of a vector of acoustic featuresand their first and second derivatives, NN/HMM use wider acoustic context.
flexibility Whereas GMM/HMM systems often perform very differently in response to relativelyminor changes in feature representation, NN/HMM systems are much better at adapting tochanges in input feature distributions.
hardware availability Easy and fast training of neural network acoustic models from hand labelsor forced alignment through back propagation can be achieved by using SPERT T0 customvector microprocessor [Wawrzynek et al., 1996].
3The OOV words were infrequent in the test sets. If all words are considered irrespectively of their frequency, theOOV rates were 7.3% and 12.8%, respectively.
4cf. Section 3.1.4 and the ICSI Speech FAQ at http://www.icsi.berkeley.edu/speech/faq/connVsGMM.html

CHAPTER 4. BASELINE VOICEMAIL SUMMARISATION SYSTEM 45
discrimination Because NN/HMM systems calculate the posterior probability of all possibleclasses in a single step, they can focus on discriminating between classes that might bemost prone to confusion. By constrast, in GMM/HMM systems each class is representedby a separate set of parameters without regard to the other classes, so there is typically nomethod to make more precise models of the critical regions of feature space (discriminativetraining of GMMs is an active area of research).5
posteriors The neural networks acoustic models estimate true posterior probabilities rather thanthe likelihoods (arbitrarily scaled probabilities) resulting from distribution models. Poste-riors present several interesting application opportunities, including confidence estimation,search efficiency, and visualisation.
PreprocessingWe experimented with both PLP and MSG front-ends. We created 12th order PLP features plus logenergy without augmenting with deltas or double-deltas (Section 3.1.1). The MSG features consistof two banks of 14 spectral energy features each; the first bank is filtered to contain modulationfrequencies between 0 and 8 Hz, while the second covers 8 to 16 Hz. The statistics of each featurechannel were normalised to zero mean and unit variance over the training data to increase therobustness of the system to environmental conditions.
System configurationThe input to the MLP network is a window of 9 successive feature vectors centered on the frameof interest, providing the classifier with temporal context. Therefore, the PLP network has 1179 13 input units and the MSG network has 252 9 28 input units. The output layer consists
of 54 nodes,6 each associated with a particular CI phone class. Input and output are connected bya sigmoidal hidden layer of 2 000 units. The number of parameters for each layered network was
9 feature vector length 54 2000 weights, plus (2 000+54) biases.The underlying statistical model was an extremely simple HMM. For each of the 54 phonetic
classes, we had a HMM consisting of strictly left-to-right model with multiple states tied to asingle distribution; multiple repeated states were used to establish a minimum duration of eachphone. The parameters of the system were adapted using Viterbi training to maximise the loglikelihood of the most probable state sequence through the training data. First, a Viterbi passis made to compute an alignment of states to frames. The parameters of the system were thenadjusted to increase the likelihood of the frame sequence, i.e. maximising the emission probabil-ities of the HMM. The emission probabilities were scaled likelihoods estimated by dividing thenetwork outputs by the priors of each class while the transition probabilities were set to 0.5.
Initial labellingWe made an initial forced alignment7 of the Vmail15 data, by passing it through a network trainedon Hub-4 BN data downsampled to 8 kHz bandwidth. That network had offered a WER8 of 36.0%on the Hub-4 BN task [Robinson et al., 2002]. That system yielded a 67.0% WER for VMail15 as
5 Another set of transcriptions which will be used for our summarization experiments to which we shall be referringto as SR2 was produced by discriminative training of GMMs [Cordoba et al., 2002].
6No separate phone classes for non-speech phenomena such as ‘click’ or ‘mumble’ that are common in Voicemailcorpus were modelled. Silence should be capable of modelling those too.
7The word sequence for each training utterance is defined in advance, and all that is required is to find the bestmatch between those words and the acoustic signal.
8NIST’s standard scoring package sclite in dynamic programming string alignment mode was used in allexperiments.

CHAPTER 4. BASELINE VOICEMAIL SUMMARISATION SYSTEM 46
ASR system configuration test42(1) BN Acoustics, PLP features, VMail15 bigram 67.0%(2) VMail15 Acoustics, PLP features, VMail15 bigram 56.1%(3) Combination of (1) and (2), VMail15 bigram 55.2%(4) Embedding training of (3), VMail15 bigram 54.2%(5) PLP features, VMail15, BN bigram 100:1 weighted mixture 54.4%(6) PLP features, VMail15, BN bigram 50:1 weighted mixture 53.9%(7) PLP features, VMail15, BN bigram 20:1 weighted mixture 54.4%(8) PLP features, VMail15, BN bigram 1:1 weighted mixture 58.0%
Table 4.1: Recognition performance on test42 after bootstrapping from the BN acoustics and theeffect of combining VMail15 and BN bigrams.
shown in Table 4.1. We then trained the MLP network with the acoustics of Vmail15 and tested itusing a bigram language model to get a WER of 56.1%.
Combination of acoustic probability streamsBy combining acoustic probability streams framewise in the log domain [Hochberg et al., 1995]the WER decreased to 55.2%. Although MSG features alone were not as good as PLP features,the WER was significantly reduced by combining these two systems as table 4.2 depicts. MSGfeatures offered a significant benefit for messages that were degraded in some manner, and weretherefore used as the basis of our subsequent work.
Embedded trainingThere may be a subtle9 inconsistencies between the transcribers’ labelling in the training databaseand the intrinsic capabilities of the classifier. Such a mismatch can compromise the training of theclassifier, since it may keep reproducing aspects of the training labelling which are not necessarycorrect. One approach to reducing or avoiding these effects employs an iterative process of train-ing a classifier. This classifier is used to relabel the training examples (subject to the original wordtranscriptions), and the training of a new classifier starts from the relabelled training data. Theidea is that if there are systematic timing biases in boundaries, or questionable label assignmentswhere a free choice exists within the pronunciation lexicon, the relabelling will correct these, andthe classifier trained in the next iteration will have a more consistent set of labels to train to, andthus will be more accurate. This process can be repeated indefinitely, although the experience isthat iterations beyond three or four times yield little or no additional gain. The WER of the firstembedded training was 54.2%, and we did not get any real improvements through iterations.
Language modelDue to the relatively small size of the Vmail15 corpus used to train language models, we experi-mented with weighted mixtures of Vmail15 language model and a BN language model. The latterwas created using a set of carefully transcribed data that containing approximately 1M words. Al-though we managed to get a slight improvement of 0.3% absolute after combining VMail15 andBN data with a ratio of 50:1, we shortly abandoned the use of those combined language models,not wishing to increase the vocabulary size to 35 000 words with a marginally useful technique.
9This can be worse whenever errors occur in the database, e.g. vm103315 audio file contains two voicemail messagerecordings while the corresponding transcription corresponds only to the first one.

CHAPTER 4. BASELINE VOICEMAIL SUMMARISATION SYSTEM 47
ASR system configuration test42(9) 193 compound words in (4), PLP features, VMail15 bigram 53.7%(10) 53 compound words in (4), PLP features, VMail15 bigram 52.4%(11) PLP features, VMail15 trigram 51.2%(12) MSG features, VMail15 trigram 51.8%(13) PLP+MSG features, VMail15 trigram, 53 compound words 48.4%(14) PLP+MSG features, VMail15 trigram, no compound words 46.5%
Table 4.2: Effect of modelling compound words in performance and comparison of differentacoustic features.
Compound wordsIt is known that in spoken language some words are more closely grouped with adjacent words.Since the pronunciation of a word depends on contextual factors such as following and preced-ing words, word predictability and speaking rate, we also examined ways to add more contex-tual influence into the pronunciation model. Merging confusable words with other words withwhich they co-occur frequently and modelling coarticulated pronunciation at the boundaries isexpected to improve recognition accuracy. Our initial model consisted of 193 compound words10
which are marked in original transcriptions and were used as single lexical items in both thevocabulary and the language models. We modelled their pronunciations using rules describedin [Finke and Waibel, 1997]. When the baseline vocabulary was augmented with compound wordsa small reduction in WER (0.5% absolute) was gained using a bigram model. Since in that setthere were included infrequently occurring word-pairs (which would have limited impact on anyWER statistics), an additional constraint of word pair frequency was added. After setting a thresh-old of 15 or more occurrences in order to include words in compound word list, we came up with53 compound words while the respective model produced a WER of 52.4%. However, when thesame compound words were incorporated into the trigram language model this gain vanished asshown in Table 4.2. Reduced performance can result from crude pronunciation models whichseem to assist language models of lower complexity in making better assumptions. The CI natureof our system can be an important factor related to the above results.
We revisited the issue of compound words by augmenting both the vocabulary and the tri-gram language model with 32 manually designed compound words specific to voicemail follow-ing [Saon and Padmanabhan, 2001]. This reduced the WER to 44.4% and 46.6% for test42 andtest50, respectively. Before computing the WER all compound words in the reference and de-coded transcriptions are replaced with the corresponding sequence of words. We also split theacronyms into individual words of letters (e.g. C. E. O. instead of CEO). Hence part of the infor-mation would be retained in the case that some letters are misrecognised or not included in thesummary, giving the user a chance to recognise a familiar acronym even in the presence of someerrors.
Extended language modelIn an attempt to extend the language model and the vocabulary while keeping the confus-ability as low as possible, we trained a trigram language model with the available voicemail
10Compound words in the linguistics literature are known as collocations and fixed phrases [Smadja, 1993].

CHAPTER 4. BASELINE VOICEMAIL SUMMARISATION SYSTEM 48
Compound words Phonemic TranscriptionA-CALL ax kcl k ao lALL-RIGHT ao r ay tcl tAREA-CODE ey r iy ax kcl k ow dclAS-SOON ax s uw nBYE-BYE bcl ax bcl b ayCALL-ME kcl k ao l m iyFIND-OUT f ay n dcl aw tclFOLLOW-UP f aa l ow ah pclGET-A-CHANCE gcl g eh dx ax ch ae n s ayGIVE-ME gcl g ih v m iyGIVE-ME-A-CALL gcl g ih v m iy ax kcl k ao lGOING-TO gcl g ah n axHAVE-A-NICE-DAY hh ae v ax n ay s dcl d eyHELP-DESK hh eh l pcl dcl d eh s kclKIND-OF kcl k ay n dcl axLET-ME-KNOW l eh m iy n owLET-YOU-KNOW l eh y uw n owLITTLE-BIT l ih tcl t el bcl b ih tclPHONE-MAIL f ow n m ey lPHONE-NUMBER f ow n ah m bcl b axrPLEASE-GIVE-ME-A-CALL pcl p l iy z gcl g ih v m iy ax kcl k ao lSET-UP s eh tcl ah pclSORT-OF s ao r tcl ax vTAKE-CARE tcl t ey kcl k ey rTALK-TO-YOU-LATER tcl t ao kcl t y uw l ey dx axrTHANK-YOU th ae n kcl y uwTHANKS-A-LOT th ae n kcl k s el aa tclTHANKS-VERY-MUCH th ae n kcl k s v eh r iy m ah chTHIS-IS dh ih s ih zWANT-TO w aa n axWANTED-TO w ah n ax dcl tcl t axYOU-GET-A-CHANCE y uw gcl g eh tcl ax ch ae n sYOU-KNOW y ax n ow
Table 4.3: Compound words modelled in the ASR system and some of their alternative pronunci-ations.
data and measured the perplexity of every sentence in the Hub-4 BN and Switchboard11 cor-pora [Fetter et al., 1996]. Prior to calculate the perplexity of each sentence in Switchboard corpuswe removed overlapping portions (both speakers talking at the same time) and certain non-speechevents such as laughter or coughs and interruptions/hesitations. Approximately 1 300 sentencesof both corpora that scored the lowest perplexity and contained at least ten words were added tothe training data. We then trained a language model with the augmented texts and tested on theVoicemail test set.
In all experiments the singleton bigrams and trigrams were excluded and a Witten Bell dis-count strategy was used.12 As shown in Table 4.4, the extended language model and the 2 000extra entries in the vocabulary that reduced the OOV rates to 1.6% and 2.0%, leading to WERof 41.1% for test42 and 43.8% for test50, respectively. Since the WER is not uniform, but rather
11Switchboard corpus (LDC93S7) [Godfrey et al., 1992] is a collection of about 2400 two-sided telephone conversa-tions among 543 speakers (302 male, 241 female). A computer-driven “robot operator” system handled the calls, givingthe caller appropriate recorded prompts, selecting and dialling another person to take part in a conversation, introducinga topic for discussion and recording the speech from the two subjects into separate channels until the conversation wasfinished.
12This is an estimator where the first occurrence of each word is taken to be a sample for the “unseen”event [Witten and Bell, 1991].

CHAPTER 4. BASELINE VOICEMAIL SUMMARISATION SYSTEM 49
bursty across and within messages, it is possible to perform useful summarisation where the WERis low. In the experiments reported in the remaining of this dissertation the above WER rates willapply.
ASR system configuration test42 test50Baseline 46.5% 48.2%Compound words 44.4% 46.6%Low perplexity sentences 41.1% 43.8%
Table 4.4: Improvements in transcription accuracy after augmenting both the language model andvocabulary with task specific compound words and Hub-4 BN and Switchboard sentences thatscored low perplexity with respect to the Voicemail training set language model.
By comparing the above WER with those reported by [Padmanabhan et al., 1998,Saon and Padmanabhan, 2001] and [Cordoba et al., 2002] our system produces up to 25% rela-tive (11% absolute) more errors. This supports H1 hypothesis that predicted a good recognitionaccuracy, especially given the parameter efficient topology of our models. Further improvementsin recognition accuracy could be obtained by taking advantage of the fact that the differences inthe nature of the errors made by the multiple configurations we presented are in some sense com-plementary. A mechanism for performing such a combination of ASR output is provided by therecognizer output voting error reduction (ROVER) system [Fiscus, 1997].
4.2 Voicemail summarisationVoicemail summarisation has several features that differentiate it from conventional text summari-sation:
1. Typical voicemail messages are short: the average duration of a voicemail message is 30 secin the IBM Voicemail corpus;
2. The summaries are extremely terse, designed to fit into short messages; hence coherenceand document flow (style) are less important than the transmission of the main content ofthe message;
3. Since the voicemail message is transcribed by an ASR system, a significant WER must beassumed.
We have adopted a word-extractive approach to voicemail summarisation. That is, we define asummary as a set of content words extracted from the original message transcription. Given thisdefinition, we can frame the problem of voicemail summarisation as a word-level discriminationtask: for each word, decide whether or not it should be included in the summary. The auto-matic voicemail summarisation task can be defined as the selection of important, topical words orphrases from within the body of a transcribed message. Assuming that each word can be consid-ered independently13 , given a spoken message S , the task of summarisation is to map each terminto a predefined summary class according to values of feature vectors.
S : R V 0 1 C (4.1)13When humans listen to spoken utterances they need to identify individual words before they can extract a linguistic
meaning from them. Although continuous speech does not contain words as discrete entities surrounded by silence,listeners are able to resolve the problem of segmenting continuous speech into words without any noticeable difficulty.

CHAPTER 4. BASELINE VOICEMAIL SUMMARISATION SYSTEM 50
Stop wordsA BEEN I’D ITS SHE THEIR TO WE’VE WHOMAM BY I’M LITTLE SHOULD THEM TOO WERE WHOSEANYWAY BYE I’VE ME SO THERE WAS WHERE WHYARE HE IS MY THAT THIS WE’D WHETHER WOULDAS HELLO IT OF THAT’S THOUGH WE’LL WHICH YEAHBE HI IT’S PLEASE THE THUS WE’RE WHILE YOU’RE
Table 4.5: Words excluded from the summaries during the annotation phase.
where V is the vocabulary size and C is the class-set size. A fundamental difference of voice-mail summarisation with summarisation of spoken dialogues or BN is that only one speaker speaksat the time and due to the relatively short length of messages segmentation is not necessary.
4.2.1 Annotation protocolThe construction of a supervised classification system for a summarisation task, requires a dataset of labelled examples in order to train, validate and test the system. The experiments reportedin this chapter have used manually annotated data corresponding to the first 800 and last 200messages in the IBM Voicemail Corpus as a training set and validation set, respectively.
The annotation of principal content words in the transcriptions was partially based on theextraction of NEs, along with the selection of additional words necessary for the understandingof the message. Labelling of important words in a message is not an easy task and possibly notvery robust, since vast interpretive differences are possible and common. Any annotation schemamust attend to the details within context. The following rules were followed during the annotationphase:
1. Pre-annotated NEs were always marked as targets unless unmarked by later rules
2. The first occurrences of the names of the speaker and message recipient were always markedas targets,14 other occurences of them were not marked as targets unless they resolve ambi-guities
3. Any words that determine explicitly the purpose of the message were marked as targets
4. In case the same information is repeated within the message only the first instance wasselected with the exception when the speaker changed his/her mind
5. Any stop words (Table 4.5 ) were automatically excluded from the summaries
6. During labelling only the human transcription was available to the annotator15
As shown in Table 4.6 the training set comprised 66 000 words and the validation set 17 600words. The average compression rates for all sets was 30% with the exception of test50 where therate is 20%. The relation between the number of target words and total words in each transcribedmessage contained in test42 and test50 is shown in Figure 4.1, respectively. The annotation ofan example message (vm103317) follows with target words shown in boldface. The referencesummaries for the two test sets are given in Appendix A.
14Some names such the recipient’s name are not important in the summary. This means that the performace of NEmatching for classification is an over-estimate, since in reality there should be more insertions.
15This was because we did not want to introduce a bias towards words that were prominent in the audio message.

CHAPTER 4. BASELINE VOICEMAIL SUMMARISATION SYSTEM 51
Data set Training Validation Test42 Test50Messages 800 200 42 50Transcribed words 66 049 17 676 1 914 4 223Total target words 20 555 5 302 561 820
Proper names 2 451 666 111 170Telephone numbers 3 007 577 120 190Dates and times 1 862 518 46 81Other target words 13 235 3541 284 379
Average compression rate (%) 31.1% 29.9% 29.3% 19.4%
Table 4.6: Description of the data sets used to perform the summarisation experiments.
HI BLAINE KAREN GATES JUST WANT TO LET YOU KNOW I HAD TO MOVE THE BIWEEKLYWITH ASH- WITH ASHOUK AND DRAGUTIN FROM JUNE THIRTIETH MONDAY TO TUES-DAY JULY FIRST ELEVEN THIRTY TO TWELVE THE SAME TIME BUT THE NEXT DAY UH I-IT WILL NOT HAPPEN ON THE THIRTIETH OF JUNE WE’RE GOING TO PUT IT JULY FIRSTTHANKS BYE BYE
Agreement between annotatorsHumans tend not to agree very well on what constitutes an ideal extract. If we are to trust that asummary is indeed a reliable substitute for the source, we must be confident that it does in factreflect the content of that source. Hence, methods for creating and evaluating summaries mustcomplement each other. Several empirical studies have compared different human summaries fortheir degree of overlap. It is possible to measure the level of agreement between annotators bycounting the proportion of times they agree or disagree on a decision.
In order to analyse the agreement among human annotators for the voicemail summarisationtask we adapted a software tool whose purpose was to allow human annotators to extract wordsfrom BN data and create summaries with a target compression rate.16 In particular we asked asked16 human annotators to create summaries for 5 randomly selected messages contained in test42(messages: 2, 7, 9, 14 and 26) with a target summarisation rate in the range of 20-30%. A sampleof the tool containing message 9 is depicted on Figure 4.2.
With the exception of two subjects (out of 16) who started summarising by selecting impor-tant words, all subjects at a first pass scanned the transcription and excluded irrelevant words,producing summaries with compression rates in the range of 45-50%. During subsequent passesthey included/excluded words so as to meet the compression rate requirements. We also foundthat virtually all annotators tended to the upper limit of compression (29-30%).
Inter-annotator agreement was measured using the Kappa statistic. A use of Kappa statistic(Section 2.6.2) can be seen in the SUMMAC evaluation [Mani et al., 1998], where 4 subjectswere asked to assess how acceptable the summaries were, without being given explicit criteria. Aunanimous agreement only on 36% of the data was observed, leading to a Kappa of 0.24. It wasunclear whether this disagreement was due to different interpretations of ‘acceptability’ or due tosimilar interpretations with different judgements. As shown in Table 4.7 the agreement among the16 annotators in our experiment found to be relatively good, in the range of 0.36 to 0.55 (average0.48).
4.2.2 Summarisation through term subtractionAs we saw in Section 3.3.1 selecting SMS as a message transmission mechanism introduces anessential limitation on the length of a text summary. As the maximum length of each SM is 140octets (sufficient coding for 160 7-bit ASCII characters), we needed a summariser capable of
16C. Hori is acknowledged for giving permission to modify her tool for the purposes of this experiment.

CHAPTER 4. BASELINE VOICEMAIL SUMMARISATION SYSTEM 52
0
20
40
60
80
100
120
1 3 5 7 9 11 13 15 17 19 21 23 25 27 29 31 33 35 37 39 41
message number
num
bero
fwor
ds
TargetsTotal words
0
50
100
150
200
250
300
1 3 5 7 9 11 13 15 17 19 21 23 25 27 29 31 33 35 37 39 41 43 45 47 49
message number
num
bero
fwor
ds
TargetsTotal words
Figure 4.1: The number of target words versus the total number of words in the message tran-scriptions comprising test42 (top) and test50 (bottom).
retaining only the most important words contained in a message. In theory, we need to generatesummaries that use only correct information. Since we can never guarantee that we can perfectlyidentify the words in decoded audio that are correct, we can not depend on sentence-level parsingbecause even a single incorrect word can completely garble syntactic structure. Instead, we needto choose information in another way, one that does not depend on syntactic or semantic analysis.
After taking into account the lack of sentence-level structure in voicemail, we performedvoicemail summarisation by representing each message as a vector of weighted terms, with theweights derived from collection frequency, NE matching and acoustic confidence measures. In therest of this chapter, the task of message summarisation can be seen as a linear combination of sta-tistical and prior knowledge information, where the decision to accept or to reject words or phrasesin a summary is based upon speech recognition confidence measures, term collection frequencyand NE matching. The idea behind term weighting is selectivity: what makes a term a good one iswhether it can express correct information content from the original message. The computation ofthe weights reflects empirical observations of the data. In this particular implementation, we did

CHAPTER 4. BASELINE VOICEMAIL SUMMARISATION SYSTEM 53
Figure 4.2: Sample of the tool used to collect summaries produced by different annotators, whichthen were analysed regarding their similarity.
Message number 2 7 9 14 26Target tags 300 475 380 292 314Non targets tags 788 1317 932 796 838Po 0.79 0.75 0.79 0.80 0.82Pe 0.60 0.61 0.59 0.61 0.60Kappa 0.48 0.37 0.49 0.50 0.55
Table 4.7: Agreement among 16 annotators on five random messages contained in test42. Theproportion of target and non target tags as well as the Kappa statistic, Po and Pe (Section 2.6.2)for each message are shown.
not remove stop words (e.g. prepositions and conjunctions) via a stop word list.17 The algorithmshown in Figure 4.4 removes the words with the lowest score till the restrictions of message lengthare met. A description of the lexical features and the text compaction technique we used follows.
Acoustic confidenceIn theory, we need to generate summaries that use only correct information. Confidencemeasures quantify how well a model matches some spoken utterance, where the valuesare comparable across utterances. NN/HMM systems are well suited to producing com-putationally efficient acoustic confidence measures, without requiring explicit normaliza-tion. [Williams and Renals, 1999]. Their relationship to the acoustic model enables them to beapplied at the frame-, phone-, word- and utterance-levels, providing a basis for distinguishing be-tween different sources of recognition error. The most discriminating measures are achieved bynormalising all phonemes in a word by the duration of the entire hypothesised word, rather thannormalising each phoneme constituent by its own duration. These confidence measures are com-puted directly by CHRONOS decoder [Robinson et al., 2000] where the language model is usedto constrain the search for the optimal state sequence but is not used in the computation of theconfidence estimates.
17Collection frequency alone should be sufficient to assign low scores to stop words.

CHAPTER 4. BASELINE VOICEMAIL SUMMARISATION SYSTEM 54
0
5
10
15
20
25
30
35
20 21 22 23 24 25 26 27 28 29 30
compression rate
freq
uenc
y
Figure 4.3: The frequency of compression rates used by 16 human annotators to summarise 5random messages within a range of 20-30%.
Collection frequencyCollection frequency18 is inspired from IR (see e.g. [Robertson and Sparck Jones, 1997]) and isbased on the fact that words which occur only in a few messages are often more likely to berelevant to the topic of that message than ones that occur often in the entire corpus. For a term withe collection frequency is defined as:
CFWwi log Nnwi
(4.2)
where N is the number of messages in the training data and nwi is the number of messages thatword wi occurs in. The CFWwi weights are then normalised to the number of messages.
Named entity matchingNamed entity lists were employed in order to prioritise words that may be classified as propernames, or as certain other classes such as organisation names, dates, times and monetary ex-pressions. This is less straightforward than identifying NE in written text, since speech recog-nition output is missing features that may be exploited by “hard-wired” grammar rules orby attachment to vocabulary items, such as punctuation, capitalisation and numeric charac-ters. Our NE lists contain 3 400 entries, 2 800 of which derived from the Hub-4 BN cor-pus [Stevenson and Gaizauskas, 2000] whereas the remaining were classified manually from theVmail15 transcriptions.19 This allowed us to retain information such as telephone numbers orproper names in the summaries.
Text compactionBy replacing words with abbreviations, we can compact the text without losing information. Thisis based on the fact that users of SMS are familiar with text messaging abbreviations. As anexample the phrase “SPEAK TO YOU LATER” can be replaced with “spk 2 u l8r”.20 In our system
18Collection frequency is also known in the IR literature as inverse document frequency.19M. Stevenson is acknowledged for providing their BN corpus derived NE lists.20We use lower case letters to indicate such abbreviations.

CHAPTER 4. BASELINE VOICEMAIL SUMMARISATION SYSTEM 55
Read new message id
Calculate the collectionfrequency of eachrecognised word
Check if recognisedword in the NE lists
End ofmessage?
Assign score to eachrecognised word
HELLO THIS IS MIKEI'AM CALLING TO SEEIF WE CAN ARRANGEA MEETING TODAYAT FIVE P.M AT ...
MIKE PersonSHEFFIELD LocationNIGHT TimeJUNE Date....
recognizer'soutput
Read confidence scoreRead recognised words
Yes
No
text training data Named Entities file
Process
UserInput
Decision
Data file
linearcombination
Index
Figure 4.4: A schematic outline of the mechanism that assigns scores to each recognised wordreflecting empirical observations regarding a combination of statistics and prior knowledge. Eachterm in the recogniser output is assigned a score based on a acoustic confidence measure, collec-tion frequency weight and membership of predefined NE lists.
we have been using a set of approximately 40 such abbreviations that offer a reduction of morethan 10% in the message length. We also replaced words describing numbers with the respectivedigits, e.g. the word “THREE” was replaced by “3” in the summaries offering a further reductionin length and increasing message readability.
The closest analogy to the simple term subtraction techniques described is the workby [Grefenstette, 1998] where telegraphic representations of every sentence in a document arecreated by deleting elements of a sentence determined to be relatively unimportant on the basisof a shallow syntactic analysis. These telegraphic representations are motivated by user interfaceconsiderations: text reduction enables a visually impaired reader to skim a document being readaloud. The analysis comprises four levels according to the target compression rate: a) retain onlysubjects, head verbs, and object nouns, preposition and dependent noun heads, no sub-clausesb) retain only subjects, head verbs, and object nouns, no sub-clauses c) retain only subjects andobject nouns, no sub-clauses, and d) retain only proper names, no sub-clauses.
More recently, a collection of text compaction strategies was proposed by[Corston-Oliver, 2001]. These include character removal, inter-word space removal andlinguistic text compaction and are tested in reducing the amount of space required to display anemail message, enabling a user to view it on the small display of a mobile device such as a mobilephone or a pager. It is claimed that users are very successful at deciphering the compacted text.
Feature weightingFeature weighting can be viewed as a generalisation of feature selection (Chapter 6). In featureselection, feature weights are restricted to 0 and 1, i.e. a feature is used or not. Feature weight-ing allows finer differentiation between features by assigning each continuous valued weight. Ingeneral, feature weighting algorithms do not reduce dimensionality of a data set. Unless featureswith very low weight are removed from the data initially, it is assumed that each feature is useful

CHAPTER 4. BASELINE VOICEMAIL SUMMARISATION SYSTEM 56
Convert messageinto WML
Calculate currentmessage length
BEFORE b4GREAT gr8LATER l8rSEE cYOU u
...
YesNoAll
abbreviationsreplaced?
No
Yes
Replace wordswith their
abbreviations
Remove word withlowest score
Requiredlength?
abbreviations list
Figure 4.5: A schematic outline of the mechanism that removes the words with the lowest scoretill the message length restrictions are met. A list of common abbreviations is also used to compactthe text without losing information.
for induction; each degree of usefulness is reflected in the magnitude of its weight.21
The scores of three different knowledge sources were combined to remove non-target wordsfrom the message transcriptions. Since the scores are assumed to be probabilities of independentevents one should be able to simply multiply them. However, these scores are computed by com-ponents which have been trained independently and in a sub-optimal way. Since the independenceassumption is only partially true, we used heuristic weights to normalise the scores when they arecombined. A good combination of weights proved to be 1.0, 0.5 and 0.7 for acoustic confidence,collection frequency and NE matching, respectively. The results we report in this section arean indication of how summaries can be produced using elimination to shrink automatically pro-duced transcriptions. The lack of a systematic framework to maximise the quality of summariesproduced using feature weighting become evident.
Preliminary evaluation using MOSSummaries are inherently hard to evaluate because the quality of a summary depends both onthe use for which it is intended and on a number of other human factors, such as how readablean individual finds a summary or what information an individual thinks should be included in asummary. In order to evaluate how the summaries reflect the information content of the originalmessages of the voicemail task, we asked human subjects to evaluate summaries using a MOSrating, i.e. 1=Poor,5=Excellent (Section 2.6.1). A sample of the web-based MOS evaluation isdepicted in Figure 4.6. The summaries were judged by 14 subjects who compared them with thehuman transcriptions of the messages in terms of information completeness.
Figure 4.7 shows the average summaries score of the 10 longest messages of the test42 set(messages 2, 7, 9, 14, 20, 26, 33, 34, 35, 36) for three compression rates (60%, 40% and 20%).22
21Using continuous weights for features involves searching a much larger space and involves a greater chance forover-fitting [Kohavi et al., 1997].
22For this experiment, compression rate is defined as the ratio of summary length to source length in charactersincluding spaces between words. Although, this is appropriate for SMS, to avoid any bias and to be consistent with the

CHAPTER 4. BASELINE VOICEMAIL SUMMARISATION SYSTEM 57
Some low scores could be explained by the fact that five of the subjects were not familiar withSMS abbreviations used in the summaries. The average MOS scores given by the evaluators tothese initial message summaries were 3.14 and 2.56 for a compression rate of 40% and 20%,respectively. From these initial experiments is shown that the statistical model in combination
Figure 4.6: Sample of the MOS evaluation (message 7 of test42). The human transcription isshown on the left while three summaries with compression rates 60%, 40% and 20% are shownon the right.
with prior knowledge sources can produce summaries of some use. In the subsequent chapters,we will investigate how other types of features, namely prosodic, can be used to improve thesummarisation component.
4.3 System integration and performance evaluationIn order to examine the validity of H2 hypothesis we constructed a demonstrator that allows auto-matically produced summaries to be transformed into a format suitable for submission over SMSand we estimated the time required to create and transmit the summaries. Our experimental setupuses connection-less sessions based on the simplest submission service, which comprises of thedatagram layer, the session layer, the Push OTA layer and finally the application layer that con-tains the actual summary. After a voicemail summary has been produced, it is fitted into a wirelessmark-up language (WML) template designed particularly for this service. The template allowsspecific types of information such as caller’s number or name and time of call to be displayed ina more formalised way. The WML page is then forwarded to a mechanism that encapsulates itwithin the appropriate protocol headers. The page is then sent to a WAP PPG, which handles thecompaction of the page as well as the communication with the SMS gateway. For the delivery ofthe push content to the WAP PPG the PAP is used. PAP runs over TCP/IP and it carries infor-mation to the WAP PPG when the messages should be sent, through which network bearer, and a
summarisation literature in the rest of the thesis the compression rate will be calculated in words.

CHAPTER 4. BASELINE VOICEMAIL SUMMARISATION SYSTEM 58
Summaries Evaluation Survey
0
1
2
3
4
5
vm1d
ev02
vm1d
ev07
vm1d
ev09
vm1d
ev14
vm1d
ev20
vm1d
ev26
vm1d
ev33
vm1d
ev34
vm1d
ev35
vm1d
ev36
message id
aver
age
scor
e
40% compression 20% compression
Figure 4.7: MOS results on how well each summary retains the information contained in theoriginal transcriptions of the 10 longest messages of the test42.
number of other options that can be found in the PAP specification [wap, 1999a].
Figure 4.8: Summary retrieval of message vm1dev26 on the display of a WAP phone. An optionalconnection to the voicemail system in order to listen to the particular message is provided by theWTA.
The Nokia WAP Toolkit23 1.3 beta was used in order to compile the WML code. Its emulatoroffers a real-time depiction of the content on a WAP enabled handset and Figure 4.8 shows thesummary of message 26 of test42 on such a display. In case a text summary suffers from coherencedegradation, readability deterioration and topical under-representation, a link that allows a directconnection to the voicemail system is offered to the user in order to listen to the particular message.Some users might also prefer not to rely entirely on a text summary, but instead been able to accessthe intonational information contained in the original recording. This functionality is specifiedby the WTA [wap, 1999c] and save users from typing numbers and passwords while accessingtelephony services. The characteristic of the WAP service enabler offers the ability to create anenhanced user experience and adds value to the underlying SMS bearer.
23Available from Nokia Wireless Data Forum, http://www.forum.nokia.com

CHAPTER 4. BASELINE VOICEMAIL SUMMARISATION SYSTEM 59
Human transcribed messageHI MARY IT'S MARY ANN SHAW I JUST HAVE A QUICK QUESTIONFOR YOU THE DEFENSIVE DRIVING COURSE THAT IS TOMORROWAND THURSDAY CAN YOU LET ME KNOW IF THAT'S IN THEHAWTHORNE ONE OR HAWTHORNE TWO JUST WANTED TO MAKESURE I'M NOT SURE THE WAY THEY YOU KNOW SET UP THEIRROOMS SO IF YOU COULD GIVE ME A CALL I'M ON TIELINE EIGHTTWO SIX SIXTEEN OH TWO BYE
Automatically transcribed messageHI GARY IT'S MARY INITIAL I SHOULD HAVE A QUICK QUESTIONFOR YOU DID DEFENSIVE DRIVING COURSE IT IS TOMORROW ANDTHURSDAY YOU LET ME KNOW THANKS IN THE HAWTHORNEWONDERFUL POINT TWO JUST WANTED TO MAKE SURE MUCHSURE THE WAY YOU KNOW SET UP THERE SO IF YOU COULD GIVEME A CALL ON TIELINE EIGHT TWO SIX SIXTEEN OH TWO BYE
Automatically summarized messageMARY I A QUICK QUESTION 4 u DRIVING COURSE IT IS 2moro ANDTHURSDAY u LET ME KNOW IN 2 WANTED 2 MAKE SURE SURE THEWAY u KNOW SET THERE SO u GIVE ME A CALL ON TIELINE 8 2 6 16 0 2BYE
Summarized message in WML format<?xml version="1.0"?><!DOCTYPE wml PUBLIC "-//WAPFORUM//DTD WML 1.1//EN""http://www.wapforum.org/DTD/wml_1.1.xml"><wml><card id="MainCard" title="Voicemail Notification"><p> <b>Caller:</b> 07979123456 <br/><b>Date and Time:</b> Fri 14 Apr 2000 - 14:56</p><p align="center"> <b>Message</b><br/>MARY I A QUICK QUESTION 4 u DRIVING COURSE IT IS 2moro ANDTHURSDAY u LET ME KNOW IN 2 WANTED 2 MAKE SURE SURE THEWAY u KNOW SET THERE SO u GIVE ME A CALL ON TIELINE 8 2 6 160 2 BYE<a href="wtai://wp/mc;01141234567,4557">Listen to message</a></p></card></wml>
Table 4.8: Human transcription, automatic transcription, summary and WML template of thevm1dev26 spoken message.
4.4 Message submission experimentsThe testbed used to estimate the text summaries submission delays is described in Figure 4.9.It consists of two PCs, each connected to a V.DOT. The latter are self-contained GSM phoneswith voice, data, fax and SMS capabilities controlled by standard and extended AT commandsfrom the RS232 serial port. Expressway 2.0 of Dialogue Communications was used on bothcomputers as SMS gateway software. The WBXML encoding as well as the software to embedthe summary text to the WML template was especially written for the purposes of this application.The headers of the protocols have been hard-coded because at the time of writing there were noWAP phones on the market supporting push capabilities, as this feature was specified in the WAP1.2 specifications [wap, 1999b].
In order to calculate the delay of the voicemail summary delivery, two types of measurementshave been performed; the time needed for the V.DOT device to send a SM and the time neededfor the SM to be received by the mobile client.24 SMs can be transmitted over the mobile phone’sair interface using the signalling channels so there is no delay for call setup. SMs are stored byan entity called SMSC and sent to the recipient when the subscriber connects to the network. Theaverage delay time for a successful delivery of a pair of SMs is given by the following:
Dservice 2 Tsetup Tsubmission (4.3)
where T represents the corresponding time. This is because our testbed puts the SMs in a queue,24H. Ladas is acknowledged for setting up the gateway and performing the message submissions related to this
experiment.
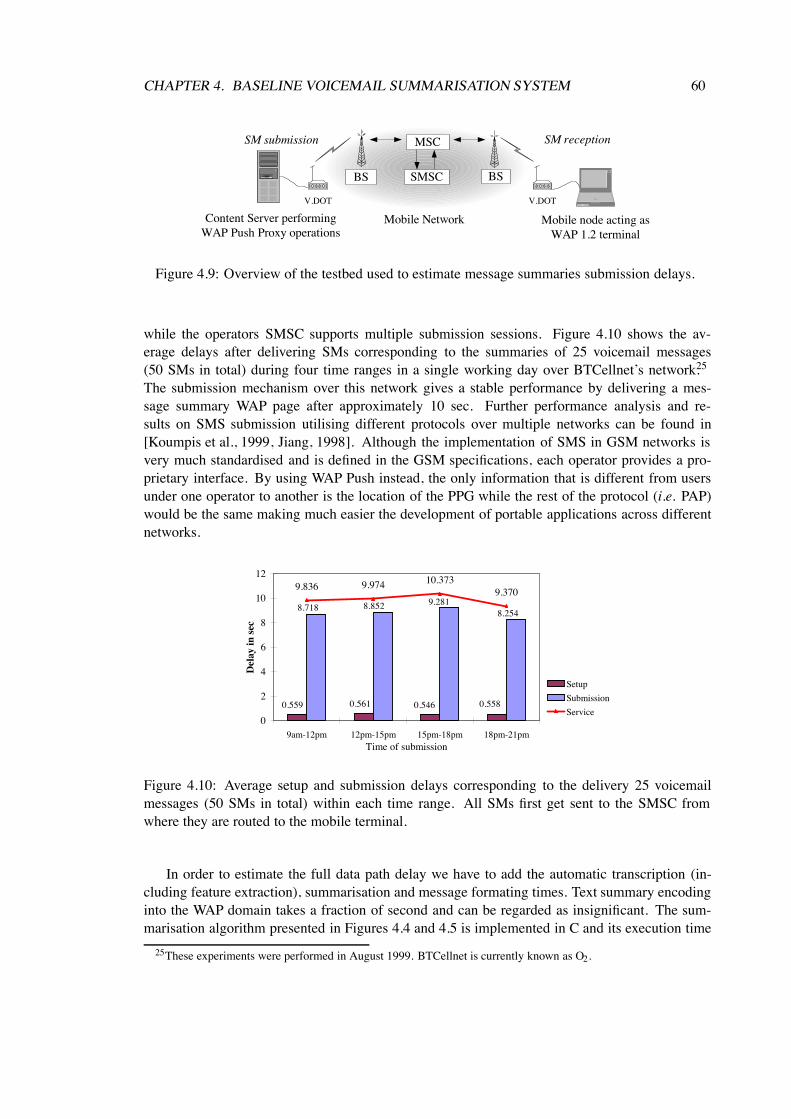
CHAPTER 4. BASELINE VOICEMAIL SUMMARISATION SYSTEM 60
Content Server performingWAP Push Proxy operations
Mobile node acting asWAP 1.2 terminal
V.DOT
SM submission SM reception
V.DOT
MSC
SMSCBS BS
Mobile Network
Figure 4.9: Overview of the testbed used to estimate message summaries submission delays.
while the operators SMSC supports multiple submission sessions. Figure 4.10 shows the av-erage delays after delivering SMs corresponding to the summaries of 25 voicemail messages(50 SMs in total) during four time ranges in a single working day over BTCellnet’s network.25
The submission mechanism over this network gives a stable performance by delivering a mes-sage summary WAP page after approximately 10 sec. Further performance analysis and re-sults on SMS submission utilising different protocols over multiple networks can be found in[Koumpis et al., 1999, Jiang, 1998]. Although the implementation of SMS in GSM networks isvery much standardised and is defined in the GSM specifications, each operator provides a pro-prietary interface. By using WAP Push instead, the only information that is different from usersunder one operator to another is the location of the PPG while the rest of the protocol (i.e. PAP)would be the same making much easier the development of portable applications across differentnetworks.
Setup SubmissionService9am-12pm 0.559 8.718 9.83612pm-15pm 0.561 8.852 9.97415pm-18pm 0.546 9.281 10.37318pm-21pm 0.558 8.254 9.370
0.5580.5460.5610.559
9.2818.8528.718 8.254
9.836 9.974 10.3739.370
0
2
4
6
8
10
12
9am-12pm 12pm-15pm 15pm-18pm 18pm-21pmTime of submission
Del
ayin
sec
SetupSubmissionService
Figure 4.10: Average setup and submission delays corresponding to the delivery 25 voicemailmessages (50 SMs in total) within each time range. All SMs first get sent to the SMSC fromwhere they are routed to the mobile terminal.
In order to estimate the full data path delay we have to add the automatic transcription (in-cluding feature extraction), summarisation and message formating times. Text summary encodinginto the WAP domain takes a fraction of second and can be regarded as insignificant. The sum-marisation algorithm presented in Figures 4.4 and 4.5 is implemented in C and its execution time
25These experiments were performed in August 1999. BTCellnet is currently known as O2.

CHAPTER 4. BASELINE VOICEMAIL SUMMARISATION SYSTEM 61
depends mainly on the length of the NE lists. For the NE lists described herein the summary ofa transcribed message is produced within 3-4 sec. The latter delay can be reduced by using moreefficient indexing techniques such as hash tables. The trigram probabilities used for the languagemodelling are usually pre-computed before the recognition run. Computing the transition scorethen corresponds to one or two table lookups and this is not an expensive operation. On a PII PCwith 512MB of RAM, fast and memory efficient CHRONOS decoder [Robinson et al., 2000] givesa 1 3 real-time recognition. Consequently, a typical spoken message contained in the VoicemailI corpus with duration of 31 sec can be delivered on a WAP compatible terminal as a text sum-mary within approximately 54 sec. The above figures are provided only to indicate that significantdelay savings are possible. Further investigation into feature extraction methods, NE lists length,configuration of the mobile network and traffic load are likely to affect the above figures, howeverthe H2 hypothesis, regarding the suitability of SMS, is valid.
4.5 Concluding discussionWe have proved the concept of automatic voicemail summarisation for mobile messaging. Theconstruction of a baseline system that transcribes and summarises voicemail messages containedin the Voicemail corpus was outlined. The results on the transcription task validated our H1hypothesis by demonstrating that competitive performance can be achieved using a fraction ofparameters than those required by CD systems based on mixtures of Gaussian likelihoods. Webenefited from bandlimited acoustic data and the NE lists derived from the Hub-4 BN corpus.The combination of acoustic probabilities of different systems in the log domain proved to be asimple and effective method to reduce transcription errors. That was particularly true in the caseof MSG features which provided significant gains as part of a combination with the PLP baseline.We also noticed some improvements by augmenting the textual data used to train the languagemodels with task specific compound words and similar utterances from BN and Switchboard cor-pora. This suggests that for a compact system multi-style language is an effective method. Thesummarisation mechanism that we have presented has a simple and explicit link to the models. Itmakes use of knowledge sources derived from corpora and removes the least informative wordswhen length restrictions apply. Given the relatively high WER rate the automatically producedsummaries retained content words, however MOS dropped with higher compression rates. A se-ries of message submission experiments supported our H2 hypothesis related to the suitability ofSMS as a bearer to deliver text summaries. Furthermore, the WAP push system can offer imme-diate and easy access to recorded messages through seamless sign on. Up to now our models wehave limited the information used to construct summaries on lexical matching and acoustic confi-dence. However, a spoken message is richer than its text transcription. The prosodic manifestationof a message – its duration, pitch and energy – can disambiguate a text transcription as well asadding new information.

5. Aspects of speech prosody
Prosodic phenomena are both wide-ranging and pervasive in speech. Both speakers and listenersuse prosody to disambiguate similar words, to group words into meaningful phrases, and to high-light words or phrases. This chapter presents some definitions of prosodic phenomena through abasic taxonomy. We then give an overview of the main theoretical and experimental developmentsof research in prosody from the view point of practical speech applications. Computational modelsof prosody can be useful in automatic speech summarisation. For example, a prominent word maymean that the word is new or important information, or that it replaces something previously saidin error. Furthermore, prosody is a complementary information source to help the summarisationcomponent recover from errors and ambiguities.
5.1 DefinitionsThis section discusses the terminology used to describe the prosodic phenomena with which thethesis is concerned. There is no standardised technical terminology for prosody. The literature ingeneral is diverse, coming from fields such as speech pathology, speech production, pragmatics,conversation analysis, discourse analysis, computational linguistics, artificial intelligence as wellas psycholinguistics.1 As a result of the variety of approaches, many different terms are foundin the literature to describe what are often the same phenomena [Werner and Keller, 1994]. Inaddition, many different systems of categorisation mean that different divisions are made in thephenomena according to the research orientation of specific studies. This section will describesome approaches and then explain the selection of terms used in this study and define their role indata description.
Prosody is the term used to describe collectively the aspects of speech-related information1Although there are cultural differences, there is considerable overlap in the motivations and objectives of the several
communities working in prosody and opportunities for mutual support.
62

CHAPTER 5. ASPECTS OF SPEECH PROSODY 63
that lie above the level of phoneme or syllable segments. Consequently, prosodic phenomena areoften called suprasegmentals2 . Prosody refers to the ways in which the individual sounds whichmake up words are modified under the influence of contextual, rhythmic, informational, syntactic,semantic and pragmatic factors to produce a coherent utterance. Additionally, the structure andprominence patterns of prosodic features often provide the link between acoustic realisation andlinguistic interpretation of a word, giving clues as to how to parse an utterance, which elementis in focus, whether a point is in question, and whether there has been a chance in topic. Otheruses of prosody – although beyond the scope of this thesis – include paralinguistic phenomenareferring to aspects of vocal or bodily expression that convey meaning, but in a less structured orsystematic way than properties of speech itself. The main paralinguistic phenomena are: a) tonesof voice, such as the nasal, breathy, and creaky vocal effects used to convey everyday emotionsor to express social, psychological, or occupational states, e.g. the flat tones of a person sufferingfrom depression b) aspects of body language, such as gestures and facial expressions.3
In this thesis we are interested in prosodic features related to the acoustic realisation level andcan be quantified using acoustic signal analysis, rather than the whole set of possible features. Assuch they can be split into two categories:
basic include pitch, loudness, duration, speaking rate and pause.
compound include intonation, stress/accentuation, rhythm and voice quality.
5.1.1 Basic prosodic featuresEach of the basic features has an acoustic correlate. The acoustic correlates of prosody are amongthe cues least affected by noise, so it is likely that human listeners use prosody as a redundant cueto help them correctly recognise speech in noisy environments [Lindfield et al., 1999]. Pitch andloudness have a direct acoustic correlate which can be obtained by signal processing algorithms.The same can be true for duration and speaking rate, which can be estimated from the modulationspectrum of the acoustic signal. Pauses (especially filled pauses) require some sort of model, e.g.an ASR system, to identify them.
PitchThe acoustic correlate of pitch is fundamental frequency (F0). F0 of speech is defined as the timebetween two successive glottis closures. The periodic closing and opening of the glottis producesthe voiced signal, which is rich in harmonic frequencies. F0 is a function of vocal cord vibration,while a formant is a function of a vocal tract configuration, which boosts some frequencies anddampends others. The psychoacoustic scales of pitch are linear only at relatively low frequencies.However, it is assumed that there is a linear correlation between pitch and F0 at the low ranges offrequency that are relevant to the voicing of male and female speech (approximately 50-250 Hzand 120-400 Hz, respectively).
The assigmment of pitch to words is known as pitch accent. Pitches may be assigned to phrasesand their boundaries. The variation of pitch across male and female speakers is due to physiolog-ical differences. In addition to physiological and cultural-gender differences, some people haveand use a much wider range than others. Throughout discourse structure, pitch range expands andcontrasts, raises and depresses. When speakers begin a new topic, their pitch range expands orconstasts. Conversely, when speakers are drawing to the end of an intonational phrase, their pitch
2This is basically due to the title of a classical study on prosody by [Lehiste, 1970].3Evidence from speech pathology shows that linguistic and paralinguistic prosody seem to be processed in different
hemispheres of the brain; e.g. [Fromkin, 1987].

CHAPTER 5. ASPECTS OF SPEECH PROSODY 64
range compresses. There are two representational methods of accounting for this event: the decli-nation model which accounts for the lowering in a continuous linear fashion [Cohen et al., 1982]or a categorical model which demonstrates in a step-wise manner the tendency for pitch accenttargets to diminish proportionally across speakers [Bruce, 1977, Pierrehumbert, 1980].
As discussed is Section 3.1.1, many speech feature analysis techniques such as LPC analysisand cepstral techniques, deliberately ignore F0, because the speech message results mainly fromthe vocal tract filter rather than from the excitation source. However, F0 has been very popularparameter in prosodic analysis because: a) it is single-dimensional and thus facilitating statisticalanalysis of data b) F0 data can be obtained and analysed in immense quantity, and c) it can benaturalistically manipulated to construct stimuli for perception experiments. [Bruce, 1977] wasone of the first to take advantage of the above.
Several F0 calculation algorithms have been proposed, e.g. [Rabiner et al., 1976,Gold and Morgan, 1999, Cheveigne and Kawahara, 2001]. Typically a number of spectral anal-ysis or inverse filtering techniques are used to locate the frequency of primary excitation energy.There are several obstacles in estimating F0 accurately: maintaining adequate frequency resolu-tion, removing the effects of vocal tract resonances, and avoiding frequency doubling or halvingdue to harmonic content. F0 estimates of lower quality are also obtained when the algorithmsare applied on telephone speech, due to signal degradation caused by the noisy and bandlimitedtelephone channel. In addition to the F0 computing, part of pitch determination process is to deter-mine which parts of the utterance are voiced and which are unvoiced. This is usually accomplishedby applying constraints to the autocorrelation function of the low-pass filtered speech waveform,which indicate that no voicing is present. Extensive smoothing operations such as median filterscan be applied to enforce a degree of continuity in the final pitch contour.
LoudnessLoudness is a measure of the perceived amplitude of sound. It is directly related to the energyenvelope of the speech signal. It may be calculated on a frame-by-frame basis and the mappingbetween them depends on the sensitivity of the human auditory system to different frequencies.Furthermore, the auditory system does some energy normalisation, but it is not clear how thisnormalisation is performed during speech perception.
Duration and speaking rateSpeaking rate depends primarily on the speaker style and the nature of communication. How-ever, it has also been reported that cognitive load tends to affect the variance of the long-termspeech rate [O’Shaughnesy, 1995]. There have been many attempts to find a consistent measurefor quantifying speaking rate but there is no consensus for a common accepted measure. Anacoustic correlate of the speaking rate can be defined as the average of the phoneme durationscorresponding to a certain segmental unit such as a phoneme. Each phoneme has its own intrinsicmean and standard deviation of duration [Beckman, 1986]. When examined in context, relativeto the average duration of the phoneme, it may help convey stress. Words that are repeated bya speaker tend to have reduced durations compared to the initial instance of the word. Usingbroadcast monologues and interviews, [Fowler and Housum, 1987] showed that the later token ofa repeated word, which referred to given information, tended to be shorter and less intelligiblethan the previous, which introduced new information. [Campbell, 2000] argued that a measure ofsegment’s lengthening is more useful information than a measure of its duration.

CHAPTER 5. ASPECTS OF SPEECH PROSODY 65
PausePauses may be expressed by vocalisation, such as “um” or “uh”, or by silence. The first arecalled filled pauses while the second are called unfilled pauses. The actual size of these units isunspecified in both definitions as pause lengths are probably a matter of personal speaking styleand are therefore likely to vary from speaker to speaker. Pause duration is often a cue to thestrength of a phrase boundary, and more so for read speech. [Ayers, 1994], among others, foundlong pauses at the boundaries between segments of read speech, but found no clear pattern ofpause duration in spontaneous speech. However, when the durations of filled pauses are takeninto account for spontaneous speech, there is evidence that pause duration reflects topic structure.
Pauses are also distinguished by their location in the structure of a phrase or utterance. Typ-ically, pauses reflect the speaker’s uncertainty in formulating utterances marking a conflict be-tween speech planning and speech production. Pauses in general are far more frequent in sponta-neous than read speech as a result of constructing the content and form of utterances in real-time.[Maclay and Osgood, 1959] have suggested that filled pauses are usually used for syntactic plan-ning, while unfilled pauses usually precede lexical search.
5.1.2 Compound prosodic featuresWhile basic features are physical properties of sound, compound features are subjective onesreferring to perceived phenomena. For compound features there is no unique correspondence withthe basic prosodic features [Hart et al., ]. Instead, any relations are complex and multi-parametric.
IntonationIntonation is defined as the melodic feature of an utterance and can be decomposed into threecomponents linked to: the syntax of an utterance (such as interrogative, declarative), the attitudesof the speaker (what the speaker wants to explicitly show to the listener: e.g. politeness, irony) andfinally the emotions (involuntary aspects of the speaker’s speech) [Scherer et al., 1984]. The thirdfeature is differentiated mainly by the pitch contour (the global envelope of the pitch), loudness,speaking rate and pause. For example, variations in intonation can convey very different mean-ings for the same sequence of words: ”next Monday” with a rising F0 contour generally impliesa question, while the same phrase with a falling F0 contour are usually associated with a state-ment [Ladd, 1996]. The intonational phrase can be distinguished by the presence of an endingtone that signals its closure and by a duration of silence that follows the utterance. The endingtone, or boundary tone, forms a tonal tail on the utterance that is high, equal, or low relative to theutterance. An intonational phrase does not imply any degree of well-formedness. For example,the presence of silence should be sufficient reason to mark the end of an intonational phrase if aperson stops speaking suddenly during an utterance and starts again on a different subject.
Stress/accentuationThe acoustic correlates of stress are pitch, duration and loudness, through a complex relationship.Stress and accent both refer to basically the same phenomenon i.e. emphasis or, more generally,prominence. In the literature, however, hardly ever they are used as synonyms. Very often, wordprominence is referred to as word stress, while accentuation is referred to the phrase or utterancelevel. However, in both cases it is always single syllables that bear the stress. For example,in the utterance ‘I don’t have a green car but I have a red one’, stress would be put on the words‘green’ and ‘red’. An accent selects out a particular word over other words, revealing the speaker’scommunication intention to contrast and compare, or to focus attention over an entire phrase. Anyword, irrespective of syntactical class, can bear an accent, depending on the speaker’s intention.

CHAPTER 5. ASPECTS OF SPEECH PROSODY 66
[Silipo and Greenberg, 1999] using data from the Switchboard corpus argued that amplitudeand duration are the most important acoustic parameters underlying the patterning of prosodicstress in casually spoken American English, and that F0 plays a minor role in the assignmentof stress. Using both heuristic-model and decision-tree analysis, [Silipo and Greenberg, 2000]re-examined this conclusion using both the range and average level of F0 in order to ascertainwhether there may be circumstances in which F0 figures importantly in prosodic stress. Althoughtheir more recent results indicated that F0-range is slightly more effective than average F0 level,this finding is most likely a consequence of duration-related information intrinsic to F0-range.This in consistent with the conclusions of [van Kuijk and Boves, 1999] for a comparable corpusof spoken Dutch.
[Lea, 1980] has shown that there is a relationship between word class and stress. Contentwords i.e. those carrying an independent semantic meaning (e.g. nouns, verbs, adjectives) aremore likely to contain stress syllables than function words (e.g. articles, conjunctions, suffixes)which have little intrinsic meaning but are essential to the syntax. Although this dichotomy is notcategorical it has been validated experimentally by [Silipo and Crestani, 2000].
RhythmRhythm is mainly related to variations in speed of speech production, i.e. syllabic timing.Rhythm is the product of interaction between a number of basic prosodic features, includingloudness and duration of phonemes and duration of pauses. Theories of linguistic rhythm, e.g.[Liberman and Prince, 1977], generally agree that the perceived rhythm of an utterance reflectsthe combined influence of two components: a) a grouping component which indicates the hier-archical organisation of phonological units, from phonemes at the lowest level to syllables, andphrases at the highest level; and b) a metrical component which describes the temporal pattern ofstressed and unstressed syllables. Hence, rhythm gives rise to different perceptual impressions,depending on the length of the stretch of speech that is modified.
In the context of automatic speech processing, it is important to note that neither local orglobal rate modifications are entirely linear. That means that is hard to produce natural-soundingspeech by accelerating or decelerating normal speech by a fixed rate. This might involve methodsof normalising the differences in time required to produce certain phonemes as opposed to othersor applying other non-linearly rhythmic changes. A theory for rhythmic patterns for spontaneousspeech has been introduced by [Umeda and Wedmore, 1994]. Using English speech material theyidentified a hierarchy of rhythmic patterns including the repetition of amplitude-accents in addi-tion to pitch accents at regular time intervals. For rhythmic reasons, also a word which is notsemantically important might carry an accent.
Voice qualityVoice quality is defined as the characteristic auditory colouring of an individual’s voice, derivedfrom a variety of laryngeal and supralaryngeal features and running continuously through theindividual’s speech [Trask, 1996]. The natural and distinctive tone of speech sounds produced bya particular person yields a particular voice. Distinctive characteristics of a person’s speech such abreathiness or creekiness are aspects of voice quality. Speakers do, however, introduce variationsin voice quality for particular purposes. For example: speaking in a soft voice to indicate sympathyor a harsh voice to show anger.
The relationship between a particular voice quality and any acoustic measurement is multi-dimensional, complex and not well understood. Typically, objective measurements of voice

CHAPTER 5. ASPECTS OF SPEECH PROSODY 67
quality involve a lot of measurements with different methods and techniques. One such tech-nique, called electroglottography, works by registering laryngeal behaviour indirectly by a mea-suring the change in electrical impedance across the throat during speaking. Experimental evi-dence [Marasek, 1997] supports the hypothesis that voice quality (even pathological) can be dis-tinguished using electroglottographic waveforms. The shape and timing of the single periods ofthe glottal waveform differ not only between different utterances produced by the same speaker,but also between speakers and between groups of speakers. In that experiment the differencesbetween groups of speakers were not only properly identified, but also the relative importance ofthe parameters was established.
5.1.3 Computational theories of prosodyThe main focus of existing computational theories of prosody is on stress and intonation, primar-ily as reflections of the lexical, syntactic and information structures. One such theory developedby Pierrehumbert and colleagues [Pierrehumbert, 1980, Beckman, 1986] has three main distin-guishing features. First, it assumes that a phrasal intonation is comprised of as string of tonesgenerated by a finite-state automaton. In general, this will consist of an optional boundary tone, aseries of pitch accents, a phrase accent, and an optional final boundary tone. The second featureof the theory is the decomposition of the text to be associated with the tune into some metricalrepresentation, indicating stressed and unstressed syllables. The third feature of the theory is thesystem of rules for associating tune with text. Thus, given some metrical representation of thetext and intonational string of tones, there is a mechanism which associates the two. [Ladd, 1996]made another distinction for intonation, between the contour interaction theories, which treat pitchaccents on words as local differences of a global contour for the phrase, and the tonal sequenceapproaches, which treat phrasal tune as compositional from a sequence of elements associatedwith the word.
Computational theories of prosody however have not yet progressed to a point where interest-ing generalisations can be made for an engineering approach to voicemail summarisation (Sec-tion 4.2.1). Hence, we shall use raw prosodic features without addressing any formal theory ofprosody in our modelling.
5.2 Differences among languages and speakersProsody plays a role in human communication in virtually every language. However, differencesin evolutionary development among languages have resulted in enormous variance in the waythat prosodic features are used. Although all languages contain prosodic information, particularlystress and intonation, some languages use prosody in opposite ways than others.
stress languages include most languages of Western European origin, such as English, German,French and Spanish. Prosody is generally used to convey syntactic information to speech,but stress and intonation (with some exceptions) do not denote word meaning and usagedirectly.
tone languages include a large number of Asian languages such as Mandarin Chinese, Viet-namese, and Thai, and some African languages. In these languages, phonemic informationalone is not sufficient to distinguish between words and phrases.4 Vocal pitch is an intrinsicpart of the lexical representation differentiating the meanings of words and phrases.
4For this reason in ASR systems for tone languages it is important to include an estimate of F0 in the front-end todiscriminate words.

CHAPTER 5. ASPECTS OF SPEECH PROSODY 68
[Grandour, 1978] conducted studies on tone and range perception and found that for speakersof tone languages direction and slope proved most important while for English speakers, averagepitch and extreme endpoints were the most important perceptual features. There are other lan-guages that have similarities to both stress and tone languages, such as Japanese, in which relativepitch differences between words alter their meanings, but individual syllables or monosyllabicwords are not distinguished by pitch when spoken in isolation.
Beyond these fundamental characteristics, there are also notable differences in the way differ-ent cultures use duration, pause, and rhythm to enhance communication, how emotional states areindicated and perceived, and how the concepts of melody/harmony and pitch interactions affectlanguage, singing and music. Even within the same language, regional differences and dialects,also dramatically affect the use of prosody. Individual differences based on gender, age, culturalbackground, and education all affect the usage of language.
5.3 Differences between read and spontaneous speechSpontaneous speech is produced without referring to a text, in contrast to read speech. The mostobvious difference between these two cases is the need for message planning. When reading atext aloud, the reader is more concerned with the form of the utterance, since the message is al-ready encoded in the text. One the other hand, in spontaneous speech the speaker has to create themessage. In natural speech, prosodic features are influenced by whether the utterance is generatedspontaneously or read aloud. Prosodic data from three American English corpus studies (labo-ratory speech from ATIS, Resource Management and Boston Directions Corpus) were discussedby [Hirschberg, 2000]. It was observed that the speaking rate was faster for read speech thanspontaneous speech. Further, the boundary F0 contour on declaratives yes-no questions and wh-questions was also seen to vary in different speaking styles. Declaratives in spontaneous speechare more often characterised by final rises than in read speech, while yes-no questions are moreoften characterised by a final falling intonation in spontaneous speech than in read speech.
Significant differences were also observed between the two speaking styles regarding certainabsolute measures of global parameters related to overall range and timing e.g. maximum and av-erage F0 for each intermediate phrase, speaking rate, and duration of a preceding pause. However,there did not appear to be any significant differences regarding other relative values associatedwith the amount of change in prosodic parameters between phrases, e.g. amount of F0 from aprevious phrase or in the choice of nuclear pitch accent of phrase final contour. This suggests thatalthough more global features such as overall range and timing may vary greatly over speakingstyles, the more local features are relatively constant.
5.3.1 DisfluenciesSpeech disfluencies constitute a phenomenon which seems to be limited to spontaneous speech.Their distribution is not random, and in fact may be a part of the communication itself. Disflu-encies tend to be less frequent in human computer interaction (HCI) than in human to humaninteractions. However, the reduction in occurrences of disfluencies may be due to the fact thatpeople are as yet not comfortable talking to computers. They may also be less frequent becausethere is more of an opportunity for the speaker to plan, and less of a potential for interruption. Aspeople become increasingly comfortable with HCI and concentrate more on their tasks than onmonitoring their speech, disfluencies can be expected to increase. Speech disfluencies are a chal-lenge to the integration of ASR and NLP systems since the evidence for disfluencies is distributedthroughout all linguistic levels, from phonetic to at least the syntactic and semantic levels.

CHAPTER 5. ASPECTS OF SPEECH PROSODY 69
Most work on disfluencies has looked at its prosodic and lexical characteristics, for exam-ple the PhD theses by [Shriberg, 1994, Lickley, 1994]. These approaches look for prosodicclues which indicate interruption points, or word patterns which help indicate how far the re-pairs extends backwards. Non-syntactic methods for detecting and removing disfluencies canbe clasified as: a) pre-recognition which study the speech signal to find clues to disfluencies[O’Shaughnessy, 1992, Nakatani and Hirschberg, 1994]. b) pre-parsing and post-recognition thatassume a perfect transcription, but detect disfluencies using word pattern-matching and part-of-speech information provided by a tagger, but without using a parser [Heeman and Allen, 1997].c) post-parsing that use word pattern-matching techniques to detect likely disfluencies. Syntac-tic and semantic parsing techniques are then used to discriminate actual disfluencies from falsepositives [Bear et al., 1992].
5.4 Prosody in speech technologyAlthough a great deal of work has been done on the computation of prosody and its relationshipto speech communication, only a few specialised areas within the speech processing field havebeen able to effectively integrate prosodic knowledge. [Cutler et al., 1997] reviewed the progresshas been made towards new conceptions of prosody’s role in speech processing, and found thatthis has involved abandonment of previously held deterministic views of the relationship betweenprosodic structure and other aspects of linguistic structure. The most wide-spread technologicalapplication of prosody is related to the development of speech synthesis systems. Other areas arealso being developed with the speech and language technology context, the mainstream of whichis presented below.
5.4.1 Speech synthesisSpeech synthesis is performed by selecting a string of elements and concatenating the pertinentacoustic waveforms; manipulations affect duration, intensity, and F0, and in some systems spec-tral smoothing is applied at concatenation points, e.g. [Sagisaka, 1990]. There are three primarymethods of synthesising speech:
articulatory synthesis produces a speech waveform by modelling the physiological characteris-tics of excitation of the human vocal tract;
formant synthesis models directly the acoustics of the speech waveform
concatenative synthesis uses pre-recorded segments of real speech to construct a new utterance.Concatenation is the conversion of a discrete sequence of linguistic or phonetic symbols onthe phonetic level into a continuous data stream on the parametric or acoustic level. In somesense concatenation is the inverse problem to segmentation.
For the manipulation of the characteristics of synthesised speech, articulatory synthesis offers themost natural built-in constraints, formant synthesis offers the most flexibility but concatenativesynthesis while producing the most natural sounding speech is the rather complex to implement.
Because concatenative synthesis employs digitised segments of recorded speech, it is in prin-ciple capable of reproducing all the fine variation of detail that is still too complex or too delicatefor the other methods to model. The output of a system with such a prosodic component is typ-ically a sequence of phonemes with each being characterised by a duration and a F0 value. Theduration of every phoneme is dependent on the phonetic context. The F0 value is influenced by

CHAPTER 5. ASPECTS OF SPEECH PROSODY 70
the lexical stress, the accented or focused element in a sentence and the intonational tune of theutterance, e.g. a final rise for questions. The main difficulty for concatenation is co-articulation.There are several different fundamental methods used for prosodic modifications in the synthe-sis field, including [Moulines and Charpentier, 1990, Black and Taylor, 1994, Dutoit et al., 1996].Each of these approaches provides a consistent foundation for implementing time-scale modifi-cation (altering a speaker’s speech rate without changing F0 and spectral characteristics) and F0modification (altering a speaker’s pitch without changing speech rate and spectral characteristics).By combining intonation modification, duration modification (via time-scale alteration), and am-plitude modification, the prosodic content of synthesised speech can be effectively controlled. Themore the prosody in a synthesis system is varied from the original recording, the more the wave-form is destorted from its original shape, and the more artifacts are introduced by the processing.Determining the proper prosodic pattern for a sentence is difficult, as real-world knowledge andsemantic information is needed to know which syllables to accent, and which tune to apply. How-ever, by increasing the size and variety of the segment inventory, this problem with concatenativesynthesis can be greatly reduced.
5.4.2 Speaker recognitionSpeaker recognition can be divided into speaker identification and speaker verification. Speakeridentification is the process of determining from which of the registered speakers a given ut-terance comes. On the other hand, speaker verification is the process of accepting or reject-ing the identity claim of a speaker. The use of prosody in speaker recognition is very limitedand it has been treated as a frame-level feature, in the same way that other front-end analy-sis techniques are used. Most prosody related work is based on modelling of pitch statistics,e.g. [Atal, 1972, Sonmez et al., 1998]. The same is the case for other areas such as gender identi-fication or language identification where speaker dependencies are helpful rather than harmful.
5.4.3 Automatic speech recognitionStudies to apply prosodic knowledge to ASR have a long tradition. One early example is Lea’sPhD dissertation in 1972, followed by a series of studies [Lea, 1980]. It was suggested at the timethat stressed syllables provide phonetic reliability in speech communication. Related experimentsthat have aimed at improving transcription accuracy were though largely unsuccessful. This canbe explained by the nature of prosodic information. As it does not give us more cues at the lexicalor sublexical level, so it will not increase the word level accuracy of a recogniser. Hence, theuse of prosodic features in ASR has been largely neglected in commercial and research systems.The most obvious reason is the difficulty of integrating suprasegmental information in mainstreamASR models such as HMMs, which are by definition segmental in nature. An efficient and statisti-cally sound combination of the two information sources is difficult to obtain. Another reason is thelack of large prosodically annotated speech databases for training and testing speech recognisers.Yet another reason why prosody is difficult to use in ASR is that many applications do not have todeal with long sentences, for which prosody is most useful to provide a segmentation of the inputand help dissambiguation. However, as more complex applications are under development the useof prosody is being reconsidered.
If prosodic information is to be used in ASR systems, prosodic transcriptions need to becreated automatically, defining the locations of prosodic features and determining their type.This can be seen as an extension of the ASR problem: we want to determine a symbolic se-quence corresponding to a time series signal. The HMM approach can be used to recognise ToBIstyle [Silverman et al., 1992] prosodic categories and models can be built for each boundary tone

CHAPTER 5. ASPECTS OF SPEECH PROSODY 71
or pitch accent and train them on annotated sequences using prosodic features such as F0 and rootmean square (RMS) energy as input. The inventory of tone categories is very small and so onlya small number of models would be needed. A similar approach could be used after training aclassifier to produce a tone category given F0/RMS data sequences as input. Unfortunately, theaccuracy of this approach is not good since there is a lot of ambiguity between the different kindsof tone and pitch accent.
At a pure ASR level the use of prosody has often been used in post-processing phases to rankrecognition hypotheses [Hirose, 1997, Taylor et al., 1998] and to reject or confirm recognitionhypotheses [Batliner et al., 1996, Bartkova and Jouvet, 1997]. For example, if some informationabout the location of phrase boundaries is available then alternate parses of a utterance may beconstrained. Some word choices may be more likely than others in stressed positions withinphrases. [Hirschberg et al., 1999] found that there exist statistically significant differences in themean values of certain prosodic features between correctly and incorrectly recognised user turnsin interaction with a particular spoken dialogue system; and these prosodic cues can be used toimprove accept/reject decisions on recognition outputs.
5.4.4 Boundary detectionProsodic cues are known to be relevant to discourse structure across languages [Vaissiere, 1983].The past decade has shown a substantial amount of research in the areas of detecting bound-aries. Phrase boundary detection can be used to resolve syntactic ambiguities or to improve theefficiency of syntactic analysis. A comparison between syntactic and prosodic phrasing in readspeech was presented by [Fach, 1999]. In this study, syntactic structures were generated by a pro-gram that recognises noun phrases in text and ToBI [Silverman et al., 1992] prosodic structures.The results showed that at least 65% of syntactic boundaries correspond to the prosodic ones. Inaddition, prosody can aid the segmentation of a long speech recording into topics and sentences,and help locate speech disfluencies for improved parsing. While earlier work tended to look atthese phenomena in isolation, more recent work attempted a more systematic study within a singleframework.
[Kompe et al., 1994] trained Gaussian and polynomial classifiers on a set of prosodic fea-tures computed from the speech signal using automatically generated boundary markers. Com-paring the classification results with the judgments of the listeners yielded in a recognition rateof 87%. A combination with stochastic language models improved the recognition rate to 90%.They found that the pause and the durational features were most important for the classifica-tion, with F0 having minor influence. [Heeman and Allen, 1997] proposed a similar model to thatof [Kompe et al., 1994] and achieved improvements in perplexity by exploiting silence durationswhich traditional word-based language models tend to ignore.
[Stifelman, 1995] compared the segmentation of an emphasis detection algorithmwith a hierarchical segmentation based on the theory of discourse structure proposedby [Grosz and Sidner, 1986]. Her results showed that the indices into the audio selected by theemphasis algorithm correspond to segment boundaries with high precision, but a low recall. Sincethe emphasis detection algorithm employed primarily considered pitch peaks, this correspondedto previous research hypotheses that new topic introductions (i.e. new segments) are associatedwith increases in pitch range. [Hirschberg and Nakatani, 1998] used prosodic features to predictwhether a given frame of speech belonged to an intonational phrase or to a break between phrases.This classification was driven by a regression tree model (Section 6.3.1) which took as observationvectors values for F0, RMS energy and autocorrelation peaks.
[Stolcke et al., 1998] detected utterance boundaries and a variety of speech disfluencies on a

CHAPTER 5. ASPECTS OF SPEECH PROSODY 72
large portion of the Switchboard corpus. In their approach regression tree models used to associatelexical and prosodic features. An explicit comparison was made between prosodic and word basedmodels, and the results showed that a n-gram model, enhanced with segmental information aboutturn boundaries, significantly outperformed the prosodic model. Model combination improved theoverall results only marginally. [Shriberg et al., 2000] followed on from this work reported resultson boundary detection on both Switchboard and BN corpora using a large number of prosodicfeatures. Analysis of the prosodic decision trees revealed that while pause features were heavilyused in both corpora, pitch was a highly informative feature in BN whereas duration dominated inSwitchboard.
[Gotoh and Renals, 2000b] were concerned with the detection of sentence boundaries in acollection of British English BN transcripts. They combined an n-gram language model withan alternative model estimated from pause duration information obtained from the ASR output.Their experimental results showed that the pause duration model alone outperformed the languagemodel. Further improvements were possible by combining these two information sources. It wasalso observed that the longer the pause duration, the greater the chance of a sentence boundaryexisting.
5.4.5 Detection of speech actsVarious theories of dialogue structure suggest that different kinds of utterances will be markedwith different prosodic structure. Without knowing the detailed structure it might be possibleto recognise the type of utterance from prosodic cues. This is the basis of a number of studieswhich seek to improve the performance of ASR in dialogue systems. [Taylor et al., 1998] usedknowledge of the utterance type to constrain the language model within dialogue system. Theirsystem used a constrained language model to make decoding more accurate and efficient if, forexample, the prosodic cues suggest that an utterance is a yes/no question. In some cases, therecogniser would tolerate misrecognitions without causing communication errors, i.e. when therecognised string was conceptually identical to the intended meaning of the user’s utterance (e.g.yeah vs. yes). The reasoning behind using utterance type specific language models was that certainword sequences are more likely to occur in utterances of a certain type. Their simulations showedthat if they were better at move detection they could improve WER even more. More recentwork by this group [Hastie et al., 2002] has looked at combining these low level cues with highlevel discourse information in analysing the structure of dialogues. They show that a hierarchicalanalysis of dialogue structure can improve dialogue act recognition. This is achieved by seekinga best overall hypothesis for what words have been spoken and what dialogue act they represent,in the light of both the dialogue history so far and the current speech signal. [Campbell, 2000]also used data from spontaneous dialogues to illustrate how vowel duration ratios can be used toidentify speech acts.
5.4.6 Speech understandingThere has been a considerable activity in prosody driven ASU in the last few years. Most ofthe studies are restricted in scope, and could be regarded more as feasibility studies that havedemonstrated the effectiveness of prosodic information. The role of prosody in reducing syntacticambiguity becomes increasingly important as language processing systems handle more syntacticconstructions and as ASR systems deal with increasing amounts of hypotheses as the vocabularysize increases. The impact of incorporating prosodic events on the overall system performancefor these applications is dependent on many issues. These include the underlying representationof prosodic events as well as the performance of an automatic system in recognising these events.

CHAPTER 5. ASPECTS OF SPEECH PROSODY 73
In reports from the Verbmobil project [Noth et al., 2000] it is claimed that they were the first toincorporate prosody in a complete ASU system. Analysis of phrasal breaks and accentuation isclaimed to bring down the processing time in the searches and to boost performance.
5.4.7 Speech summarisationThe use of prosody in speech summarisation has been very limited. The earliest re-ported related work concerned the generation of crude summaries based on acoustic empha-sis [Chen and Withgott, 1992]. They trained a HMM on hand labelled transcriptions by a panelof listeners of spontaneous speech to detect emphasis based on the pitch and energy contentof conversations. Their summaries on an unseen (but rather small) test set received a goodagreement with human annotators. DiaSumm (Section 3.2.2) was another speech summarisationsystem to use prosody but it restricted its use to the turn length and inter-turn pause features.[Yamashita and Inoue, 2002] proposed a system that extracts sentences from hand transcribedand segmented lecture speech using a linear combination of F0 and linguistic information. Amore systematic use of prosody for speech summarisation can be found in our previous worke.g. [Koumpis et al., 2001, Koumpis and Renals, 2001] where we compared the relative contribu-tion of lexical and prosodic types of features for voicemail summarisation.
5.5 Concluding discussionProsodic cues play an important role in human speech communication. At the lexical level, theyhelp define words and above it, they structure a message into smaller phrases and mark the focusof a phrase. Prosody also conveys extra-linguistic information such as gender, emotion and atti-tude of a speaker. Prosodic models can potentially be used in many aspects of a human-machinecommunication system, including speech synthesis, ASR, syntactic/semantic analysis, topic seg-mentation, dialogue act determination and dialogue control. As the diversity of the literatureshows, its integration is not a trivial task. A consistent prosodic framework is not available neitherfor a single, nor for the multi-lingual description of prosody. Prosody is very much speaker-dependent, even idiosyncratic (e.g. F0 range, speaking rate), and as such, the issue of normalisa-tion has problematic implication in speaker-independent systems. The same compound featurescan be expressed by different basic features or by different contours of the same feature. Differentcompound features also influence each other [Hart et al., ] and the same acoustic attributes, thatindicate much of the prosodic structure, are very common in aspects of spontaneous speech thatseem to be related more to the speech planning process than to the structure of the utterance. Theactual relationship depends on the context and on the speaker. In the subsequent chapters, weexamine which prosodic features are the most relevant for the task of voicemail summarisationand how these features interact with lexical ones. We avoid any assumptions as to the role of thefeatures, and leave it to machine learning approaches to find out the relevant features and optimalsets of them from collections of speech data.

6. Feature selection
In the task of voicemail summarisation although lexical features, such as NE matching and collec-tion frequency provide substantial information, there are many cases when a major cue can comefrom prosodic features such as duration or energy. One can identify many tens of potentially use-ful lexical and prosodic features for this classification task. However, the quality and selection ofthe features representing each class of words has a considerable bearing on the robustness of thesubsequent classification. In addition, we wish to reduce the dimensionality in order to make theclassification calculations quicker, to save storage space and to permit rapid feature extraction.Therefore it is desirable to select a subset of the most useful features and to discard the remainder.In the first part of this chapter we review the major feature selection approaches and discuss theircharacteristics. The second part of the chapter focuses on feature subset selection in variablecost domains. This is important because the costs of different types of errors (e.g. recall/precisiontrade-off) are not necessarily known when the system is trained and thus different classifiers orfeature sets may be optimal for different costs. Emphasis is given on the Parcel algorithm whichis based on ROC analysis and allows the construction of systems robust to cost variation usingcombinations of multiple feature subsets and classifiers.
6.1 Importance of feature selectionFeature selection1 can have a considerable impact on the effectiveness of the resulting classifica-tion algorithm [Ferri et al., 1994, Zongker and Jain, 1996]. Very often it is not known in advancewhich features will provide the best discrimination between classes, and it is usually not feasi-ble to measure and represent all possible features of the the objects being classified. As a result,feature selection and extraction methods have become important techniques for automated patternrecognition, exploratory data analysis and data mining. The main purpose of feature selection is
1Feature selection in statistics literature is known as variable selection [Krzanowski, 1988].
74

CHAPTER 6. FEATURE SELECTION 75
to reduce the number of features used in classification while maintaining an acceptable classifica-tion accuracy. Feature extraction is a more general method in which the original set of features istransformed to provide a new set of features. The feature selection problem can be viewed as acombinatorial problem. It refers to the task of identifying and selecting a useful subset of featuresto be used to represent patterns from a larger set of often mutually redundant, possibly irrelevant,features with different associated measurement costs and/or risks. Any feature belonging to a‘good’ subset must have two basic properties (Section 2.1):
1. features characterising objects belonging to different classes have dissimilar values
2. features characterising objects belonging to the same class have similar values
There are various reasons for which one wants to perform feature subset selection. It can reducethe dimensionality of the data2 and may allow learning algorithms to operate faster and moreeffectively. In some cases, accuracy on future classification can be improved; in others, the resultis a more compact, easily interpreted representation of the target concept. Exhaustive evaluationof possible feature subsets is usually inpractical because of the large amount of computationalload required. On the other hand, there are dangers in using feature selection with limited trainingdata [Zongker and Jain, 1996].
6.2 Characteristics of feature selection algorithmsFeature selection algorithms perform a search through the space of feature subsets and as a conse-quence, must address four main issues affecting the nature of the search [Langley and Sage, 1994].Different algorithms address the following issues differently.
starting point Selecting a point in the feature subset space from which to begin the search canaffect the direction of the search. The search process starts with either an empty set or a fullset. An alternative is to begin somewhere in the middle and continue from this point.
search organisation An exhaustive search of the feature space is prohibitive for all but a smallinitial number of features. In a domain where classes are described by N features, there are2N possible feature subsets to choose from. Heuristic search strategies are more efficientthan exhaustive ones and can give good results, although they do not guarantee finding theoptimal subset.
evaluation criteria The way feature subsets are evaluated is the single biggest differentiatingfactor among feature selection algorithms. An optimal subset is always relative to a certainevaluation function (i.e. an optimal subset chosen using one evaluation function may not bethe same as that which uses another evaluation function). Typically, an evaluation functiontries to measure the discriminating ability of a feature or a subset to distinguish the differentclass labels.
stopping criterion A feature selection algorithm must decide when to stop searching throughthe space for feature subsets. Depending on the evaluation strategy, a feature selectionalgorithm might stop adding or removing features when none of the alternatives improvesupon the merit of a current feature subset. The decision whether a subset suffices or not isdetermined using a statistical significance test. In principle we compare two classifiers and
2This also means that fewer features have to be calculated for future system realisations.
CHAPTER 6. FEATURE SELECTION 76
determine whether adding a new input improves the classification accuracy significantly.Alternatevely, the algorithm might continue to revise the feature subset as long as the meritdoes not degrade. A further option could be to continue generating feature subsets untilreaching a specified size for the feature subset or the opposite end of search space and thenselect the best.
Search organisation and evaluation criteria are particulary important issues in feature selectionand we review the main approaches separately in the following two sections.
6.2.1 Search organisationWe already mentioned that in a domain where classes are described by N features, there are 2Npossible feature subsets to choose from. It is often intractable to consider all possible featuresubsets, even if the size is specified. Feature selection algorithms usually proceed greedily. Dif-ferent approaches can be taken towards the method in which the feature subset space is searched,namely: complete, incremental and random.
complete search requires the examination of all possible subsets to find the optimal one. Simplemethods for a complete search are exhaustive algorithms such as breadth-first search, depth-first search and best-first search [Russel and Norvig, 1995]. A complete search does notnecessarily have to be exhaustive. Methods can be employed to reduce the number of sub-sets examined, without compromising the optimality of the chosen subset. An example ofsuch algorithm is the branch and bound feature selection [Narendra and Fukunaga, 1977],which is guaranteed to find the optimal feature subset under the monotonicity assumption(the addition of features can only increase the value of the objective function). The branchand bound approach can be described as an exploration of a state space tree. At each pointof searching the tree, a bound is computed from the best solution in the current subtree.Promising nodes in the tree are expanded, whereas nodes for which the lower bound islarger than the best solution found so far are pruned (the monotonicity assumption ensuresthat their children nodes will not contain a better feature).
incremental search methods tend to examine fewer subsets and thus are usually faster than com-plete search methods. However, they usually do not guarantee optimal results. The twobasic incremental search algorithms are sequential forward selection (SFS) and sequentialbackward selection (SBS). The SFS algorithm starts with an empty set of features and ateach iteration adds to the current subset one feature from the remaining features. It gen-erally chooses the feature that best satisfies the evaluation criterion. In contrast, the SBSalgorithm starts with the full set of features and removes at each iteration the feature thatleast satisfies of the evaluation criterion. Both methods usually perform O N2 operations.A major problem of SFS methods is that it is difficult for them to select sets of features thatare good co-predictors of the class if none of these predictors is a good predictor of the classby itself. On the other hand, SFS is much faster than SBS and therefore scales better to largedatasets. The preceding two methods suffer from the so-called nesting effect. This is, once afeature is discarded in the SBS method, there is no possibility for it to be reconsidered again.The opposite is true for the forward procedure; once a feature is chosen, there is no way forit to be discarded later on. [Ferri et al., 1994] introduced a variant of SFS called sequentialforward floating selection (SFFS), that allows after every forward step in which a feature isadded, the opportunity to remove features with backwards steps, as long as the correspond-ing subsets are better than the previously evaluated ones at that level. In their comparative

CHAPTER 6. FEATURE SELECTION 77
study which included an SFS algorithm and genetic algorithms [Raymer et al., 2000], SFFSwas found to be optimal. [Zongker and Jain, 1996] too compared many feature selectionalgorithms, including many variants of the sequential search, and found that SFFS gave thebest results.
random search methods [Selman, 1995] are newer in their use compared to the other two cate-gories. They typically start with a random feature set and search fewer number of subsetsthan 2N by performing randomly SFS and SBS in order to escape local minima for a max-imum number of iterations. Optimality of the selected subset depends on the resourcesavailable but in general poorly selected control parameters will result into suboptimal solu-tions due to early convergence.
6.2.2 Evaluation criteriaA feature selection algorithm evaluates subsets using a function in order to select the optimalsubset. Functions biased towards different criteria can lead to the selection of different optimalsubsets. [Ben-Bassat, 1982] divided the feature evaluation criteria into three groups: informationmeasures, distance measures and dependence measures. [Dash and Liu, 1997] also added criteriaderived from consistency measures and the classification error rate. A discussion of the abovecriteria follows:
information criteria are based on notions from Information Theory, such as mutual informa-tion3 and relative entropy [Cover and Thomas, 1991]. [Koller and Sahami, 1996] proposeda SBS algorithm which uses the measure of relative entropy to minimise the informationloss due to the removal of features.
distance criteria measure the separability of the class distributions, either the class-conditionaldistributions, or the class-posterior distributions. Instances of the same class should becloser in terms of distance than those from different classes. The optimal feature set isconstructed by selecting those features which support instances of the same class to staywithin the same proximity.
dependence criteria are based on the correlation between features. Generally, a dependence cri-terion tends to give a higher score to features that show a higher correlation to the variablerepresenting the true class. [Hall and Smith, 1997] used a correlation based heuristic to se-lect feature subsets, their goal is to find feature subsets that are highly correlated with theclass, yet showing little correlation with each other. [Ben-Bassat, 1982] stated that evalua-tion criteria derived from dependence measures have close relations to both the distance andinformation criteria and generally could be assigned to one of those categories. However,since they represent a different concept they are listed separately.
consistency criteria are used to find subsets that remain consistent with the examples in the train-ing set. Focus algorithm (Section 6.3.3) is an example of an algorithm using this measure.[Dash et al., 2000] suggested a measure that scores feature subsets according to the numberof inconsistencies they have in the patterns of the training data and implemented it using avariety of search methods.
classification error rate criteria use the classification algorithm itself to assess the feature sub-sets evaluated. These criteria are computationally expensive but increase the accuracy to-wards the classification task for which feature selection is performed76.
3Mutual information is also known as the information gain between the feature and the class.

CHAPTER 6. FEATURE SELECTION 78
6.2.3 Filters and wrappersFeature subset selection algorithms can be classified into two categories according to their evalu-ation criterion, i.e. on whether or not feature selection is performed independently of the learningalgorithm used to construct the classifier. If feature selection is performed independently of thelearning algorithm – undesirable features are filtered out of the data before learning begins, thetechnique is said to follow a filter approach [Kohavi and John, 1997]. These algorithms use heuris-tics based on general characteristics of the data to evaluate the merit of feature subsets. Otherwise,it is said to follow a wrapper approach [Kohavi and John, 1997], where an classification algorithmis used along with a statistical re-sampling technique such as cross-validation to estimate the finalaccuracy of feature subsets. Filters use the first four types of criteria listed in Section 6.2.2 (i.e.information, distance, dependence and consistency), while wrappers use the fifth criterion (i.e.classification error). Figure 6.1 illustrates the filter and wrapper approaches to feature selection.
Search
Featureevaluation
heuristicmerit
fearure set
Training set
Dimensionalityreduction
Classificationalgorithm
Final evaluation
training data
hypothesis
estimate accuracy
Test set
Feature set
Search
Feature evaluation:cross validation
estimateaccuracyfeature set
Training set
Dimensionalityreduction
Classificationalgorithm
Final evaluation
training data
hypothesis
estimate accuracy
Test set
Feature set
Wrapper approach
Classificationalgorithm
hypothesisfearure set
Filter approach
Figure 6.1: An overview of filter and wrapper approaches for feature selection. The filter approachis independent of the classification algorithm and optimises simple criteria which tend to improveperformance. In the wrapper approach a classification algorithm is retrained and re-evaluated toestimate the accuracy of different feature subsets.
There are strong arguments in favour of both approaches. While the filter approach is gen-erally computationally more efficient than the wrapper approach, its major drawback is that an

CHAPTER 6. FEATURE SELECTION 79
optimal selection of features may not be independent of the classification and representational bi-ases of the learning algorithm that is used. The wrapper approach on the other hand, involves thecomputational overhead of evaluating candidate feature subsets by applying a learning algorithmon the dataset represented using each feature subset under consideration. This is feasible only ifthe learning algorithm used to train the classifier is relatively fast.
6.3 Main feature selection paradigmsRecently there has been an increased interest in the field of feature selection from both the data-mining and machine learning communities. In particular, the use of decision trees (Section 6.3.1),as either wrappers or filters, has attracted a wealth of attention. Decision trees are seen as moreinterpretable and “user friendly” than other classifiers and much application-oriented researchhas been undertaken, with the aim of creating easy-to-use, interactive tools for end-users. In theneural network community, an attempt to detect suitable features through the effects they produceon weights during training has lead to algorithms for relevance detection (Section 6.3.2). Someinterest has also been developed in algorithms that attempt to eliminate irrelevant features priorto classifier training (Section 6.3.3) and as such these algorithms fall into the filter framework.Finally, another set of algorithms (Section 6.3.4) improve the classification results by means ofvoting procedures that collect the answers of different learners applied to the same problem, butwhere each learner has access to a differently distributed set of training data.
6.3.1 Decision treesDecision tree structured algorithms such as classification and regression trees(CART) [Breiman et al., 1984] and C4.5 [Quinlan, 1993] perform feature selection as partof the construction process. Classification trees hierarchically decompose the feature space andcan be classed as wrappers if the constructed tree is used for classification, or as filters if thetree is used to select features that will subsequently be used for another algorithm. The classallocation of a test observation is decided by the partition in the feature space that the observationis positioned in. Trees are most commonly binary, i.e. every non-terminal partition is divided intotwo sub-spaces. The root of the tree represents the full feature space. The aim of the partitionsis to concentrate as many training observations of one class within the resulting subspace, whileminimising the observations from other classes. The process may be repeated recursively for leafnodes until all spaces corresponding to leaf-nodes are pure, i.e. only contain training observationsfrom a single class. Several leaf-nodes can correspond to the same class. This can lead to largebias towards the training data (over-fitting) and consequently poor generalised classificationperformance. To overcome this problem, the trees are pruned, i.e. leaf-nodes are recombinedbottom up until a suitable compromise between the purity of the leaf-nodes and the size of thetree is achieved.
Decision trees has been the default method of incorporating prosodic features in spoken lan-guage systems. Prosodic integration at SRI e.g. [Shriberg et al., 2000] uses CART-style decisiontrees to perform combination of discrete and continuous features. Decision trees split accordingto an entropy criterion, large differences in class sizes remove any effect of the features them-selves, causing the tree not to split. By downsampling to equal class priors they retain sensitivityto the features. Leaf nodes are successively pruned if they fail to reduce the entropy in the cross-validation procedure.
Tree performance is evaluated using two metrics, accuracy and efficiency. Accuracy is thenumber of correct classifications divided by the total number of samples. Accuracy is based on

CHAPTER 6. FEATURE SELECTION 80
hard decisions; the classification is that class with the highest probability. For any particularaccuracy level, there is a trade-off between accuracy and efficiency. Efficiency measures therelative reduction in entropy from the root node to the final tree, taking into account the probabilitydistributions produced by the tree. Two trees may have the same classification accuracy, but theone which more closely approximates the probability distributions of the data (even if there is noeffect on decisions) has higher efficiency (lower entropy).
6.3.2 Automatic relevance determination[MacKay, 1992] proposed the automatic relevance determination (ARD) algorithm that applies asimple hierarchical prior to MLP weights for determining the relevance of the inputs.4 Subse-quently, ARD was empirically investigated by [Neal, 1998]. Relevance weightings are producedfor each of the inputs to the network by examining the parameters of the network during training.Irrelevant inputs should have smaller weights in the connections to the hidden units than moreimportant weights. With separate hyperparameters the weights from irrelevant inputs can havetighter priors, which reduces such weights more effectively towards zero than having the commonlarger variance for all the input weights. No features are ever completely excluded, so ARD isnot strictly a feature selection algorithm; it always uses all the features available. However, ARDcan be said to be performing a form of soft selection, due to the application of relevance weight-ings. Unlike the other wrapper algorithms described here, ARD is not generally applicable. It isspecifically designed for neural network architectures.
6.3.3 Relief and FocusIn the filter model, feature selection is performed as a preprocessing step to classification.Thus the bias of the learning algorithm does not interact with the bias inherent in the fea-ture selection algorithm. Two of the most well-known filter methods for feature selection areRelief [Kira and Rendell, 1992] and Focus [Almuallim and Dietterich, 1991]. Las Vegas filter(LVF) [Liu and Setiono, 1996] is an algorithm similar to Focus also presented here.
Relief does not directly select a subset of features, but rather each feature is given a relevanceweighting indicating its level of relevance to the class label. It is important to note thatthis method is ineffective at removing redundant features as two predictive but highly cor-related features are both likely to be given high relevance weightings. The algorithm usesa distance criterion by calculating the actual distance (e.g. Euclidean) between samples. Itassigns a weight to each feature according to its relevance to the target concept. It does soby repeatedly selecting instances from the training set and updating each features weightaccording to values of the distance between the sample and its two nearest neighbours: theclosest instance from the opposite class (“nearest miss”) and the closest instance from thesame class (“nearest hit”). The idea is that a good feature should display large differences inthe values of instances from different classes and small differences in the values of instancesfrom the same class. The Relief algorithm was extended by [Kononenko, 1994] to handlemulti-class, noisy and incomplete data.
Focus uses exhaustive breadth first search in the space of feature subsets until it finds the min-imum combination of features that divides the training data into pure classes, i.e. everycombination of feature values is associated with a single class. This consistency criterion
4An implementation of ARD approach to handling inputs that may turn out to be irrelevant comes with Netlabtoolkit [Nabney and Bishop, 2001].

CHAPTER 6. FEATURE SELECTION 81
makes Focus very sensitive to noise or inconsistencies in the training data. Moreover, theexponential growth of the size of the power set of the features makes this algorithm imprac-tical for domains with more than 25-30 features.
LVF randomly searches the space of subsets using a Las Vegas algorithm that makes probabilisticchoices to help guide them more quickly to an optimal solution, and uses a consistencymeasure that is different from that of Focus. For each candidate subset, it calculates aninconsistency count based on the hypothesis that the most frequent class label among thoseinstances matching this subset of features is the most probable class label. An inconsistencythreshold is fixed in the beginning and any subset, having an inconsistency rate greater thanit, is rejected. This algorithm is efficient, as only the subsets whose number of features issmaller than or equal to that of the current best subset are checked for inconsistency. Onedrawback is that it may take more time to find the optimal subset than algorithms usingheuristic generation procedure for certain problems, since it cannot take advantage of priorknowledge.
6.3.4 Boosting and baggingMethods such as bagging [Breiman, 1994] and boosting [Schapire, 1990, Freund, 1995] improvethe classification results by means of voting procedures that collect the answers of different learn-ers applied to the same problem, but where each learner has access to a differently distributed setof training data.
Boosting is a general method for improving the accuracy of a weak learning algorithm. Boostingcan be seen as combining classifiers to minimise the cost of misclassified examples. Boost-ing takes a set of supervised training examples and assigns a weight to each. These weightscan be thought of as artificially adjusting the frequency of each example. In each iterationof training, a single classifier is selected and tested on the training set. The weights are thenupdated so correctly classified examples are weighted more and incorrectly classified exam-ples are weighted less. The final prediction is the weighted vote of each selected classifier,where the weight is derived from the accuracy of the classifier on the training set. A niceproperty of boosting is its ability to identify outliers, i.e. examples that are either mislabeledin the training data, or which are inherently ambiguous and hard to categorise.
Bagging was introduced to give more robust predictions when the model class under considera-tion is unstable with respect to the data, i.e. when small changes in the values of the datacan cause the predicted values to change significantly, such as with linear regression overcorrelated variables or with neural networks. Bagging works by using bootstrap replicatesof the data and averaging over the predictions of these replicates. Each replicate is createdby randomly sampling m items from the original dataset of n items, a way of distortingthe training set that can be seen as enhancing any intrinsic noise. [Breiman, 1994] sug-gested that the effectiveness of bagging depends crucially on the instability of the learningalgorithm. Unstable learners such as decision trees and neural networks are capable of pro-ducing very different classifiers given small changes in the training data. Bagging can harmthe accuracy of stable learners because each classifier sees less data.

CHAPTER 6. FEATURE SELECTION 82
sensitivity
1-sp
ecifi
city
0,1 1,1
1,00,0
C
CB
A
CR,i
Figure 6.2: The output of a realisable classifier CR is obtained by switching between the outputsof CA and CB classifiers. The performance of this hybrid classifier surpasses that of the actualclassifiers for some operating conditions.
6.4 Feature selection in variable cost environmentsFeature selection methods are primarily evaluated according to their resulting classification (orequivalently, undifferentiated error rate), but there are disadvantages associated with this measure:it may not be appropriate for the context in which the classifier will be deployed. For example, inspeech summarisation, the cost of different types of errors is not known at the time of designingthe system, while these costs may change over time. Additionally, some costs cannot be specifiedquantitatively. In speech summarisation such costs include coherence degradation, readability de-terioration and topical under-representation. We need a method for the comparison, managementand application of multiple classifiers that is robust to imprecise and variable cost domains.
ROC analysis (Section 2.4) is an alternative evaluation technique that makes it possible toevaluate how well classifiers perform given certain misclassification costs and class distributions.However, [Scott et al., 1998] using two real-world classification tasks showed that no single fea-ture set could be discovered producing a generally dominant ROC curve.
6.4.1 Maximum realisable ROC[Provost and Fawcett, 2001] found that it is possible to construct a hybrid classifier that optimallyuses a set of available classifiers according to specific properties of the deployment context. Thishybrid classifier is known as realisable classifier (Figure 6.2) and performs at least as well as thebest available classifier for any target conditions. Therein we assume two classifiers CA and CB.If we switch between the outputs of these classifiers, new operating points in the ROC space canbe achieved. For any input xj, the output CR i of the realisable classifier will produce operatingpoints on the straight line linking (FPCA TPCA) and (FPCB TPCB) points with probability:
P CR i CBFPCR i FPCA
FPCB FPCA
(6.1)
P CR i CA 1 P CR i CB (6.2)

CHAPTER 6. FEATURE SELECTION 83
where CA , CB and CR i are the outputs of classifiers CA, CB and CR, respectively, withfalse positive rates denoted FPCA, FPCB and FPCR i .
It is now possible to derive all classifiers that lie on straight line segments with end pointsformed by existing classifiers and such that the new classifiers focus on different areas of theROC space. This leads to the construction of classifiers with better overall ROC performance.The combination of these classifiers is referred to as the maximum realisable ROC (MRROC)classifier and is equal to, or better than, all existing classifiers. The MRROC classifier has twoimportant advantages: First, the need for precise knowledge of target conditions is deferred untilrun time. Second, in the absence of precise knowledge even at run time, the system can be opti-mised easily with minimal feedback. In many real-world scenarios, costs and class distributionscan be (re)specified at run time with reasonable precision by sampling from the current data set,and used to ensure that the MRROC classifier performs optimally. Conceptually, the MRROCclassifier has a single control setting5 which will give the optimal TP/FP trade-off for the targetconditions corresponding to that setting.
6.4.2 The Parcel algorithm[Scott et al., 1998] derived the Parcel algorithm that sequentially selects features and classifiers tomaximise the MRROC. This implies that different trade-offs in the ROC space require differentoptimal feature sets and classifiers. It is the objective of Parcel to produce a MRROC that has thelargest possible area underneath it, i.e. to maximise the AUROC associated with the classificationsystem defined by the current MRROC. This is achieved by searching for, and retaining, thosefeatures and classifiers that extend the convex hull defined by the MRROC. The Parcel algorithmseeks not to select a single best feature subset, but rather to select as many as different subsets asare necessary to produce satisfactory performance across all costs.
The operation of Parcel for feature selection is illustrated in Figure 6.3. In this example, theobjective is to find a MRROC for a problem with a data set described by the features a , band c . SFS is used to search the feature space but any algorithm from those described in Sec-tion 6.2.1 could be used instead.
Phase A Estimate single feature classifiers and generate the ROC curves for each candidate fea-ture. For continuous output classifiers vary a threshold over the output range to plot theROC curve. The MRROC old is the diagonal.
Phase B Form the convex hull of the ROC curves and retain those classifiers that correspond tothe vertices of the convex hull. If MRROC new differs6 from MRROC old , the algorithmproceeds. Set MRROC old equal to MRROC new . In the illustration, as classifiers producea continuous output to which different thresholds have been applied to predict class mem-bership, the convex hull, MRROC new , has five vertices.7 Two use feature subset b , andthree use a .
Phase C For each retained classifier c in the vertices of MRROC old if there are N total featuresand c has nc features, then form N nc new classifiers, each with nc 1 features, formed
5In practice, this setting is the threshold used within a classifier. [Provost and Fawcett, 2001] used the term ‘knob’to illustrate its role. For example, if the system produces too many false alarms, turn the knob to the left; if the systemis presenting too few cases, turn the knob to the right.
6Each new classifier/feature either extends the existing convex hull or does not. The degree of difference is imple-mentation dependent. In our experiments we required a 5% minimum difference for the algorithm to proceed.
7The convex hull of a set of points is the smallest convex hull that contains the points.

CHAPTER 6. FEATURE SELECTION 84
by adding each remaining feature to the input feature set. Generate ROC curves for the newclassifiers and recompute the convex hull.
Phase D Retain those classifiers that are used to form the vertices of the convex hull (In theillustration two use feature subset a, c , the others using b , a, b and b, c ). If thenew convex hull does extend the old convex hull go to Phase C. Otherwise, terminate andreturn the set of classifiers that are the vertices of the convex hull.
{b}
{a}
{c}
phase A phase B
phase C phase D
{a}
{b}MRROC(old) MRROC(old)
MRROC(old) MRROC(old)
{b}
{a,c}
{a,b}
{b,c}
1-sp
ecifi
city
1-sp
ecifi
city
0,0 1,0sensitivity 0,0 1,0
0,10,1 1,11,1
1-sp
ecifi
city
1-sp
ecifi
city
sensitivity
sensitivity
sensitivity 1,0
0,1
0,0
1,11,1
0,0 1,0
0,1
MRROC(new)
MRROC(new)
Figure 6.3: The operation of the Parcel algorithm with the objective to find the MRROC for a taskwith a data set described by the features a , b and c , after [Scott et al., 1998]. It demonstrateshow subsets of features are compared under different costs according to whether they extend theMRROC.
The Parcel algorithm has several advantages over existing feature selection approaches allow-ing for systems to be developed using combinations of multiple feature subsets and classifiers. Inparticular the Parcel algorithm:
seeks not to select a single best feature subset, but rather to select as many as differentsubsets as are necessary to produce satisfactory performance across all costs. The methoddoes not require saving every the configuration or statistics of every classification system

CHAPTER 6. FEATURE SELECTION 85
examined for re-analysis under different conditions. Only those systems that their operatingpoints lie on the MRROC are saved, the rest can never be optimal, so they need not be saved.
requires no fixed classification algorithm to be used, nor does it require a single classifica-tion algorithm to be used. It is possible to use multiple classification algorithms and to carryout the search for suitable classifiers to form the MRROC by not only varying the featuresubset, but also the classification algorithm.8
minimises the management of classifier performance data, facilitates the comparison of alarge number of classifiers, and allows clear visual comparisons and sensitivity analysis.
The above reasons make the Parcel the algorithm of choice to evaluate which of the several andoften correlated lexical and prosodic features are potentially optimal as classifier inputs for voice-mail summarisation.
6.5 HypothesesFollowing the description of the nature of lexican and prosodic features and the feature selectionstrategy, we can make the following hypotheses:
H3 Lexical and prosodic features have a complementary role of similar significance within thesummarisation component. We predicted that a subset of both lexical and prosodic featureswill be present in the feature sets that produce good quality summaries and that prosodyencoded as raw features not only increases the robustness of the summarisation componentbut occassionaly surpasses the accuracy offered by the lexical features alone.
H4 A small but variable number of features is adequate for performing summarisation. Weexpected that in order to produce a set of accurate – as assessed by SER – summaries adimension-reduced feature set would only be necessary.
In the next chapter we present a series of experiments in order to examine the validity of the abovepredictions.
6.6 Concluding discussionThis chapter has reviewed a number of feature selection methods and their role in designing clas-sification systems. Feature selection is a combinatorial problem referring to the task of identifyingand selecting a useful subset of features to be used to represent patterns from a larger set of oftenmutually redundant, possibly irrelevant features. Feature selection reduces the dimensionality ofthe data, allowing classification algorithms to operate faster and more accurately. The majorityof existing algorithms do not consider any variability in costs associated with the classificationsdue to the feature sets produced. In fact, variable costs can lead to unpredictable and undesirablebehaviour from existing feature selection approaches, regardless of the evaluation criteria used.ROC analysis makes it possible to evaluate how well classifiers will perform given certain mis-classification costs and class distributions. Classifiers may be combined by random switching toachieve any operating point on the convex hull of their ROC curves. The Parcel algorithm takes
8Given a set of features, the operating points for all available classification algorithms can be calculated andcompared.

CHAPTER 6. FEATURE SELECTION 86
advantage of this and allows the construction of systems robust to cost variation using combina-tions of multiple feature subsets and classifiers. As in VoiSum the cost of different types of errorsis not known at the time of designing the system and these costs may change over time, Parcelbecomes the algorithm of choice to evaluate which of the several and often correlated lexical andprosodic features are potentially optimal as classifier inputs.

7. Feature selection experiments
This chapter presents a set of experiments specific to the development of the voicemail summari-sation component aiming to examine the validity of the our latest hypotheses H3 and H4. We startby describing the experimental setup, the data sets and the calculation of the features used. Wethen evaluate and combine lexical and prosodic features (only lexical used in Chapter 4) using theParcel algorithm. All experimental results of this chapter use human transcriptions for trainingand validation. Two main tasks are presented, namely the binary decision and multi-class sum-marisation. In the former, the goal is to classify words into those carrying principal content andthose which do not, while in the latter the goal is to further classify the principal content wordsinto proper names, telephone numbers, dates/times and other. For each of the two summarisationtasks we conducted experiments in order to compare the contribution of individual features andstudied the effect of the amount of training data and types of classifiers employed. We then givedetails about the operating points produced by the Parcel algorithm based on the AUROC crite-rion. Given a desired operating point in ROC space, Parcel enables us to choose a classifier thatis optimal (with respect to the validation set) for that point. The chapter closes with a descriptionof a post-processing algorithm applied over the automatically generated summaries to increasetheir quality and by making two new hypotheses regarding the evaluation of the summaries.
7.1 Experimental framework and setupThe architecture of the summarisation component is depicted in Figure 7.1. Lexical informationwas obtained from the ASR component while prosodic features were extracted from audio datausing signal processing algorithms or the recogniser’s acoustic model. Features related to pausesand NE matching were treated as binary. The rest of the features were normalised to zero meanand unit variance over the training set. Alignment with the transcriptions enables the identificationof features that correspond to each word in the recogniser’s output. This information corresponds
87

CHAPTER 7. FEATURE SELECTION EXPERIMENTS 88
to the segments for which lexical and prosodic information has to be computed in order to scoreword hypotheses.
Featureextraction
Transcriptionalignment
Feature subsetselection
Test Sets
Training / Validation Set
Automaticallytranscribed
message
Manuallytranscribed
message
Annotatedsummary
Parcelalgorithm
Featureextraction
Training andvalidation of
classifiers
Classifierapplication
Automaticallysummarized
message
Audio signal
Audio signal
Evaluation
PostprocessingRemove stop words,
retain names andtelephone numbers
Costs vs. operatingconditions
Objective/subjective tests &usability testing
Figure 7.1: The extractive summarisation approach at a glance. Text summaries of spoken mes-sages are constructed using a synchronised combination of lexical and prosodic feature subsets.
The H3 and H4 hypotheses will be examined for a variety of configurations using the Voice-mail corpus. A series of experiments was conducted to evaluate the accuracy and sensitivity of theclassification systems that are to be used for summarisation to various internal and external param-eters. We report results on two tasks, namely the binary (Section 7.2) and multi-class (Section 7.3)summarisation, with focus on the following aspects:
1. role of the training data size
2. role of classifier type
3. role of lexical and prosodic features
4. location of MRROC operating points
All experiments reported in this chapter use human transcriptions. Alternatively, we could con-sider training the summarisation classifiers on ASR transcriptions but we did not want to includean extra source of variability in our system given the relatively high WER. That approach wasadopted by [Baron et al., 2002] who were concerned with prosody-based detection of punctuationand interruption events in the ICSI meeting corpus.
7.1.1 Computation of prosodic featuresThe manual annotation of prosody can be a very complex task, requiring a great deal of timeand training on the part of scientists. Most linguistic prosody research still relies heavily on thehand-labelling of speech, augmented by semi-automated computer analysis tools, since this is byfar the most accurate way to obtain precise estimates of prosodic features. However, tasks such

CHAPTER 7. FEATURE SELECTION EXPERIMENTS 89
as automatic speech summarisation require large quantities of data for training and validationpurposes, for which prosody can not be expertly transcribed. Automatic computation of prosodicfeatures is therefore necessary for tasks of this nature. Prosodic features may be extracted fromaudio data using signal processing algorithms or the recogniser’s acoustic model. The computationof each of the features that are to used in VoiSum will be discussed in the following sections. Someprosodic features used in our models do not depend on word boundary information, but rather ona computation over a window of speech frames.
We automatically extracted and computed the correlates of basic prosodic features (Sec-tion 5.1.1) associated with each transcribed word. These features can be broadly grouped asreferring to pitch, energy, word duration and pauses. Various versions for some features wereused and a more detailed description of them follows.
Duration featuresThe duration features were extracted from the acoustic model and normalised by the Vmail15training set on the phoneme level. However, because these parameters are likely to vary amongspeakers, we also normalised them for each message. For the rate of speech (ROS) estimationwe used the enrate tool [Morgan et al., 1997] which calculates the syllable rate based on thecomputation of the first spectral moment of the low frequency energy waveforms correspondingto a chosen time series segment.
We expressed the duration of each phoneme, not in terms of its actual duration, but in termsof how much shorter/longer it is than expected. Thus, we looked at the difference between theduration of a phoneme and the mean duration of the phonemes in that message. The averageduration of each word was estimated by summing up the mean durations of all the phonemes thatappear in the particular word as found from the forced alignment of the training data. A durationslexicon was then constructed for each word in the training set by taking into account any multiplepronunciations.1 For a phoneme p the normalised duration is given by:
d pd p µp
σp(7.1)
where d p , µp and σp is the duration, the mean and standard deviation of the duration of phonemep, respectively. Hence, if an instance of a phoneme is longer than average, the normalised durationwill be positive; if the instance is shorter than average, the normalised duration will be negative.Note that a negative normalised duration does not mean that the segment is shortened: it onlymeans that the duration is smaller than the mean. Since the mean is estimated from all occurrences,including lengthened phonemes, the mean duration will actually be slightly larger than the dura-tion of unlengthened phonemes. Thus an unlengthened phoneme may have a negative normalisedduration because it is shorter than the mean. This definition of normalised duration has alreadyproven useful in a number of other studies such as those by [Price et al., 1989, Campbell, 1990].
Pause featuresGenerally, ASR systems treat silence as an additional phonemic unit and recognise it in the sameway as other phoneme models. Therefore, from a practical perspective pauses may be seen as theduration of the silence phonemes. This makes calculation of pause boundaries reasonably accuratefor most current ASR systems. Due to the spontaneous nature of speech in Voicemail corpus wedecided not to use raw pause durations. Instead, in our implementation we treated pauses asbinary features of each word in the transcription. Their values are non-zero if non-speech regions
1This implies that no durational features were calculated for OOV words.

CHAPTER 7. FEATURE SELECTION EXPERIMENTS 90
preceding or succeeding a word exceed a duration of 30 ms.2 In the current implementation wedid not consider filled pauses. Filled pauses might be informative about important words giventhat they tend to point to speakers’ lexical search problems.
F0 featuresF0 features were calculated every 16 ms using the pda function of Edinburgh SpeechTools [Taylor et al., 1999]. This function implements a super resolution pitch determination al-gorithm proposed by [Medan et al., 1991]. [Bagshaw et al., 1993] compared the contours derivedfrom this algorithm with those derived by six other algorithms and found to be of superior qualityand independent of speaker’s gender. We smoothed the output values in order to correct for F0estimation errors. This was performed by applying a median filter which operates on a number ofinput samples and places them in ascending order of amplitude and selects a median (i.e. middle)sample as the filter output. We used a filter length of 5 to correct occasional errors and producesmoother F0 contours.
As we do not try to model a well defined event but rather find any relations between prosodicfeatures and target words, we decided to use raw F0 values in all our experiments. We calculatedthe mean, range and slope of the F0 regression line over a window ranging three frames precedingand following each word. The F0 onset (the first non zero value in segment) and the F0 offset(the last non zero value in segment) were also calculated. In case there were not enough F0samples in the examined window to calculate an adequate feature value (e.g. for short wordssuch as articles), each missing value was set to the minimum available value from the words inthe window’s vicinity. For more controlled experiments such as detection of anger or anxiety, F0features can be based on explicit models of pitch halving/doubling, using straight line stylisations.[Sonmez et al., 1998] applied a median filter to raw pitch values and then stylised them using apiecewise linear algorithm. This approach yielded straight line approximations of the originalcontour and they argued that it helps to remove outliers and allows for more robust extraction oflocal slopes and minimum and maximum F0 values.
Energy featuresEnergy features were calculated every 16 ms using the energy function of Edinburgh SpeechTools [Taylor et al., 1999] with default settings. This function calculates the RMS energy for eachframe of the waveform, which is defined as:
e i1n
n
∑i 1
ai2 (7.2)
As with F0 features, in case there were not enough energy samples in the examined windowto calculate an adequate feature value each missing value was set to the minimum available valuefrom the words in the window’s vicinity.
7.1.2 Feature space search methodFor feature subset selection we used the Parcel algorithm (Section 6.4.2) which is based on ROCanalysis. This algorithm is independent of the method for searching the feature space (Sec-tion 6.2.1). We selected SFS for its efficiency and simplicity. The procedure begins by consideringeach of the features individually and selecting the one that gives the largest value for the selection
2The selection of 30 ms as a threshold to identify pauses within a message is somewhat arbitrary and was derivedby studying a subset of forced alignments of the training data. Further study might lead to a more accurate value.

CHAPTER 7. FEATURE SELECTION EXPERIMENTS 91
criterion i.e. the AUROC within Parcel. At each successive stage of the algorithm, which is il-lustrated in Figure 7.2, all the remaining features are considered to identify the one which, whencombined with those already selected, yields the largest increase in the AUROC. The algorithmterminates if no new features have been discovered that improve upon the AUROC. Note that a setof n features chosen in this manner may not be the best set of n. Some potential subsets might nothave been examined at all by this procedure, however an exhaustive search would be computa-tionally too expensive given the size of training data and the feature set. One particular difficultywith SFS is that, if there are two features such as that either feature alone provides little discrim-ination, but where both features together are very effective, then the SFS method may never findthis combination since either feature alone would never be selected.
f1 f5f2 f3 f4 f16... ... f24
f1 f5f2 f3 f16... ... f24f4 f4f4 f4 f4 f4
f1 f5f2 f16... ... f24f4 f4f4 f4 f4f3 f3 f3 f3 f3
f1 f5f2 ... f24f4 f4f4 f4f3 f3 f3 f3f16 f16 f16 f16
Figure 7.2: SFS for a set of input features, denoted f1 f2 f16 f24. We augment the featureset as follows. The single best feature is chosen first, and then features are added one at a timesuch as that at each stage the feature chosen is the one which produces the greatest increase in theAUROC.
Although theoretically it is possible to obtain a single optimal subset, in practiceit has been shown that the subset chosen will be highly dependent upon the classifierused [Kohavi and John, 1997]. In a previous implementation [Koumpis and Renals, 2001], thedecision to which feature to add at each stage was also related to the classifier used at the time.Searching the entire feature space with the same algorithm, i.e. SFS, for each of the classifierallows us to evaluate features by minimising the effect of the classifier chosen. As a new search isassociated with each classifier, we tend to examine more feature subsets and thus producing moreoperating points.
7.1.3 Classifiers used within ParcelThe Parcel algorithm requires neither a fixed classifier, nor a single classifier. The five simpleclassifiers listed in Table 7.1 were evaluated within this framework, namely a k-nearest neigh-bours (k=5); a Gaussian classifier; a single layer network; an MLP with 20 hidden units and aFisher linear discriminant. The approach of neural network based classifiers is quite differentfrom that of the other three statistical classifiers. Neural networks are on-line learning systems,intrinsically non parametric and model-free, with the learning algorithms typically of the errorcorrection type. Most statistical classifiers, on the other hand, can be interpreted to follow theBayesian classification principle, either explicitly estimating the class densities and a priori prob-abilities, or the optimal discriminant functions directly by regression. More rigourous definitions

CHAPTER 7. FEATURE SELECTION EXPERIMENTS 92
as well as detailed descriptions of the above classifiers, their variants and statistical properties canbe found in sources such those by [Bishop, 1995, Duda et al., 2000]. Here we only give a briefoverview.
Classifier Typeknn: k-nearest neighbours, k=5gau: Gaussian classifiersln: single layer networkmlp: MLP comprised 20 hidden unitsfld: Fisher linear discriminant
Table 7.1: Classifiers used within the Parcel feature subset selection algorithm.
k-nearest neighbours classifier assigns each case to the class with the highest posterior probabil-ity of membership of the k-nearest training cases to the test case. Given a new case x and atraining set of classified cases, the algorithm starts by finding the k-nearest neighbours to x,as defined by a metric of ‘closeness’. A case x is classified as class c if more of the nearestneighbours are in class c than in other classes (majority vote). One has to tune parameterk for optimising classification effectiveness. Then in order to make classification decisions,the scores have to be thresholded. The k-nearest neighbours classifier is non-parametric andthus it could fit any real data distribution provided that enough training data is available.
(Maximum Likelihood) Gaussian classifier assumes that inputs are uncorrelated and distribu-tions for different classes differ only in their mean values. Essentially, we take a set oftraining vectors each representing a different word and for each of them we calculate themean and covariance matrix for a Gaussian model. This model can then be used to find theprobability of any unknown vector. An unknown vector is assigned to the class for whichwe get the highest probability.
single layer network classifier is a simple structure that performs a mapping of the input spaceto the output space using linear transformations. A logistic activation function was used inthe output layer. A single layer network requires lengthy supervised off-line learning, butonce trained it runs very quickly.
MLP classifier treats a complex problem as the superposition of many simple non-linear func-tions. Adding extra layers to a single layer network classifier allows non-linear problemsto be tackled. A unit performs a linear combination of the inputs and then applies a non-linear activation function. The logistic activation function was used in the output layer. Aswith the previous classifier, MLP classifier requires lengthy supervised off-line learning, butonce trained it runs very quickly.
Fisher linear discriminant classifier uses a linear function yielding the maximum ratio between-class scatter to within-class scatter. A scatter is the number of samples times their variance,or in other words, the sum of the squared differences from their mean. The scatter-betweenis defined by the class means themselves while the scatter-within is the sum of the scattermatrices for both classes. During classification we want scatter-between to be as large aspossible, while scatter within to be as small as possible.
The best classifier for a given task can be found by experimenting with different designswhich incorporate criteria which, in addition to classification error, can include other issues such

CHAPTER 7. FEATURE SELECTION EXPERIMENTS 93
as computational complexity and feasibility of efficient implementation. An insightful discussionon the difficulties of benchmarking different types of classifiers is given by [Hand, 1997].
7.1.4 Classification thresholds and rejection ratesA threshold has to be applied on the continuous outputs of the classifiers to predict the wordclasses (Section 2.2). A TP occurs when a word is correctly classified to belong into a class, anda FP when a word not belonging into a class is classified as such. By varying the level of thethreshold, different degrees of TP and FP rates can be achieved. As one ROC curve can dominatein some interval of thresholds and the other dominates in other intervals, an end-user can pick apoint on the curve, that represents an operating classifier with the most desirable TP and FP rates.For instance, a threshold of .3 implies that a word should be classified in C0 if wscore 3 and inC1 if wscore 3. Selecting a lower threshold will improve sensitivity, while selecting a higher onewill improve specificity.
If classifications were mutually exclussive, each instance would much at most one class. How-ever, instances very close to the threshold may be “claimed” by multiple classes, resulting inpotentially conflicting classifications. Resolving these into a single class is called resolution prob-lem [Fawcett, 2001]. In practical applications, when faced with doubtful classification decisionson individual cases, it can be useful to single out those cases and consider them separately. The re-ject option entails a compromise between maximisation of the ratio of correctly classifying words,and the minimisation of the ratio of words excluded from the summaries. If a rejection rate of .1is applied, the word will be classified in C0 if wscore 25 and in C1 if wscore 35. The wordsfor which 25 wscore 35 are characterised as rejections. The above essentially introduces ameasure of confidence on the decision as shown in Figure 7.3 where only two classes are consid-ered. In that case, Equations 2.2 and 2.3 can be modified to accommodate the rejected words asfollows:
sensitivity TPTP FN REJTP FN
(7.3)
specificityTN
TN FP REJTN FP(7.4)
where REJTP FN and REJTN FP is the number of rejected words that would have lead (if not hadbeen rejected due to low confidence) to TP and/or FN, and TN and/or FP, respectively. A numberof rejected, i.e. unclassified, words does not invalidate the ROC analysis framework. A slightshift of the ROC curve southwest is expected since a loss in sensitivity is balanced by a gain inspecificity.
C0
threshold
rejected
classified as C1classified as
Figure 7.3: The role of threshold and rejection rates in the classification experiments (only twoword classes are assumed).

CHAPTER 7. FEATURE SELECTION EXPERIMENTS 94
7.2 The binary decision voicemail summarisation taskThe binary decision voicemail summarisation task is a word-level discrimination task: for eachword, decide whether or not it should be included in the summary. We define two classes: one classcontaining the principal content words and another class containing all redundant and irrelevantwords (Section 4.2.1). The binary decision summarisation task can be expressed by Equation 4.1when C 2 and is depicted in Figure 7.4 where the mapping of spoken words to a featureobservation space is shown.
The observation space comprises a total of 16 lexical and prosodic features which are usedas inputs to the Parcel feature subset selection algorithm that tries to maximise the AUROC byhypothesising one of the two possible classes in the hypothesis domain. The features which wecalculated for the binary decision summarisation task are shown in Table 7.2. Note that variationsof collection frequency and NE matching features were derived by stemming message transcrip-tions with Porter’s suffix stripping algorithm [Porter, 1980]. This algorithm reduces all words withthe same root to the same stemmed form (e.g. computer, computation, computing, compute) ona purely lexical basis and is widely used in IR tasks. Since the reference word lists with whichcomparisons took place during features’ calculation were computed on training data (human tran-scriptions), there are no effects due to speech recognition errors.
W1
W2
W3
W4
W8W5
W6 WN
W7
f1
f5
f9
f2
f13
f6
f10
f14
f3
f7
f11
f15
f4
f8
f12
f16
H0
H1
data domain observation space
hypothesis domain
f2 f4 f7
decision rule
C1
decision
W9
W10
Figure 7.4: Schematic representation of the binary decision summarisation task.
7.2.1 Effect of training set sizeAs it is shown by the ROC curves in Figure 7.6 the amount of training data does not affect sig-nificantly the degree of correlation between features and word classes. The curves are becomingsmoother as the number of training samples increases, but the patterns appear to be similar. Hence,a relatively small amount of data can be sufficient to study the correlation of lexical and prosodicfeatures. Note that the same NE lists were used for all four sizes of training sets, as these had been

CHAPTER 7. FEATURE SELECTION EXPERIMENTS 95
Lexical Featuresac: acoustic confidencecf1: collection frequency of actual wordscf2: collection frequency of stemmed wordsne1 all : matching of all actual NE words*ne2 all : matching of all stemmed NE words*loc: word location in messageProsodic Featuresdur1: duration normalised by corpusdur2: duration normalised by message ROSpp: preceding pause*fp: succeeding pause*e: mean RMS energy normalised by message∆F0: delta of F0 normalised by messageF0 amp
3: average F0 normalised by messageF0 ran : F0 rangeF0 on : F0 onsetF0 off : F0 offset
Table 7.2: Lexical and prosodic features calculated for each word in the voicemail training, val-idation and test sets for the binary decision task. The features marked with an asterisk (*) arerepresented by binary variables (indicating presence or absense of the property).
constructed off line (Section 4.2.2).
7.2.2 Role of classifier typeFigure 7.5 reveals that the amount of training data appears to be more important for certain typesof classifiers. The single layer network classifier was found to be the most sensitive to limitedamounts of training data, followed by the Fisher linear discriminant and the MLP. However, forthe largest available training data set (800 messages) we can see that the accuracy of the classifiersconverges. The k-nearest neighbours classifier gave very good trade-off between TP and FP forall four sizes of available training data. The Gaussian classifier produces relatively high numberof both TP and FP covering a wide range of operating points. However, this classifier does notoffer an optimal trade-off for any of the four training data sets. Finally, the results from the singlelayer network were relatively poor.
7.2.3 The role of individual featuresIn order to examine the validity of H3 hypothesis we performed the following set of experiments.The ROC curves for all the lexical and prosodic features with respect to four different sizes oftraining sets are shown in Figure 7.6.
Lexical featuresAmong the lexical features, collection frequency is the one with the highest correlation with thetarget words followed by NE matching. We observed a minor improvement in separability offeredby collection frequency when it was calculated over stemmed words (cf2) compared to cf1. How-ever, the NE matching feature when estimated over stemmed words (ne2 all ) proved to be worsethan ne1 all . Acoustic confidence (ac) and location features (loc) prove to have weak correlationwith respect to the target class in this task. Acoustic confidence has a positive correlation while thepattern of location ROC curve indicates that most target words can be found towards the beginningof a message rather than its end.

CHAPTER 7. FEATURE SELECTION EXPERIMENTS 96
0 0.2 0.4 0.6 0.8 10
0.2
0.4
0.6
0.8
1
1−specificity
sens
itivi
ty200 messages
knngauslnmlpfldrand
0 0.2 0.4 0.6 0.8 10
0.2
0.4
0.6
0.8
1
1−specificity
sens
itivi
ty
400 messages
knngauslnmlpfldrand
0 0.2 0.4 0.6 0.8 10
0.2
0.4
0.6
0.8
1
1−specificity
sens
itivi
ty
600 messages
knngauslnmlpfldrand
0 0.2 0.4 0.6 0.8 10
0.2
0.4
0.6
0.8
1
1−specificity
sens
itivi
ty
800 messages
knngauslnmlpfldrand
Figure 7.5: ROC curves produced by Parcel for the binary decision summarisation task using thefive classifiers described in Table 7.1 and the features listed in Table 7.2 for four different sizesof training data sets. The accuracy of the classifiers converges as the amount of training dataincreases.
Prosodic featuresConsidering the prosodic features, the one with the highest correlation between the importantwords proved to be durational, followed by energy (e). Normalisation of duration by ROS(dur2) offered almost identical class separability as the one obtained by dur1. F0 informa-tion did not offer significant discrimination and this is in accordance with the results presentedby [Silipo and Greenberg, 2000] where it was shown that F0 relevant features of the syllabic nu-clei play a much less important role in prosodic stress than duration and energy. F0 range (F0 ran )and F0 amplitude (F0 amp ) proved to be the most useful among F0 related features. F0 ran wasthe only prosodic feature that gave a relatively high rate of true positives, dominating the lowerleft area of the ROC space. Both F0 onset (F0 on ) and offset (F0 off ) features offered similar andrather low separability in the binary decision task. The slope of F0 contours (∆F0) proved to offerno discrimination. We found that important words tend to precede pauses instead of succeedingthem. Although the correlation of important words and pauses is rather weak we found it to be

CHAPTER 7. FEATURE SELECTION EXPERIMENTS 97
consistent through our experiments. This weak correlation can be due to the spontaneous natureof voicemail speech, although this can be simply due to the rather arbitrary selection of silenceduration of 30 ms that we used to define pauses.
0 0.2 0.4 0.6 0.8 10
0.2
0.4
0.6
0.8
1
1−specificity
sens
itivi
ty
200 messages
accf1cf2dur1dur2e∆ F0F0(amp)F0(ran)F0(on)F0(off)locne1(all)ne2(all)ppfprand
0 0.2 0.4 0.6 0.8 10
0.2
0.4
0.6
0.8
1
1−specificity
sens
itivi
ty
600 messages
0 0.2 0.4 0.6 0.8 10
0.2
0.4
0.6
0.8
1
1−specificityse
nsiti
vity
400 messages
0 0.2 0.4 0.6 0.8 10
0.2
0.4
0.6
0.8
1
1−specificity
sens
itivi
ty
800 messages
Figure 7.6: The ROC curves produced for the binary decision summarisation task using as inputsto a linear classifier the individual features of Table 7.2 with respect to four training sets containingdifferent amount of data.
From the above results it seems that H3 hypothesis is only partially correct for the binary deci-sion summarisation task. In particular, the role of lexical and prosodic features is complementarybut the former have a far more important role to play. In the next paragraph we shall revisit thishypothesis along with H4 which is related to the number of features required to produce accuratesummaries.
7.2.4 MRROC operating pointsFigure 7.7 depicts the MRROC curves produced by Parcel on the validation set using lexicalonly, prosodic only and all features for four different sizes of training data. Each vertex wasproduced by using a particular classifier and feature subset. Three different feature subsets atdifferent target operating conditions are shown in detail, namely A, B, C and will be used toevaluate summaries of the two test sets (Chapter 8). Details of the operating points are shownin Tables B.1, B.2, B.3, 7.3 for 200, 400, 600 and 800 messages in the training set, respectively.

CHAPTER 7. FEATURE SELECTION EXPERIMENTS 98
Therein, apart from the classifier, the features selected, the sensitivity and (1-specificity) rates wealso provide the thresholds and the rejection rates used.
0 0.2 0.4 0.6 0.8 10
0.2
0.4
0.6
0.8
1
1−specificity
sens
itivi
ty
200 messages
A200 knn0.3, 0.0(cf1, ne1(all), F0(ran), cf2, F0(on), fp, pp)B200 knn0.5, 0.1(cf1, ne1(all), fp)
C200 gau0.3, 0.1(cf1, ne2(all), F0(ran))
lexproslex+prosrand
0 0.2 0.4 0.6 0.8 10
0.2
0.4
0.6
0.8
1
1−specificity
sens
itivi
ty
400 messages
A400 knn0.3, 0.0 (cf1, ne1(all), F0(ran), ne2(all))B400 gau0.5, 0.1 (cf1, ne1(all), cf2, F0(ran))
C400 gau0.3, 0.1 (cf1, ne1(all), cf2, fp)
lexproslex+prosrand
0 0.2 0.4 0.6 0.8 10
0.2
0.4
0.6
0.8
1
1−specificity
sens
itivi
ty
600 messages
A600 knn0.3, 0.0 (cf1, ne1(all), pp)B600 gau0.5, 0.1 (ne1(all), cf1, fp)
C600 gau0.3, 0.1 (ne1(all), cf1, pp, fp)
lexproslex+prosrand
0 0.2 0.4 0.6 0.8 10
0.2
0.4
0.6
0.8
1
1−specificity
sens
itivi
ty800 messages
A800 knn0.3, 0.0 (cf1, ne1(all), F0(ran), fp)
B800 gau0.7, 0.1 (ne1(all), cf2, dur1)
C800 gau0.3, 0.1 (ne1(all), cf2, F0(ran))
lexproslex+prosrand
Figure 7.7: The MRROC curves produced by Parcel on the validation set using lexical only,prosodic only and combination of lexical and prosodic features. Three different feature subsetswith different TP/FP trade-off denoted with A, B, C are also depicted. Lexical features as classifierinputs clearly dominate prosodic features in the entire ROC space. The combination of lexical andprosodic features gives superior accuracy than any single constituent classification system.
Regarding the H3 hypothesis we confirm that it is partially correct. Lexical features as clas-sifier inputs clearly dominate prosodic features in all intervals of thresholds. The combination oflexical and prosodic features gives superior accuracy compared with any single constituent clas-sification system. The lowest FP rate is achieved using lexical features alone (lower left of ROCcurves). Prosodic features extend the system’s classification capabilities for true positives of 0.4and above. In contrast, prosodic features alone tend to produce relatively high TP and FP rates(upper right of ROC space). The features most often selected were F0 ran , fp and dur1. We alsofound that almost every single feature subset contributing to the MRROC of lexical and prosodicfeatures contains NE matching and collection frequency features (most often ne1 all and cf1). Theabove supports the H4 hypothesis as three or four features on average are sufficient to produce themost accurate summaries. We shall re-examine these hypotheses on the multi-class task which

CHAPTER 7. FEATURE SELECTION EXPERIMENTS 99
Lexical and Prosodic Features1-specif. sensit. classifier thres. rej. features
0.07 0.57 gau 0.9 0.3 ne1 all , cf2, pp, dur20.08 0.59 gau 0.7 0.1 ne1 all , cf2, dur10.22 0.82 knn 0.3 0.0 cf1, ne1 all , F0 ran , fp0.35 0.88 gau 0.3 0.1 ne1 all , cf2, F0 ran
Lexical Features1-specif. sensit. classifier thres. rej. features
0.07 0.42 fld 0.9 0.3 cf20.11 0.55 gau 0.7 0.1 cf1, cf20.13 0.60 gau 0.5 0.1 cf1, cf20.24 0.75 knn 0.5 0.0 cf1, ne1 all , ne2 all , cf20.45 0.82 gau 0.3 0.1 cf1, cf2
Prosodic Features1-specif. sensit. classifier thres. rej. features
0.08 0.15 knn 0.9 0.3 pp, dur 1, fp, F0 amp0.14 0.26 knn 0.7 0.3 pp, dur 1, fp0.57 0.73 mlp 0.5 0.1 pp, F0 amp , e0.90 0.95 gau 0.1 0.1 dur1, pp, F0 amp
Table 7.3: Operating points of the MRROC curves on the validation set after training on 800voicemail messages within the binary decision class.
follows.
7.3 The multi-class voicemail summarisation taskIn the multi-class voicemail summarisation task we have five predefined classes: four classes con-taining the words that carry principal content (proper names, telephone numbers, dates/times andother) and one class containing all redundant and irrelevant words. Hence, the multi-class voice-mail summarisation task is expressed by the Equation 4.1 for C 5. The multi-class summari-sation task is depicted in Figure 7.8 where the mapping of spoken words to a feature observationspace is shown. The observation space comprises a total of 24 lexical and prosodic features listedin Table 7.4.
7.3.1 Role of classifier typeFollowing the result from the binary decision task where the larger the amount of data the slightlybetter the accuracy, we conducted subsequent experiments using the full training set (800 mes-sages). For the multi-class summarisation task we experimented only with the single layer net-work and the MLP classifiers. The reason behind this decision was the availability of the softmaxfunction [Bridle, 1990]. This function represents a smooth version of the ‘winner takes all’ activa-tion model in which the unit with the largest input has output 1 while the other units have output0. In case of softmax the integrated outputs of the units can be interpreted directly as probabilityestimations, thus we do not need to search for optimal thresholds and rejection rates.
The ROC curves produced by Parcel for the multi-class summarisation task on the validationset using the single layer network and the MLP classifiers are depicted in Figure 7.9. The accuracyof the two classifiers is almost identical for the proper names, telephone numbers and dates andtimes classes. For the ‘other’ class the accuracy is complementary, but still comparable.

CHAPTER 7. FEATURE SELECTION EXPERIMENTS 100
W1
W2
W3
W4
W8W5
W6 WN
W7
f1
f5
f9
f2
f13
f6
f10
f14
f3
f7
f11
f15
f4
f8
f12
f16
H0
H1
data domain observation space
hypothesis domain
f2 f14 f23
decision rule
C4
decision
H2 H3
H4
f24
W9
W10
Figure 7.8: Schematic representation of the multi-class summarisation task.
7.3.2 Comparison of individual featuresWe found that the distributions of most prosodic features differed for different target classes;however, the extent of overlap among classes was also significant. The four target word classes ofthe multi-class voicemail summarisation task were found to correlate with individual features asfollows (Figure 7.10):
Proper names were best correlated with class specific NE matching (ne1 nam ) offering closeto optimal classification. However, the sensitivity was reduced dramatically when thematching of stemmed list (nee nam ) was used. NE matching based on all types of NE(ne1 all ) gives a good discrimination as the related lists entries contain mostly proper names.This advantage was less evident with the increased confusion introduced by the stemmedlist (ne1 all ). Collection frequency also offered good discrimination with cf2 performingslightly better than cf1. Location information (loc) found to have strong negative correla-tion with the proper names, indicating that proper names appear most often at the beginningof messages. We also observed a low acoustic confidence for proper names. Regardingthe prosodic features we found rather strong correlations with energy (e), F0 ran , F0 ampand duration (in descending order). A weak correlation with following pauses (fp) was alsoobserved.
Telephone numbers were found to be characterised adequately by both class specific NE match-ing features (ne1 tel , ne2 tel ), offering almost optimal classification, and the date and timespecific NE matching features (ne1 d t ,ne2 d t ). This is explained by the fact that these twoclasses share a large number of entries, namely digits. Location features (loc) offered agood discrimination as telephone numbers typically appear towards the end of a message.Collection frequency found to have an interesting correlation with this class. For words withlow collection frequency the correlation was strongly negative, while the correlation wentslightly positive for words with a collection frequency above the average. It is also notable

CHAPTER 7. FEATURE SELECTION EXPERIMENTS 101
Lexical Featuresac: acoustic confidencecf1: collection frequency of actual wordscf2: collection frequency of stemmed wordsne1 all : matching of all actual NE words*ne2 all : matching of all stemmed NE words*ne1 nam : matching of proper names*ne2 nam : matching of stemmed proper names*ne1 tel : matching of telephone numbers*ne2 tel : matching of stemmed telephone numbers*ne1 d t : matching of dates and times*ne2 d t : matching of stemmed dates and times*ne1 oth : matching of other NE words*ne2 oth : matching of stemmed other NE words*loc: word location in messageProsodic Featuresdur1: duration normalised by corpusdur2: duration normalised by message ROSpp: preceding pause*fp: succeeding pause*e: mean RMS energy normalised by message∆F0: delta of F0 normalised by messageF0 amp : average F0 normalised by messageF0 ran : F0 rangeF0 on : F0 onsetF0 off : F0 offset
Table 7.4: Lexical and prosodic features calculated for each word in the voicemail training, valida-tion and test sets for the multi-class task. The features marked with an asterisk (*) are representedby binary variables.
that telephone numbers class had the highest acoustic confidence among all five classes.From the prosodic features only durational proved to be related with telephone numbers.The remaining of prosodic features gave close to chance accuracy.
Dates and times were discriminated adequately by the class specific NE matching features(ne1 d t ,ne2 d t ) in a similar fashion to the previous class. However, the telephone num-bers specific NE matching (ne1 tel , ne2 tel ) were found to have a much lower sensitivitywith dates and times class due to the many irrelevant entries. Notably, ne1 all gave a betterdiscrimination with respect to dates and times than ne1 tel or ne2 tel . In contrast to tele-phone numbers, collection frequency features gave good correlation with dates and times.The most important prosodic features were found to be fp, dur1/dur2, F0 off and F0 amp(in descending order). Note that F0 off found to have the best correlation with dates andtimes class comparing with all the other classes. Dates and times class was the only classwith a negative correlation with energy features. The rest of the prosodic features examinedoffered a discrimination close to that of chance.
Other target words proved to be the most difficult to correlate with individual features. The fea-tures that correlate best with this general class are related to collection frequency (cf1,cf2).As one would expect for this class NE related features offered virtually no discrimination,with the slightly positive correlation explained due to several instances of the same targetwords (Section 4.2.1). Among the prosodic features dur1/dur2, F0 rang , e and F0 off offeredthe best discrimination.

CHAPTER 7. FEATURE SELECTION EXPERIMENTS 102
0 0.2 0.4 0.6 0.8 10
0.2
0.4
0.6
0.8
1
1−specificity
sens
itivi
tyProper names
slnmlprand
0 0.2 0.4 0.6 0.8 10
0.2
0.4
0.6
0.8
1
1−specificity
sens
itivi
ty
Telephone numbers
slnmlprand
0 0.2 0.4 0.6 0.8 10
0.2
0.4
0.6
0.8
1
1−specificity
sens
itivi
ty
Dates and times
slnmlprand
0 0.2 0.4 0.6 0.8 10
0.2
0.4
0.6
0.8
1
1−specificity
sens
itivi
ty
Other target words
slnmlprand
Figure 7.9: The ROC curves produced by the Parcel algorithm for the multi-class task on the val-idation set using the single layer network and the MLP classifiers after training on 800 voicemailmessages.
The H3 hypothesis becomes even weaker for the multi-class summarisation task, where thelexical features clearly dominate the ROC space. Even for the ‘other’ class collection frequencyis the most prominent feature. Hence, we conclude that lexical and prosodic features have acomplementary role in the summarisation component but the role of former is more significant.
7.3.3 MRROC operating pointsThe MRROC operating points for the multi-class task are shown in Figure 7.11. With respectto H4 hypothesis we can again verify the original prediction that a small but variable numberof features is adequate for performing summarisation. The combination of multiple classifieroutputs within the multi-class summarisation task is not straightforward. Although ROC analysiscan been extended to multiple classes [Srinivasan, 1999], the result is in general non-intuitive andcomputationally expensive. In practice, c classes are commonly handled by producing c differentROC curves. If we let C to be the set of all classes then ROCCc plots the classification accuracyusing class Cc as the positive class and all other classes as the negative class. Each such ROC

CHAPTER 7. FEATURE SELECTION EXPERIMENTS 103
0 0.2 0.4 0.6 0.8 10
0.2
0.4
0.6
0.8
1
1−specificity
sens
itivi
tyProper names
accf
1cf
2dur
1dur
2e∆ F
0F
0(amp)F
0(ran)F
0(on)F
0(off)locne
1(all)ne
2(all)ppfpne
1(nam)ne
2(nam)ne
1(tel)ne
2(tel)ne
1(d/t)ne
2(d/t)ne
1(oth)ne
2(oth)rand0 0.2 0.4 0.6 0.8 1
0
0.2
0.4
0.6
0.8
1
1−specificity
sens
itivi
ty
Dates and times
0 0.2 0.4 0.6 0.8 10
0.2
0.4
0.6
0.8
1
1−specificity
sens
itivi
ty
Telephone numbers
0 0.2 0.4 0.6 0.8 10
0.2
0.4
0.6
0.8
1
1−specificity
sens
itivi
ty
Other target words
Figure 7.10: The ROC curves produced for the multi-class summarisation task using as inputs toa linear classifier the individual features of Table 7.4 with respect to a training set containing 800messages.
curve yields an AUROC value. For a single probabilistic classifier this produces c separate curveswith c different AUROC values. The AUROC values can be combined into a single weighted sumwhere the weight of each class Cc is proportional to the class’s prior in the training set:
AUROCtotal ∑Cc C
AUROC Cc p Cc (7.5)
A disadvantage of the method described by Equation 7.5 is that words belonging into classes withlow priors are essentially excluded from the summaries. Furthermore, as priors estimated overa large set they can be totally irrelevant to particular messages. For instance, consider messageswhere there are repetitions of the same information e.g. telephone numbers and therefore manywords belong into a certain low prior class. If the classifiers for the classes with high priors areapplied according to these priors, it might not leave enough room to classify words into the re-maining classes given the restrictions set by a given compression rate. Subsequently, we tooka different approach in which we subsequently applied one classification system for each of theclasses. We started with the one offering the best accuracy (largest AUROC). The restriction was

CHAPTER 7. FEATURE SELECTION EXPERIMENTS 104
that a classification system with a smaller AUROC than the ones previously applied could not re-move from the summaries the words already selected. Following the results shown in Figure 7.11,we applied sequentially PN800, TN800, DT800 and OT800 classification systems to produce themulti-class summaries. The configuration of these classification systems is shown next to theoperating points.
0 0.2 0.4 0.6 0.8 10
0.2
0.4
0.6
0.8
1
1−specificity
sens
itivi
ty
Proper names
PN800 mlp(ne1(nam), F0(off))
lex+prosrand
0 0.2 0.4 0.6 0.8 10
0.2
0.4
0.6
0.8
1
1−specificityse
nsiti
vity
Telephone numbers
TN800 mlp(ne1(tel), dur1)
lex+prosrand
0 0.2 0.4 0.6 0.8 10
0.2
0.4
0.6
0.8
1
1−specificity
sens
itivi
ty
Dates and timesDT800
mlp(ne2(d/t), F0(off))
lex+prosrand
0 0.2 0.4 0.6 0.8 10
0.2
0.4
0.6
0.8
1
1−specificity
sens
itivi
ty
Other target words
OT800 mlp(cf1, cf2)
lex+prosrand
Figure 7.11: The MRROC curves produced by the Parcel algorithm for the multi-class task on thevalidation set using the single layer network and MLP classifiers after training on 800 voicemailmessages. Details of the operating points closer to the optimal classifier are also shown.
7.4 Summary post-processingSpoken language, including voicemail, contains much redundancy in the form of many words thatcarry no information but are necessary to construct grammatical sentences. These words ofteninclude prepositions, pronouns, articles and connectives and are called function words. Functionwords can be excluded from the summaries because they do not contribute to the relevance andimportance of an extract. We used a stop list in order to exclude any function words from the sum-mariser’s output, which contains, along with common function words, others that intuitively do

CHAPTER 7. FEATURE SELECTION EXPERIMENTS 105
Class proper names, Lexical and Prosodic Features1-specif. sensit. classifier features
0.01 0.77 mlp ne1 nam , loc0.03 0.97 mlp ne1 nam , F0 off
Class telephone numbers, Lexical and Prosodic Features1-specif. sensit. classifier features
0.03 0.99 mlp ne1 tel , dur1Class dates and times, Lexical and Prosodic Features1-specif. sensit. classifier features
0.03 0.40 sln ne2 d t , dur20.12 0.84 mlp ne2 d t , dur20.14 0.89 mlp ne2 d t , F0 off
Class other, Lexical and Prosodic Features1-specif. sensit. classifier features
0.03 0.22 sln cf1, dur10.16 0.65 sln cf1, ne2 oth0.28 0.79 mlp cf10.31 0.81 mlp cf1, cf2
Table 7.5: Operating points of the MRROC curves for the multi-class task on the validation setafter training on 800 voicemail messages.
BOB GLEN MORRISON AT ONE SEVEN NINE FIVE GIVE ME A CALL
BOB GLEN MORRISON AT ONE SEVEN NINE FIVE GIVE ME A CALL
prior to post-processing
after post-processing
Figure 7.12: Examples of summarisation errors that the post processing algorithm corrects.
not affect the worthiness of a message summary. Our stop word list contains 54 entries (Table 4.5)and is applied after the classification has taken place.4 Our experiments revealed that approxi-mately 2% of the hypothesised words were stopped. This indicates that our classifiers were welltrained to exclude frequently occurring and insignificant words from the summaries.
In another scenario when information extends across several words and only a subset of themis extracted, the information will appear fragmented in the summary and this will be incomprehen-sible or biased. In particular, a hypothesised summary may contain a subset of the true summary,but missing one or two words which can distract the meaning (e.g. a missing ‘not’ from a neg-ative statement) or diminish the usability of the extracted information (e.g. a missing digit froma telephone number). In order to overcome the latter problem we designed a simple algorithmto compensate for occasional classification errors so as to retain information context beyond theword level. The procedure is a follows: we search the summariser’s output for proper names andcheck whether the word preceding and following them is also a proper name. In case a word in thevicinity of a hypothesised proper name was in fact a proper name (as indicated by NE matching)but had not been classified as a target word by the summariser, we included it in the summarygiven that its acoustic confidence score was above a certain value, e.g. 0.4. We then repeated the
4Stop words could also be removed prior to the classification phase. Although this would reduce the amount ofnecessary computations (i.e. not classifying words which would be removed anyway), we decided to remove them inthe post-processing phase as in the future the summarisation models might be extended beyond the word level, wherethe stop words will be useful.

CHAPTER 7. FEATURE SELECTION EXPERIMENTS 106
above procedure for acronyms and digits with the search taking place in a wider window so as toretain in the summaries long acronyms and telephone numbers. Examples of summarisation er-rors that can be corrected by the post-processing algorithm are shown in Figure 7.12. As a futureextension in the post-processing algorithm it would be useful to include a functionality to detectrepetitions and drop duplicate information e.g. a telephone number repeated twice in a messageor a non necessary spelling of proper names and places.5
7.5 HypothesesPrior to the systematic evaluation of the summaries that were produced by the systems describedin this chapter, we made the following hypotheses:
H5 Automatic summaries are better than random summaries but inferior to manual summaries.We predicted that summaries produced automatically either from a human transcription orautomatic transcription would be consistently better than random or crude summaries butnot superior to the summaries produced manually.
H6 The effects of the summarisation component are as crucial as those of the recognition com-ponent. We expected that the summarisation quality would be affected by recognition andsummarisation errors in a similar degree.
H7 Automatic summaries enable accurate and fast message comprehension. We predicted thatreading the message on a mobile display would enable quicker comprehension than access-ing the corresponding spoken audio. We expected that proactive delivery of text voicemailsummaries to mobile terminals can in general reduce delays to important decision-makingby capturing and distributing information quickly.
7.6 Concluding discussionIn this chapter we examined in detail the binary and multi-class summarisation tasks. The fo-cus was on the effects of training data size, role of features, and type of classifiers. The resultsrevealed that the classifiers (with the exception of single layer network) are not sensitive to thesize of training set. Using ROC analysis we identified the most informative features for the twosummarisation tasks. Highly informative features for the binary decision task were collection fre-quency, NE matching, duration, energy and pauses. For the multi-class summarisation task theleading features were collection frequency, NE matching, duration and F0 offset. In the rest of thechapter our goal was to select dimension-reduced vectors of prosodic and lexical features that areadequate for classifying the words contained in spontaneous spoken messages and produce tersesummaries. Hypothesis H4 was validated as a small but variable number of features is adequatefor performing summarisation. In particular we found that the distributions of most lexical andprosodic features varied considerably for different target classes; however, the extent of overlapamong classes was also significant. Parcel provided us with a powerful framework to address oneof the difficulties in prosodic modelling, i.e. multiple prosodic components affecting the sameacoustic signal. We showed that it is possible and desirable to avoid single commitment to a sin-gle classifier or feature set. Instead we came up with as many as different subsets are necessaryto produce satisfactory accuracy across all costs. Hypothesis H3 proved to be only partially cor-rect as we found that lexical and prosodic features are complementary within the summarisation
5For such an example see message 6 of test42 in Appendix A.

CHAPTER 7. FEATURE SELECTION EXPERIMENTS 107
component but the former play consistently a more important role. In all experiments reportedin this chapter we used human transcriptions for training and validation. The next chapter willdiscuss evaluation using the classifiers developed in this chapter on unseen test data, both handtranscribed and automatically recognised.

8. Evaluation and usability issues
The design of VoiSum architecture requires trade-offs between the target summary length andthe retaining of essential information points. The way message transcriptions are processed toconstruct summaries can affect everything from a user’s perception of the service to the allocationand management of the mobile network’s resources. Delivering only correct and content rich en-tities to the mobile terminal would maximise the potential success of such a system. Although theultimate test of a summary is whether or not it is found to be useful by the intended recipient, inpractice deciding how to maximise the utility of a summary for a user is hard. This chapter startsby reviewing metrics for objective and subjective summary evaluation and provides scores for boththe binary decision and multi-class tasks. The evaluation is done using unseen test data and thequestions we are looking to answer are the effects of WER and the effects of automatic summari-sation. This chapter also extends a framework for evaluating and comparing the performance ofvoicemail summarisation systems for mobile messaging. The framework combines message andsystem attributes in a way that determines which configuration constructs and delivers summariesthat satisfy most of the users most of the time.
8.1 Methods for evaluating summarisationAfter having performed feature subset selection and compared different classifiers withn the ROCspace and automatically post-processed their output, as described in Chapter 7, we proceededwith the evaluation of the summaries. Summaries are inherently hard to evaluate because theirquality depends both on the intended use and on a number of other factors, such as how readablean individual finds a summary or what information an individual thinks should be included in it.Automatically generated summaries of textual material can be evaluated by subjective comparisonto existing human-generated summaries of the same material. Unlike application domains wherea ‘gold standard’, e.g. the correct transcription of a spoken utterance, or the correct filled template
108

CHAPTER 8. EVALUATION AND USABILITY ISSUES 109
in an extraction task can be specified, automatic summarisation systems have proved difficult toevaluate, as there is no such thing as a best, or canonical summary – especially when the summaryis constructed as an extract. Hence, there is not a wide agreement upon a set of methods forcarrying out summarisation evaluation. In the following paragraphs we outline the two mainevaluation approaches, namely subjective and objective. The first requires human subjects toperform the actual scoring while in the latter the scoring can be automated by comparing againstreference summaries.
8.1.1 Subjective evaluation measuresText summarisation evaluation performed by human subjects can be broadly classified into twocategories: intrinsic and extrinsic [Mani and Maybury, 1999]. In an intrinsic evaluation, humansjudge the quality of summarisation directly based on the analysis of a summary. This can involveuser judgements on fluency of the summary, or similarity to an ‘ideal’ summary. In an extrinsicevaluation, the quality of a summary is judged on how it affects the completion of some other task.Tasks have included humans determining the relevance of summaries to topics as well as humansanswering questions based on readings of summaries.
Significant work on evaluation of text summarisation systems was carried out during theDARPA summarisation conferences (SUMMAC) [Mani et al., 1998] and document understand-ing conferences (DUC) [Marcu, 2001]. SUMMAC evaluations are especially notable becausethey are the first large-scale evaluations of text summarisation systems conducted by someoneother than the developers of those systems. An extrinsic evaluation method was employed to mea-sure the impact of summarisation on performance time and accuracy in assessing relevance. Theexperimental hypothesis was that the use of summarisation saves time in relevance assessment incertain tasks, without impacting accuracy. In DUC evaluations the summary evaluation environ-ment (SEE) was used.1 SEE allows summary evaluators to evaluate the quality of summaries bydesignating one summary as ideal (model text), and comparing it with the automatically producedsummaries (peer texts). The interface allows comparisons to be performed based on whether thepeer text content is fully or only partially covered by ideal summary.
8.1.2 Objective evaluation measuresA major factor indicating whether or not summaries are useful as shortened versions of the orig-inal messages can be determined by whether or not key information is retained in them. Twometrics commonly used to evaluate extracts in text summarisation are precision and recall (Sec-tion 2.2). Recall is a measure of how many words in the ‘ideal’ summary are in the automaticsummary while precision is a measure of how many of the words selected were indeed rele-vant to the ‘ideal’ summary. F-measure, the weighted harmonic mean of precision and recall,indicates the overlap between the ‘ideal’ summary and the automatic one. A pilot experiment(40 sentences) reported by [Jing et al., 1998] examined the F-measure performance of three textsummarisation systems. It was found that different systems achieved their best performance atdifferent compression rates, showing that the cut-off summary length can affect results signif-icantly, and the assumption of a single ‘ideal’ summary is problematic. They also suggestedimprovements on the precision and recall measures for summarisation by proposing a fractionalF-measure, while [Goldstein et al., 1999] used 11-point average precision.2 [Radev et al., 2000]illustrated that F-measure or percent agreement are not satisfactory and proposed that instead one
1SEE was implemented by C.-Y. Lin and is available from http://www.isi.edu/ cyl/SEE/211 point average precision is the most standard TREC text retrieval measure.

CHAPTER 8. EVALUATION AND USABILITY ISSUES 110
can measure the coverage of the ideal summary’s utility, determined by measuring users’ speedand accuracy in identifying relevant documents.
8.1.3 Integrating subjective and objective measuresThe quality of a service is not related to a single measure, but is rather to a combination of severalfactors, including learnability, effectiveness and user satisfaction. Speech-enabled applicationsshould be designed with the needs of the end-user firmly in mind. However, the quality cannotbe presupposed – it is a property that must be assessed by having representative users interactwith each application built. Usability testing (Section 2.6) ensures that application designs are ontarget and allow users to accomplish their tasks with ease and efficiency. Poor usability of speech-enabled applications has a direct cost. In dialogue systems, every user who cannot reach his/hergoals using the VUI will likely be transferred to a human agent or in case of VoiSum will have toretrieve the original audio recordings. The true value of automated applications is that they handleroutine but expensive tasks, thus reducing the volume and duration of calls that must be handledby representatives or by the users themselves. Poor usability negates this value.
Recently there has been a shift from engineering-oriented metrics, which are often limitedto precision and recall, to more HCI-oriented metrics. In evaluation efforts within the DARPACommunicator program [Walker et al., 2000] this was achieved by collecting and analysing usersatisfaction data via web-based questionnaires completed after each session. This data can then becorrelated with system properties (such as accuracy and coverage) using evaluation frameworksto see what parts of the system affect usability and to predict how user satisfaction will changewhen other trade-offs are made.
PARADISE frameworkOne of the first frameworks to integrate engineering-oriented metrics with user input was paradigmfor dialogue system evaluation (PARADISE) [Walker et al., 1998]. This framework was designedto evaluate spoken language agents by comparing the performance of different dialogue strategies,evaluating performance over subdialogues as well as whole dialogues, and comparing systems de-signed for different tasks after normalising for task complexity. PARADISE separates how anagent uses dialogue strategies (e.g. confirmation) from what an agent achieves in terms of taskrequirements (e.g. information transfer) as shown in Figure 8.1. This is achieved through thedefinition of a single evaluation performance function which incorporates measures of both tasksuccess (core information transfer) and costs (efficiency and other qualitative measures). PAR-ADISE uses user satisfaction ratings as an indicator of usability, and calculates the contribution oftwo potential factors (task success and dialogue costs) to user satisfaction using decision-theoreticframework. This evaluation framework is based on the success rate of the information transfer.This is done using an attribute-value matrix, by comparing the matrices for the system and theuser. A confusion matrix, where the off-diagonals represent a mismatch between the system andthe user matrices, is used to calculate the Kappa statistic (Section 2.6.2). Examples of dialoguecosts are the number of total utterances and the number of repair utterances.
The PARADISE evaluation framework has been applied to several spoken dialogue systems.An experimental evaluation of a co-operative versus literal response strategy using hypothesis test-ing in TOOT 3 showed that a combination of response strategy, application task, and task/strategyinteractions account for various types of performance differences. By using PARADISE to esti-mate an overall performance function, interdependencies that exist between the ASR componentand response strategy were identified. PARADISE has also been used to examine the effects of
3TOOT is a spoken dialogue agent that allows users to access train schedules stored on the WWW.

CHAPTER 8. EVALUATION AND USABILITY ISSUES 111
Maximize usersatisfaction
Maximize tasksuccess Minimize costs
Efficiency measures Quality measures
Kappa
Number utterances,dialogue time, etc.
Agent response delay,innappropriate utterance ration,
repair ratio, etc.
Figure 8.1: PARADISE’s structure of objectives for evaluating spoken dialogue performance,after [Walker et al., 1998].
a short tutorial session with a voice-enabled email retrieval system. In the rest of this chapter weevaluate the summarisation performance using subjective and objective measures with and with-out the effects of the other component technology, i.e. ASR. Towards the end we discuss howPARADISE can be adapted to evaluate the components of the VoiSum system.
8.2 Subjective evaluation and usability testing of voicemail sum-marisation
As we have already explained, successful automated speech applications meet the needs of userswho expect highly effective, efficient solutions that are likable and quickly learned. Usabilitytesting is a method for evaluating the quality of the user experience for speech-enabled applica-tions. It reveals diagnostic information on how to improve the application to better satisfy users.Usability testing offers the opportunity to identify and eliminate problems within applications be-fore unveiling them to the public, resulting in time and cost savings for organisations deployingsuch applications. The main goal of the subjective evaluations we performed was to find out whatpeople think of our summarisation models, both in comparative and absolute terms.4 In general,this type of evaluation is characterised by the following limitations:
1. Are the messages that the subjects evaluated really representative of the entire task?
2. Are there enough messages to provide examples of all variations that a summarisation sys-tem is likely to deal with?
3. Are the human subjects sufficiently familiar with the voicemail/summarisation domain andare they putting enough effort into their evaluations, so that order statistics can be takenseriously?
4A MOS evaluation was presented earlier (Section 4.2.2) where we evaluated the summaries produced by the base-line summarisation system. Therein we presented 14 subjects with the message human transcriptions and automaticallygenerated summaries at two compression levels and asked them to determine the relevance.

CHAPTER 8. EVALUATION AND USABILITY ISSUES 112
id Summarisation method1 Manually produced summary from the original human transcription2 Automatically produced summary from the original human transcription3 Manually produced summary from the SR1 transcription4 Automatically produced summary from the SR 1 transcription5 Manually produced summary from the SR2 transcription6 Automatically produced summary from the SR 2 transcription7 Extraction of the first words from the human transcription8 Random extraction of words from the human transcription
Table 8.1: The eight types of summarisation methods applied to five random messages in test42.
All evaluations were conducted in a very controlled environment, where the users were giveninstructions before proceeding with the evaluation. The messages used to conduct these experi-ments were selected for their diversity from both test sets and vary considerably in terms of style,length, WER and consequently difficulty (Appendix C). Regarding the participating subjects inthe experiment of Section 8.2.1 these were computing related professionals (age group: 24-45,sex: 7 male/3 female, origin: 6 native/4 non-native). On the other hand, the subjects participatedin the experiment of Section 8.2.2 comprised 16 Computer Science graduate students (age group:20-28, sex: 12 male/4 female, origin: 14 native/2 non-native, all familiar with WAP).5
In the following results the transcriptions denoted SR1 are those produced by our hybrid con-nectionist system as described in Section 4.1.2 with 41.1% and 43.8% WER on test42 and test50,respectively. The transcriptions denoted SR2 were produced by a considerably more complexhidden Markov model toolkit (HTK) system developed for the Switchboard task and adapted forthe Voicemail task [Cordoba et al., 2002] with 31.0% and 30.9% WER on test42 and test50, re-spectively.6 That system used Switchboard models trained using maximum mutual informationestimation (MMIE) and then adapted to Voicemail corpus using maximum a posteriori (MAP)adaptation techniques [Gauvain and Lee, 1994]. MMIE training [Bahl et al., 1986] maximises themutual information between the training word sequences and the observation sequences. Finally,the transcriptions denoted HT refer to the original human transcriptions of the Voicemail corpus.
8.2.1 Mean opinion score on eight types of summariesIn order to examine the validity of hypotheses H5 and H6 we presented a set of summaries tohuman subjects for evaluation and asked them to score their quality by comparing them withthe original message transcriptions (Section 2.6.1). The summaries are given in Appendix Cand correspond to messages 2, 7, 9, 14 and 26 of test42 (Appendix A for the original humantranscriptions). Each summary has been produced in a different fashion as shown in Table 8.1.7The automatically produced summaries (types 2, 4 and 6) of the above table were produced by thesystem denoted A800 in bottom right subplot of Figure 7.7. This system has the shortest Euclideandistance from the “ideal” summariser. That summarisation system used a k-nearest neighboursclassifier with 0.3 threshold, 0.0 rejection rate and cf1, ne1 all , F0 ran , fp as feature inputs.
We decided to keep the number of summaries to a maximum of 8 as for large numbers ofsummaries with fine-grained differences subjects would have to make finer judgments than mightbe reasonable.8 The results for each message in this experiment are shown in Table 8.2 where
5The same subjects produced the summaries of five messages we compared in terms of agreement in Section 4.2.1.6M. Gales is acknowledged for giving access to their transcriptions for the purposes of this experiment.7During the experiment though the summaries were presented to the subjects in a random order.8This was particulary notable when we also asked some of the subjects to rank the eight summaries instead of

CHAPTER 8. EVALUATION AND USABILITY ISSUES 113
Message no. (test42) 2 7 9 14 26Summaries scoring 1 / Kappa 17 / 0.73 15 / 0.61 16 / 0.74 17 / 0.58 12 / 0.50Summaries scoring 2 / Kappa 18 / 0.11 15 / 0.15 13 / 0.07 17 / 0.16 25 / 0.45Summaries scoring 3 / Kappa 24 / 0.13 32 / 0.49 28 / 0.21 23 / 0.18 20 / 0.29Summaries scoring 4 / Kappa 15 / 0.13 13 / 0.44 15 / 0.19 16 / 0.22 17 / 0.21Summaries scoring 5 / Kappa 6 / 0.20 5 / 0.12 8 / 0.14 7 / 0.15 6 / 0.32Avg. score / Overall Kappa 2.69 / 0.26 2.72 / 0.41 2.82 / 0.29 2.74 / 0.27 2.75 / 0.36
Table 8.2: Inter-subject agreement on eight summaries for each of five random messages in test42as judged by 10 human subjects. The results (Amount of summaries / Kappa statistic) are cate-gorised by score class (1-5) and message number.
the distribution of scores and the inter-subject agreement, measured by the Kappa statistic (Sec-tion 2.6.2) are given. The majority of scores was found to be in the range of 2 to 3 out of 5. TheKappa statistic shows that subjects tend to agree more on which summaries are of low rather thanhigh quality. The overall Kappa statistic for these messages found to be in the range 0.26 to 0.41(poor agreement).
From the same experiment we compiled Figure 8.2 which compares the scores of summariesaccording to their type. The results reveal that the automatically produced summaries (types 2,4 and 6) are consistently better than those produced by random word selection or according to asimple rule (types 7 and 8), but at the same time inferior to those produced by humans (types 1, 3and 5). The above results do support our predictions as given in hypothesis H5.
Regarding the effect of WER, i.e. summary types 1, 3, 5 and 2, 4, 6, it seems that going fromhuman to ASR transcriptions reduces the MOS by over 1 point, whereas going from human toautomatic summary reduces the MOS by about 0.6. This finding did not support our prediction thatthe effects of the summarisation component are as crucial as those of the recognition component(hypothesis H6). A series of objective evaluations (Section 8.3) will follow to investigate thisfurther. Furthermore, it was confirmed that any type of summary would always score higher if thecorrect transcription was to be used as an input (summary types 1, 2; 3, 4 and 5, 6.).
8.2.2 Comprehension and usability testsA series of comprehension tests was conducted in order to examine the validity of hypothesis H7that predicted that automatic summaries enable accurate and fast message comprehension. In thisexperiment subjects either read text summaries or listened to audio recordings and answered toquestions about their content. A set of questions was designed to measure whether the human sub-jects could extract the core information contained in 15 summaries of randomly selected messagesfrom both test sets. We then compared the answers on the same questions when provided the sub-jects with the original audio recordings. The summaries were produced from the HT (messages:10, 18, 32 of test42 and 6, 16, 29, 40 , 47 of test50) and SR1 (messages: 17, 28 of test42 and 4,8, 27, 36, 45 of test50) transcriptions. We chose different messages for HT and SR1 summaries inthis section, as a subject should only see one summary of a message. An alternative would havebeen to have had half the subjects see an HT summary of message m, the other half see a SR1 sum-mary of the same message. This would have enabled comparisons between HT and SR1 statisticson the same message, although at the cost of fewer results for a given recognition/summarisationcondition. All summaries of this experiment were produced by the system denoted A800 in bottomright subplot of Figure 7.7. That summarisation system used a k-nearest neighbours classifier with
scoring them.

CHAPTER 8. EVALUATION AND USABILITY ISSUES 114
4.3
3.1
2.4
3.2
1.41.1
2.6
3.8
0.0
1.0
2.0
3.0
4.0
5.0
1 2 3 4 5 6 7 8Type of summary
Mea
n op
inio
n sc
ore
Figure 8.2: Average MOS on 8 types of summaries explained in Table 8.1 for each of 5 messagescontained in test42 as judged by 10 subjects.
0.3 threshold, 0.0 rejection rate and cf1, ne1 all , F0 ran , fp as feature inputs. During this evaluationsession for each message we asked the following questions:
1. Who called?
2. Purpose of call?
3. Message priority? (select from high, medium or low)
4. Contact telephone number?9
For the majority of the messages we provided the subjects with the minimum background infor-mation that we assumed that would be known to the intended recipient of the original message(Appendix D). The interface we designed is depicted in Figure 8.3 and includes a WAP phoneemulator.10 Spelling errors were ignored in proper names, ‘do not know’ answers were consid-ered as incorrect and partially incorrect telephone numbers were considered as incorrect. Prior toanalysing the answers we collected, it is useful to look at the corresponding summaries. There wecan see that transcription errors in message 17 of test42 lead to an incorrect contact number (8268instead of 2688). Similarly, a deletion (digit ‘five’) in message 40 of test50 lead again to anotherincorrect contact number (3402878 instead of 53402878). In message 47 of test50 two contactnumbers are provided (1614 or 1615) while in the summary they appear concatenated. In general,it would be useful if the user knew how many digits a contact number is expected to have so thata summary entry can be validated.
The aggregate results related to questions 1, 2 and 4 are given in Table 8.3, while those re-lated to question 3 in Table 8.4. From the first table we can see that the identity of the caller wasdetermined correctly 94% and 57% for the summaries produced using the HT and SR1 transcrip-tions, respectively. The answers regarding the purpose of call gave a 78% correct result for bothtypes of transcriptions. The contact telephone numbers were found to be 82% and 80% correct
9Not all messages contained a telephone number.10The Nokia 7110 from http://wapsilon.com/ was used for this experiment.

CHAPTER 8. EVALUATION AND USABILITY ISSUES 115
Figure 8.3: A glimpse of the interface we designed for audiovisual assessment of the application.Its purpose was first to collect the answers regarding message comprehension for comparisonsand second to estimate the time needed to read text summaries versus retrieving the original audiomessages.
for HT and SR1 derived summaries, respectively. Finally, a significant difference (30% for HTand 53% for SR1) was found among the answers regarding whether the original audio should beretrieved to validate the summary contents. The above results suggest that transcription errorsaffect mainly the identity of the caller while they lead to 23% more retrievals of audio recordingsas users were not confident that the information they read in a summary corresponded to the fulland correct content (although with the exception of proper names the summaries alone proved tobe sufficient).
The analysis of the results also revealed that human listeners were not always correct in pick-ing up telephone numbers and the callers’ names from the audio recordings. This happened despitethe fact that they could have listened again the voicemail messages to verify their answers. In par-ticular, we found that one, four and three subjects misrecognised the telephone numbers containedin messages 32 (test42), 06 (test50) and 47 (test50), respectively. The automatic summariser usingthe correct human transcription as input had extracted these telephone numbers correctly. At thesame time ten subjects failed to recognise correctly the telephone number contained in message 17(test42). The ASR component and subsequently the recogniser failed to recognise it too. Regard-ing the name of the caller, two and nine subjects failed to recognise the caller names in messages10 (test42) and 29 (test50) while the summariser using the correct human transcription as inputextracted it correctly.
The confusion matrices depicted in Table 8.4 suggest that the human subjects were able todetermine the messages’ priority accurately from the text summaries. In particular, the priority ofmessages was determined with consistency 62.5% of the times for HT and 58.1% for SR1 aftercomparing the results based on text summaries and the audio recordings. The cases where thesubjects completely misjudged the message priority from the text summaries were 2.3% (judgedas high while from the summary they thought it was low) and 4.5% (judged as low while fromthe summary they thought it was high). The above results support the prediction of hypothesis H7

CHAPTER 8. EVALUATION AND USABILITY ISSUES 116
HT transcriptionTest set test42 test50
Message no. 10 18 32 06 16 29 40 47 Avg.Who called Correct 100 100 100 100 100 100 75 75 93.75
Part. correct 0 0 0 0 0 0 25 0 3.125Incorrect 0 0 0 0 0 0 0 25 3.125
Purpose Correct 93.75 75 - 75 81.25 81.25 56.25 81.25 77.68Part. correct 0 18.75 - 12.5 6.25 18.75 31.25 12.5 14.28
Incorrect 6.25 6.25 - 12.5 12.5 0 12.5 6.25 8.04Contact no Correct - 100 100 93.75 - 100 0 100 82.29
Incorrect - 0 0 6.25 - 0 100 0 17.71Retr. audio Yes 12.5 62.5 18.75 50 12.5 37.5 37.5 6.25 29.69
No 87.5 37.5 81.25 50 87.5 62.5 62.5 93.75 70.31
SR1 transcriptionTest set test42 test50
Message no. 17 28 04 08 27 36 45 - Avg.Who called Correct 31.25 75 0 93.75 0 100 100 - 57.14
Part. correct 12.50 18.75 0 0 0 0 0 - 4.46Incorrect 56.25 6.25 100 6.25 100 0 0 - 38.40
Purpose Correct 100 75 93.75 87.50 56.25 87.50 43.75 - 77.68Part. correct 0 12.5 0 0 25 12.5 43.75 - 8.93
Incorrect 0 12.5 6.25 12.5 18.75 0 12.5 - 8.93Contact no Correct 0 100 - 100 100 100 - - 80
Incorrect 100 0 - 0 0 0 - - 20Retr. audio Yes 18.75 93.75 81.25 43.75 75 37.5 18.75 - 52.68
No 81.25 6.25 18.75 56.25 25 62.5 81.25 - 47.32
Table 8.3: Comparison of the answers given by 16 subjects who were presented with text sum-maries and the original audio of 15 voicemail messages.
that text summaries can offer accurate message comprehension – with some exceptions of courseparticularly related to proper names unknown to the system.
In order to examine whether the claim of faster message comprehension (hypothesis H7) basedon the summaries was true, we recorded how much time users needed to accomplish voicemailunderstanding and the results are summarised in Figure 8.4. Although not directly comparable(since each message was used in one form only), the average comprehension time after readingthe summaries produced using the HT output was 33.2 sec, while for the SR1 was 42.7 sec (a30% increase). These times include the time required to type the answers in the appropriatefields (Figure 8.3). This favours the audio retrieval case, where users can listen to the recordingwhile typing versus the text summaries where they have to browse the mobile display to find theappropriate bit of information prior to typing it. On the other hand, the subjects retrieved theaudio recordings on average 1.5 and 1.6 times for the HT and SR1 summaries, respectively. Thelength of the original audio in seconds should not be confused with the time required to listen avoicemail message as in the real world significant connection overheads (such as typing a PIN)have to be taken into account. The above results are inconclusive regarding the speed of decisionmaking as part of hypothesis H7. The average fastest decisions are divided among the audio andsummary retrievals and given the limitations we discussed in Section 8.2 further investigation willbe necessary to validate this part of the hypothesis H7. However, after the completion of eachsession we asked the users whether they were likely to use such a service regularly to access theirvoicemail messages while away from office or home and 13 out of 16 (81%) answered positevely.

CHAPTER 8. EVALUATION AND USABILITY ISSUES 117
HT transcriptionLow Medium High
Low 7.0 8.6 0.0Medium 6.3 22.7 10.9High 2.3 9.4 32.8
SR1 transcriptionLow Medium High
Low 12.5 12.5 2.7Medium 5.4 31.3 10.7High 1.8 8.9 14.3
Table 8.4: Message priority confusion matrices as determined by 16 subjects who were initiallypresented with the automatically produced text summaries and later with the original audio of 15messages. Each column corresponds to the percentage of messages classified as low/medium/highpriority based on text summaries and each row gives the percentage of messages classified aslow/medium/high priority based on the original audio. The degree of consistency across judge-ments can be determined by summing up the diagonal values.
8.3 Objective evaluation of voicemail summariesIn extractive speech summarisation, for a word contained in a summary to be correct there aretwo requirements: the particular instance of the word must have been correctly transcribed andassigned to the correct class. Wrong transcription leads to substitution errors. Regarding clas-sification, false positives lead to insertion errors and false negatives lead to deletion errors. Tocalculate any of these errors a correct transcription of the summary is required and the SER iscalculated by aligning and comparing the content words flagged by the summariser with thoseannotated in a human-generated reference transcription (hypothesised summary).11
Marking schemeA word hypothesis whyp may only be marked as correct if an identical word wref exists in thetime-aligned reference transcription such that greater than 50% of the interval spanned by whypoverlaps with that of wref and vice versa. The last condition makes it possible to identify deletionerrors. This marking scheme was proposed by [Weintraub et al., 1997] to compute confidencemeasures for word recognition and is shown in Figure 8.5. The error for each word in the targetsummary is set to zero if transcription and classification are all correct, otherwise a 0.5 penalty isadded for every transcription or classification error.
Discussion on SERAlthough SER does not forgive transcription errors, it penalises them partially and therefore it isa good diagnostic for the development of speech summarisation systems. Despite the fact thatSER metric allows summary evaluation in terms of accuracy and completeness by determiningwhether key content has been correctly transcribed and captured, a drawback can exist whenevercontent words are repeated several times within a message and fewer instances of them have beenidentified as target words by the human annotators. This can lead to both deletion and insertionerrors even if the correct words appear in both the target and hypothesised summaries. In orderto reduce the bias introduced by a single ‘ideal’ summary during calculating the SER, we cancompare with extracts chosen by a majority of annotators.12 For every word wn marked by the
11In contrast to ROC curves, SER refers to a single operating point.12Though, this is most of the times prohibitively expensive.

CHAPTER 8. EVALUATION AND USABILITY ISSUES 118
0.0
10.0
20.0
30.0
40.0
50.0
60.0
10 (te
st42)
17 (te
st42)
18 (te
st42)
28 (te
st42)
32 (te
st42)
04 (te
st50)
06 (te
st50)
08 (te
st50)
16 (te
st50)
27 (te
st50)
29 (te
st50)
36 (te
st50)
40 (te
st50)
45 (te
st50)
47 (te
st50)
Message number
elap
sed
time (
in se
c)
0.0
0.5
1.0
1.5
2.0
2.5
3.0
times
retri
eved
audi
o
time reading HT summariestime reading SR summariestimes retrieved audiolength of original audio
1
Figure 8.4: Message comprehension times comparing accessing the text summaries and origi-nal audio on a WAP phone emulator. Summaries used were produced using both HT and SR1transcriptions.
annotators we can define a weighted SER measure as follows:
SERN
∑n 1
SUBwn DELwn INSwn
NAwn (8.1)
whereAwn
AnAT
(8.2)
where An is the number of annotators that have selected wn and AT is the total number of anno-tators produced summaries of a particular message. Awn carries information about the level ofagreement among annotators but does not require to specify the degree in which we expect themto agree.
8.3.1 Summaries evaluation based on SERThe notation we use to express the extractive summarisation scores in this section are as follows.CORR refers to correct transcription and correct classification while SUB denotes wrong tran-scription and correct classification. DEL refers to words in the reference that failed to be extractedby the summarisation system and INS denotes non-target words that have been included in thesummary. Finally, SER is equal to the sum of the above three types of errors – SUB, DEL andINS. The columns entitled Baseline show the ratio of words with correct content and correct ex-tent over the number of target words in a message when as summary we consider the first 30%and 20% of the words contained in the speech recogniser’s output and the human transcription fortest42 and test50, respectively. Any stop words were excluded from these transcriptions prior toevaluating the summaries. Calculation of other types of errors is not possible from these partialalignments corresponding to the beginning of each message.

CHAPTER 8. EVALUATION AND USABILITY ISSUES 119
correct
REF
HYPincorrect
w1 w2
w1 w2
Figure 8.5: A schematic illustration of the 50% overlap criterion used to assess the time alignmentof the hypothesised summary, after [Weintraub et al., 1997].
binary decision task / test42Baseline A800 B800 C800
SR1 HT SR1 SR2 HT SR1 SR2 HT SR1 SR2 HTCORR(%) 27.8 38.3 48.7 60.2 78.8 50.1 59.0 73.4 52.2 61.1 82.4SUB(%) - - 10.5 12.6 1.5 10.9 12.2 2.1 12.4 13.0 1.3DEL(%) - - 30.3 14.6 18.2 28.2 16.6 22.3 23.0 12.8 15.0INS(%) - - 28.1 29.5 20.2 23.3 25.4 15.5 27.5 31.0 21.8SER(%) - - 68.9 56.7 39.9 62.3 54.2 39.9 62.9 56.8 38.1
binary decision task / test50Baseline A800 B800 C800
SR1 HT SR1 SR2 HT SR1 SR2 HT SR1 SR2 HTCORR(%) 18.3 31.0 47.2 54.3 69.6 46.4 52.3 70.4 50.4 55.2 76.2SUB(%) - - 9.4 12.0 1.8 8.6 10.3 2.2 9.9 11.0 1.6DEL(%) - - 34.1 21.8 26.8 36.4 27.0 25.2 29.9 22.7 20.7INS(%) - - 29.7 35.0 29.3 26.5 32.2 23.8 30.8 37.1 28.8SER(%) - - 73.2 68.8 57.8 71.6 69.5 51.2 70.6 70.8 51.1
Table 8.5: Extractive summarisation scores for the binary decision task on test42 and test50 aftertraining using 800 voicemail messages.
For the binary decision task the summaries produced by the systems denoted A800, B800 andC800 are depicted in the bottom right graph of Figure 7.7. The SER results on this task are givenin Tables B.4 and 8.5. The comparison of the baseline scores with those obtained by the actualsystems reveals clear superiority of the latter. For test42 in the baseline HT summary there are38% relatively more correct words than in the one produced using the SR1, while the equivalentfigure for test50 is 69%. In contrast, the differences between SR1 and HT in our summarisationmodels are lower (approximately 25%). The summarisation system A800 used a knn classifierwith 0.3 threshold, 0.0 rejection rate and the cf1, ne1 all , F0 ran , fp as feature inputs. The scoresof A800 classification systems are also compared in Figures 8.6. Summaries based on SR1 resultin a higher SER than SR2 summaries, and it can be seen that the additional errors for SR1 aredeletions, which may arise due to more summary words being misrecognised. Summaries basedon HT have the lowest SER, as expected. Although the deletion rate is higher for the humantranscription compared with SR2, recognition errors also give rise to summarisation substitutions.The system B800 was based on the Gaussian classifier with 0.7 threshold and 0.1 rejection rate,while the input features compised ne1 all , cf2 and dur1. The third system denoted C800 used a 0.3threshold and 0.0 rejection rate within a knn classifier with cf1, ne1 all , F0 ran , fp as input features.

CHAPTER 8. EVALUATION AND USABILITY ISSUES 120
test42
0102030405060708090
CORR SUB DEL INS SERExtractive summarisation scores
SR1
SR2
HT
test50
0
10
20
30
40
50
60
70
80
CORR SUB DEL INS SER
Extractive summarisation scores
SR1
SR2
HT
Figure 8.6: Extractive summarisation scores on the binary decision task produced by the A800classification systems (Table 8.5) on test42 and test50 respectively for SR1, SR2 and HT inputtranscriptions.

CHAPTER 8. EVALUATION AND USABILITY ISSUES 121
For HT, 80% and 72% correct classification was achieved on test42 and test50, respectivelywhile the baseline systems got only 38% and 31%. For the SR1 transcriptions, 49% and 47%correct content and classification was achieved on test42 and test50, respectively. At the sametime, for the SR2 transcription scores were consistently higher, 60% and 55% correct content andclassification on test42 and test50, respectively. The significant difference between scores whenthe human transcription is assumed shows what a bottleneck the ASR component can be. For SR1output deletions count for about 26% and 33% in system A that has the best trade-off between trueand false positives. The equivalent scores for SR2 output were lower at 15% and 22%. Finally, SER scores for test50 follow the same patterns but are poorer than those for test42 primarilydue to a higher deletions rate as a result of the relatively long duration of the messages containedin the test50. The above results once again do not support our prediction that the effects of thesummarisation component are as crucial as those of the recognition component and thereforehypothesis H6 is not valid.
test42
0102030405060708090
CORR SUB DEL INS SERExtractive summarisation scores
SR1
SR2
HT
test50
0
10
20
30
40
50
60
70
80
CORR SUB DEL INS SER
Extractive summarisation scores
SR1
SR2
HT
Figure 8.7: Extractive summarisation scores for the multi-class task produced by the A800 classifi-cation systems (Table 8.5) on test42 and test50 respectively for SR1, SR2 and HT input transcrip-tions.
The results of Tables B.4 and 8.5 show rather unexpectedly that B and C classifiers can occa-sionally offer a slightly lower error rates than the prime system A. This can be explained by thefact that the operating classifiers A, B and C where optimised for the validation test and the aboveresults are on unseen data i.e. test42 and test50.

CHAPTER 8. EVALUATION AND USABILITY ISSUES 122
For the multi-class task the summaries were produced after combining the MLP classifiersshown in Figure 7.11 according to the method described in Section 7.3.3. The classifier for propernames was using ne1 nam and F0 off as input features. The one for telephone numbers was usingne1 tel and dur1. The classifier to select dates and times was using as input features ne2 d tand F0 off . Finally, the classifier to extract the remaining target words used cf1 and cf2 as inputfeatures.
The scores derived from the SER based evaluation on the multi-class task is given in Fig-ures 8.7 and Table B.5. Although the overall summary word detection rate was not improved incomparison with the binary task, names, dates and times, and numbers could be detected with ahigher accuracy which could be utilised if further processing of the summaries was required. Theresults follow similar patterns to those observed for the binary decision task. In particular, the SERon test42 found to be 63%, 53% and 41% for SR1, SR2 and HT outputs, respectively. Regardingtest50 the SER scores were 76%, 72% and 61% for SR1, SR2 and HT outputs, respectively.
0.05 0.1 0.15 0.20.55
0.6
0.65
0.7
0.75
0.8
0.85
1−specificity
sens
itivi
ty
800 messages
A800
A800A800
B800
B800B800
C800
C800C800
A800
A800A800
B800
B800
B800
C800
C800
C800
0.05 0.1 0.15 0.20.55
0.6
0.65
0.7
0.75
0.8
0.85
1−specificity
sens
itivi
ty
800 messages
A800
A800
A800
A800
A800
A800
test42 (SR1)test42 (SR2)test42 (HT)test50 (SR1)test50 (SR2)test50 (HT)
Figure 8.8: ROC operating points of the binary decision task summarisers (left graph) whoseoperating points shown in bottom right subplot of Figure 7.7 and the multi-class task summariser(right graph) whose operating points shown in Figure 7.11 after combining them according to themethod described in Section 7.3.3. The operating points correspond to test42 and test50 for SR1,SR2 and HT input transcriptions.
The role of summary post-processingThe post-processing algorithm we described in Section 7.4 was applied prior to calculating the ex-tractive summarisation scores. The algorithm decreases insertions due to the use of the stop wordlist. It also tends to decrease deletions and increase correct extent due to the way proper names,acronyms and digits are handled. Finally, substitutions remain unchanged as post-processing doesnot perform any word replacements. Note that substitution errors for configurations that makeuse of the human transcriptions are non zero as one would expect. This error is introduced bythe method we used (Figure 8.5) to examine word extent based on the 50% requirement of time-aligned reference and hypothesis transcriptions.

CHAPTER 8. EVALUATION AND USABILITY ISSUES 123
binary decision task / test42A800 B800 C800
SR1 SR2 HT SR1 SR2 HT SR1 SR2 HTVTA 75.15 80.55 83.70 77.00 83.00 84.10 78.30 84.10 84.20
binary decision task / test50A800 B800 C800
SR1 SR2 HT SR1 SR2 HT SR1 SR2 HTVTA 76.20 81.25 81.55 75.85 79.30 83.50 78.20 80.20 84.75
multi-class task / test42A800
SR1 SR2 HTVTA 78.80 81.50 85.75
multi-class task / test50A800
SR1 SR2 HTVTA 75.20 76.75 80.30
Table 8.6: The VTA values for the summarisers whose operating points shown in the graphsdepicted in Figure 8.8. The VTA values have been multiplied by a factor of 100 to give a numberthat is similar to percent classification. The results correspond to test42 and test50 for both speechrecognition output and human transcription.
8.3.2 Summaries evaluation based on ROC analysisThe goal of this experiment was to examine whether the ROC analysis employed for training andvalidation purposes could be used to conduct the actual evaluation of the summaries produced. Forthis purpose, we calculated the sensitivity and (1-specificity) values for each of the summarisationsystems whose operating points depicted in Figures 7.7 and 7.11. As the automatic transcriptionof the test sets contained transcription errors we give results for both human transcription andspeech recognition output. We used the marking scheme described in Section 8.3 according towhich transcription errors affect the true positive rates by a penalty of 0.5. The results of ROCanalysis on test42 and test50 are shown in Figure 8.8. As ROC operating points form a closelyspaced cluster and for better visibility we only show the relevant part of the ROC space.13
From these ROC curves we also calculated the triangulation area specified by the coordinatesof the operating point, as defined by Equations 7.3 and 7.4, and the points 0 0 and 1 1 . Werefer to this measure as vertex triangulation area (VTA).14 The results for the training set of 800messages are given in Table 8.6. Results for smaller training sets are given in Table B.6. In thesetables, we multiply the VTA values by a factor of 100 to give a number that is similar to percentclassification, with 50 indicating random and 100 indicating perfect classification. VTA followssimilar patterns to those of SER, but the differences among results are of smaller range and thusthey are not as discriminatory as SER.
13Alternatevely, DET curves (Section 2.4.2) could be used.14One disadvantage of this measure is that it favours operating points with higher false positives.

CHAPTER 8. EVALUATION AND USABILITY ISSUES 124
Maximise qualityof service
Maximisesummary quality
Minimisedelivery cost
task completion | user expertise
errors appearance completion time throughput
Figure 8.9: Evaluation framework of voicemail summarisation for mobile messaging. Its goal isto determine which evaluation metrics maximise summary quality and minimise delivery costs bycombining user data and comparing system configurations with different trade-offs. The metricsassociated with this framework are listed in Table 8.7.
8.4 Evaluation framework for voicemail summarisationIn order for a new messaging system to be successful, it must fulfill two important criteria: firstly,it must offer some new functionality that delivers added value (e.g. in terms of cost or conve-nience) to the user and secondly, the delivered content must be of adequate quality so it can beadopted by a large number of users. The trade-offs among accuracy, coverage, and speed can beintuited to some extent, but there is little quantitative evidence to back up the claims or to help asystem developer decide which aspect to focus on for a particular application. The goal for theproposed framework is to relate accuracy, coverage, and speed to usability by gathering user dataand comparing systems that make different trade-offs. A high quality summary must minimallycontain the information whose transfer is the purpose of the message and delivered effectively ona mobile terminal. However, there are many other criteria which enable us to judge on a deliveredsummary as being of better quality than another. This requires more powerful, i.e. general butadaptable methods.
Overall, the PARADISE evaluation framework (Figure 8.1) offers many advantages in mea-suring and comparing performance of spoken dialogue systems. It facilitates the comparison ofdifferent dialogue strategies and empirically finds the main contributing factors to user satisfac-tion, which is considered to be the major correlate of performance. The selection of user satis-faction as the top-level criterion can be argued for its generality. Depending on the system oneneeds to evaluate, the top level goal can be anything (e.g. total elapsed time, amount of moneysaved). One disadvantage of this framework is the amount of work required to tag the dialogueswith the attributes for the task. For a complex task defining an adequate set of attributes can alsobe difficult. It is not also clear how this evaluation framework will apply to subdialogues. Anotherissue that raises questions is the set of values for an attribute. This framework assumes that thereis a finite set of values and the set of values depends on the dialogues used in the study, not thewhole domain. There may be cases where the set of values is not finite, or the whole set is notrepresented in the dialogues used in the evaluation. This framework might not be able to capture anon-uniform distribution of values. Another limitation of PARADISE is related to the fact that itmodels performance as linear combination of the task success and dialogue costs. A method withapplicability into variable cost domains could be used instead.

CHAPTER 8. EVALUATION AND USABILITY ISSUES 125
errors appearence completion time throughputSER or weighted SERWERF-measure
usage of post-processingalgorithm to correct sum-marisation errorsutilisation of mobile dis-playminimisation of scrolling
elapsed time betweenmessage recording andsummary delivery
amount of data trans-ferred successfully fromthe voicemail server tothe mobile client in agiven time period
Table 8.7: Metrics related to the proposed evaluation framework for the VoiSum system.
We adapted the key components of PARADISE in order to reflect the needs of VoiSum system.The overview of the proposed framework is depicted in Figure 8.9. The objective of this frame-work is to achieve the highest possible quality of service for this application. This is expressed bytask completion given the expertise of the user. Quality of service is of particular importance in anenvironment with limited communication resources, limited bandwidth, and possible degradationof service due to several types of errors.
Although there are several options introducing biases at a different level when applying such aframework, in general metrics should be calculated without human intervention. The advantagesare that human effort is reduced by automating the process and that this is less biased by subjec-tive views. It was our objective to employ metrics for a generic architecture, and thus could beused without referring to the implementation of the summarisation system. Parcel feature selec-tion framework is well suited for such task as almost no assumptions need to be made prior toevaluating the role of different metrics.
Regarding the maximisation of the summary quality and minimisation of delivery time themetrics described in Table 8.7 can be calculated and analysed. The errors (first column) need tobe estimated for each voicemail message. Although these error metrics can be calculated auto-matically, correct transcriptions and annotated summaries are required to align and compare thecontent words flagged by the summariser with those annotated the hypothesised summaries. Fac-tors related to the appearence of text summaries on the screen on a mobile client (with an HCIperspective)15 are listed in the second column of Table 8.7. Regarding the parameters affecting thecompletion time (third column) see Section 4.4. The extraction of prosodic features is unlikely tohave a significant effect on this, however calculation of lexical features might take longer. In termsof throughput (fourth column), the selection of SMS as a bearer for delivering summaries raisesquestions about the degree of utilisation of the short messages required to deliver the summary ofeach spoken message.
Although our initial objective was to use the results of Section 8.2.2 within the proposedevalution framework soon we found that the amount of data was too little to conduct this exper-iment. Instead of solving for weights on the success and cost measures using multivariate linearregression as in PARADISE, we intended to use the Parcel algorithm to calculate the role of eachmetric to the overall system performance. This is a straightforward and possibly much more ro-bust process as the metrics are numerical values that can be used as inputs to our classifiers thatwill be trained and validated using task completion as perceived by human subjects as an externalcriterion.16 However, user data from the analysis of 16 15 summaries was insufficient to trainclassifiers and subsequently performing metric selection.
15[Buyukkokten et al., 2001] conducted studies related to the access times and number of stylus actions for browsingWWW pages on small screens.
16Parcel is so generic that it could include the weightings derived from linear regression as a component classifier.
CHAPTER 8. EVALUATION AND USABILITY ISSUES 126
8.5 Concluding discussionSpeech summarisation can be evaluated by many methods and at several levels. All methodsgive some kind of information on summary quality, but there is not a widely accepted evaluationmethod. A speech summarisation system must take into account the limitations of the ASR com-ponent and human factors such as the user expectations and the level of expertise. This chapter de-scribed a number of subjective and objective evaluation measures we applied on unseen test data.The questions we were looking to answer were related to the effects of WER and the effects ofautomatic summarisation. Our subjective evaluations showed that errors can have serious conse-quences because they can destroy the user mental model for the application, i.e. having to retrieverecorded audio messages whenever a poor quality summary is provided. The objective evaluationsrevealed that SER and VTA are good measures (with some limitations though) of summary qual-ity and that both are correlated with the amount of transcription errors. The main results from theexperiments presented in this chapter were that the automatic summaries were inferior to humansummaries, but there was a greater perceived quality difference between summaries derived fromhand- and automatically-transcribed messages, than between manual and automatic summarisa-tion. In theory, by focusing on the targeted users of the application and studying the most frequenterrors, it is possible to feedback this knowledge to the design itself. However, speech summarisa-tion is a non-trivial task and one has to take into account interdependencies among types of errorsgiven restrictions by available resources and the end-user. PARADISE framework is particularlysuited for such tasks and we adapted its metrics for the purposes of the VoiSum system. Designingwith criteria that minimise a series of errors and maximise utilisation of available resources is animportant step towards improving usability and overall quality of service.

9. Conclusions and future work
This thesis has provided a framework that allows comparisons and integration of patternspresent in voicemail messages for constructing summaries for mobile messaging applications.The VoiSum architecture integrates in a transparent way multiple information sources at the wordlevel to generate terse summaries. We have described our message summarisation approach anddiscussed the challenges and technical progress associated with the automatic transcription, theextraction of lexical/prosodic features and the classifier/feature subset selection process. The sys-tem’s components were evaluated systematically using objective methods, while the summariesproduced were evaluated by both objective and subjective methods. This chapter discusses thegeneral research approach and reviews the main contributions of this research to the body ofknowledge. A summary of the thesis findings and the conclusions derived from them follows.Issues for future research based on this thesis are also outlined.
9.1 General approach of the thesisThis thesis has investigated new methods for automatic speech summarisation. It was particu-larly concerned with the automatic summarisation of voicemail messages and makes scientificand technical contributions to the use and interaction of ASR, speech summarisation and mobilemessaging technologies. Voicemail provides a dynamic and challenging domain with a relativelyhigh WER, a virtually unlimited vocabulary and a high density of name phrases. At the sametime, small displays and limited bandwidth create a challenging design environment for deliver-ing voicemail summaries.
This thesis has integrated three diversified component technologies in an attempt to extract anddeliver spontaneous and task independent speech content in a format suitable for delivery/viewingon portable devices. The work described herein is characterised by solid theoretical and empir-ical motivation and sound methodology so that useful lessons can be learned from the results.
127

CHAPTER 9. CONCLUSIONS AND FUTURE WORK 128
The two general approaches to problem solving, namely rule-based and machine learning are em-ployed. A rule-based approach was used to construct the baseline system (Section 4.2.2) whichwe subsequently augmented with information derived from prosodic cues using machine learning.
9.2 Contributions of the thesisThe main contributions of this thesis can be summarised as follows.
Advanced architecture for wireless voicemail content retrieval (Chapters 1 and 4).We derived an architecture that overcomes the limitations of the existing voicemail retrievalparadigm by creating and forwarding text summaries of incoming messages to mobile ter-minals. Suitable component technologies were identified for the above architecture and weconducted an extended literature review to establish their advantages and limitations. Apush model was adopted that minimises unnecessary request activities by users which inwireless environments would also mean inefficient and wasteful use of network resources.We also built an end-to-end demonstration system for the summarisation of voicemail mes-sages and the distribution of the summary to a mobile phone handset. Text compaction andsummary post-processing techniques suitable for this application were designed. A seriesof feasibility studies was conducted and estimated the time required to create and delivervoicemail summaries.
Applicability of hybrid connectionist/HMM speech recognition framework to the voicemailtask (Chapter 4).We built a compact system that uses a fraction of parameters than those required byGMM/HMM systems and achieved competitive recognition accuracy. The transcriptionerrors were reduced by combining PLP and MSG acoustic front-end and by augmentingthe textual data used to train the language models with task specific compound words andsimilar utterances from BN and Switchboard corpora.
Annotation of data and development of related tools (Chapter 4).We designed an annotation protocol for voicemail summarisation and manually annotated1092 messages contained in the IBM Voicemail Corpus to create reference summaries fortraining, validation and testing purposes. Patterns in summarisation style and the degree ofagreement among 16 annotators on a subset of messages were also studied. Subsequentlywe designed a methodology to automatically extract a large number of lexical and prosodicfeatures and associate them with the ASR output.
Feature subset and classifier selection for speech summarisation (Chapter 7).The limitations of existing feature selection algorithms with respect to variable or unknowncosts were described. We adopted Parcel as a feature selection approach that is based onROC analysis and builds on the hypothesis that different feature sets and classifiers can beoptimal at different points in precision-recall space. A series of experiments were conductedon human transcriptions with Parcel to establish the role of the training data size, classifiertype and lexical/prosodic features. Using unseen test data we demonstrated that it is possibleand desirable to avoid single commitment to a single classifier or feature set during design-ing a general purpose summarisation system (e.g. one with unknown costs). We came upwith as many as different subsets are necessary to produce satisfactory performance acrossall costs.

CHAPTER 9. CONCLUSIONS AND FUTURE WORK 129
Role of prosody in speech summarisation (Chapter 7). We integrated automatically derivedprosodic features and lexical features at the word level to generate summaries of spokenmessages. The role of individual features on discrimination between word classes wasstudied using a linear classifier. Features related to energy, duration and pauses were foundto be consistently useful. We also found that combined lexical and prosodic features are atleast as robust as combined lexical features alone across all operating conditions.
Review and development of evaluation procedures (Chapter 8).Existing evaluation methods for summarisation systems were reviewed. We evaluated thequality of summaries produced using purpose designed subjective and objective measures.A close to linear relation between the number of transcription errors and summarisation er-rors produced was found suggesting that the provision of closely integrated, accurate ASRis essential for successful speech summarisation applications. We also proposed a frame-work for voicemail summarisation that combines system and usability attributes in a waythat determines which metrics maximise the summary quality and minimise the deliverycosts and thus satisfying most of the users most of the time.
The outcome of the thesis regarding the combination of lexical and prosodic cues can be usedby designers of spoken audio IE and IR systems. Since prosody is independent of word identity,it can offer complementary information in related tasks. The architecture of VoiSum can also beused by mobile messaging service providers to extend their service portfolio. Furthermore, theservice and content providers can perceive an indication of the quality of the summaries producedand the time required to deliver them on mobile terminals. It remains to be seen how far thedescription of tasks other than voicemail and in other human languages, drawing on the existingand future work, can be accommodated within a system such as the one we have presented in thisthesis. It is our view that a methodology based on extraction and integration of different levels ofinformation, will continue to be an extremely interesting approach for building automatic speechsummarisation applications.
9.3 Summary of the experimental resultsThis thesis has provided a framework that allows comparisons and integration of patterns presentin voicemail messages for constructing summaries for mobile messaging applications. We madea series of hypotheses the validity of which we examined experimentally. The hypotheses and themain outcome of the related experiments follows.
H1 A hybrid connectionist/HMM system can provide good performance on the Voicemail task.A relatively simple ASR system with components trained using the Voicemail corpus andother corpora gave adequate recognition accuracy (41.1 and 43.8% WER on the two Voice-mail testsets). These error rates are not as good as to those obtained by the best performingsystems (which are GMM based), but the best systems are much more complex e.g. speakeradaptation and context-dependence. In the hybrid connectionist/HMM system the combi-nation of acoustic probabilities of different systems in the log domain proved to be a simpleand effective method to increase noise robustness. That was particularly true in the caseof MSG features which provided significant gains as part of a combination with the PLPbaseline. Further improvements were due to augmentation of the textual data used to trainthe language models with task specific compound words and similar utterances from BNand Switchboard corpora.

CHAPTER 9. CONCLUSIONS AND FUTURE WORK 130
H2 SMS is adequate for transmitting voicemail summaries. We demonstrated that key contentfrom an average voicemail message could be encapsulated in a couple of SMS messages andthe time required for creating and transmitting the summaries is relatively short. Accordingto our testbed architecture and message submissions, a typical spoken message contained inthe Voicemail corpus with duration of 31 sec can be delivered as a text summary on a WAPcompatible terminal within approximately 54 sec. Further, the usability tests we performedshowed that users did not had difficulty browsing the mobile display in order to find therequired information.
H3 Lexical and prosodic features have a complementary role of similar significance within thesummarisation component. We confirmed experimentally that a subset of both lexical andprosodic features will be present in the feature sets that produce good quality summaries.However, our experiments did not support that part of the hypothesis predicting that prosodyencoded as raw features not only would increase the robustness of the summarisation com-ponent but occassionaly would surpass the accuracy offered by the lexical features alone.For the binary decision summarisation task we found that lexical features as classifier in-puts clearly dominate prosodic features in all intervals of thresholds. The combination oflexical and prosodic features gave superior accuracy compared with any single constituentclassification system. The lowest FP rate is achieved using lexical features alone. Prosodicfeatures extend the system’s classification capabilities for TP 0 4. In contrast, prosodicfeatures alone tend to produce relatively high TP and FP rates.
H4 A small but variable number of features is adequate for performing summarisation. Our orig-inal hypothesis that a dimension-reduced feature set would only be necessary in order toproduce a set of accurate summaries proved to be correct. The distributions of most lexicaland prosodic features varied considerably for different target classes; however, the extentof overlap among classes was also significant. We found several dimension-reduced vec-tors of prosodic and lexical features that are adequate for classifying the words containedin spontaneous spoken messages. The features most often selected in the binary decisionsummarisation task were F0 range, following pauses and duration. We also found thatalmost every single feature subset contributing to the MRROC of lexical and prosodic fea-tures contains NE matching and collection frequency features. For each of the classes inthe multi-class summarisation task we found that proper name entries were best correlatedwith class specific NE matching offering close to optimal classification. Collection fre-quency also offered good discrimination while location information found to have strongnegative correlation with the proper names, indicating that proper names appear most of-ten at the beginning of messages. We also observed a low acoustic confidence for propernames. Regarding the prosodic features we found rather strong correlations with energy,F0 range, F0 amplitude and duration (in descending order). Telephone numbers were foundto be characterised adequately by the class specific NE matching features offering almostoptimal classification, and the date and time specific NE matching features. Location fea-tures offered a good discrimination as telephone numbers typically appear towards the endof a message. Collection frequency found to have an interesting correlation with this class.For words with low collection frequency the correlation was strongly negative, while thecorrelation went slightly positive for words with a collection frequency above the average.It is also notable that telephone numbers class had the highest acoustic confidence amongall five classes. From the prosodic features only durational proved to be related with tele-phone numbers. The rest of prosodic features gave close to chance performance. Dates and

CHAPTER 9. CONCLUSIONS AND FUTURE WORK 131
times were discriminated adequately by the class specific NE matching features in a similarfashion to the previous class. However, the telephone numbers specific NE matching werefound to have a much lower sensitivity with dates and times class due to the many irrelevantentries. In contrast to telephone numbers, collection frequency features gave good correla-tion with dates and times. The most important prosodic features were found to be followingpauses, duration, F0 offset and F0 amplitude (in descending order). F0 offset found to havethe best correlation with dates and times class comparing with all the other classes. Datesand times class was the only class with a negative correlation with energy features. ‘Other’target words proved to be the most difficult to correlate with individual features. The fea-tures that correlate best with this general class are related to collection frequency. As onewould expect for this class NE related features offered virtually no discrimination. Amongthe prosodic features dur1/dur2, F0 rang , e and F0 off offered the best discrimination.
H5 Automatic summaries are better than random summaries but inferior to manual summaries.Our evaluations confirmed that summaries produced automatically either from a humantranscription or automatic transcription would be consistently better than random or crudesummaries but not superior to the summaries produced manually. Automatic summarieswere inferior to human summaries, but there was a greater perceived quality difference be-tween summaries derived from hand- and automatically-transcribed messages, than betweenmanual and automatic summarisation.
H6 The effects of the summarisation component are as crucial as those of the recognition com-ponent. Both subjective and objective evaluations revealed that the summarisation qualityis affected more by recognition than summarisation errors, and thus our hypothesis is nottrue. The subjective evaluations showed that going from human to ASR transcriptions re-duces the MOS by over 1 point, whereas going from human to automatic summary reducesthe MOS by about 0.6. This finding did not support our prediction that the effects of thesummarisation component are as crucial as those of the recognition component. Further-more, it was confirmed that any type of summary would always score higher if the correcttranscription was to be used as an input. The objective evaluations revealed a close to linearrelation between the number of transcription and SER suggesting that the provision of goodquality transcriptions is essential for successful speech summarisation applications. In thebinary decision task a 80% and 72% correct transcription and classification for HT inputon test42 and test50, respectively was found while the baseline systems got only 38% and31%. For the SR1 transcriptions, 51% and 47% correct transcription and classification wasachieved on test42 and test50, respectively. At the same time, for the SR2 transcriptionscores were consistently higher, 60% and 55% correct transcription and classification ontest42 and test50, respectively. In the multi-class summarisation task, the SER on test42found to be 63%, 53% and 41% for SR1, SR2 and HT outputs, respectively. Regardingtest50 the SER scores were 76%, 72% and 61% for SR1, SR2 and HT outputs, respectively.
H7 Automatic summaries enable accurate and fast message comprehension. We confirmed thatreading message summaries on a mobile display would enable fairly accurate comprehen-sion. A WAP phone emulator was used to retrieve the summaries and we then assessed thesummary quality in terms of comprehension. The agreegate results of our subjective evalu-ations (Table 9.1) show that users were able to determine the message priority and contentsfairly accurately. Human transcription was considerably more reliable in determining caller

CHAPTER 9. CONCLUSIONS AND FUTURE WORK 132
Question HT SR1caller name 94% 57%purpose of call 78% 78%priority 63% 58%contact number 82% 80%retrieve audio 30% 53%
Table 9.1: Average percentage of correct answers in message comprehension.
identity (94% vs. 57%), but there was less difference in determining the contact phone num-ber (82% vs. 80%) and the purpose of call (78% for both types of transcriptions). Users pre-sented with summaries generated from the automatically transcribed messages were muchmore likely to request the message audio, compared with summaries generated from humantranscriptions (53% vs. 30%). Message priority could be determined relatively accuratelyfrom the summaries: classifying priority as high/medium/low, the priority obtained fromthe summary agreed with that obtained from the audio 58% of the time for SR1 and 63%of the time for human transcriptions. Our results are inconclusive though regarding the partof the hypothesis that suggested faster message comprehension based on summaries thanaudio. The average amount of time users needed to accomplish voicemail understandingand answer relevant questions was divided among the audio and summary retrievals and noclear conclusions could be made. The time delays we calculated included the time requiredto type the answers in the appropriate fields of the interface, introducing an extra source ofvariability. This favoured the audio retrieval case, where users could listen to the recordingwhile typing their answers. We found though that the average comprehension time afterreading the summaries produced using the HT output was 33.2 sec, while for the SR1 was42.7 sec (a 30% increase). On the other hand, the subjects retrieved the audio recordings onaverage 1.5 and 1.6 times for the HT and SR1 summaries, respectively.
9.4 Suggestions for future workThis thesis has explored a range of topics in the areas of automatic speech summarisation formobile messaging. Many aspects of the work presented herein can be improved or extended.Some methodologies and empirical results are also potentially useful for other applications. Inthis section, we outline some of the directions which could be the subject of future research anddevelopment.
9.4.1 ASR componentFurther improvements in recognition accuracy could be obtained by running several inde-pendent recognisers in parallel and combine their output word hypotheses based on vot-ing [Fiscus, 1997].
Proven techniques in cases of microphone and telephone channel mismatch such as cep-stral mean subtraction (CMS) [Atal, 1974], dynamic features [Furui, 1982] and RASTAfiltering [Hermansky and Morgan, 1994] could possibly increase the robustness of the ASRcomponents.
Multi-style language proved to be an effective method for a compact system such as ours.
CHAPTER 9. CONCLUSIONS AND FUTURE WORK 133
Further augmentation of the data used to train the stochastic language models with textsimilar to Voicemail could provide improvements. It would be interesting to see whetheremail messages (e.g. accessible from public mailing lists) could be used for this purpose.
9.4.2 Summarisation componentA number of additional cues and structural information can be extracted automatically, al-lowing the construction of better quality voicemail summaries. Filled pauses might be par-ticularly informative about important words given that they tend to point to speakers’ lexicalsearch problems.
Search the feature space with SFFS instead of SFS. The former has been found to be moreeffective by allowing after every forward step in which a feature is added, the opportunity toremove features with backwards steps, as long as the corresponding subsets are better thanthe previously evaluated ones at that level.
Two common phenomena in voicemail speech and the corresponding automatic transcrip-tions are false starts and word repetitions. A false start detection method and a repetition fil-ter could be employed prior to summarisation or by extending the post-processing method.
Some prosodic phenomena such as F0 range and speaking rate are very much speaker-dependent and even idiosyncratic. As such, the issue of normalisation has problematicimplications in speaker-independent systems and requires systematic investigation. Thereare still questions as to which is the most effective way to normalise individual raw prosodicfeatures by word, by message/speaker and by corpus.
Technical questions revolve around what is the most appropriate thing to measure regardingpitch related features (e.g. pitch excursion or pitch level difference) and in which scale (e.g.Hz, Bark, Mel, or ERB). Stylisation of contours is also an area that requires further work.
Although treating transcribed words independently proved to work relatively well and al-lowed us to study the correlation between word classes and a variety of features, it is ex-pected that if modelling is extended beyond the word level classification can be based onthe expectations from syntax, semantics and pragmatics and lead to better text coherence.HMMs are a well developed probabilistic tool for modelling sequences of observations,although the amount of annotated data requirements will need to be addressed.
It remains to be seen whether a similar approach can be used to perform emotion detectionfor urgency ranking of messages. This would have applications in filtering in order to deliveronly the summaries of preselected message types i.e., personal, or professional.
9.4.3 Messaging componentThe specifications for the messaging platform may require to be redeveloped in the lightof emerging 3G standards. In 3G SMS will not be a stand-alone service but part of mul-timedia messaging. Different applications will use different bearer services depending oncharacteristics of application and mobile environment.
The implementation of the end-to-end demonstration system for the summarisation ofvoicemail messages was based on C and Matlab on a Unix platform. Extension towardscommercially sized applications will require significant engineering of the functions for
CHAPTER 9. CONCLUSIONS AND FUTURE WORK 134
extracting prosodic features and classifying transcribed words. This task requires carefulspecification and is critically linked to the number of users, available voicemail servers andmessaging platforms.
9.4.4 EvaluationA larger amount of data need to be collected from objective and subjective evaluations toto validate the effectiveness of the voicemail summarisation framework proposed in Sec-tion 8.4.
To our best knowledge there are not systematic studies comparing user preferences andcomprehension/memorability among text messaging and natural speech messaging. A studyinto the differences between text versus speech modalities for messaging would indicate keyfactors for message summarisation.
Indirect effects of summarisation can be assessed by measuring the influences ofmasked or task-irrelevant (distracting) summary content on the accuracy or latencyof task completion. Examples of indirect effects include semantic priming ef-fects [Meyer and Schvaneveldt, 1971] which indicate that the occurrence of a word initiallyresults in the activation of all of senses before the context establishes the intended sense.

A. Annotated test sets
In the following message transcriptions target words are shown in boldface. Futhermore, pn,dt , tn and ot denote proper names, dates or times, telephone numbers and ‘other’ word classes,respectively.
A.1 test42message 1HI THIS IS MOMMApn EPPpn NEEDED TO KNOW WHAT THE VALUEot IS OF THE COINSot MY DAD GAVE CLEpn IGUESS SHE SHORTot OF MONEYot AND I WONDER WHAT THE CHANCES ARE OF SELLINGot THEM ALL RIGHTHAVE A GOOD DAY THANK YOU BYE BYE
message 2HI GENEpn I’M CALLING TO SEE WHETHER I COULD GET SOME OF THE BASICot TEMPLATESot THAT YOU USE FORTHE LASTdt YEARSdt E ot C ot T ot C ot TALKot AND PERHAPS WE CAN GET TOGETHER BEFORE THAT BECAUSE IHAVE SKETCHED OUT THE GENERAL FLOW OF THINGS AND AND JUST TALKEDot WITH DANpn ALL RIGHT GENEGIVEot ME A CALLot BACK WHEN YOU GET BACK TO YOUR OFFICEot BYE NOW
message 3HI DANpn IT’S JEANNEpn AGAIN I’M STILL LOOKINGot FOR YOU TALKot TO YOU LATER BYE
message 4HI IT’S ME I THOUGHT YOU WERE GOING TO CALLot ME THIS MORNINGdt ANYWAY I’LL TALKot TO YOU LATERot
BYE
message 5YEAH RAMESHpn THIS IS MAHESHpn EXTENSIONtn ONEtn SEVENtn FIVEtn FOURtn WHENEVER YOU’RE FREEot
LET ME KNOW I’LL COMEot BY AND PICKot UP THE SPEAKERot THANKS BYE
message 6BOBpn GLENpn MORRISONpn AT ONEtn SEVENtn NINEtn FIVEtn GIVEot ME A CALLot WHEN YOU GET A CHANCEI’VE GOT A LAST MINUTE REQUESTot FOR CONFINEDot SPACEot RESCUEot TEAMot FOR TOMORROWdt AND JUSTTRYING TO FINDot OUT WHO IS GOING TO BE IN OUT AND ABOUT GIVEot ME A CALLot ONEtn SEVENtn NINEtn
FIVEtn
135

APPENDIX A. ANNOTATED TEST SETS 136
message 7HI GENEpn IT’S MARKpn I’M FIRST OF ALL THANKot YOU FOR THAT DISKot WITH WITH THE TEMPLATESot THAT’SGREAT AND AND I TALKEDot TO DANpn HE SAIDot TALK TO PETERpn OR OR TO YOU BECAUSE HE WAS TOO BUSYot
SO I GUESS I TOLD HIM I WAS THINKING ABOUT IT AND AND HE DIDN’T SAY HE DIDN Tot HAVEot A PROBLEMot
WITH IT SO WE’LL MEETot EARLYdt NEXTdt WEEKdt AND TALK ABOUT IT THEN OR WORKot ON THINGS OVERTHE WEEKENDdt I HAVE IT ALL PLANNEDot OUT AND ACTUALLY WAS HALF WAY THROUGHot DOING THE ADDEDFOILSot SO WE’LL TALK ON MONDAYdt OR SO AND GET THINGS ALL TOGETHER OKAY GENE BYE NOW
message 8HI GENEpn THIS IS DIANEpn I LEFTot A DISKETTEot ON YOUR COMPUTER IN YOUR OFFICEot WITH THE DATAot
THAT I JUST TOOK I GUESS YOU WOULD WANT TO PLOTot IT UP OR WHATEVER BUT GLENpn TOOK A LOOKot ATIT SO IT’S IT’S THERE FOR YOU TO LOOK AT THANKSot A LOT GENEpn SEE YOU MONDAYdt BYE BYE
message 9THIS IS PAULApn WITH FIRST AMERICANot TITLEot AND I’M CALLING IN REGARDS TO YOUR PURCHASEot OFBLUEot MEADOWCOURTot I NEEDED TO FIND OUT WHO YOUR INSURANCEot AGENTot IS I HAVE NATIONot
WIDEot INSURANCEot BUT I DON’T HAVE A TELEPHONEot NUMBERot OR AN ADDRESSot SO I NEED TO GET THATINFORMATIONot FROM YOU SO I CAN ORDERot INSURANCEot FROM YOUR INSURANCE COMPANY MY TELE-PHONE NUMBERot HERE IS FOURtn OHtn EIGHTtn EIGHTtn SIXtn SEVENtn NINEtn NINEtn ONEtn FIVEtn AND THIS ISPAULA THANK YOU
message 10HI DIANEpn IT’S NEILpn HAD SOME CARot TROUBLEot I’M GOING TO HAVE THE CAR TOWEDot UP FROM EASTot
CHESTERot HIGHot SCHOOLot THIS MORNINGdt I’M GOING TO TRY TO MAKEot THE MEETINGot AT TENdt BUTI’M GOING TO BE A LITTLE LATEdt SO I JUST WANTED TO LET YOU KNOW I BELIEVE IT’S IN YOUR OFFICEot OKAYBYE BYE
message 11GOOD EVENING KIMpn THIS IS SECURITYot IN THE LOBBYot YOUR I ot D ot BADGEot HAS BEEN FOUNDot IN THEAUDITORIUMot IT WILL BE TURNED IN TO THE SECURITYot CONTROLot CENTERot ON SIXTEENtn ONEtn THANKYOU
message 12GOOD MORNING KIMpn I’VE GOT YOUR BADGEot ANDot YOUR KEYSot DOWN HERE IN MY OFFICEot THIS IS JIMpn
IN SECURITYot BYE
message 13HI MY NAME IS JOHNpn BARTONpn I’M HOPING YOU’RE WORKING FOR THE ACCOUNTINGot DEPARTMENTot I’MTRYING TO GETot A A MAJORot AND A MINORot NUMBERot FOR C ot POPSot ORDERot WOULD YOU CALLot ME ATEIGHTtn TIELINEtn EIGHTtn SIXtn THREEtn SIXtn SIXtn FOURtn FIVEtn THANK YOU
message 14HEY TERRYpn THIS IS TANYApn GIVE ME A CALLot IT’S IN REFERENCEot TO MAYdt TWENTYdt FIRSTdt THEORDERSot TESTAMENTot MEETINGot I’M JUST GOING TO RECONFIRMot THE TIMEdt I HAVE ELEVENdt TONOONdt COULD YOU JUST CALL ME THANKS IF THIS IS THE TIME CANDY pn WILL NOTot BE ABLE TO ATTENDot
THIS SO I JUST WANTED TO KNOW IF IN FACT SHEot REALLY NEEDEDot TO BE THERE THANKS BYE
message 15BILLpn JESSUPpn HERE GIVE ME A CALLot WHEN YOU GET A CHANCE TWOtn THREEtn EIGHTtn SIXtn THANKSBYE
message 16HI DIANEpn THIS IS BOBpn MACNEILpn I’LL TRY AND CATCH YOU BEFORE I LEAVEot TODAYdt AT TWOdt THIRTYdt
SORRYot FOR THE DELAYot BYE
message 17HI IT’S MARIApn I JUST WAS CURIOUSot IF YOU’RE GOING TO LUNCHot TODAYdt TWOtn SIXtn EIGHTtn EIGHTtn
BYE BYE
message 18ANSELpn THIS IS GENEpn HAMMONDpn GOT YOUR DOCUMENTot READ IT LOOKSot GOODot HAVE ONEQUESTIONot HAS THERE IS THERE A SIGNIFICANTot AMOUNT OF S ot P ot TIMEot INVOLVED HERE IF SO WE NEEDTO ESTIMATEot IT AND COSTot IT HAVE YOU ALREADY DONE THAT I’M AT FIVEtn FIVEtn EIGHTtn TWOtn EIGHTtn
FIVEtn ZEROtn

APPENDIX A. ANNOTATED TEST SETS 137
message 19MR REESEpn THIS IS TINApn MESSINApn OF HOULIHANpn LAWRENCEpn AN AGENTot FROM THE COLDWELLot
BANKERot OFFICEot IN CROTONot WE’D LIKE TO SHOWot YOUR PREVIEWot YOUR HOUSEot AROUND ONEdt
THIRTYdt TODAYdt I I’M GOING TO ALLOW IT GO IN UNLESS YOU TELL ME OTHERWISE THANK YOU
message 20GREGpn THIS IS BOBpn STRADLEYpn AT CUSTOMERot ASSISTANCEot CENTERot CALLING YOU BACK ON YOURAot D ot S ot M ot PROBLEMot WHAT THAT PROBLEM IS IT’S AN UNKNOWNot I ot D ot YOUR I. D. I THINK FOR THISSYSTEMot IS SUPPOSED TO BE TRAVELot ON A D. S. M. SERVERot A AMPHORAot TWOot GIVE ME A CALL EIGHTtn
FIVEtn THREEtn FOURtn THREEtn SEVENtn FOURtn THANK YOU BYE
message 21I’M A C ot R ot S ot COORDINATORot YOU NEED TO GIVE ME A CALLot WHEN YOU GET IN I HAVE TO TALK TO YOUTHIS IS HEATHERpn TALK TO YOU LATER BYE
message 23THIS IS RECEIVINGot I HAVE A SATURDAYdt DELIVERYot AIRBORNEot EXPRESSot FOR YOU YOU CAN PICK ITUP OR WE’LL DELIVER IT TO YOU LATER THANK YOU GOOD MORNING ALAN pn YOU HAVE A VISITORot IN THELOBBYot
message 24HELLO SALIMpn THIS IS ANNIEpn FROM I ot B ot M ot IN MONTREALot PLEASE CALLot ME BACK AS SOON AS POSSI-BLE AT TIELINEtn EIGHTtn FOURtn EIGHTtn SEVENtn SEVENtn SIXtn SIXtn BECAUSE WE NEED TO RESCHEDULEot
THE CALL WITH CLAUDEpn WE WE NEED TO RESCHEDULE THE CALL WITH CLAUDE THIS MORNING dt BYE BYE
message 25HI THIS IS MARIApn DEMAIOpn I’M RETURNING TWO PHONE CALLS ACTUALLY ONE TO CHRISTINA pn AND ONETO MARIApn I CAN BE REACHED ON EXTENSIONtn TWOtn SIXtn EIGHTtn EIGHTtn THANK YOU BYE BYE
message 26HI MARYpn IT’S MARYpn ANNpn SHAWpn I JUST HAVE A QUICK QUESTION FOR YOU THE DEFENSIVEot DRIVINGot
COURSEot THAT IS TOMORROWdt ANDot THURSDAYdt CAN YOU LET ME KNOW IF THAT’S IN THE HAWTHORNEot
ONEot OR HAWTHORNEot TWOot JUST WANTED TO MAKE SURE I’M NOT SURE THE WAY THEY YOU KNOW SETot
UPot THEIR ROOMSot SO IF YOU COULD GIVE ME A CALLot I’M ON TIELINEtn EIGHTtn TWOtn SIXtn SIXTEENtn
OHtn TWOtn BYE
message 27THIS IS JAYpn FRIEDMANpn RETURNING YOUR CALL PLEASE GIVE ME A CALLot BACK ON THREEtn EIGHTtn
TWOtn FIVEtn THANK YOU
message 28HELLO I WOULD LIKE TO KNOW IF I’M STILL ON TIME TO MAKE A RESERVATIONot FOR THE SHOWot CHICAGOot
I KNOW THAT PROBABLY I MISSED THE DEADLINEot BUT PLEASE CALL ME MY NAME IS UGO pn VOLTATEpn
TIELINEtn TWOtn FOURtn SEVENtn THREEtn THREEtn ONEtn ONEtn THANK YOU VERY MUCH
message 29YES THIS IS CAROLpn ZANDRYpn AT TIELINEtn THREEtn SEVENtn SIXtn TWOtn FOURtn OHtn FOURtn I’M CALLINGTO INQUIRE ABOUT GETTING DISCOUNTSot FOR DISNEYpn WORLDot IN THE ORLANDOot AREA PLEASE GIVE MEA CALLot THANK YOU
message 30HI ALANpn IT’S CARRYpn FROM NORELpn CHECKINGot IN ON LINDApn MAKING SURE SHE ARRIVEDot
TOMORROWdt YOU’RE GOING TO SEE ELIZABETHpn MORROWpn AND ON THURSDAYdt THE FIFTEENTHdt
PAULINEpn RONZITTIpn SO WE’RE STILL WORKING ON GETTING THE FOURTEENTHdt FILLEDot AND THEN THERESTdt OF THE WEEKdt WE’LL KEEPot YOU POSTEDot THANKS BYE
message 31HI IT’S ROGERpn RETURNING YOUR CALL BEEPot ME AGAIN IF YOU WANT TO CATCH ME I’M IN THE LABot ANDI’LL CALL YOU RIGHT BACK BYE
message 32GEORGEpn WALTERpn COULD YOU GIVE ME A CALLot ON THREEtn EIGHTtn SIXtn SIXtn PLEASE

APPENDIX A. ANNOTATED TEST SETS 138
message 33HI GEORGEpn THIS IS SUNILpn CALLING I DO WORK IN I ot B ot M ot HAWTHORNEot T. J. WATSONpn AND I’M IN-VOLVED IN THE VOICEot RECOGNITIONot PROJECT AND I WAS TRYING TO USE D ot T ot SIXot THOUSANDot USINGTRANSFER CALL AND I HAD PROBLEMSot WITHot THAT TRANSFERRINGot OF THE CALL SO ABEpn TOLD METO CONTACT YOU SO CAN YOU GIVE ME A CALLot BACK AT TIELINEtn EIGHTtn SIXtn THREEtn SEVENtn ZEROtn
SEVENtn NINEtn WHEN YOU ARE BACK OKAY THANK YOU
message 34HEY IT’S YOUR UNCLEot HERBpn I’M GOING TO BE WORKINGot AT YOUR LOCATION FOR A WHILE IN THEMORNINGdt TOMORROWdt BECAUSE I’M GOING TO JOIN BARRYpn TUCKER Spn TERRITORYot MEETINGot SOI’M WONDERING IF YOU HAVE SOME TIME ABOUT I DON’T KNOW TENdt O CLOCKdt OR SOMETHING NO NEEDTO CALL ME BACK I’LL TOUCH BASE WITH YOU IN THE MORNINGdt THANKS GEORGE
message 35GEORGEpn WALTERpn I’M CALLING TO ALERTot YOU THAT THE TWOot P ot O ot NUMBERS THAT YOU HAVE FORG ot E ot CAPITALot I’M GOING TO GIVE TO KENpn KARENSpn BECAUSE THEY HAVE THE ORDERot GOING ONRIGHT NOW AND I’M KIND OF TIEDot UP SO I DON’T THINK I COULD GET TO ’EM IN THE NEXT DAY OR SO SOI’M GOING TO ASK KENpn TO HANDLE THAT AND I’M GOING TO CALL HIM AND TELL HIM THAT JUST SO YOU’REAWARE OF IT THANK YOU VERY MUCH
message 36GEORGEpn THIS IS DONNIEpn WHEN YOU GET TO BE BACK TO THE OFFICEot AND RECEIVE THIS MESSAGE GIVEot
ME A CALLot OR A PAGE MY PAGERtn NUMBER IS ZEROtn ONEtn ONEtn WE HAVE TO GET INTO THAT THE BILKOot
DOORSot OUT THERE THE YOU KNOW THE PITot IN THE JAPANESEot GARDENot AND I DIDN’T EVEN LOOK ATTHE KEY YET BUT I’M I’M GUESSING THAT IT’S A SPECIAL KEY THAT YOU GUYS HAVE SO WE’RE GOING TOSNAKEot THAT LINEot TODAYdt AND WE SHOULD BE ABLE TO TELL WHERE THE HECKot THAT P ot V ot C ot GOESALL RIGHT SO WHEN YOU GET THE MESSAGE GIVE ME A PAGEot PLEASE THANKS
message 37HI THIS IS THE MAILot ROOMot WE HAVE AN UNITEDot STATESot POSTALot EXPRESSot FOR YOU YOU CAN EITHERPICK IT UP IN THE MAIL ROOM OR WE WILL WE’LL DELIVER IT TO YOU IN THE MAIL SYSTEM THANK YOU
message 38HI GEORGEpn IT’S ROBINpn YOU HAVE A FAXot HEREot THANKS BYE
message 39MUKUNDpn THIS IS CHARLIEpn SUMNERpn SEEING IFot YOU ARE GETTING SOME DATAot FROM WESTot PALMot
I’VE BEEN FORWARDING ATot LEAST I’VE BEEN FORWARDING MY EMAIL MY PHONE MAIL NOT MY EMAIL MYPHONEot MAILot TO THE MAIL BOX SO SEEING HOW THING WERE GOING TWOtn FIVEtn EIGHTtn FOURtn SEVENtn
FOURtn TWOtn BYE
message 40ALANpn THIS IS CHARLIEpn MICCELIpn I I GOT YOUR MESS I GOT LAZARUS Spn MESSAGEot FROM YOUREXTENSIONot SO I’LL I’LL TRY TO CONTACT HIM AS WELL MAYBE THE THREE OF US WE CAN MEETot TODAYdt
AND JUST TALK INFORMALLYot ABOUT NEUROot NETWORKSot GOOD BYE
message 41MICHAELpn IT’S KENpn YOU COULD INVITEot PAULpn AND BILLpn MY CONTRACTORSot ARE GOING ALSO SOWE’LL JUST SNEAKot THIS ONE IN THANKS BYE
message 42HI JOHNpn THIS IS MONICApn MY NOTESot SERVERot IS DOWNot SO I DON’T KNOW IF YOU SENT THE P ot N ot P ot
FILEot OR NOT BUT COULD YOU PLEASE SEND IT OR RESENDot IT TO MY MONICApn ATot B ot C ot L ot V ot M ot
ONEot SO I CAN DOWNLOADot IT I HAVE ABOUT ANOTHER HALFdt HOURdt SO THAT I CAN PUT YOUR FILE UPTOO THANKS YOU MAY DELETE THIS MESS

APPENDIX A. ANNOTATED TEST SETS 139
0% 5% 10% 15% 20% 25% 30% 35% 40% 45% 50%
1
3
5
7
9
11
13
15
17
19
21
23
25
27
29
31
33
35
37
39
41
mes
sage
num
ber
compression rate
proper namestelephone numbersdates/timesother
Figure A.1: The target compression rates for each message contained in test42 broken down intofour classes, namely proper names, telephone numbers, date/time and other. The average rate is29.3%.

APPENDIX A. ANNOTATED TEST SETS 140
A.2 test50message 1THIS IS RECEIVINGot I HAVE TWOot AIRBORNEot EXPRESSot PACKAGESot FOR YOU YOU CAN PICK THEM UP IFYOU’D LIKE OR WE’LL BRING THEM TO YOU LATER THANKS
message 2HI DIANEpn GOOD AFTERNOON THIS IS SALLYpn I GOT YOUR MESSAGE NEXT WEEK MONDAYdt I CAN MEETot
WITH YOU WHENEVER BUTot THE RESTdt OF THE WEEKdt I WILL NOTot BE AROUNDot I WILL BE IN SOMERSpn
SO EITHER WE MEETot ON MONDAYdt OR WE COULD MEET THE FOLLOWINGdt WEEKdt IF THAT’S OKAY MAYBEI’LL GIVE YOU A CALL OR I’LL OR AFTER SOME TIME OR I’LL TALK TO BOB pn DUNSCOMBpn AND SEE WHAT’SMUTUALLY CONVENIENTot FOR US AND THEN WE’LL TAKE IT FROM THERE PROBABLY IT’S BETTER TO MEETTHE FOLLOWINGdt WEEKdt THEN WE’LL TALK TO YOU AND IF I DON’T CALL BACK HAVE A HAPPYot MOTHER Sot
DAYdt BYE
message 3HELLO PAULpn THIS IS TIGGApn TENACIOpn DO YOU WANT TO GIVE ME A CALLot MAYBE WE CAN ARRANGETO DO SOME SOME REGISTRATIONot SOMETIME TODAYdt THANKS BYE I’M AT ONEtn EIGHTtn FOURtn OHtn SOLONG
message 4HI TERRYpn THIS IS FOUADpn DUWANYpn YOU JUST CALLEDot ME A A FEW MINUTES AGO PROBABLY AHALFdt HOURdt AGO YEAH YES OF COURSE YOU CAN SUBSTITUTEot THE PENTIUMot PRO TWOot HUNDREDot
MEGAHERTZot FOR THE DESKTOPot WORKSTATIONot ONEot SIXTYot SIXot IF YOU NEED ANY OTHER INFORMA-TION PLEASE LET ME KNOW THANKS BYE
message 5MARKpn EPSTEINpn THIS IS KENpn STREIBERpn I’M JUST CALLING IN RESPONSE TO YOUR YOUR PICNICot
NOTICEot I ALREADY SENT YOU TWOot EMAILSot THAT I WAS GOING TO BE UNABLEot TO ATTENDot I’M JUSTWONDERING IF YOU EVER RECEIVED THOSE JUST TO LET YOU KNOW I ONLY SENT IT TO M. E. P. S. OFF OF THEA. I. X. SYSTEMot I WOULD ASSUME IT WOULD GET TO YOU I DON’T KNOW ABOUT JIM pn LAKAIDISpn I DON’TKNOW LET ME CHECK OUT THE HE CHANGEDot JOBSot RECENTLY SO I DON’T KNOW IF YOU HAVE HIS NEWEMAIL ADDRESS AND I DON’T EVEN KNOW IF HE HAS EMAIL RIGHT NOW SO I DON’T THINK YOU’LL GET INTOUCH WITH THEM I DON’T THINK HE HAS ANY IDEA ABOUT THE PICNIC SO I’LL BE TALKING TO YOU SOONHAVE A GREAT DAY BYE BYE
message 6HELLO THIS IS SEBASTIANpn SORRENTINOpn MY LAST NAME IS SPELLEDot S pn O pn R pn R pn E pn N pn T pn
I pn N pn O pn MY SERIAL NUMBERot IS SEVENtn SEVENtn SIXtn FOURtn THREEtn FOURtn I’VE TRIEDot TO GETA MAGICot KINGDOMot CLUBot CARDot NOW TWICE I’M GOING TO BE GOING TO DISNEYot WORLDot IN THENEXT COUPLE OF WEEKS AND I REALLY NEED THIS MY ADDRESSot IS ONEot SIXTYot FIVEot HUMMINGBIRDot
IT’S ALL ONE WORD H. U. M. M. I. N. G. B. I. R. D. DRIVE AND I LIVE IN BERLINot B. E. R. L. I. N. CONNECTICUTot MYZIPot CODEot IS OHtn SIXtn OHtn THREEtn SEVENtn PLEASE HELP ME OUT GET ME A MAGICot KINGDOMot CARDot
AS SOON AS POSSIBLE AND MAIL IT TO MY HOME ADDRESS I DESPERATELY NEED IT THANK YOU VERY MUCHBYE BYE NOW I’M IN SOUTHBURYot ON TIELINEtn THREEtn SEVENtn SIXtn MY NUMBERtn IS THREEtn THREEtn
THREEtn ZEROtn THANK YOU
message 7BOBpn THIS IS JOHNpn DID YOU COME IN TONIGHTdt MUST HAVE BEEN SHORTot HE SAID HE GOT A NOTEot FROMYOU OR IS IT FROM HOME SO I’LL TALK TO YOU LATER BYE
message 8SWITCHBOARDot OPERATORot I HAVE A FAXot FOR YOU AT SEVENTEENtn ONEtn FIFTYtn NINEtn THANK YOU
message 9GOOD MORNINGdt DIANEpn THIS IS TIMpn GARRITYpn I JUST SPOKE TO THE GUYS IN THE LAB YOUR MACHINEAPPARENTLY THE BURN IN OF WARPot FOURot IS A DONE DEAL I ASKED BILLpn JESSUPpn OR SOMEBODY TOTO GETot IT UP TO YOU SOMETIME THIS MORNING OR AS SOON AS POSSIBLE SO I WOULD JUST GET AHOLDOF MICHAELpn BENNYpn AND GET ONE OF HIS CREWot TO DO THE INSTALLATIONot OF THE THE VOICETYPEot
IF YOU NEED TO YOU CAN REACH ME AT NINEtn ONEtn FOURtn TWOtn THREEtn SEVENtn ONEtn TWOtn NINEtn
ZEROtn I JUST WANT TO MAKE SURE THIS THING GETS DONE OKAY TALK TO YOU LATER BYE
message 10HI MARIApn THIS IS KARMApn FROM MATCHPOINTot TENNISot AND FITNESSot CLUBot NINEtn SIXtn TWOtn
FOURtn ZEROtn NINEtn FOURtn I THOUGHT I’D GIVE YOU A CALL TO SEE IF YOU GOT ANY FEEDBACKot AT

APPENDIX A. ANNOTATED TEST SETS 141
ALL FROM THE PEOPLEot WHO TOOK THE INSTANTot TENNISot SESSIONot YESTERDAYdt THE HEAD PRO HERESAID THAT IT TURNED OUT TO BE VERY GOOD ALL THE PEOPLE WHO WERE SUPPOSED TO HAVE BEEN THEREWEREN’T THERE BUT THERE WAS FOUR OF THEM AND HE THINK IT WAS SUCH A GREAT IDEA OKAY SO IF YOUCAN CALL ME BACK GIVE ME SOME FEEDBACK MY NUMBER IS NINEtn SIXtn TWOtn FOURtn ZEROtn NINEtn FOURtn
THANKS MARIApn
message 11BOBpn MCKAYpn GLENpn MORRISONpn ONEtn SEVENtn NINEtn FIVEtn GIVEot ME A CALLot WHEN YOU GET ACHANCE COUPLE OF THINGS ONE I DO HAVE A NAME IN FISHKILLot FOR YOU AND AND I’VE TALKED TO HER THENAME IS ANNpn DOHRMANpn D pn O pn H pn R pn M pn A pn N pn THE PHONE NUMBER IS FIVEtn THREEtn THREEtn
EIGHTtn ZEROtn EIGHTtn FIVEtn SHE I GUESS IS THE FACILITIESot ENGINEERot THAT IS RESPONSIBLE FOR THEHYDROGENot SYSTEMot AND THE PURITYot OF IT AND AND ALL THOSE KINDS OF THINGS I HAVE NOT TALKEDTO HER MYSELF I’VE TALKED TO THE GAS GUYS WHO GAVE ME HER NAME BUT YOU MAY BE ABLE TO ADDSOME MORE INTELLIGENTot QUESTIONSot THAN ME SO I MEAN I’D BE GLAD TO GIVE HER A CALL BUT BUT ITHOUGHT I’D AT LEAST PASSED THE NUMBER ON TO YOU NUMBER TWO IS TRYING TO FIND OUT WHETHER ORNOT YOU HAVE ANY SMALL BY SMALL I MEAN SMALL LIKE T. L. D. SIZE HYDRIDEot M. D. A TAPESot UP THEREI’M OUT DOWN AT MY END AND AND I’M LOOKING FOR LOOKING FOR A SOURCE TO HELP OUT ONE OF THERESEARCHERSot GIVE ME A CALL ONEtn SEVENtn NINEtn FIVEtn
message 12HI ALANpn I JUST WANTED TO LET YOU KNOW THAT MY MOTHERot RECEIVED THE COPYot OF YOUR FINALot
EXAMot IN THE MAIL FROM CRAIGpn FISHERpn TODAYdt THAT’S EVERYTHING SHE TOLD ME NO DETAILS AS FARAS YOU KNOW WHEN HE WANTED IT BACK OR ANYTHING ABOUT THE PAPER SHE DIDN’T OPEN IT OR ANYTHINGBUT SHE HAS IT FOR YOU SO SHE’LL GIVE IT TO YOU OVER THE WEEKEND TALK TO YOU LATER BYE
message 13ROSEMARYpn IT’S BERNIEpn HECKERpn THANK YOU FOR YOUR MESSAGE THE AUDIENCEot THAT I’MPRESENTINGot TO IS A GROUP FROM THE UNIVERSITYot OF CONNECTICUTot SCHOOLot SYSTEMot AND SOMELOCAL K. TWELVE SCHOOL SUPERINTENDENTSot SO THEY’RE NOT REALLY TECHNOLOGISTS THEY HAVE SOMEPEOPLE THAT HAVE ACADEMIC BACKGROUNDS AND SOME PEOPLE WHO ARE VERY FAMILIAR WITH WITH THEWORLD OF ACADEMICSot AND LEARNINGot BUT MAINLY THEY’RE BUSINESSot PEOPLE MAKING BUSINESS DECI-SIONS ON HOW TO RUN AN INSTITUTIONot SO WHAT I WANT TO DO IS GIVE THEM A A LAYMAN’S OVERVIEW OFWHERE THIS TECHNOLOGYot IS GOING AND ITS APPLICABILITYot IN THE WORLD AGAIN YESTERDAY TODAYAND TOMORROW SO NOT A LOT OF BITS AND BYTES BUT MORE APPLICATION OF SPEECHot TECHNOLOGYot
AND WHERE IT’S GOING I HOPE THAT HELPS PLEASE LEAVE ME A MESSAGE AT TIELINE TWO tn TWOtn FOURtn
SIXtn OHtn THREEtn FIVEtn I’D LIKE TO TRY TO GET THE PRESENTATION AS SOON AS POSSIBLE SINCE I’M OUT OFTHE OFFICE NOW I’LL BE BACKot ON MONDAYdt AND THEN I’M ON THE ROAD AGAIN THANKS AGAIN TIELINEtn
TWOtn TWOtn FOURtn SIXtn ZEROtn THREEtn FIVEtn THANK YOU
message 14HI TAMARApn IT’S LYNNpn DAREpn WE TRY TO EATot TOGETHERot YESTERDAYdt I HAD PLANS AND ENDED UPEATING BY MYSELF BECAUSE I GOT STUCKot AT MY DESKot SO I JUST WANTED TO LET YOU KNOW THAT WASWHAT THAT WAS ALL ABOUT ANYWAY TALK TO YOU LATER CALL ME THANKS BYE
message 15HI THIS IS THE MAILot ROOM WE HAVE AN U ot P ot S ot CURRENTot EXPRESSot FOR YOU YOU CAN EITHER PICKIT UP IN THE MAIL ROOM OR WE WILL DELIVER IT TO YOU IN THE MAIL SYSTEM THANK YOU
message 16HI DADot THIS IS DENNYpn AND I WANT YOU TO CALLot ME BACK ANSWERINGot THIS QUESTIONot BECAUSEIT’S FRIDAYdt AND SINCE I DON’T HAVE ANY PROJECTSot I WOULD LIKE TO PLAYot BEFORE I FINISH MYHOMEWORKot OKAY BYE
message 18HEY GEORGEpn KENpn DO ME A FAVORot GET JOHNpn WOLFEpn IN THE MODELot SHOPot ONE OF THOSE LOTUSot
FAXot SERVERot PHONE NUMBERS HE HE DEALS WITH A LOT OF FAXES AND HE WANTS TO TRY IT OUT ANDALSO BILLpn CEROVICpn AT THE INPUT DESK THEY THEY GET A LOT OF FAXES FOR THEIR WORK ORDERS FROMVENDORSot OKAY THANKS HI ROSEMARYpn THIS IS SUEpn IN PURCHASINGot IT’S GOING TO TAKE A WHILE TOCATCH UP BECAUSE IT TAKES THEM AT LEAST TEN DAYS TO PROCESS SO I THINK THE REASON THEY DON’T HAVETHE WHOLE PAYMENT IS JUST BECAUSE THEY HAVEN Tot BEEN PROCESSEDot YET AND THE THE P. O. HAS BEENFIXED NOW SO THAT ENDICOTTot CAN PAY THE BILLSot OF THOSE INVOICESot AS FAR AS THE LATE CHARGESot
GO IF SOMEONE THERE WANTS TO APPROVEot PAYMENTot OF THE LATE CHARGES WE CAN SEND A NOTE UP ANDI HAVE THE GIRL Sot NAMEot IN ENDICOTTot WE’D NEED TO SEND THE NOTE STATING THAT YOU APPROVEDTHE PAYMENT OF THE CHARGES AND THEY’LL BE PAID JUST THE SAME AS THE REGULAR ot INVOICESot WEPROBABLYot SHOULD WAIT TO MAKEot SUREot ALL THE INVOICESot I SENT UP HAVE BEEN PROCESSED FIRSTAND THEN WE’LL KNOW EXACTLY WHAT THE LATE CHARGES ARE SO IT SHOULD BE FUN I’M LEAVING ot TODAY

APPENDIX A. ANNOTATED TEST SETS 142
EARLYdt BUT WHEN I GET BACK ON MONDAYdt IF YOU GIVE ME A CALLot WE CAN CHECKot THAT ORDERot ANDSEE EXACTLY WHICH INVOICES HAVE PAIDot AND THEN WE CAN GET THE V. M. NOTE STARTED SO IT SHOULDBE FINE THAT PIECE OF THAT INVOICE THAT YOU HAVE THOUGH DOES NEED TO GO TO ENDICOTT ot YOU CANEITHER SEND IT UP TO MEot AND I’LL SEND IT UP OR IF IT ALREADY HAS THE P. O. NUMBER ON IT YOU CAN SENDIT DIRECTLY TO ENDICOTT THAT’S UP TO YOU SO JUST GIVE ME A CALL THANKS BYE
message 19HEY MIKEpn IT’S MATTpn TRACYpn YOUR MASTot DIDN’T MAKE IT OUT LAST NIGHT IT’S IT’S STILL IN FINALCLEAN WE’RE HAVING A REAL HARD TIME GETTING IT CLEAN I GUESS AND AS SOON AS IT COMES OUT IT’SABOUT LET’S SEE IT’S ABOUT QUARTERdt OF EIGHTdt NOW AS SOON AS IT DOES COME OUT I’LL I’LL DRIVEot
IT OVER TO YOUR PLACE MYSELF SO I’LL KEEP YOU POSTED AS SOON AS I KNOW SOMETHING THANKS A LOT
message 20DIANEpn HI THIS IS CHARLIEpn YOU HAVE TO CALLot ME SOMETHING VERYot GOODot HAS HAPPENEDot BUT IWANTED TO TALK TO YOU ABOUT IT SO IT’S GOING TO BE A LITTLE BIT CRAZYot TODAY BUT YOU I HOPE YOUWILL CALL BACK I’LL BE IN MY OFFICEot AT ALMOST ALL THE TIME EXCEPT JUST EXACTLY WHEN YOU CALLAND I’LL BE BACK THIRTY SECONDS AFTER YOU STOP AFTER THE PHONE STOPS RINGING SO LEAVEot ME AMESSAGEot AND I’LL TALK TO YOU LATER EXCEPT I’M LIKELY TO BE HERE I’M JUST KIDDINGot BYE BYE
message 22HI THIS IS OWINGpn MORKAYpn GIVE ME A CALLot BACK I’M ON TIELINEtn THREEtn SIXtn OHtn SIXtn EIGHTtn
SIXtn OHtn I HAVE REGISTERot FOR THE DEFENSIVEot DRIVINGot CLASSot WHICH IS TO BE HELD NEXTdt
TUESDAYdt ANDot THURSDAYdt I BELIEVE AND I HAVE NOT GET ANY CONFIRMATIONot YOU KNOW WHETHERI’LL BE ATTENDINGot THE CLASS CAN SOMEBODY GIVE ME A CALLot ON THAT SUBJECT THANKS BYE HELLOGEORGEpn THIS IS BLANCApn I’M GOING TO BE SENDINGot YOU A FAXot OF THE SPREADSHEETSot AND THENARRATIVEot FOR THIS INFRASTRUCTUREot SURVEYot LET’S SEE I’M GOING TO BE SENDING IT TO YOUR FAXot
NUMBER TWOtn ONEtn FOURtn ONEtn SO BE EXPECTINGot IT AND GIVE ME A CALLot IF THERE IS ANYTHING YOUSEE THERE THAT NEEDSot TO BE CHANGED OR OR I MISSED OR WHATEVER OKAY BYE BYE I’M AT TIELINEtn
FOURtn FIVEtn SEVENtn ONEtn OHtn NINEtn NINEtn BYE
message 23HI TERRYpn IT’S DAVEpn I JUST FOUND OUT WHO ROLLEDot OUT THE SYSTEMot AND HIS NAME IS MANNYpn
RIOSpn HIS NUMBER IS TWOtn NINEtn EIGHTtn THREEtn SO YOU MAY WANT TO JUST ASK HIM WHAT HE WANTSTO DO HE MAY JUST WANT TO GO OVER AND JUST INSTALLot THE THING OR PUT IN A CALLot FOR IT AND HAVEIT PUT IN AND THAT’S THAT THANKS BYE
message 24HI THIS IS HELENEpn SOLINGApn THE FILE YOU SENT ROSEMARYpn DOESN’T PRINTot UP ON OUR FREELANCESot
I TRIED IT ON HERS I TRIED IT ON MINE AND I GOT AN I GOT A BIG FILE IN THE EDITORot THE O. S. TWO EDITORot
AND IT WAS ALL GOBBELLY GOOP THERE WAS NOTHINGot UNDERSTANDABLEot IN IT AND THEN WHEN I TO PUTIT TRIED TO SEE IT IN FREELANCEot IMPORTot IT OR OR WHATEVER IT SAYS IT DOESN’T RECOGNIZEot A P ot
R ot Z ot FILE WHICH YOURS IS P. R. Z. SO WE CAN’T DO IT MAYBE YOU COULD PUT IT IN ASCIIot FORMATot ORSOMETHING BUT AT THIS POINT WE CAN’T PRINT IT THANK YOU BYE
message 25HEY EDDIEpn STEVEot FRIEDLANDpn RETURNING YOUR CALL GIVE ME A CALLot WHEN YOU GET BACK BYE
message 26HI SALIMpn THIS IS WALLYpn DIETRICHpn I’M CALLINGot FROM AISLEot FOURTEENot BECAUSE I NEED SOMEINFORMATIONot FOR A TALKot THAT PAULpn HORNpn IS GIVING TO THE I. B. M. SENIORot MANAGEMENTot
MEETINGot NEXTdt WEEKdt COULD YOU PLEASE CALLot ME AT TWOtn OHtn SEVENtn THREEtn AND IF I’M NOTTHERE CALL MY SECRETARYot TANYApn PAGANpn AT EXTENSION TWOtn THOUSANDtn AND ONEtn THANK YOUBYE BYE
message 27HI THIS IS DICKpn HAGENpn I SENT YOU A FAXot OVER THE WEEKENDdt REQUESTINGot SOME FLORIDAot INFOMY I ot D ot IS H ot A ot G ot A ot R ot ON I ot S ot S ot C ot V ot M ot AND MY HOME PHONE IS TWOtn OHtn THREEtn
TWOtn TWOtn ONEtn ONEtn SEVENtn OHtn ONEtn I WOULD LIKE SOME INFORMATION I’M GOING TO FLORIDAot
NEXTdt SUNDAYdt I WOULD LIKE TO GET THAT THIS WEEK IF POSSIBLE THANKS A LOT
message 28JOHNpn HI IT’S DONNApn KEPPANDpn I WANTED TO SAY THANK YOU VERY VERY MUCH FOR ALL THE FAXESot
YOU SENT TO ME TRYING TO GET THIS STUFFot READY FOR DAVIDpn FOR THE T ot Iot I REALLY REALLY APPRE-CIATE IT AS USUAL YOU JUST YOU GO WAY BEYOND WHAT ANYBODY WOULD EVER EXPECT YOU TO DO I AMSENDING BACK TO YOU ALSO THANK YOU FOR PUTTING IN THE SPEECHot STUFFot I HAD ADDED THAT IN THIS

APPENDIX A. ANNOTATED TEST SETS 143
MORNINGdt AND IN MY LEARNINGot CURVEot I WAS WORKING WITH ATTACHMENTSot AND STUFF ON LOTUSot
NOTESot I LOSTot ALL OF THE UPDATESot I HAD DONE TODAYdt SO I WAS PLEASED TO SEE THAT IT WAS IN ASECONDot SPOTot SO THAT HELPS ME OUT I’M GOING TO SENDot YOU BACK THE LATESTdt FILEot I THINK THATIT’S GOOD ENOUGH TO GO AHEAD AND POST AND PEOPLE WILL JUST HAVE TO UNDERSTAND THAT AS I FINDMORE INFORMATION WE WILL CONTINUE TO MAKE IT BETTER SO BE WATCHING FOR THE FILE WHEN YOU CANPOST IT THANKS A LOT BYE BYE
message 29DENNISpn ALBERTpn MISHKILLpn HOW ARE YOU DOING DENNISpn IF YOU GET A CHANCE GIVE ME A CALLot
TIELINEtn TWOtn NINEtn THREEtn FIVEtn FOURtn OHtn ONEtn WANTED TO FINDot OUT WHAT THE STATUSot WASWITH THE OFF SHIFT THE LAPTOPot AND ALL THAT THAT KIND OF GOOD STUFF THANKS BYE
message 30HI TARATIQUEpn EFREMpn FLINTpn CALLING I TRIED TO DROP OFF THE SOFTWAREot YESTERDAYdt FOR MYNEW MACHINE YOUR OFFICEot IS LOCKEDot SO IF YOU COULD GIVE ME A CALLot AND TELL ME WHEN YOU’LLBE THERE I WILL BRING IT DOWN THEN THANKS A LOT BYE MY EXTENSIONtn IS ONEtn ONEtn NINEtn FIVEtn
THANK YOU
message 31CHRIS HI IT’S ANGIEpn MICCOpn TIELINEtn EIGHTtn SIXtn THREEtn SEVENtn SEVENtn EIGHTtn SIXtn CAN YOUPLEASE GIVE ME A CALLot I’D APPRECIATE IT IT’S IN REGARD TO SOME ROOMSot THAT JUDYpn CUNITZpn HADRESERVEDot FOR LOGANpn SCOTTpn AND I JUST WANTED TO TALK TO YOU ABOUT THEM THANKS BYE BYE
message 32HI DAVIDpn THIS IS SUSANpn AGAIN I JUST SPOKE WITH MY SECONDot LINEot AND HE’S HE’S GOING TO TRYTO MOVE HIS CALENDARot TWOot FORTYot FIVEot SO I NEED TO HEAR FROM YOU AS SOON AS POSSIBLE TOFIND OUT IF YOU INDEED WILL BE AROUND AT TWO FORTY FIVE AND GENE pn RAHMANpn IS CHECKING BILLpn
PULLEYBLANK Spn CALENDAR SO JUST GET BACK TO ME AS SOON AS POSSIBLE BECAUSE WE’RE MOVINGot ALOT OF PEOPLE’S SCHEDULEot TO DO THIS OKAY SO PLEASE GIVE ME A CALL BACK THANKS BYE
message 33HI IT’S MICHAELpn I JUST WANTED TO CALL AND CHECK IN WITH YOU I GOT YOUR MESSAGE ABOUT BACKINGot
UP UNFORTUNATELY I GOT IT FAR LATER THAN YOU NEEDED ME TO GET IT THEY DISCONNECTED ot MY PHONEot
VERY EARLY THIS MORNINGdt AND I JUST GOT IT BACKot LATERdt THIS AFTERNOONdt ANYHOW LET ME KNOWHOW THINGS WORKED OUT THE ANSWER IS YES AND THE PART ABOUT BACKING UP THOUGH IS THAT YOUWANTED I WOULD PRESUME THAT YOU WOULD WANT TO BE FOCUSEDot ON YOUR DATAot RATHER THANTHE THE OPERATINGot SYSTEMot BECAUSE THAT’S GOING TO GO AWAY AND YOU’RE GOING TO GET A NEWVERSIONot OF IT SO YOU DON’T YOU DON’T WANT TO OVERLAY STUFF WHEN YOU RESTORE IT SO GIVE ME ACALL WHEN YOU GET THE MESSAGE PERHAPS YOU MAY NOT HAVE GOTTEN TOO FAR DOWN THE ROAD ANDWE’LL GO FROM THERE THANKS HOPE ALL IS WELL TAKE CARE
message 34THIS IS RECEIVINGot I HAVE A FEDERALEXPRESSot PACKAGEot FOR YOU YOU CAN PICK IT UP OR WE’LL TRYTO DELIVER IT LATER THANK YOU
message 35HI MICHAELpn IT’S BARBARApn GIVE ME A CALL WE HAVE ENOUGH FOODot OKAY I DON’T KNOW IT IS A LITTLELATE THEY COULD SAY NO OKAY BUT YOU GIVE ME A CALLot BYE I’M GOING TO ASK LAURENpn WHAT SHEDOES YOU MAY DELETE THIS MESSAGE SAVE
message 36HI THIS IS RICKpn RANDpn AT THREEtn FOURtn THREEtn SEVENtn I SENT YOU A NOTEot YESTERDAYdt ABOUTANNOUNCING SOMETHING FOR THE SHOOTINGot SPORTSot CLUBot AND WHAT WE HAVE TO DO THIS YEAR TOGET INTO THE WATSONpn TROPHYot STUFF SO COULD YOU CALL ME BACK PLEASE I’M AT THREEtn FOURtn
THREEtn SEVENtn THANKS
message 37BOBBYpn KAYpn GLENpn MORRISONpn ONEtn SEVENtn NINEtn FIVEtn GOT YOUR MESSAGE FROM LATE LASTdt
NIGHTdt DID MAKE A COUPLE OF PHONE CALLSot TO FISHKILLot I ACTUALLY HAVE NOT TALKED TO ANYBODYAT THIS POINT MYSELF I THINK THE PRIMARY CONTACT IS BERNIE pn NEWHARTpn WHO IS WHO IS ONE OF THEPEOPLE I LEFT THE MESSAGE FOR IN REGARD TO THE HYDROGENot PURITY AND AND QUALITYot KIND OFQUESTIONS YOU HAVE SO JUST WANTED TO AT LEAST LET YOU KNOW THAT WHEN YOU GET BACK IN THEOFFICEot FEEL FREE TO GIVE ME A CALLot AND I’LL BE HEARING FROM FROM BERNIEpn OR ONE OF THE OTHERCONTACTS UP THERE IN THE MEANTIME

APPENDIX A. ANNOTATED TEST SETS 144
message 38THIS IS KENpn I HOPE YOU’RE STILL THERE WE DIDN’T GET A CHANCE TO TALK I GUESS IF YOU’RE IF YOU’RENOT STILL THERE BUT BASICALLY IN TERMS OF THE SPECSot I THINK THINGS ARE PRETTY WIDEot OPENot IHAD A DISCUSSIONot WITH DAVEpn AND FOR THE MOST PART HE IS MORE INTERESTED IN JUST GATHERINGDATA WHAT ARE THEIR SPECIFICATIONSot AND AND THEN LET’S SEE WHAT WE CAN LIVE WITH HIS NOMINALRULE OF THUMB IS IF YOU HAVE A A AN ITEM OR A NUMBER THE SIGMAot SHOULD BE A FORCED TO ASSISTot
OF THE AVERAGEot VALUEot AND OF COURSE D ot Q ot E ot IS ONE EXAMPLEot WHERE THAT BREAKSot DOWNCONSIDERABLY BUT HE THINKS HE COULD HANDLE FAIRLY WIDE D. Q. E. SO I THINK THE REAL DISCUSSIONHERE WILL BE ON THE THRESHOLD AND THE THRESHOLDot CHANGE WITH TEMPERATUREot AND HE SEEMSTO BE SAYING AND I DIDN’T KNOW THIS BUT OF ALL THE DATA THAT WE HAVE ACCUMULATED ot FROM THREEDIFFERENT SUPPLIERSot IN GENERAL ALMOST ALL THE DATA SHOWS A A A POSITIVEot EYEot THRESH WITHTEMPERATUREot WHICH KIND OF SURPRISED ME I WOULD HAVE THOUGHT THERE WOULD HAVE BEEN SOMEDEVICE THAT WOULD HAVE GONE THE OTHER WAY SO IT MAY BE THAT WE MAY NOT HAVE TO WORK TOO HARDTO MAKE SURE THAT WE HAVE ONE SIGN BUT THEN IT’S THE VALUEot OF THAT CHAINot SO EVEN IF I DON’TGET A CHANCE TO TALK TO YOU WE SHOULD SOMEHOW CONNECT UP WE’RE COMING IN AT ELEVENdt NINEdt
THIRTYdt P dt M dt ON TUESDAYdt WE SHOULD GET HAVE A BREAKFASTot EARLYdt SO WE CAN TALK A LITTLEBIT AND WE’RE STAYING AT THE HILTONot IN ALBUQUERQUEot THAT’S ALL BYE
message 39WOW WHAT A MESSAGE I HOPE THIS IS BEING USED FOR SPEECHot ALGORITHMot RESEARCHot ANYWAY I I’MSTUNNED AFTER HEARING THAT MESSAGE I DON’T EVEN KNOW WHAT TO SAY ANYWAY I WAS PLANNING ONCATCHING THE FIVEdt TWENTYdt EIGHTdt TRAINot AND I WILL TALK TO YOU SOON AND I’LL SEE YOU LATERBYE HONEYot
message 40HI DAVIDpn THIS IS SUSANpn WEIpn CALLING I GOT YOUR MESSAGE AND I WANTED TO CHECK WITH YOUTO SEE IF YOU’RE STILL AVAILABLE AT SAY TWOdt FORTYdt FIVEdt P dt M dt TODAYdt BECAUSE THEY HAVEBOTH PULLEYBANKot AND TOMpn FLEETWOODpn HAVE A MEETING FROMdt THREEdt TO FIVEdt AND THAT’SALREADY SET SO I WANTED TO SEE IF YOU’RE AVAILABLE TWOdt FORTYdt FIVEdt IF NOT RIGHT NOW THESECRETARYot TO BILLpn IS CHECKING HIS CALENDARot HE MAY OR MAY NOT BE ABLE TO STEP OUT EARLYFROM THIS OTHER SEMINARot SO WE MAY HAVE TO DO IT AT FIVEdt AS PLANNED BUT IS THERE A CELLULARot
PHONE THAT I CAN CALL YOU AT OR WHATEVER SO IN ANY CASE GIVE ME A CALL THANKS BYE I’M AT TIELINE tn
THREEtn FOURtn ZEROtn TWOtn EIGHTtn SEVENtn EIGHTtn AND YOU HAVE MY CELLot PHONE NUMBER SO YOUCAN CALL ME THERE TOO THANKS BYE
message 41TAMARApn THIS IS LINDApn IN THE LOBBYot YOU HAVE MR COHENpn HERE YOU CAN REACH HIM ATEXTENSIONtn ONEtn SIXtn ONEtn FOURtn OR ONEtn SIXtn ONEtn FIVEtn THANK YOU YOU MAY DELETE THIS MES-SAGE SAVE IT OR REPLAY IT TO DELETE PUSH DELETE OR SIX
message 42MICHAELpn HI IT’S BARBARApn I WAS WONDERING IF YOU THOUGHT WE SHOULD INVITEot THE WOLFSot OR ISTHAT SILLY GIVE ME A CALL SOON BYE
message 43I COULD DIEot OF OLD AGEot IN A MINUTEdt THIS IS THE BLOODot DRIVEot SOMEBODY SHOWED UP WITH THETICKETSot
message 44HI BOBpn I’M CALLING IN REFERENCE I’M IN CARLOpn SANTELLI Spn FIREot WORKSot AND HE’S GOT ACONNECTICUTot AIRot GASot FOR HIS PROPANEot TANKS THAT IN ORDER IS THERE A RUSHot FOR THAT OR CANWE WAITot TILLdt MONDAYdt CARLpn WILL RETURNdt ON MONDAYdt DAVEpn TOMPKINSpn THREEtn NINEtn OHtn
TWOtn
message 45HI MIKEpn IT’S MOMot GIVE ME A CALLot WHEN YOU GET A CHANCE I’LL BE AT WORKot TILLdt FOURdt
O CLOCKdt TODAYdt AND I SHOULD BE HOMEot MOST OF THE EVENINGdt THANKS BYE
message 46HI DANpn IT’S JEANNEpn CAN YOU GIVE ME A CALLot WHEN YOU HAVE A MINUTE TO GO OVER THESE THISEXPERIMENTot FOR ME THANKS VERY MUCH BYE
message 47HI THIS IS LINDApn IN THE LOBBYot YOU HAVE A MR COHENpn HERE TO SEE YOU YOU CAN REACH ME ATEXTENSIONtn ONEtn SIXtn ONEtn FOURtn OR ONEtn SIXtn ONEtn FIVEtn THANK YOU

APPENDIX A. ANNOTATED TEST SETS 145
message 48HI TERRYpn TIMpn CHAINERpn I WAS CALLING ABOUT A ROLLot OUT MACHINEot FOR ONE OF MY EMPLOYEESot
GEYpn FETZHOLDpn THE QUESTION WAS ON ROLLING OUT THIS MACHINE HE WANTS IT ROLLED OUT WITHWINDOWSot NINETYdt FIVEdt AND FULLY READY AND SO THE QUESTION IS WHAT DO WE HAVE TO DO WE IGUESS THE IMPLICATIONot IS WE HAVE TO ORDERot WINDOWSot NINETY FIVE OR CAN YOU GUYS ORDER WIN-DOWS NINETY FIVE AND JUST PUT IT ON THE MACHINE IS WINDOWS NINETY FIVE BASICALLY A SUPPORTEDROLLot OUT PLATFORMot IN THIS BUILDING AND THAT THAT’S THE BASIC QUESTION ANYWAY IF YOU CANGIVE ME A CALL BACK I’D APPRECIATE EXTENSIONtn TWOtn SIXtn FOURtn ONEtn THANKS
message 49STEVEpn IT’S JIMpn I MADE A MISTAKEot I NOTED THE TEMPERATURE ON THAT RUN SHEETot BUT I FAILEDot TOTURN THE FURNACEot OFF SO IF YOU GET THIS MESSAGE BEFORE YOU LEAVE PLEASE TURN IT OFF IF NOT I’MGOING TO HAVE DICKpn GUARNIERIpn DO IT THANKS
message 50PETERpn HI IT’S VICKIEpn I I DIDN’T LISTEN TO THE MESSAGE ABOUT THE BEST WAY TO GET YOU SORRYot
ALLISONpn IS WORKING STEADILY AND WE CAN KEEP HER BUSY BUT MY UNDERSTANDING WAS THAT THEALGEBRAot PROJECTot DIDN’T NEED HER FOR THAT LONG AND I KNOW SHE REALLY WOULD LIKE TO WORK ONTHE ALGEBRA PROJECT SO WHY DON’T YOU GET HER DOWN THERE OR UP THERE OR WHATEVER AND AND TALKTO WHOEVER ALSO SUMMERpn IS COMING AND MY SENSE IS THAT SHE HAS MORE TIME JUST BECAUSE YOUKNOW AND SHE TUTORSot AND WITH THE STUDENTSot AND THIS AND THAT WITH SCHOOL COMING GETTINGOUT I THINK SHE WILL HAVE MORE TIME IN THE SUMMERdt TO DO THINGS ALSO DID YOU DO ANYTHING I SENTYOU THIS INVITEot FORM FOR A PROGRAMMERot DID I WAS WONDERING IF YOU HAD ANY COMMENTS IF YOUSENT THAT ALONG I DON’T REALLY KNOW ABOUT THIS PERSON BUT SHE SEEMED TO HAVE SOME INTERESTINGTHINGS IN HER BACKGROUND SEEMED LIKE IT MIGHT BE WORTH TALKING TO HER OKAY THANKS OH I’M GOINGTO BE IN VERMONTot MONDAYdt ANDot TUESDAYdt SO YOU WON’T BE ABLE TO REACH ME THEN OKAY THANKSBYE

APPENDIX A. ANNOTATED TEST SETS 146
0% 5% 10% 15% 20% 25% 30% 35% 40% 45% 50%
1
3
5
7
9
11
13
15
17
19
21
23
25
27
29
31
33
35
37
39
41
43
45
47
49
mes
sage
num
ber
compression rate
proper namestelephone numbersdate/timeother
Figure A.2: The target compression rates for each message contained in test50 broken down intofour classes, namely proper names, telephone numbers, date/time and other. The average rate is19.4%.

B. Results obtained by using smallertraining sets
This appendix contains results using smaller training sets which were omitted from the main bodyof the thesis for the sake of brevity. Tables B.1, B.2 and B.3 contain the operating points of theMRROC curves on the validation set after training with 200, 400 and 600 voicemail messages,respectively. Table B.4 lists the extractive summarisation scores for the binary decision task ontest42 and test50 after training with 200, 400 and 600 voicemail messages. Figure B.1 depictsthe ROC operating points of the binary decision task summarisers trained with 200, 400 and 600voicemail messages (see Figure 7.7), respectively. The operating points correspond to test42 andtest50 for SR1, SR2 and HT input transcriptions. Table B.5 contains the extractive summarisationscores for the multi-class task on test50 having trained with 800 and validated with 200 voice-mail messages. Finally, Table B.6 gives the VTA values for the binary task summarisers whoseoperating points shown in the graphs depicted in Figure 8.8 after training with 200, 400 and 600voicemail messages. The results correspond to test42 and test50 for SR1, SR2 and HT inputtranscriptions.
147

APPENDIX B. RESULTS OBTAINED BY USING SMALLER TRAINING SETS 148
Lexical and Prosodic Features1-specif. sensit. classifier thres. rej. features
0.04 0.36 mlp 0.7 0.3 ne1 all , dur10.06 0.46 fld 0.7 0.3 dur1, dur2, cf20.12 0.68 knn 0.5 0.1 cf1, ne1 all , F0 ran , fp0.14 0.68 knn 0.5 0.1 cf1, ne1 all , fp0.22 0.83 knn 0.3 0.0 cf1, ne1 all , F0 ran , cf2, F0 on , fp, pp0.27 0.85 knn 0.3 0.0 cf1, ne1 all , F0 ran , dur20.46 0.90 gau 0.3 0.1 cf1, ne2 all , F0 ran0.67 0.94 gau 0.1 0.1 cf1, ne2 all
Lexical Features1-specif. sensit. classifier thres. rej. features
0.04 0.36 mlp 0.7 0.3 ne1 all , loc0.09 0.53 mlp 0.7 0.3 ne1 all , cf20.12 0.62 mlp 0.5 0.3 ne1 all , cf10.24 0.75 mlp 0.3 0.1 ne1 all , ne2 all , cf2
Prosodic Features1-specif. sensit. classifier thres. rej. features
0.11 0.19 knn 0.7 0.3 pp, dur 2, fp, dur10.26 0.41 knn 0.7 0.1 pp, dur 2, fp, F0 ran0.36 0.55 knn 0.5 0.1 pp, dur 20.51 0.68 knn 0.5 0.0 pp, dur 2, F0 amp0.78 0.90 knn 0.3 0.0 pp, dur 2, F0 ran0.87 0.95 mlp 0.3 0.1 dur1, dur2, e
Table B.1: Operating points of the MRROC curves on the validation set after training with 200voicemail messages.
Lexical and Prosodic Features1-specif. sensit. classifier thres. rej. features
0.01 0.15 mlp 0.7 0.3 ne1 all , ne2 all , fp0.04 0.38 mlp 0.7 0.3 ne1 all , cf10.06 0.46 fld 0.9 0.3 cf2, dur10.12 0.67 gau 0.5 0.1 cf1, ne1 all , cf2, F0 ran0.22 0.82 knn 0.3 0.0 cf1, ne1 all , F0 ran0.23 0.83 knn 0.3 0.0 cf1, ne1 all , F0 ran , ne2 all0.36 0.91 gau 0.3 0.1 cf1, ne1 all , cf2, fp
Lexical Features1-specif. sensit. classifier thres. rej. features
0.01 0.15 mlp 0.9 0.3 ne1 all , ne2 all0.04 0.38 mlp 0.9 0.3 ne1 all , cf10.11 0.59 mlp 0.7 0.3 ne1 all , cf20.13 0.62 gau 0.5 0.1 cf1, cf2, ne2 all0.21 0.73 mlp 0.3 0.7 ne1 all , ne2 all , cf10.23 0.75 mlp 0.3 0.3 ne1 all , cf10.40 0.84 gau 0.1 0.1 cf1, cf2, ne1 all
Prosodic Features1-specif. sensit. classifier thres. rej. features
0.02 0.04 fld 0.7 0.3 F0 ran0.15 0.29 knn 0.7 0.1 pp, dur 1, fp, F0 ran0.21 0.35 knn 0.7 0.1 pp, dur 1, fp0.68 0.80 gau 0.3 0.1 fp, F0 ran , F0 on0.92 0.97 gau 0.3 0.1 fp, F0 ran , e
Table B.2: Operating points of the MRROC curves on the validation set after training with 400voicemail messages.

APPENDIX B. RESULTS OBTAINED BY USING SMALLER TRAINING SETS 149
Lexical and Prosodic Features1-specif. sensit. classifier thres. rej. features
0.01 0.15 mlp 0.9 0.1 cf20.07 0.57 gau 0.7 0.3 ne1 all , cf1, dur20.12 0.67 gau 0.5 0.1 ne1 all , cf1, fp0.24 0.84 knn 0.3 0.0 cf1, ne1 all , pp0.39 0.90 gau 0.3 0.1 ne1 all , cf1, pp, fp
Lexical Features1-specif. sensit. classifier thres. rej. features
0.01 0.15 mlp 0.9 0.1 cf20.07 0.42 fld 0.9 0.3 ne1 all0.11 0.55 gau 0.5 0.1 cf1, cf20.12 0.58 gau 0.3 0.1 cf1, cf20.26 0.77 knn 0.3 0.0 cf1, cf2
Prosodic Features1-specif. sensit. classifier thres. rej. features
0.06 0.11 knn 0.9 0.3 pp, dur 1, F0 ran0.19 0.31 knn 0.7 0.3 pp, dur 1, fp, F0 amp0.33 0.47 knn 0.7 0.1 pp, dur 1, fp0.35 0.49 knn 0.7 0.1 pp, dur 10.74 0.87 mlp 0.3 0.7 e, dur10.79 0.91 mlp 0.3 0.5 e, dur10.98 0.97 mlp 0.1 0.3 e, F0 ran
Table B.3: Operating points of the MRROC curves on the validation set after training with 600voicemail messages.

APPENDIX B. RESULTS OBTAINED BY USING SMALLER TRAINING SETS 150
binary decision task / test42Baseline A200 B200 C200
SR1 HT SR1 SR2 HT SR1 SR2 HT SR1 SR2 HTCORR(%) 27.8 38.3 50.3 61.0 76.3 44.9 59.0 67.0 49.6 61.1 76.6SUB(%) - - 11.9 12.3 1.7 10.6 12.5 2.8 11.8 13.1 2.0DEL(%) - - 26.0 14.4 20.3 33.9 16.0 27.5 26.9 12.7 19.4INS(%) - - 26.1 29.2 21.1 25.0 27.1 19.0 28.8 31.2 24.3SER(%) - - 64.0 55.9 43.1 69.5 55.7 49.3 67.5 57.0 45.7
Baseline A400 B400 C400SR1 HT SR1 SR2 HT SR1 SR2 HT SR1 SR2 HT
CORR(%) 27.8 38.3 51.3 59.9 79.5 49.0 57.9 74.3 51.3 60.6 82.0SUB(%) - - 11.9 12.7 1.5 10.2 12.1 1.7 11.9 13.3 2.0DEL(%) - - 25.0 14.6 17.5 30.5 17.8 22.3 24.8 12.8 13.9INS(%) - - 26.3 30.0 19.0 23.8 26.6 16.1 28.2 31.5 22.2SER(%) - - 63.1 57.3 38.0 64.5 56.5 40.1 64.9 57.6 38.1
Baseline A600 B600 C600SR1 HT SR1 SR2 HT SR1 SR2 HT SR1 SR2 HT
CORR(%) 27.8 38.3 49.9 58.5 80.0 48.1 57.8 75.4 51.5 60.2 81.8SUB(%) - - 10.5 12.6 1.3 11.5 12.9 2.5 12.4 13.4 1.8DEL(%) - - 29.1 16.4 17.3 28.9 16.4 19.6 23.7 13.0 14.6INS(%) - - 27.0 30.1 18.2 23.8 26.0 16.8 28.1 31.8 22.1SER(%) - - 66.6 59.1 36.8 64.2 55.3 38.9 64.2 58.1 38.5
binary decision task / test50Baseline A200 B200 C200
SR1 HT SR1 SR2 HT SR1 SR2 HT SR1 SR2 HTCORR(%) 18.3 31.0 47.7 53.4 72.3 45.3 48.7 68.6 46.7 55.1 71.8SUB(%) - - 9.7 12.0 2.3 9.0 10.2 2.3 9.0 10.9 1.5DEL(%) - - 33.0 22.5 23.2 36.7 31.0 26.8 35.3 23.0 25.2INS(%) - - 30.1 34.3 26.4 27.2 33.5 25.1 32.5 37.3 31.1SER(%) - - 72.7 68.8 51.9 72.9 74.7 54.2 76.8 71.2 57.8
Baseline A400 B400 C400SR1 HT SR1 SR2 HT SR1 SR2 HT SR1 SR2 HT
CORR(%) 18.3 31.0 45.7 55.2 68.0 47.0 51.5 69.6 50.2 54.3 75.3SUB(%) - - 9.4 10.9 1.5 9.4 10.2 2.1 10.0 10.8 1.8DEL(%) - - 35.4 23.0 29.1 34.2 28.1 26.2 29.7 24.1 21.0INS(%) - - 31.2 35.3 28.5 26.4 32.8 24.1 30.9 37.0 30.5SER(%) - - 76.0 69.2 59.1 70.0 71.1 52.4 70.6 71.9 53.4
Baseline A600 B600 C600SR1 HT SR1 SR2 HT SR1 SR2 HT SR1 SR2 HT
CORR(%) 18.3 31.0 46.2 51.5 70.0 46.1 50.4 69.0 50.1 54.0 75.8SUB(%) - - 9.1 10.8 1.9 9.6 10.2 2.3 10.0 10.8 1.8DEL(%) - - 35.5 27.0 26.3 34.7 29.2 26.4 29.9 24.3 20.7INS(%) - - 29.0 37.3 27.7 27.1 32.0 24.7 31.8 37.2 30.4SER(%) - - 73.6 75.1 55.9 71.3 71.4 53.4 71.7 72.3 52.8
Table B.4: Extractive summarisation scores for the binary decision task on test42 and test50 aftertraining with 200, 400 and 600 voicemail messages. See Table 8.5 for the results using 800messages as training set.

APPENDIX B. RESULTS OBTAINED BY USING SMALLER TRAINING SETS 151
0.05 0.1 0.15 0.20.55
0.6
0.65
0.7
0.75
0.8
0.85
1−specificity
sens
itivi
ty
200 messages
A200
A200A200
B200
B200
B200 C200
C200
C200
A200
A200
A200
B200
B200
B200
C200
C200C200
test42 (SR1)test42 (SR2)test42 (HT)test50 (SR1)test50 (SR2)test50 (HT)
0.05 0.1 0.15 0.20.55
0.6
0.65
0.7
0.75
0.8
0.85
1−specificity
sens
itivi
ty
400 messages
A400
A400A400
B400
B400B400
C400
C400C400
A400
A400
A400
B400
B400
B400
C400
C400
C400
0.05 0.1 0.15 0.20.55
0.6
0.65
0.7
0.75
0.8
0.85
1−specificity
sens
itivi
ty
600 messages
A600
A600
A600
B600
B600B600
C600
C600C600
A600
A600
A600
B600
B600
B600
C600
C600
C600
Figure B.1: ROC operating points of the binary decision task summarisers trained with 200, 400and 600 voicemail messages (see Figure 7.7), respectively. The operating points correspond totest42 and test50 for SR1, SR2 and HT input transcriptions

APPENDIX B. RESULTS OBTAINED BY USING SMALLER TRAINING SETS 152
multi-class task / test42Baseline A800
SR1 HT SR1 SR2 HTCORR(%) 27.8 38.3 49.4 61.4 76.5SUB(%) - - 12.2 13.1 2.2DEL(%) - - 26.2 14.6 19.1INS(%) - - 24.9 25.3 19.5SER(%) - - 63.3 53.0 40.8
multi-class task / test50Baseline A800
SR1 HT SR1 SR2 HTCORR(%) 18.3 31.0 46.8 49.7 67.6SUB(%) - - 9.1 10.1 1.6DEL(%) - - 34.9 29.2 29.1INS(%) - - 31.6 32.4 30.0SER(%) - - 75.7 71.7 60.8
Table B.5: Extractive summarisation scores for the multi-class task on test50 having trained with800 and validated with 200 voicemail messages.
binary decision task / test42A200 B200 C200
SR1 SR2 HT SR1 SR2 HT SR1 SR2 HTVTA 78.45 83.95 84.55 74.55 81.50 83.85 76.90 84.05 84.10
A400 B400 C400SR1 SR2 HT SR1 SR2 HT SR1 SR2 HT
VTA 76.80 83.50 83.95 75.50 82.35 83.10 74.80 81.85 83.90A600 B600 C600
SR1 SR2 HT SR1 SR2 HT SR1 SR2 HTVTA 78.95 82.40 86.75 77.05 84.00 85.05 83.85 78.20 87.55
binary decision task / test50A200 B200 C200
SR1 SR2 HT SR1 SR2 HT SR1 SR2 HTVTA 76.50 81.00 87.10 77.60 76.75 86.20 78.85 80.05 87.20
A400 B400 C400SR1 SR2 HT SR1 SR2 HT SR1 SR2 HT
VTA 75.75 80.60 82.20 76.45 78.50 82.65 77.80 79.50 84.40A600 B600 C600
SR1 SR2 HT SR1 SR2 HT SR1 SR2 HTVTA 75.35 77.75 86.15 78.35 78.15 85.20 79.55 79.30 87.25
Table B.6: The VTA values for the binary task summarisers whose operating points shown inFigure 8.8 (left graph) after training with 200, 400 and 600 voicemail messages. See Table 8.6 forthe results using 800 messages as training set. The VTA values have been multiplied by a factorof 100 to give a number that is similar to percent classification. The results correspond to test42and test50 for both speech recognition output and human transcription.

C. Summaries used in MOS tests
message 21. GENE BASIC TEMPLATES LAST YEARS E. C. T. C. TALK TALKED DAN GIVE CALL OFFICE
2. GENE BASIC TEMPLATES USE LAST YEARS E. C. T. C. TALK PERHAPS SKETCHED GENERAL FLOW DANGENE OFFICE
3. GENE GET N. B. C. TEMPLATES LAST U. C. C. TALK GET TOGETHER BEFORE THAT GENERAL FLOW THINGSCALL BACK GO BY YOUR OFFICE BYE
4. GENE N. B. C. LAST U. C. C. TALK PERHAPS TOGETHER GENERAL FLOW TALK AN R. I. G. OFFICE NOW
5. JEAN GET BASIC TEMPLATE USE LAST TUESDAY Z. T. C. TALK AND GET TOGETHER BEFORE GENERALFLOW CALL BACK OFFICE
6. JEAN BASIC TEMPLATE USE LAST TUESDAY Z. T. C. TALK PRESS TOGETHER BEFORE GENERAL FLOW TALKGENE OFFICE NOW
7. HI GENE I’M CALLING TO SEE WHETHER I COULD GET SOME OF THE BASIC TEMPLATES
8. I’M SEE WHETHER GET BASIC YEARS AND CAN TOGETHER BEFORE HAVE FLOW AND JUST TALKED RIGHT
message 71. GENE MARK THANK DISK TEMPLATES TALKED DAN SAID PETER BUSY DIDN’T HAVE PROBLEM MEET
EARLY NEXT WEEK WORK WEEKEND PLANNED THROUGH FOILS MONDAY
2. GENE MARK FIRST TEMPLATES GREAT DAN SAID TALK PETER EARLY NEXT WEEK TALK WORK WEEKENDHALF WAY FOILS TALK MONDAY
3. GENE MARK TEMPLATES GREAT TOO BUSY I CALLED HIM DIDN’T HAVE PROBLEM WE’LL MEET EARLYNEXT WEEK TALK WORK OVER WEEKEND ADDED FOILS TALK MONDAY
4. GENE MARK FIRST DISK GREAT SAID TOPIC HOUR BUSY DIDN’T DID EARLY NEXT WEEK TALK WORKWEEKEND DOING FOILS TALK MONDAY PAGING NOW
5. JAY MARK THANK TEMPLATE TALK TODAY HE TOO BUSY DIDN’T HAVE PROBLEM WE’LL MEET EARLYNEXT WEEK TALK WORK OVER WEEKEND HALFWAY EDITORIALS TALK MONDAY
153

APPENDIX C. SUMMARIES USED IN MOS TESTS 154
6. JAY MARK FIRST GREAT TALK TODAY OUR OUR YOU’LL EARLY NEXT WEEK TALK THAT’LL WORK WEEK-END HALFWAY THROUGH DOING EDITORIALS WILL TALK MONDAY JAY NOW
7. HI GENE IT’S MARK I’M FIRST OF ALL THANK YOU FOR THAT DISK WITH WITH THE TEMPLATES THAT’SGREAT AND AND I TALKED TO DAN
8. MARK FOR DISK THE GREAT DAN TALK OR BECAUSE TOO TOLD THINKING HAVE WITH WE’LL NEXT TALKTHINGS THE HAVE OUT ACTUALLY DOING FOILS TALK MONDAY
message 91. PAULA AMERICAN TITLE PURCHASE BLUE MEADOWCOURT INSURANCE AGENT NATION WIDE INSUR-
ANCE TELEPHONE NUMBER ADDRESS INFORMATION ORDER INSURANCE NUMBER FOUR OH EIGHTEIGHT SIX SEVEN NINE NINE ONE FIVE
2. GENE PAULA FIRST AMERICAN TITLE PURCHASE BLUE MEADOWCOURT INSURANCE AGENT NATION IN-SURANCE TELEPHONE NUMBER INFORMATION INSURANCE COMPANY TELEPHONE NUMBER FOUR OHEIGHT EIGHT SIX SEVEN NINE NINE ONE FIVE PAULA
3. PAULA FIRST AMERICAN REGARDS YOUR PURCHASED BLUE MEADOWCOURT NEED FIND YOUR INSUR-ANCE AGENT TELEPHONE NUMBER OR ADDRESS MY TELEPHONE NUMBER FOUR OH EIGHT TO BE SIXSEVEN NINE NINE ONE FIVE
4. PAULA FIRST AMERICAN LATER REGARDS PURCHASED BLUE MEADOWCOURT WHO INSURANCE AGENTMANY TEACHERS TELEPHONE NUMBER ADDRESS INFORMATION INSURANCE MENTIONED COMPANYTELEPHONE NUMBER HERE FOUR OH EIGHT SIX SEVEN NINE NINE ONE FIVE PAULA
5. PAULA FIRST AMERICAN TITLE REGARDS PURCHASE BLUE MEADOW QUARTS FIND OUT YOUR INSUR-ANCE AGENT TELEPHONE NUMBER OR ADDRESS MY TELEPHONE FOUR OH EIGHT EIGHT SIX SEVEN NINENINE ONE FIVE
6. PAULA BUT FIRST AMERICAN TITLE REGARDS PURCHASE BLUE MEADOW QUARTS FIND WHO INSURANCEAGENT NATIONWIDE INSURANCE TELEPHONE NUMBER AN ADDRESS INFORMATION INSURANCE INSUR-ANCE COMPANY TELEPHONE NUMBER FOUR OH EIGHT EIGHT SIX SEVEN NINE NINE ONE FIVE WHAT
7. THIS IS PAULA WITH FIRST AMERICAN TITLE AND I’M CALLING IN REGARDS TO YOUR PURCHASE OFBLUE MEADOWCOURT I NEEDED TO FIND OUT WHO YOUR INSURANCE AGENT IS
8. PAULA AMERICAN I’M REGARDS YOUR PURCHASE BLUE NEEDED WHO AGENT WIDE DON’T NUMBERADDRESS THAT FROM COMPANY CAN FROM MY HERE FOUR EIGHT SEVEN FIVE PAULA THANK
message 141. TERRY TANYA CALL REFERENCE MAY TWENTY FIRST ORDERS TESTAMENT MEETING RECONFIRM TIME
ELEVEN NOON CANDY NOT ATTEND SHE NEEDED
2. TERRY TANYA REFERENCE MAY TWENTY FIRST TESTAMENT MEETING RECONFIRM TIME ELEVEN NOONTIME CANDY WILL ATTEND FACT
3. GIVE CALL REFERENCE TO MAY TWENTY FIRST MEETING GANARY CONFIRM THAT ELEVEN JUST CALLCANDY WILL NOT BE ABLE ATTEND WANTED KNOW IF BE THERE
4. TONIC REFERENCE MAY TWENTY FIRST LIST MEETING GANARY CONFIRM ELEVEN USING TIME CANDYWILL NOT ATTEND FACT JULIE’S
5. CURIOUS TONYA CALL REFERENCE TO MAY TWENTY THIRD ORDER MEETING CONFIRMED TIME I HAVEELEVENTH WILL NOT BE ABLE KNOW IF REALLY NEED BE THERE
6. CURIOUS TONYA REFERENCE MAY TWENTY THIRD MEETING CONFIRMED TIME ELEVENTH USING TIMEWILL NOT ABLE TEN WANTED FACT REALLY
7. HEY TERRY THIS IS TANYA GIVE ME A CALL IT’S IN REFERENCE TO MAY TWENTY FIRST THE ORDERSTESTAMENT
8. THIS GIVE REFERENCE FIRST TESTAMENT MEETING RECONFIRM HAVE NOON YOU THANKS TIME WILLABLE JUST KNOW SHE THERE BYE

APPENDIX C. SUMMARIES USED IN MOS TESTS 155
message 261. MARY MARY ANN SHAW DEFENSIVE DRIVING COURSE TOMORROW AND THURSDAY HAWTHORNE ONE
HAWTHORNE TWO SET UP ROOMS CALL TIELINE EIGHT TWO SIX SIXTEEN OH TWO
2. MARY MARY ANN SHAW QUICK DEFENSIVE DRIVING COURSE THURSDAY HAWTHORNE ONEHAWTHORNE TWO WAY SET UP ROOMS TIELINE EIGHT TWO SIX SIXTEEN OH TWO
3. GARY MARY ANN DEFENSIVE DRIVING COURSE TOMORROW AND THURSDAY LET KNOW HAWTHORNETWO I’M NOT SURE SET UP THERE CALL TIELINE EIGHT TWO SIX SIXTEEN OH TWO
4. GARY MARY ANN SURE QUICK QUESTION DEFENSIVE DRIVING COURSE THURSDAY HAWTHORNE WON-DERFUL POINT TWO NOT WAY SET UP EIGHT TWO SIX SIXTEEN OH TWO
5. MARIA MARION QUICK QUESTION DEFENSIVE DRIVING COURSE TOMORROW AND THURSDAYHAWTHORNE ONE MAKE SURE SET UP ROOMS TIELINE EIGHT TWO SIX SIXTEEN OH TWO BYE
6. MARIA MARION SHE’LL QUICK QUESTION DEFENSIVE DRIVING COURSE THURSDAY HAWTHORNE ONEWHAT’S SURE SURE WAY SET UP ROOMS EIGHT TWO SIX SIXTEEN OH TWO
7. HI MARY IT’S MARY ANN SHAW I JUST HAVE A QUICK QUESTION FOR YOU THE DEFENSIVE DRIVINGCOURSE THAT IS TOMORROW AND THURSDAY CAN YOU
8. MARY SHAW HAVE QUESTION THE COURSE TOMORROW YOU THAT’S HAWTHORNE JUST MAKE SURE I’MWAY KNOW ROOMS SO IF COULD TIELINE TWO SIXTEEN TWO BYE

D. Summaries used in messagecomprehension tests
D.1 HT transcriptiontest42message 10DIANE NEIL CAR CAR TOWED UP EAST CHESTER SCHOOL MORNING TEN LATE OFFICE
background info given: Your name is Diane, you are at work and you have scheduled a meeting for that day.
message 18ANSEL GENE HAMMOND READ GOOD 1 S. P. TIME ESTIMATE COST 5 5 8 2 8 5 0
background info given: Your name is Ansel and you have sent a document for review.
message 32GEORGE WALTER COULD CALL 3 8 6 6
background info given: none
test50message 6SEBASTIAN SORRENTINO LAST NAME SPELLED S. O. R. R. E. N. T. I. N. O. SERIAL NUMBER 7 7 6 4 3 4 MAGICKINGDOM CLUB CARD NOW TWICE DISNEY WORLD WEEKS ADDRESS 1 65 HUMMINGBIRD 1 WORD H. U. M. M.I. N. G. B. I. R. D. BERLIN B. E. R. L. I. N. CONNECTICUT ZIP CODE 0 6 0 3 7 MAGIC KINGDOM CARD MAIL HOMEDESPERATELY NOW SOUTHBURY 3 7 6 NUMBER 3 3 3 0
background info given: You are responsible for Disney Magic Kingdom Club memberships.
message 16DAD DENNY ANSWERING FRIDAY PROJECTS PLAY BEFORE FINISH HOMEWORK
background info given: You are a father and the day is Friday.
message 29DENNIS ALBERT MISHKILL HOW DENNIS CHANCE 2 9 3 5 4 0 1 STATUS SHIFT LAPTOP GOOD
background info given: Your name is Dennis.
156

APPENDIX D. SUMMARIES USED IN MESSAGE COMPREHENSION TESTS 157
message 40DAVID SUSAN WEI AVAILABLE 2 45 P. M. TODAY BOTH PULLEYBANK TOM FLEETWOOD 3 5 SET AVAILABLE 2 45NOW BILL MAY MAY STEP EARLY SEMINAR MAY 5 3 4 0 2 8 7 8 CELL NUMBER
background info given: Your name is David, it is late morning and you are supposed to have a meeting later that day.
message 47LINDA LOBBY MR COHEN HERE REACH EXTENSION 1 6 1 4 1 6 1 5
background info given: You are at your office expecting a visitor.
D.2 SR1 transcriptiontest42message 17MARIA JEFF LUNCH 8 2 6 8
background info given: none.
message 28TIME RESERVATION TAKE OUR PLUMBER MEAN NAME UGO BOARD 2 4 7 3 3 1 1
background info given: You are responsible for taking reservations for a show.
test50message 4KEN FEW MINUTES AGO BOB FOREGO PENTIUM PRO LONDON RAIDERS DESKTOP STATION 1 6 FADER INFORMA-TION
background info given: Your name is Terry and you had called somebody regarding a replacement of your computer.
message 8SUPPORT OPERATOR FAX 17 1 2 9
background info given: none.
message 27INDICATION SENT FAX OVER WEEKEND MCRAWSON/S PHIL FORTE INFO I. D. H. A. G. A. HYATT 15 HOME PHONE 20 3 2 2 1 1 7 0 1 INFLATION INFORMIX WEEK POSSIBLE LOT
background info given: You are a secretary who deals with travel arrangements for the company employees.
message 36RICK RAND 3 4 3 7 SENT YESTERDAY ANNOUNCING SOMETHING SHOOTING SPORTS YEAR INTO WATSON TROPHYSTUFF WANNA 3 4 3 7
background info given: You are involved in sporting clubs and you are responsible for organising related events.
message 45MIKE MOM CHANCE 4 O’CLOCK TODAY HOME EVENING
background info given: Your name is Mike and it is afternoon.

References[wap, 1998] (1998). Wireless Application Protocol Architecture. WAP Forum, http://www.wapforum.org.
[wap, 1999a] (1999a). Push Access Protocol. WAP Forum, http://www.wapforum.org.
[wap, 1999b] (1999b). Push Architectural Overview. WAP Forum, http://www.wapforum.org.
[wap, 1999c] (1999c). Wireless Telephony Application. WAP Forum, http://www.wapforum.org.
[mms, 2001] (2001). Technical Specification Group Terminals, Multimedia Messaging Service(MMS) Functional description, Stage 2 (Release 4). 3rd Generation Partnership Project,ftp://ftp.3gpp.org/Specs/.
[Almuallim and Dietterich, 1991] Almuallim, H. and Dietterich, T. G. (1991). Learning with many irrele-vant features. In 9th National Conference on Artificial Intelligence, pages 547–552. MIT Press.
[Aretoulaki, 1994] Aretoulaki, M. (1994). Towards a hybrid abstract generation system. In Proc. Int. Conf.on New Methods in Language Processing, Manchester, UK.
[Arons, 1997] Arons, B. (1997). SpeechSkimmer: A system for interactively skimming recorded speech.ACM Transactions on Computer Human Interaction, 4(1):3–38.
[Atal, 1972] Atal, B. S. (1972). Automatic speaker recognition based on pitch contours. Journal of Acous-tical Society of America, 52(6):1687–1697.
[Atal, 1974] Atal, B. S. (1974). Effectiveness of linear prediction characteristics of the speech wave forautomatic speaker identification and verification. Journal of Acoustical Society of America, 55(6):1304–1312.
[Ayers, 1994] Ayers, G. M. (1994). Discourse functions of pitch range in read and spontaneous speech. InOSU Working Papers, volume 44, Ohio State University.
[Azzam et al., 1999] Azzam, S., Humphreys, K., and Gaizauskas, R. (1999). Using coreference chains fortext summarization. In Proc. ACL’99 Workshop on Coreference and its Applications.
[Bagshaw et al., 1993] Bagshaw, P. C., Hiller, S. M., and Jack, M. A. (1993). Enhanced pitch trackingand the processing of F0 contours for computer aided intonation teaching. In Proc. Eurospeech, pages1003–1006, Berlin, Germany.
[Bahl et al., 1986] Bahl, L. R., Brown, P. F., de Souza, P. V., and Mercer, R. L. (1986). Maximum mutualinformation estimation of hidden Markov model parameters for speech recognition. volume 1, pages49–52.
[Bahl et al., 1987] Bahl, L. R., Brown, P. F., de Souza, P. V., and Mercer, R. L. (1987). Speech recognitionwith continuous parameter hidden Markov models. Computer Speech and Language, 2:219–234.
[Baron et al., 2002] Baron, D., Shriberg, E., and Stolcke, A. (2002). Automatic punctuation and disfluencydetection in multi-party meetings using prosodic and lexical cues. In Proc. Int. Conf. Spoken LanguageProcessing, Denver, Colorado, USA.
[Bartkova and Jouvet, 1997] Bartkova, K. and Jouvet, D. (1997). Usefulness of phonetic parameters in arejection procedure of an HMM based speech recognition system. In Proc. Eurospeech, volume 1, pages267–270, Rhodes, Greece.
[Barzilay and Elhadad, 1997] Barzilay, R. and Elhadad, M. (1997). Using lexical chains for text summa-rization. pages 10–17, Madrid, Spain.
[Batliner et al., 1996] Batliner, A., Feldhaus, A., Geißer, S., Kiss, T., Kompe, R., and Noth, E. (1996).Prosody, empty categories and parsing - a success story. In Proc. Int. Conf. Spoken Language Processing,volume 2, pages 1169–1172, Philadelphia, PA, USA.
158

159
[Baum et al., 1970] Baum, L. E., Petrie, T., Soules, G., and Weiss, N. (1970). A maximization techniqueoccurring in the statistical analysis of probabilistic functions of Markov chains. The Annals of Mathe-matical Statistics, 41(1):164–171.
[Baxendale, 1958] Baxendale, P. (1958). Machine-made index for technical literature an experiment. IBMJournal, 2(4):354–361.
[Bear et al., 1992] Bear, J., Dowding, J., and Shriberg, E. (1992). Integrating multiple knowledge sourcesfor detection and correction of repairs in human-computer dialog. In Proc. of the 30th annual meetingof the Association for Computational Linguistics, pages 56–63, Newark, DE, USA.
[Beckman, 1986] Beckman, M. (1986). Stress and Non-Stress Accent. Foris Publications, Dordrecht,Holland/Riverton.
[Bellegarda and Nahamoo, 1990] Bellegarda, J. R. and Nahamoo, D. (1990). Tied mixture continuousparameter modeling for speech recognition. IEEE Transactions on Acoustics, Speech, and Signal Pro-cessing, 38(12):2033–2045.
[Bellman, 1961] Bellman, R. (1961). Adaptive Control Processes: A Guided Tour. Princeton UniversityPress.
[Ben-Bassat, 1982] Ben-Bassat, M. (1982). Use of distance measures, information measures and errorbounds in feature evaluation. In Krishnaiah, P. R. and Kanal, L. N., editors, Handbook of Statistics,pages 773–791. North-Holland Publishing Company.
[Berger and Mittal, 2000] Berger, A. L. and Mittal, V. O. (2000). OCELOT: a system for summarizingweb pages. In Research and Development in Information Retrieval, pages 144–151.
[Bishop, 1995] Bishop, C. M. (1995). Neural Networks for Pattern recognition. Oxford University Press.
[Black et al., 1998] Black, A., Lenzo, K., and Pagel, V. (1998). Issues in building general letter to soundrules. In Proc. of the ESCA Workshop on Speech Synthesis, pages 77–80, Jenolan Caves, Australia.
[Black and Taylor, 1994] Black, A. W. and Taylor, P. A. (1994). Assigning intonation elements andprosodic phrasing for english speech synthesis from high level linguistic input. In Proc. Int. Conf.Spoken Language Processing, Yokohama, Japan.
[Bocchieri, 1993] Bocchieri, E. (1993). Vector quantization for efficient computation of continuous densitylikelihoods. volume 2, pages 692–695, Minneapolis, MN, USA.
[Bogert et al., 1963] Bogert, B. P., Healy, M. J., and Tukey, J. W. (1963). The quefrency analysis of timeseries for echoes: cepstrum, pseudo-autocovariance, cross-cepstrum, and shape cracking. In Rosenblatt,M., editor, Time Series Analysis, pages 209–243. J. Wiley, New York, USA.
[Bradley, 1997] Bradley, A. P. (1997). The use of the area under the ROC curve in the evaluation ofmachine learning algorithms. Pattern Recognition, 30(7):1145–1159.
[Breiman, 1994] Breiman, L. (1994). Bagging predictors. Technical report, Department of Statistics,University of California, Berkeley, USA.
[Breiman et al., 1984] Breiman, L., Friedman, J. H., Olshen, R. A., and Stone, C. J. (1984). Clasificationand Regression Trees. Wadsworth and Brooks, Pacific Grove, CA.
[Bridle, 1990] Bridle, J. (1990). Training stochastic model recognition algorithms as networks can lead tomaximum mutual information estimation of parameters. In Touretzky, D., editor, Advances in NeuralInformation Processing Systems, volume 2, pages 211–217. Morgan Kaufmann.
[Brown et al., 1992] Brown, P. F., Pietra, V. J. D., deSouza, P. V., Lai, J. C., and Mercer, R. L. (1992).Class-based n-gram models of natural language. Computational Linguistics, 18(4):467–479.
[Bruce, 1977] Bruce, G. (1977). Swedish word accents in sentence perspective. Technical report, Sweden.
[Buckingham, 2001] Buckingham, S. (2001). Success 4 WAP. Technical report, White Paper MobileLifestreams Ltd., Newbury, UK.

160
[Buyukkokten et al., 2001] Buyukkokten, O., Garcia-Molina, H., and Paepcke, A. (2001). Seeing thewhole in parts: Text summarization for web browsing on handheld devices. In 10th International WWWConference, Hong Kong, China.
[Campbell, 2000] Campbell, N. (2000). Timing in speech: a multi-level process. In Horne, M., editor,Prosody: Theory and Experiment, pages 281–334. Kluwer Academic Publishers, The Netherlands.
[Campbell, 1990] Campbell, W. N. (1990). Normalised segment durations in a syllable frame. In ESCATutorial and Research Workshop on Speech Synthesis, pages 169–172, Autrans, France.
[Carletta et al., 1997] Carletta, J., Isard, A., Isard, S., Kowtko, J., Newlands, A., Doherty-Sneddon, G., andAnderson, A. (1997). The reliability of a dialogue scheme. Computational Linguistics, 23(1):13–31.
[Centor and Schwartz, 1985] Centor, R. M. and Schwartz, J. S. (1985). An evaluation of methods forestimating the area under the receiver operating characteristic (ROC) curve. Medical Decision Making,5:149–156.
[Chen and Withgott, 1992] Chen, F. and Withgott, M. (1992). The use of emphasis to automatically sum-marize a spoken discourse. In Proc. IEEE Int. Conf. Acoustics, Speech and Signal Processing, volume 1,pages 229–232, San Francisco CA, USA.
[Chen, 1990] Chen, F. R. (1990). Identification of contextual factors for pronunciation networks. In Proc.IEEE Int. Conf. Acoustics, Speech and Signal Processing, pages 753–756.
[Chen and Soong, 1994] Chen, J. K. and Soong, F. K. (1994). An N-best candidates-based discriminativetraining for speech recognition applications. IEEE Trans. Speech and Audio Processing, 2(1):206–216.
[Chen et al., 1998] Chen, S., Beefman, D., and Rosenfeld, R. (1998). Evaluation metrics for languagemodels. In Proc. DARPA Broadcast News Transcription and Understanding Workshop, pages 275–280,Lansdowne, VA, USA.
[Cheveigne and Kawahara, 2001] Cheveigne, A. and Kawahara, H. (2001). Comparative evaluation of F 0estimation algorithms. In Proc. Eurospeech, pages 2451–2454, Aalborg, Denmark.
[Cohen et al., 1982] Cohen, A., Collier, R., and Hart, J. (1982). Declination: construct or intrinsic featureof speech pitch? Phonetica, 39:254–273.
[Cohen, 1960] Cohen, J. A. (1960). A coefficient of agreement for nominal scales. educational and psy-chological measurement. Educational and Psychological Measurement, 1:37–46.
[Cordoba et al., 2002] Cordoba, R., Woodland, P. C., and Gales, M. J. F. (2002). Improving cross taskperformance using MMI training. In Proc. IEEE Int. Conf. Acoustics, Speech and Signal Processing,volume 1, pages 85–88, Orlando, FL, USA.
[Corston-Oliver, 2001] Corston-Oliver, S. (2001). Text compaction for display on very small screens. InProc. NAACL Workshop on Automatic Summarization, Pittsburgh, PA, USA.
[Cover and Thomas, 1991] Cover, T. M. and Thomas, J. A. (1991). Elements of Information Theory. JohnWiley & Sons, New York, USA.
[Cutler et al., 1997] Cutler, A., Dahan, D., and Donselaar, . W. A. V. (1997). Prosody in the comprehensionof spoken language: A literature review. Language and Speech, 40(2).
[Dash and Liu, 1997] Dash, M. and Liu, H. (1997). Feature selection for classification. Intelligent DataAnalysis, 1(3).
[Dash et al., 2000] Dash, M., Liu, H., and Motoda, H. (2000). Pacific-asia conference on knowledgediscovery and data mining. pages 98–109, Kyoto, Japan.
[DeJong, 1982] DeJong, G. (1982). An overview of the FRUMP system. In Lehnert, W. G. and Ringle,M. H., editors, Strategies for Natural Language Processing, pages 149–176. Erlbaum, Hillsdale, NJ,USA.

161
[Dempster et al., 1977] Dempster, A., Laird, N., and Rubin, D. (1977). Maximum likelihood from incom-plete data via the EM algorithm. Journal of the Royal Statistical Society, 39 (Series B):1–38.
[Deshmukh et al., 1999] Deshmukh, N., Ganapathiraju, A., and Picone, J. (1999). Hierarchical search forlarge vocabulary conversational speech recognition. IEEE Signal Processing Magazine, 16(5):84–107.
[Duda et al., 2000] Duda, R. O., Stork, D. G., and Hart, P. E. (2000). Pattern Classification and SceneAnalysis Part 1: Pattern Classification. John Wiley and Sons, The Netherlands.
[Dutoit et al., 1996] Dutoit, T., Pagel, V., Pierret, N., Bataille, F., and van der Vrecken, O. (1996). TheMBROLA project: towards a set of high quality speech synthesizers free of use for non commercialpurposes. In Proc. Int. Conf. Spoken Language Processing, volume 3, pages 1393–1396, Philadelphia,PA, USA.
[Edmundson, 1969] Edmundson, H. P. (1969). New methods in automatic extracting. Journal of the ACM,16(2):264–285.
[Ehara et al., 1997] Ehara, T., Wakao, T., Sawamura, E., Maruyama, I., Abe, Y., and Shirai, K. (1997).Application of natural language processing and speech processing technology to production of closed-caption tv programs for the hearing impaired. In Natural Language Processing Pacific Rim Symposium,Phuket Thailand.
[Fach, 1999] Fach, M. (1999). A comparison between syntactic and prosodic phrasing. In Proc. Eu-rospeech, volume 1, pages 527–530, Budapest, Hungary.
[Fawcett, 2001] Fawcett, T. (2001). Using rule sets to maximize ROC performance. In IEEE InternationalConference on Data Mining (ICDM-01), San Jose, CA, USA.
[Ferri et al., 1994] Ferri, F., Pudil, P., Hatef, M., and Kittler, J. (1994). Comparative study of techniques forlarge-scale feature selection. In Pattern Recognition in Practice IV, Multiple Paradigms, ComparativeStudies and Hybrid Systems, pages 403–413, Amsterdam, Netherlands. Elsevier.
[Fetter et al., 1996] Fetter, P., Kaltenmeier, A., Kuhn, T., and Regel-Brietzmann, P. (1996). Improvedmodeling of oov words in spontaneous speech. In Proc. IEEE Int. Conf. Acoustics, Speech and SignalProcessing, volume 1, pages 534–537, Atlanta, GA, USA.
[Finke and Waibel, 1997] Finke, M. and Waibel, A. (1997). Speaking mode dependent pronunciation mod-eling in large vocabulary conversational speech recognition. In Proc. Eurospeech, volume 5, pages2379–2382, Rhodes, Greece.
[Fiscus, 1997] Fiscus, J. (1997). A post-processing system to yield reduced word error rates: Recognizeroutput voting error reduction (ROVER). In Proceedings of the IEEE workshop on Automatic SpeechRecognition and Understanding, Santa Barbara, CA, USA.
[Fosler et al., 1996] Fosler, E., Weintraub, M., Wegmann, S., Koa, Y.-H., Khudanpur, S., Galles, C., andSaraclar, M. (1996). Automatic learning of word pronunciations from data. In Proc. Int. Conf. SpokenLanguage Processing, Philadelphia, PA, USA.
[Fosler-Lussier, 1999] Fosler-Lussier, E. (1999). Dynamic Pronunciation Models for Automatic SpeechRecognition. PhD thesis, ICSI, University of California at Berkeley, CA, USA.
[Fowler and Housum, 1987] Fowler, C. and Housum, J. (1987). Talkers’ signalling of ‘new’ and ‘old’words in speech and listeners’ perception and use of the distinction. Journal of Memory and Language,26:489–504.
[Freund, 1995] Freund, Y. (1995). Boosting a weak learning algorithm by majority. Information andComputation, 121(2):256–286.
[Fromkin, 1987] Fromkin, V. A. (1987). A note on the suprasegmental representation of prosody. In Shan-non, R. and Shockey, L., editors, In Honor of Ilse Lehiste, pages 99–107. Foris Publications, Dordrecht,Holland/Riverton.
162
[Fukunaga, 1990] Fukunaga, K. (1990). Introduction to Statistical Pattern Recognition (2nd ed.). Aca-demic Press, London, UK.
[Fum et al., 1985] Fum, D., Guida, G., and Tasso, C. (1985). Evaluating importance: A step towards textsummarization. In Proc. of 9th IJCAI, pages 840–844, Los Angeles, CA, USA.
[Furui, 1982] Furui, S. (1982). Speaker-independent isolated word recognition using dynamic features ofspeech spectrum. IEEE Trans. Speech and Audio Processing, 34(1):52–59.
[Garofolo et al., 2001] Garofolo, J., Lard, J., and Voorhees, E. (2001). TREC-9 spoken document retrievaltrack: overview and results. In Proc. 9th Text Retrieval Conference (TREC-9), Gaithersburg, Maryland,USA.
[Gauvain and Lee, 1994] Gauvain, J. L. and Lee, C. H. (1994). Maximum a posteriori estimation for mul-tivariate gaussian mixture observations of Markov chains. IEEE Trans. Speech and Audio Processing,2(1):291–298.
[Godfrey et al., 1992] Godfrey, J., Holliman, E., and McDaniel, J. (1992). Switchboard: Telephone speechcorpus for research and development. In Proc. IEEE Int. Conf. Acoustics, Speech and Signal Processing,volume 1, pages 517–520, San Francisco CA, USA.
[Gold and Morgan, 1999] Gold, B. and Morgan, N. (1999). Speech and Audio Signal Processing: Pro-cessing and Perception of Speech and Music. John Wiley and Sons, The Netherlands.
[Goldstein and Carbonell, 1998] Goldstein, J. and Carbonell, J. (1998). Use of MMR diversity-basedreranking in document reranking and summarization. In Hiemstra, D., de Jong, F., and Netter, K.,editors, Proc. 14th Twente Workshop on Language Technology, Enschede, The Netherlands.
[Goldstein et al., 1999] Goldstein, J., Kantrowitz, M., Mittal, V. O., and G.Carbonell, J. (1999). Sum-marizing text documents: Sentence selection and evaluation metrics. In Research and Development inInformation Retrieval, pages 121–128.
[Gotoh and Renals, 2000a] Gotoh, Y. and Renals, S. (2000a). Information extraction from broadcast news.Philosophical Transactions of the Royal Society of London, Series A, 358:1295–1310.
[Gotoh and Renals, 2000b] Gotoh, Y. and Renals, S. (2000b). Sentence boundary detection in broadcastspeech transcripts. In ISCA ITRW: ASR2000, pages 228–235, Paris.
[Graff, 1997] Graff, D. (1997). The 1996 broadcast news speech and language-model corpus. In Proceed-ings DARPA Speech Recognition Workshop, Chatilly, VA, USA.
[Grandour, 1978] Grandour, J. (1978). The perception of tone. In Fromkin, V., editor, Tone: a linguisticsurvey, pages 41–76. Academic Press, New York, USA.
[Green and Swets, 1966] Green, D. M. and Swets, J. A. (1966). Signal Detection Theory and Psy-chophysics. Wiley.
[Greenberg, 1997] Greenberg, S. (1997). On the origins of speech intelligibility in the real world. In Proc.ESCA Workshop on Robust Speech Recognition for Unknown Communication Channels, pages 23–32,Pont-a-Mousson, France.
[Grefenstette, 1998] Grefenstette, G. (1998). Producing intelligent telegraphic text reduction to providean audio scanning service for the blind. In Proc. Symposium on Intelligent Text Summarization, pages111–117, Stanford, CA, USA. American Association for Artificial Intelligence.
[Grosz and Sidner, 1986] Grosz, B. and Sidner, C. (1986). Attention, intentions, and the structure of dis-course. Computational Linguistics, 12(3):175–204.
[Hahn and Mani, 2000] Hahn, U. and Mani, I. (2000). The challenges of automatic summarization. IEEEComputer, 33(11):29–36.

163
[Hakkani-Tur et al., 1999] Hakkani-Tur, D., Tur, G., Stolcke, A., and Shriberg, E. (1999). Combiningwords and prosody for information extraction from speech. In Proc. Eurospeech, pages 1991–1994,Budapest, Hungary.
[Hall and Smith, 1997] Hall, M. A. and Smith, L. A. (1997). Feature subset selection: a correlation basedfilter approach. In Proc. of the International Conference on Neural Information Processing and Intelli-gent Information Systems, pages 855–858. Springer.
[Hand, 1997] Hand, D. J. (1997). Construction and Assessment of Classification Rules. John Wiley andSons, USA.
[Hanley and McNeil, 1982] Hanley, J. A. and McNeil, B. J. (1982). The meaning and use of the area undera receiver operating characteristic ROC curve. Radiology, 82(143):29–36.
[Hart et al., ] Hart, J. T., Collier, R., and Cohen, A. A perceptual study of intonation. Cambridge UniversityPress, Cambridge, UK.
[Hastie et al., 2002] Hastie, H. W., Poesio, M., and Isard, S. (2002). Automatically predicting dialoguestructure using prosodic features. Speech Communication, 36:63–79.
[Haton, 1985] Haton, J.-P. (1985). Knowledge based and expert systems in automatic speech recognition.In de Mori, R., editor, New Systems and Architectures for Automatic Speech Recognition and Synthesis.
[Hauptmann and Witbrock, 1997] Hauptmann, A. and Witbrock, M. (1997). Informedia: News-on-demand multimedia information acquisition and retrieval. In Maybury, M., editor, Intelligent MultimediaInformation Retrieval, pages 215–240. MIT Press, Cambridge, MA, USA.
[He et al., 1999] He, L., Sanocki, E., Gupta, A., and Grudin, J. (1999). Auto-summarization of audio-videopresentations. In Proc. 1999 ACM Multimedia Conference, pages 489–498, Orlando, FL, USA.
[Heeman and Allen, 1997] Heeman, P. A. and Allen, J. F. (1997). Intonational boundaries, speech repairs,and discourse markers: Modeling spoken dialog. In Cohen, P. R. and Wahlster, W., editors, Proceedingsof 35th Annual Meeting of the Association for Computational Linguistics and 8th Conference of theEuropean Chapter of the Association for Computational Linguistics, pages 254–261, Madrid, Spain.Association for Computational Linguistics.
[Hermansky, 1990] Hermansky, H. (1990). Perceptual linear predictive (PLP) analysis of speech. Journalof Acoustical Society of America, 87:1738–1752.
[Hermansky and Morgan, 1994] Hermansky, H. and Morgan, N. (1994). RASTA processing of speech.IEEE Trans. Speech and Audio Processing, 2(4):578–589.
[Hirose, 1997] Hirose, K. (1997). Disambiguating recognition results by prosodic features. In Sagisaka,Y., Campbell, N., and Higuchi, N., editors, Computing Prosody, volume 1224, pages 327–342. Springer-Verlag, New York, USA.
[Hirschberg, 2000] Hirschberg, J. (2000). A corpus-based approach to the study of speaking style. InHorne, M., editor, Prosody: Theory and Experiment, pages 335–350. Kluwer Academic Publishers, TheNetherlands.
[Hirschberg et al., 2001] Hirschberg, J., Bacchiani, M., Hindle, D., Isenhour, P., Rosenberg, A., Stark, L.,Stead, L., Whittaker, S., and Zamchick, G. (2001). SCANMail: Browsing and searching speech data bycontent. In Proc. Eurospeech, Aalborg, Denmark.
[Hirschberg et al., 1999] Hirschberg, J., Litman, D., and Swerts, M. (1999). Prosodic cues to recognitionerrors. In Proc. of the IEEE Workshop on Automatic Speech Recognition and Understanding, pages –,Keystone, USA.
[Hirschberg and Nakatani, 1998] Hirschberg, J. and Nakatani, C. (1998). Acoustic indicators of topicsegmentation. In Proc. Int. Conf. Spoken Language Processing, volume 4, pages 1255–1258, Sydney,Australia.

164
[Hirschman et al., 1999] Hirschman, L., Burger, J., Palmer, D., and Robinson, P. (1999). Evaluating con-tent extraction from audio sources. In Proc. of the ESCA Workshop on Accessing Information in SpokenAudio, pages –, Cambridge, UK.
[Hochberg et al., 1995] Hochberg, M., Renals, S., Robinson, T., and Cook, G. (1995). Recent improve-ments to the ABBOT large vocabulary CSR system. In Proc. IEEE Int. Conf. Acoustics, Speech andSignal Processing, pages 69–72, Detroit, MI, USA.
[Hori and Furui, 2000] Hori, C. and Furui, S. (2000). Improvements in automatic speech summarizationand evaluation methods. In Proc. Int. Conf. Spoken Language Processing, volume 4, pages 326–329,Beijing, China.
[Hori et al., 2002] Hori, C., Furui, S., Malkin, R., Yu, H., and Waibel, A. (2002). Automatic speechsummarization applied to english broadcast news speech. In Proc. IEEE Int. Conf. Acoustics, Speechand Signal Processing, pages –, Orlando, FL, USA.
[Huang et al., 1990] Huang, X. D., Ariki, Y., and Jack, M. (1990). Hidden Markov Models for SpeechRecognition. Edinburgh University Press, Edinburgh, UK.
[Hunt, 1999] Hunt, M. J. (1999). Spectral signal processing for ASR. In IEEE Workshop on AutomaticSpeech Recognition and Understanding, ASRU-99, pages –, Keystone, Colorado, USA.
[Jelinek et al., 1977] Jelinek, F., Mercer, R., Bahl, L., and Baker, J. K. (1977). Perplexity - a measureof difficulty of speech recognition tasks. In Proc. 94th Meeting Acoustical Society of America, MiamiBeach, Florida, USA.
[Jiang, 1998] Jiang, H. (1998). Reliability, costs and delay performance of sending short message servicein wireless systems. In Proc. of the ICUPC, pages 1073–1077, Florence, Italy.
[Jing et al., 1998] Jing, H., Barzilay, R., McKeown, K., and Elhadad, M. (1998). Summarization evaluationmethods experiments and analysis. pages 60–68, Stanford, CA, USA.
[Kameyama and Arima, 1994] Kameyama, M. and Arima, I. (1994). Coping with aboutness complexityin information extraction from spoken dialogues. In Proc. Int. Conf. Spoken Language Processing,volume 1, pages 87–90, Yokohama, Japan.
[Kato, 1994] Kato, Y. (1994). Voice message summary for voice services. In International Symposium onSpeech, Image Processing and Neural Networks, pages 622–625, Hong-Kong.
[Katz, 1987] Katz, S. M. (1987). Estimation of probabilities from sparse data for the language modelcomponent of a speech recognizer. IEEE Trans. Acoustics, Speech and Signal Processing, 35:400–401.
[Kingsbury et al., 1998] Kingsbury, B., Morgan, N., and Greenberg, S. (1998). Robust speech recognitionusing the modulation spectrogram. Speech Communication, 25:117–132.
[Kira and Rendell, 1992] Kira, K. and Rendell, L. A. (1992). The feature selection problem: Traditionalmethods and a new algorithm. In 10th National Conference on Artificial Intelligence, pages 129–134.MIT Press.
[Knight and Marcu, 2000] Knight, K. and Marcu, D. (2000). Statistics-based summarization — step one:Sentence comprehension. In Proc. AAAI.
[Kohavi and John, 1997] Kohavi, R. and John, G. H. (1997). Wrappers for feature subset selection. Artifi-cial Intelligence, 97(1–2):273–323.
[Kohavi et al., 1997] Kohavi, R., Langley, P., and Yun, Y. (1997). The utility of feature weighting innearest neighbor algorithms. In van Someren, M. and Widmer, G., editors, Machine Learning: ECML-97. Lecture Notes in Computer Science, volume 1224, pages 85–92. Springer-Verlag, Berlin, Germany.
[Koller and Sahami, 1996] Koller, D. and Sahami, M. (1996). Toward optimal feature selection. In Inter-national Conference on Machine Learning, pages 284–292.

165
[Kompe et al., 1994] Kompe, R., Niemann, H., Noth, E., Kießling, A., Kilian, U., Brietzmann, P. R., andBatliner, A. (1994). Automatic classification of prosodically marked phrase boundaries in German. InProc. IEEE Int. Conf. Acoustics, Speech and Signal Processing, volume 2, pages 173–176, Adelaide,Australia.
[Kononenko, 1994] Kononenko, I. (1994). Estimating attributes: Analysis and extensions of RELIEF. InEuropean Conference on Machine Learning, pages 171–182.
[Koumpis et al., 1999] Koumpis, K., Cvetkovic, S., and Peersman, G. (1999). Performance evaluation ofSMS-based email and voicemail notification architecture. In Proc. of the 5th Workshop on EmergingTechnologies in Telecommunications, pages 282–286, Bayona, Spain.
[Koumpis and Renals, 2000] Koumpis, K. and Renals, S. (2000). Transcription and summarization ofvoicemail speech. In Proc. Int. Conf. Spoken Language Processing, volume 2, pages 688–691, Beijing.
[Koumpis and Renals, 2001] Koumpis, K. and Renals, S. (2001). The role of prosody in a voicemailsummarization system. In Proc. ISCA Workshop on Prosody in Speech Recognition and Understanding,pages 87–92, Red Bank, NJ, USA.
[Koumpis et al., 2001] Koumpis, K., Renals, S., and Niranjan, M. (2001). Extractive summarization ofvoicemail using lexical and prosodic feature subset selection. In Proc. Eurospeech, pages 2377–2380,Aalborg, Denmark.
[Krzanowski, 1988] Krzanowski, W. J. (1988). Principles of Multivariate Analysis. Clarendon Press,Oxford, UK.
[Kubala et al., 1998] Kubala, F., Schwartz, R., Stone, R., and Weischedel, R. (1998). Named entity ex-traction from speech. In Proc. DARPA Broadcast News Transcription and Understanding Workshop,Lansdowne, VA, USA.
[Kupiec et al., 1995] Kupiec, J., Pederson, J., and Chen, F. (1995). A trainable document summarizer. InACM SIGIR ’95, pages 68–73.
[Ladd, 1996] Ladd, D. R. (1996). Intonational Phonology. Cambridge University Press, Cambridge, UK.
[Lamel and Adda, 1996] Lamel, L. and Adda, G. (1996). On designing lexicons for large vocabulary,continuous speech recognition. In Proceedings of the International Conference on Spoken LanguageProcessing, Philadelphia, PA, USA.
[Langley and Sage, 1994] Langley, P. and Sage, S. (1994). Induction of selective Bayesian classifiers. InConference on Uncertainty in Artificial Intelligence, pages 399–406, San Francisco, CA, USA.
[Lavie et al., 1997] Lavie, A., Waibel, A., Levin, L., Finke, M., Gates, D., Gavalda, M., Zeppenfeld, T.,and Zhan, P. (1997). JANUS-III: speech-to-speech translation in multiple languages. In Proc. IEEE Int.Conf. Acoustics, Speech and Signal Processing, volume 1, pages 99–102, Munich, Germany.
[Lea, 1980] Lea, W. (1980). Prosodic aids to speech recognition. In Lea, W., editor, Trends in SpeechRecognition, pages 166–205. Prentice-Hall Inc., Englewood Cliffs, NJ, USA.
[Leggeter and Woodland, 1995] Leggeter, C. J. and Woodland, P. C. (1995). Maximum likelihood linearregression for speaker adaptation of continuous density hidden Markov models. Computer Speech andLanguage, 9:171–185.
[Lehiste, 1970] Lehiste, I. (1970). Suprasegmentals. MIT Press, Cambridge, MA, USA.
[Lehnert, 1981] Lehnert, W. G. (1981). Plot units and narrative summarization. Cognitive Science,5(4):293–331.
[Liberman and Prince, 1977] Liberman, M. Y. and Prince, A. (1977). On stress and linguistic rhythm.IEEE Transactions on Computers, 8:249–336.
[Lickley, 1994] Lickley, R. J. (1994). Detecting Disfluency in Spontaneous Speech. PhD thesis, Universityof Edinburgh, Scotland, UK.

166
[Lindfield et al., 1999] Lindfield, K. C., Wingfield, A., and Goodglass, H. (1999). The role of prosody inthe mental lexicon. Brain and Language, 68(1–2):312–317.
[Liu and Setiono, 1996] Liu, H. and Setiono, R. (1996). A probabilistic approach to feature selection: afilter solution. In Proc. of International Conference on Machine Learning, pages 319–327.
[Luhn, 1958] Luhn, H. P. (1958). The automatic creation of literature abstracts. IBM Journal of Researchand Development, 2:159–165.
[MacKay, 1992] MacKay, D. J. C. (1992). A practical Bayesian framework for backpropagation networks.NeuralComputation, 4:448–472.
[Maclay and Osgood, 1959] Maclay, H. and Osgood, C. (1959). Hesitation phenomena in spontaneousenglish speech. Word, 1:19–44.
[Makhoul et al., 1999] Makhoul, J., Kubala, F., Schwartz, R., and Weischedel, R. (1999). Performancemeasures for information extraction. In Proc. of the DARPA Broadcast News Workshop, pages 249–252,Herndon, VA, USA.
[Mani and Bloedorn, 1998] Mani, I. and Bloedorn, E. (1998). Machine learning of generic and user-focused summarization. In Proc. of 15th National Conference on AI (AAAI-98), pages 821–826.
[Mani et al., 1998] Mani, I., House, D., Klein, G., Hirschman, L., Obrst, L., Firmin, T., Chrzanowski, M.,and Sundheim, B. (1998). TIPSTER text summarization evaluation conference (SUMMAC) overview.Technical report, The MITRE Corp., Virginia, USA.
[Mani and Maybury, 1999] Mani, I. and Maybury, M. (1999). Advances in automatic text summarization.MIT Press, USA.
[Marasek, 1997] Marasek, K. (1997). Electroglottographic description of voice quality. Technical Re-port 2, University of Stuttgart, Germany.
[Marcu, 2001] Marcu, D. (2001). The document understanding conference: A new forum for summariza-tion research and evaluation (duc). In ACL Workshop on Automatic Summarization 2001, Pittsburgh,PA, USA.
[Martin et al., 1997] Martin, A., Doddington, G., Kamm, T., Ordowski, M., and Pryzybocki, M. (1997).The DET curve in assessment of detection task performance. In Proc. Eurospeech, pages 1895–1898.ESCA.
[McKeown and Radev, 1999] McKeown, K. and Radev, D. R. (1999). Generating summaries of multiplenews articles. In Mani, I. and Maybury, M. T., editors, Advances in Automatic Text Summarization,chapter 24, pages 381–389. MIT Press.
[Medan et al., 1991] Medan, Y., Yair, E., and Chazan, D. (1991). Super resolution pitch determination ofspeech signal. IEEE Trans. Acoustics, Speech and Signal Processing, 39(1):40–48.
[Merlino et al., 1997] Merlino, A., Morey, D., and Maybury, M. T. (1997). Broadcast news navigationusing story segmentation. In Proc. ACM Multimedia, pages 381–391, New York, USA.
[Metter and Colomb, 2000] Metter, M. and Colomb, R. (2000). WAP enabling existing HTML applica-tions. In Proc. of the 1st Australasian User Interface Conference, pages 49–57, Canberra, Australia.
[Meyer and Schvaneveldt, 1971] Meyer, D. E. and Schvaneveldt, R. (1971). Facilitation in recognizingpairs of words: evidence of a dependence between retrieval operations. Journal of Experimental Psy-chology, 90:227–235.
[Mirghafori et al., 1996] Mirghafori, N., Fosler, E., and Morgan, N. (1996). Towards robustness to fastspeech in ASR. In Proc. IEEE Int. Conf. Acoustics, Speech and Signal Processing, pages 335–338,Atlanta, GA.
[Morgan and Bourlard, 1995] Morgan, N. and Bourlard, H. (1995). An introduction to hybridHMM/connectionist continuous speech recognition. IEEE Signal Processing Magazine, pages 25–42.

167
[Morgan et al., 1997] Morgan, N., Fosler, E., and Mirghafori, N. (1997). Speech recognition using on-lineestimation of speaking rate. In Proc. Eurospeech, volume 4, pages 2079–2082, Rhodes, Greece.
[Moulines and Charpentier, 1990] Moulines, E. and Charpentier, F. (1990). Pitch-synchronous waveformprocessing techniques for text to speech synthesis using diphone. Speech Communication, 9:453–467.
[Myaeng and Hang, 1999] Myaeng, S. H. and Hang, D. (1999). Development and evaluation of a sta-tistically based document summarization system. In Mani, I. and Maybury, M., editors, Advances inAutomatic Text Summarization, pages 61–70. MIT press, Cambridge, MA, USA.
[Nabney and Bishop, 2001] Nabney, I. and Bishop, C. (2001). The netlab toolbox for matlab. Technicalreport, http://www.ncrg.aston.ac.uk/netlab, Birmingham, UK.
[Nakatani and Hirschberg, 1994] Nakatani, C. and Hirschberg, J. (1994). A corpus-based study of repaircues in spontaneous speech. Journal of Acoustical Society of America, 95(3):1603–1616.
[Narendra and Fukunaga, 1977] Narendra, P. M. and Fukunaga, K. (1977). A branch and bound algorithmfor feature selection. IEEE Transactions on Computers, 26(9):917–922.
[Neal, 1998] Neal, R. (1998). Assessing relevance determination methods using DELVE generalization inneural networks and machine learning. SpringerVerlag.
[Neto et al., 1995] Neto, J., Almeida, L., Hochberg, M., Martins, C., Nunes, L., Renals, S., and Robinson,T. (1995). Speaker adaptation for hybrid HMM–ANN continuous speech recogniton system. In Proc.Eurospeech, pages 2171–2174, Madrid, Spain.
[Ney and Aubert, 1996] Ney, H. and Aubert, X. (1996). Dynamic programming search: from digit stringsto large vocabulary word graphs. In Lee, C.-H., Paliwal, K. K., and Soong, F. K., editors, Automaticspeech and speaker recognition. Advanced topics, pages 385–413. Kluwer Academic Publishers.
[Ney et al., 1994] Ney, H., Essen, U., and Kneser, R. (1994). On structuring probabilistic dependences instochastic language modelling. Computer Speech and Language, 8:1–38.
[Ney and Ortmanns, 1999] Ney, H. and Ortmanns, S. (1999). Dynamic programming search for continu-ous speech recognition. IEEE Signal Processing Magazine, 16(5):64–83.
[Noth et al., 2000] Noth, E., Batliner, A., Kießling, A., Kompe, R., and Niemann, H. (2000). VERBMO-BIL: The use of prosody in the linguistic components of a speech understanding system. IEEE Trans.Acoustics, Speech and Signal Processing, 8(5):519–532.
[O’Shaughnessy, 1992] O’Shaughnessy, D. (1992). Recognition of hesitations in spontaneous speech. InProc. IEEE Int. Conf. Acoustics, Speech and Signal Processing, volume 1, pages 593–596, San FranciscoCA, USA.
[O’Shaughnesy, 1995] O’Shaughnesy, D. (1995). Timing patterns in fluent and disfluent spontaneousspeech. In Proc. IEEE Int. Conf. Acoustics, Speech and Signal Processing, pages 600–6003, Detroit,MI, USA.
[Padmanabhan et al., 1998] Padmanabhan, M., Eide, E., Ramabhardan, G., Ramaswany, G., and Bahl, L.(1998). Speech recognition performance on a voicemail transcription task. In Proc. IEEE Int. Conf.Acoustics, Speech and Signal Processing, pages 913–916, Seattle, WA, USA.
[Padmanabhan et al., 1997] Padmanabhan, M., Ramabhardan, G., Eide, E., Ramaswany, G., Bahl, L.,Gopalakrishnan, P., and Roukos, S. (1997). Transcription of new speaking styles - voicemail. In Proc.DARPA Workshop, pages 119–124, VA, USA.
[Paice, 1981] Paice, C. (1981). The automatic generation of literary abstracts: an approach based on theidentification of self-indicating phrases. In Norman, O. R., Robertson, S. E., van Rijsbergen, C. J., andWilliams, P. W., editors, Information Retrieval Research, pages 172–191. Butterworth, London, UK.
[Paice, 1990] Paice, C. (1990). Constructing literature abstracts by computer: techniques and prospects.Information Processing and Management, 26(1):171–186.

168
[Paksoy et al., 1997] Paksoy, E., McCree, A., Viswananthan, V., and Linn, J. (1997). A variable-rate CELPcoder for fast remote voicemail retrieval using a notebook computer. In Proc. of the IEEE Workshop onMultimedia Signal Processing, pages 119–124, Princeton, USA.
[Palmer et al., 2000] Palmer, D., Ostendorf, M., and Burger, J. D. (2000). Robust information extractionfrom automatically generated speech transcriptions. Speech Communication, 32(1–2):95–109.
[Paul, 1992] Paul, D. B. (1992). An efficient A* stack decoder algorithm for continuous speech recognitionwith a stochastic language model. In Proc. IEEE Int. Conf. Acoustics, Speech and Signal Processing,volume 1, pages 25–28, San Francisco CA, USA.
[Peersman et al., 2000] Peersman, G., Cvetkovic, S., Griffiths, P., and Spear, H. (2000). The global systemfor mobile communications short message service. IEEE Personal Communications Mag., 7:6–14.
[Pierrehumbert, 1980] Pierrehumbert, J. (1980). The Phonology and Phonetics of English Intonation. PhDthesis, MIT, Cambridge, MA, USA.
[Porter, 1980] Porter, M. (1980). An algorithm for suffix stripping. Program, 14(3):130–137.
[Price et al., 1989] Price, P. J., Ostendorf, M., and Wightman, C. W. (1989). Prosody and parsing. In Proc.DARPA Speech and Natural Language Workshop, pages 5–11, Philadelphia, PA, USA.
[Provost and Fawcett, 2001] Provost, F. and Fawcett, T. (2001). Robust classification for imprecise envi-ronments. Machine Learning, 42(3):203–231.
[Quinlan, 1993] Quinlan, R. J. (1993). C4.5: Programs for Machine Learning. Morgan Kaufmann.
[Rabiner, 1989] Rabiner, L. R. (1989). A tutorial on hidden Markov models and selected applications inspeech recognition. Proc. of the IEEE, 77(2):257–286.
[Rabiner and Juang, 1993] Rabiner, L. R. and Juang, B.-H. (1993). Fundamentals of Speech Recognition.Prentice-Hall.
[Rabiner et al., 1976] Rabiner, R., Cheng, M., Rosenberg, A., and McGonegal, C. (1976). A comparativestudy of several pitch detection algorithms. IEEE Trans. Acoustics, Speech and Signal Processing,24:399–418.
[Radev et al., 2000] Radev, D. R., Jing, H., and Budzikowska, M. (2000). Summarization of multiple doc-uments: clustering, sentence extraction, and evaluation. In ANLP/NAACL Workshop on Summarization,Seattle, WA,USA.
[Rau et al., 1989] Rau, L. F., Jacobs, P. S., and Zernik, U. (1989). Information extraction and text sum-marization using lingustic knowledge acquisition. Information processing and management, 25(4):419–428.
[Raymer et al., 2000] Raymer, M. L., Punch, W. F., Goodman, E. D., Kuhn, L. A., and Jain, A. K. (2000).Dimensionality reduction using genetic algorithms. IEEE Transactions on Evolutionary Computation,4(2):164–171.
[Reimer and Hahn, 1988] Reimer, U. and Hahn, U. (1988). Text condensationas knowledgebase abstrac-tion. In Proc. IEEE Conf. on AI Applications, pages 338–344.
[Renals and Hochberg, 1999] Renals, S. and Hochberg, M. (1999). Start-synchronous search for largevocabulary continuous speech recognition. IEEE Trans. Speech and Audio Processing, 7:542–553.
[Renals et al., 1994] Renals, S., Morgan, N., Bourlard, H., Cohen, M., and Franco, H. (1994). Connec-tionist probability estimators in HMM speech recognition. IEEE Trans. Speech and Audio Processing,2:161–175.
[Riis, 1998] Riis, S. K. (1998). Hidden Markov Models and Neural Networks for Speech Recognition.PhD thesis, Technical University of Denmark, Lyngby, Denmark.
[Rijsbergen, 1979] Rijsbergen, C. J. V. (1979). Information Retrieval (2nd edition). Butterworths, London,UK.

169
[Riley, 1991] Riley, M. D. (1991). A statistical model for generating pronunciation networks. In Proc.IEEE Int. Conf. Acoustics, Speech and Signal Processing, pages 737–740, Toronto, Canada.
[Robertson and Sparck Jones, 1997] Robertson, S. E. and Sparck Jones, K. (1997). Simple proven ap-proaches to text retrieval.
[Robinson et al., 2002] Robinson, A. J., Cook, G. D., Ellis, D. P. W., Fosler-Lussier, E., Renals, S. J., andWilliams, D. A. G. (2002). Connectionist speech recognition of broadcast news. Speech Communication,37:27–45.
[Robinson and Christie, 1998] Robinson, T. and Christie, J. (1998). Time-first search for large vocabularyspeech recognition. In Proc. IEEE Int. Conf. Acoustics, Speech and Signal Processing, pages 829–832,Seattle, WA, USA.
[Robinson et al., 2000] Robinson, T., Christie, J., and Cook, G. (2000). Time-first search for speech recog-nition. Submitted to Speech Communication.
[Robinson et al., 1996] Robinson, T., Hochberg, M., and Renals, S. (1996). The use of recurrent networksin continuous speech recognition. In Lee, C.-H., Paliwal, K. K., and Soong, F. K., editors, AutomaticSpeech and Speaker Recognition – Advanced Topics, pages 233–258. Kluwer Academic Publishers.
[Rohlicek et al., 1992] Rohlicek, J. R., Ayuso, D., Bates, M., Bobrow, R., Boulanger, A., Gish, H., Jean-renaud, P., Meteer, M., and Siu, M. (1992). Gisting conversational speech. In Proc. IEEE Int. Conf.Acoustics, Speech and Signal Processing, volume 2, pages 113–117, San Francisco CA, USA.
[Rosenfeld, 2000] Rosenfeld, R. (2000). Two decades of statistical language modeling: Where do we gofrom here? Proc. IEEE, 88:1270–1278.
[Russel and Norvig, 1995] Russel, S. and Norvig, P. (1995). Artificial Intelligence: A Modern Approach.Prentice Hall.
[Sagisaka, 1990] Sagisaka, Y. (1990). Speech synthesis from text. IEEE Communications Magazine,28:35–41.
[Salton et al., 1999] Salton, G., Allan, J., Buckley, C., and Singhal, A. (1999). Automatic analysis, themegeneration, and summarization of machine-readable texts. Science, 264:1421–1426.
[Saon and Padmanabhan, 2001] Saon, G. and Padmanabhan, M. (2001). Data-driven approach to design-ing compound words for continuous speech recognition. IEEE Trans. Speech and Audio Processing,9(4):327–332.
[Schalkoff, 1992] Schalkoff, R. J. (1992). Pattern Recognition: Statistical, Structural and Neural Ap-proaches. John Wiley & Sons, New York, USA.
[Schapire, 1990] Schapire, R. E. (1990). The strength of weak learnability. Machine Learning, 5(2):197–227.
[Scherer et al., 1984] Scherer, K., Ladd, D. R., and Silverman, K. (1984). Vocal cues to speaker affect:testing two models. Journal of the Acoustical Society of America, 76:1346–1356.
[Schmid et al., 1993] Schmid, P., Cole, R., and Fanty, M. (1993). Automatically generated word pro-nunciations from phoneme classifier output. In Proc. IEEE Int. Conf. Acoustics, Speech and SignalProcessing, pages 223–226, Minneapolis, MN, USA.
[Scott et al., 1998] Scott, M., Niranjan, M., and Prager, R. (1998). Parcel: Feature subset selection invariable cost domains. Technical report, CUED TR-323, ftp://svr-ftp.eng.cam.ac.uk/pub/reports, Cam-bridge, UK.
[Selman, 1995] Selman, B. (1995). Stochastic search and phase transitions: AI meets physics. In Proceed-ings of the 14th International Joint Conference on Artificial Intelligence, volume 1, pages 998–1002,Montreal, Canada.

170
[Shriberg, 1994] Shriberg, E. (1994). Preliminaries to a Theory of Speech Disfluencies. PhD thesis, Uni-versity of California at Berkeley, CA, USA.
[Shriberg et al., 2000] Shriberg, E., Stolcke, A., Hakkani-Tur, D., and Tur, G. (2000). Prosody-basedautomatic segmentation of speech into sentences and topics. Speech Communication, 32(1–2):127–154.
[Siegler and Stern, 1995] Siegler, M. A. and Stern, R. M. (1995). On the effects of speech rate in large vo-cabulary speech recognition systems. In Proc. IEEE Int. Conf. Acoustics, Speech and Signal Processing,pages 612–615, Detroit, MI, USA.
[Silipo and Crestani, 2000] Silipo, R. and Crestani, F. (2000). Prosodic stress and topic detection in spokensentences. In Proceedings of the SPIRE 2000 Conference, pages 243–252, Coruna, Spain.
[Silipo and Greenberg, 1999] Silipo, R. and Greenberg, S. (1999). Automatic transcription of prosodicstress for spontaneous english discourse. In Proc. Int. Congress of Phonetic Sciences, San Francisco,CA, USA.
[Silipo and Greenberg, 2000] Silipo, R. and Greenberg, S. (2000). Prosodic stress revisited: Reassessingthe fole of fundamental frequency. In Proc. of NIST Speech Transcription Workshop, College Park, MD,USA.
[Silverman et al., 1992] Silverman, K., Beckman, M., Pitrelli, J., Ostendorf, M., Wightman, C., Price, P.,Pierrehumbert, J., and Hirschberg, J. (1992). ToBI: a standard for labeling english. In Proc. Int. Conf.Spoken Language Processing, volume 2, pages 867–870, Banff, Canada.
[Skorochodko, 1972] Skorochodko, E. (1972). Adaptive method of automatic abstracting and indexing. InProc. IFIP Congress 71, pages 1179–1182, Ljubljana, Slovenia. North-Holland Publishing Company.
[Sloboda and Waibel, 1996] Sloboda, T. and Waibel, A. (1996). Dictionary learning for spontaneousspeech recognition. In Proc. Int. Conf. Spoken Language Processing, Philadelphia, PA, USA.
[Smadja, 1993] Smadja, F. (1993). Retrieving collocations from text: Xtract. Computational Linguistics,19(1):143–177.
[Sonmez et al., 1998] Sonmez, K., Shriberg, E., Heck, L., and Weintraub, M. (1998). Modeling dynamicprosodic variation for speaker verification. In Proc. Int. Conf. Spoken Language Processing, volume 7,pages 3189–3192, Sydney, Australia.
[Sparck Jones, 1999] Sparck Jones, K. (1999). Automatic summarising: factors and directions. In Mani,I. and Maybury, M., editors, Advances in Automatic Text Summarization. MIT press, Cambridge, MA,USA.
[Srinivasan, 1999] Srinivasan, A. (1999). Note on the location of optimal classifiers in n-dimensional ROCspace. Technical Report PRG-TR-2-99, Oxford University Computing Laboratory, Oxford, UK.
[Stefik, 1995] Stefik, M. (1995). Introduction to Knowledge Systems. Morgan Kaufmann, San Francisco,CA, USA.
[Stevenson and Gaizauskas, 2000] Stevenson, M. and Gaizauskas, R. (2000). Using corpus-derived namedlists for named entity recognition. In Proc. of Applied NLP and the N. American Chapter of the ACL,pages 290–295, Seattle, WA, USA.
[Stifelman, 1995] Stifelman, L. J. (1995). A discourse analysis approach to structured speech. In Proc.AAAI Spring Symposium Series: Empirical Methods in Discourse Interpretation and Generation, Stan-ford, CA, USA.
[Stolcke and Omohundro, 1993] Stolcke, A. and Omohundro, S. (1993). Hidden Markov model inductionby Bayesian model merging. In Hanson, S. J., Cowan, J. D., and Giles, C. L., editors, Advances inNeural Information Processing Systems, volume 5, pages 11–18, USA. Morgan Kaufmann, San Mateo,CA.

171
[Stolcke et al., 1998] Stolcke, A., Shriberg, E., Bates, R., Ostendorf, M., Hakkani, D., Plauche, M., Tur,G., and Lu, Y. (1998). Automatic detection of sentence boundaries and disfluencies based on recognizedwords. In Proc. Int. Conf. Spoken Language Processing, volume 5, pages 2247–2250, Sydney, Australia.
[Tajchman et al., 1995] Tajchman, G., Fosler, E., and Jurafsky, D. (1995). Building multiple pronunciationmodels for novel words using exploratory computational phonology. In Proc. Eurospeech, pages 2247–2250, Madrid, Spain. ESCA.
[Taylor et al., 1999] Taylor, P., Caley, R., Black, A. W., and King, S. (1999). Edinburgh speech toolslibrary. Technical report, ftp://ftp.cstr.ed.ac.uk, Edinburgh, UK.
[Taylor et al., 1998] Taylor, P. A., King, S., Isard, S. D., and Wright, H. (1998). Intonation and dialoguecontext as constraints for speech recognition. Computer Speech and Language, 41(3–4):493–512.
[Trask, 1996] Trask, R. L. (1996). Dictionary of Phonetics and Phonology. Routledge, London, UK.
[Umeda and Wedmore, 1994] Umeda, N. and Wedmore, T. (1994). In Proc. Int. Conf. Spoken LanguageProcessing, volume 2, pages 1095–1098, Yokohama, Japan.
[Vaissiere, 1983] Vaissiere, J. (1983). Language-independent prosodic features. In Cutler, A. and Ladd,D. R., editors, Prosody: models and measurements, pages 53–66. Springer, Berlin, Germany.
[Valenza et al., 1999] Valenza, R., Robinson, T., Hickey, M., and Tucker, R. (1999). Summarization ofspoken audio through information extraction. In Proc. of the ESCA Workshop on Accessing Informationin Spoken Audio, pages 111–116, Cambridge, UK.
[van Kuijk and Boves, 1999] van Kuijk, D. and Boves, L. (1999). Acoustic characteristics of lexical stressin continuous telephone speech. Speech Communication, 27(2):95–111.
[Vintsyuk, 1968] Vintsyuk, T. (1968). Speech discrimination by dynamic programming. Kibernetika,4:81–88.
[Viterbi, 1967] Viterbi, A. (1967). Error bounds for convolutional codes and an asymptotically optimumdecoding algorithm. 13:260–269.
[Waibel et al., 1998] Waibel, A., Bett, M., Finke, M., and Stiefelhagen, R. (1998). Meeting browser:Tracking and summarizing meetings. In Penrose, D. E. M., editor, Proceedings of the Broadcast NewsTranscription and Understanding Workshop, pages 281–286, Lansdowne, Virginia, USA. DARPA, Mor-gan Kaufmann.
[Walker et al., 2000] Walker, M. A., Hirschman, L., and Aberdeen, J. (2000). Evaluation for DARPAcommunicator spoken dialogue systems. In Proc. of 2nd Int. Conference on Language Resources andEvaluation (LREC), Athens, Greece.
[Walker et al., 1998] Walker, M. A., Litman, D. J., Kamm, C. A., and Abella, A. (1998). Evaluating spokendialogue agents with PARADISE: Two case studies. Computer Speech and Language, 12(3):317–347.
[Warnke et al., 1997] Warnke, V., Kompe, R., Niemann, H., and Noth, E. (1997). Integrated dialog actsegmentation and classification using prosodic features and language models. In Proc. Eurospeech,volume 1, pages 207–210, Rhodes, Greece.
[Wawrzynek et al., 1996] Wawrzynek, J., Asanovic, K., Kingsbury, B., Johnson, D., Beck, J., and Morgan,N. (1996). Spert-II: A vector microprocessor system. IEEE Computer, 29(3):79–86.
[Weintraub et al., 1997] Weintraub, M., Beaufays, F., Rivlin, Z., Konig, Y., and Stolcke, A. (1997). Neural- network based measures of confidence for word recognition. In Proc. IEEE Int. Conf. Acoustics,Speech and Signal Processing, pages 887–890, Munich, Germany.
[Werner and Keller, 1994] Werner, S. and Keller, E. (1994). Prosodic aspects of speech. In Keller, E.,editor, Fundamentals of Speech Synthesis and Speech Recognition, pages 24–40. John Wiley and Sons,The Netherlands.

172
[Whittaker et al., 1999] Whittaker, S., Hirschberg, J., Choi, J., Hindle, D., Pereira, F., and Singhal, A.(1999). SCANl: designing and evaluating user interfaces to support retrieval from speech archives.In 22nd annual international ACM SIGIR conference on Research and development in information re-trieval, pages 26–33, Berkeley, CA, USA.
[Williams and Renals, 1999] Williams, G. and Renals, S. (1999). Confidence measures from local poste-rior probability estimates. Computer Speech and Language, 13:395–411.
[Witbrock and Mittal, 1999] Witbrock, M. J. and Mittal, V. O. (1999). Ultra-summarization: A statisticalapproach to generating highly condensed non-extractive summaries. In 22nd annual international ACMSIGIR conference on Research and development in information retrieval, pages 315–316, Berkeley, CA,USA.
[Witten and Bell, 1991] Witten, I. H. and Bell, T. C. (1991). The zero-frequency problem: Estimating theprobabilities of novel events in adaptive text compression. IEEE Trans. Information Theory, 37(4):1085–1094.
[Yamashita and Inoue, 2002] Yamashita, Y. and Inoue, A. (2002). Extraction of important sentences usingF0 information for speech summarization. In Proc. Int. Conf. Spoken Language Processing, Denver,Colorado, USA.
[Zechner, 2001] Zechner, K. (2001). Automatic Summarization of Spoken Dialogues in Unrestricted Do-mains. PhD thesis, Carnegie Mellon University CMU-LT1-168, Pittsburgh, PA, USA.
[Zechner and Waibel, 2000] Zechner, K. and Waibel, A. (2000). DIASUMM: Flexible summarization ofspontaneous dialogues in unrestricted domains. In Proc. of COLING, Saarbrucken, Germany.
[Zongker and Jain, 1996] Zongker, D. and Jain, A. (1996). Algorithms for feature selection: An evaluation.In Proc. of Int. Conference on Pattern Recognition, pages 18–22, Vienna, Austria.
[Zweig and Campbell, 1993] Zweig, M. H. and Campbell, G. (1993). Receiver-operative characteristic(ROC) plots: a fundamental evaluation tool in clinical medicine. Clinical Chemistry, 39:561–577.