automating assessment of obesity care quality - … final report grant id: r18hs18157 automating...
TRANSCRIPT
Grant Final Report Grant ID: R18HS18157 Automating Assessment of Obesity Care Quality Inclusive Project Dates: 09/30/09 – 03/31/13 Principal Investigator: Brian Hazlehurst, PhD1
Team Members: Mary Ann McBurnie, PhD1
Victor Stevens, PhD1
Weiming Hu, MS1
Jill Mesa1
Jon Puro, MPA-HA2
Jennifer Lembach2
1 Kaiser Permanente Center for Health Research, Portland, OR 2 OCHIN, Inc., Portland, OR Performing Organization: Kaiser Permanente Center for Health Research, Portland, OR Federal Project Officer: Vera Rosenthal Submitted to: The Agency for Healthcare Research and Quality (AHRQ) U.S. Department of Health and Human Services 540 Gaither Road Rockville, MD 20850 www.ahrq.gov

Structured Abstract
Purpose: To develop, implement, and evaluate an automated method using Health Information Technology (Health IT) to comprehensively assess the quality of obesity care for patients aged 18-75 seen in primary care. Scope: Robust and widespread quality measures addressing the priority condition of obesity are needed. Questions persist regarding how such measures are represented and meaningfully applied to electronic medical records (EMRs). In particular, an abundance of relevant information is locked away in the free-text clinical notes. Our method uses natural language processing (NLP) to gain access to this data. Methods: This research involved retrospective analysis of EMR data from two distinct health systems: a mid-sized HMO and a consortium of safety-net clinics located primarily in the Pacific Northwest. We utilized an existing medical record classification technology (MediClass) to create and validate a “pipeline” of clinical data processing that included both the free-text and coded elements of clinical visits to assess adherence to care steps recommended by current outpatient obesity guidelines. We applied the method to 13mo data observation windows in the two health systems and assessed outcomes associated with the delivery of recommended care steps. Results: We developed a set of nine measures for assessing the quality of outpatient obesity care from the most recent published NHLBI guidelines. Overall, accuracy of the automated EMR-based measures relative to chart review was good. We identified a small but significant association between guideline-recommended care and weight loss in patients who were overweight or obese. Key Words: health information technology; HIT; obesity care quality
The authors of this report are responsible for its content. Statements in the report should not be construed as endorsement by the Agency for Healthcare Research and Quality or the U.S. Department of Health and Human Services of a particular drug, device, test, treatment, or other clinical service.
2
Final Report
Purpose
A widely cited RAND study of US healthcare found that only half of healthcare services recommended by consensus quality standards were actually delivered to eligible patients [1]. To address this discrepancy, the Institute of Medicine (IOM) of the National Academy of Sciences has called for new quality initiatives throughout healthcare [2,3]. Obesity represents a particularly large and increasing burden on the US population and the healthcare system. Obesity prevalence has doubled over the past two decades with two-thirds of the US adult population now overweight and one-third obese [4,5]. Obesity is especially prevalent in minority and other underserved, financially disadvantaged populations. The prevalence of obesity will likely continue to rise and the cost of treating obesity-related disease is expected to dramatically increase as the population ages. Yet the condition is correctable and preventable through lifestyle changes, as well as medical and surgical treatments, and routine ambulatory care encounters can help facilitate these interventions in disease onset and progression. Despite published guidelines on preventing, diagnosing, and treating obesity [6], most health care systems have been slow to respond to this looming public health problem.
This research aims to demonstrate the scalability of an automated method permitting routine and comprehensive assessment of outpatient obesity care quality. It addresses the research area of “Health IT to improve health care decision making through the use of integrated data and knowledge management.” This research involves retrospective analysis of EMR data from two distinct health systems: a mid-sized HMO and a consortium of Federally Qualified Health Centers (FQHC)). By including these health systems, this project is able to leverage Health IT to address healthcare quality improvement for the indigent, uninsured, and underinsured populations served by the participating FQHC. These health systems include a diverse and representative sample of patients, providers, and health care practices for the entire west coast.
Our objective was to develop, implement, and evaluate a method to automatically assess outpatient obesity care quality. In particular, we aimed to:
1. Develop obesity care quality measures based on updated NHLBI obesity care guidelines
to evaluate obesity care performance in primary care;
2. Develop and validate an automated (generalizable and scalable) method for applying the measures identified in Aim 1, using comprehensive EMR data;
3. Apply the method developed in Aim 2 to assess ambulatory obesity care quality in two distinct health plans representing diverse patient populations and care practices; and
4. Evaluate the association between measures of obesity guideline adherence to recommended obesity care processes and clinical outcomes and provider characteristics.
3
Scope
The Burden of Obesity and the Opportunity for Care Quality Improvement
Dramatic increases in obesity prevalence over the last few decades have heightened concern about this important public health problem. Body mass index (BMI), expressed as weight/height, kg/m2, is commonly used to classify overweight (BMI 25.0-29.9) and obesity (BMI of 30 or greater) among adults (age 18 years and older). Currently, two-thirds of the US adult population is overweight or obese and recent data show no signs of improvement [4, 13]. A continuation of current trends seems quite likely to lead to substantial increases in the number of people affected by obesity-related health conditions and in premature mortality[14-16] Overweight and obesity increase the risk of many serious health conditions, including hypertension, hypercholestero-lemia, diabetes, coronary heart disease, and some forms of cancer [15, 17-21]. The dose-response relationship between BMI and the risk of developing chronic diseases is even observed among adults in the upper half of the healthy weight range (i.e., BMI of 22.0-24.9) [18]. The annual number of deaths attributable to obesity has been estimated at 300,000.[22] The aggregate annual medical care costs attributable to obesity in the US are estimated to be 7% of annual health care expenditures[23-27]. Unfortunately, the economic costs of obesity, including obesity-related medical expenditures and associated loss of productivity and absenteeism [28, 29] are expected to substantially increase over time.
Health Benefits of Weight Loss
Although losing weight is clearly challenging, methods for helping people lose weight have improved significantly. Comprehensive reviews of the literature [30, 31] have shown that current standard behavioral weight loss programs produce average weight losses of about 10.1 kg or about 10% of starting weight. These results are encouraging given abundant evidence that modest weight loss (5-10% of initial body weight) is associated with significant health benefits even in the absence of body weight normalization [32-35]. Both the Diabetes Prevention Program (DPP) and the Finnish Diabetes Prevention study (FDP) provide strong evidence for the health benefits of a lifestyle intervention for weight control. The DPP randomized 3,234 participants at high risk for developing diabetes (i.e., defined as elevated fasting and post-load plasma glucose concentrations) to one of three study arms including: (1) a lifestyle-modification; (2) metformin; or (3) placebo [32] Lifestyle-modification intervention goals included at least a 7% weight loss and attaining a minimum of 150 minutes of physical activity per week.
After an average of 2.8 years of follow-up, the incidence of type 2 diabetes was 4.8, 7.8, and 11.0 cases per 100 person years in the lifestyle, metformin, and placebo groups respectively. The lifestyle intervention reduced diabetes incidence by 58% compared to placebo, and metformin reduced diabetes incidence by 31% compared to placebo. The FDP study showed a similar risk reduction with an intervention focused on weight loss, diet, and activity changes [35].
These two studies support trials on the management of hypertension [33, 34, 36, 37] and collectively provide strong evidence that lifestyle behavior change facilitates long-term improvements in weight and health. Although there is clearly room for improving long term results, recent controlled clinical trials have shown that a majority of the participants who start
4
weight loss intervention programs are able to achieve a clinically significant weight loss (4 kg or more) at six months, and that about one third of those who start initial weight loss are still maintaining a clinically significant weight loss after three years[32, 38] This success rate compares favorably to long-term outcomes of smoking cessation programs [39].
Importance of the Health Care Setting
The 2001 and 2002 National Ambulatory Medical Care Surveys (NAMCS) and National Hospital Ambulatory Medical Care Surveys (NHAMCS) show that patients in the United States made an estimated 1.1 billion outpatient visits per year in 2001 and 2002, a rate of 3.8 visits per person annually [40]. While this rate provides considerable opportunity to address weight issues, survey data suggest that less than half of obese adults report that their physician discussed this issue with them[41,42]. Physicians report multiple barriers to addressing obesity including lack of time, training, patient motivation, referral resources, and the perception that weight loss programs are ineffective [43-46].
Physician advice to lose weight is no magic bullet, but evidence suggests that such advice and referral to behavioral treatment programs can play an important role. For example, BRFSS data show that the odds of trying to lose weight are 2.8 times higher for obese patients who reported receiving advice to lose weight, compared to those who did not receive advice[41]. Data from the National Weight Control Registry also shows that participants who reported a medical trigger for weight loss (including physician advice to lose weight) lost more weight, and were more successful maintaining their weight loss compared to those reporting other triggers for weight loss [47].
Health Care Guidelines for Obesity
In response to the alarming increase in obesity and in recognition of the critical role of health care providers, a number of organizations have issued guidelines for clinical care including NHLBI [50], (the guideline to be used in this study); the US Preventive Services Task Force [49], and the American Association of Clinical Endocrinologists [50]. A common guideline component is routine measurement of height and weight, calculation of BMI, assessment of risk status (e.g., hypertension, impaired glucose control), provider assessment of patient “readiness to change”, encouragement to lose weight if the patient is overweight or obese, diet and activity recommendations, and referral to appropriate weight-loss resources.
These guidelines are, in part, based on key lessons learned from the successful tobacco control experience including: 1) that brief physician advice and supportive tobacco cessation counseling (i.e., implementation of the “5 A’s” for tobacco: ask, advise, assess, assist and arrange) is effective in reducing smoking rates 41 and 2) that comprehensive tobacco control health system policies are associated with higher rates of implementation of evidence-based guidelines [51].
Evaluating Implementation and Effectiveness of Obesity Guidelines
A critical question is whether systematic implementation of obesity guidelines for the health care setting are associated with improvements in quality of care and reductions in obesity
5
prevalence. Before this question can be addressed, we need comprehensive approaches to adequately measuring physician treatment practices and patient response that can be used to generate benchmarks upon which improvements can be measured. Practice might vary by patient-level variables (e.g., comorbidity status, race/ethnicity, sex), physician characteristics (e.g., sex, years of experience, and specialty type), and health system and clinic policies or access to resources. Examination of these variations in treatment practices will inform the development of targeted interventions to improve guideline adherence. Physician and patient surveys provide some useful information, but objective data on how obesity is (or is not) addressed during health care encounters is a critical piece of the puzzle.
The Potential of Electronic Medical Records for Care Quality Research
Electronic medical records (EMRs) promise to revolutionize the health care industry by making health care better and cheaper [2,7,52,53]. A key aspect of this promise is comprehensive capture of patient-specific clinical data, which enables improved continuity in care while eliminating unnecessary care activities. The EMR provides a vehicle for communicating information about the patient across time, place, and care providers. In both electronic and paper-based medical records, narratives produced by providers about their patients play a critical role in this communication [54,55]. The EMR can also improve health care and reduce costs by enabling process control and decision-support via patient- and population-level data computations [56]. These computations (whether performed in real-time at the point of care or off-line as a data warehouse function) promote evidence-based quality, safety, and efficiency in the delivery of health care [57].
To fulfill the EMR’s promise, new technologies are needed that support both clinical practice and process control, including assessment of care quality. One avenue is development of systems that can automatically classify medical record contents, processing both free-text and coded elements of the record. The concept of developing systems capable of processing the free-text portions of the medical record is not new [58-60] Natural Language Processing (NLP) systems are becoming more feasible as more clinical data is electronically captured [61] data storage capacity advances, computational power increases, and new programming techniques are developed [9-12,62-64]
MediClass System’s Ability to Address EMR Challenges
MediClass (a “Medical Classifier”) is a general-purpose system for identifying clinical events in the EMR. This knowledge-based NLP system was developed by our research team to address the challenge of automatically classifying medical records containing both coded and free-text data elements [9]. The system can operate on data from any EMR because it uses an emerging standard clinical data format to represent medical encounters [71,72]. It classifies data by applying a set of logical rules to the medical concepts that are automatically identified in both the free-text (e.g., counseling activities in progress notes) and coded data elements (e.g., medication orders) of the EMR.
We have shown that the system, when customized with knowledge to address smoking cessation care, has accuracy similar to human abstractors trained to assess smoking cessation care activities in the EMR [69]. MediClass has been designed to detect clinical events in any EMR using problem-specific knowledge. After developing and plugging in a different
6
“knowledge module” (thus creating a new “application”), we demonstrated that MediClass was effective for detecting adverse vaccination events [70] and for assessing outpatient asthma care quality [73]. The MediClass system shows promise for addressing a wide variety of concerns in epidemiology, care quality, and safety research.
Summary of the Opportunity
Healthcare systems must proactively address the public health crisis of obesity. The advent of guidelines to address obesity in healthcare settings is an important first step, but the degree to which obesity guidelines are implemented and are effective is unknown. We need systematic assessment of current obesity management practices by health care providers. Specifically, we must document the current level of adherence to guidelines, patient and provider characteristics associated with adherence, and variation in guideline implementation across health delivery systems.
This information is critical for establishing benchmarks, both locally and nationally, upon which patient, provider, system and policy interventions can be measured. Such measurement, effectively combining diverse data and knowledge, is necessary to produce rational policy and decision-making in health care. Within the next ten years, EMRs will be widely used across the US. Informatics technologies, such as the MediClass system, leverage the information contained in EMRs to assess and improve quality of obesity care.
Methods
This study is a retrospective data study of the outpatient primary care delivered to obese and overweight patients in two distinct health systems: Kaiser Permanente Northwest (KPNW) and the public health clinics associated with the OCHIN. The research team is scientists and research staff at the primary study site of KPNW Center for Health Research (KPNW CHR) and the secondary site of OCHIN.
Kaiser Permanente Northwest (KPNW) is a non-profit, group-model health maintenance organization (HMO) that provides comprehensive, prepaid health care to its members, including access to inpatient, outpatient, and emergency department services. KPNW serves about 450,000 members in the Pacific Northwest. The HMO’s membership reflects the racial and economic composition of its market area. A recent analysis of these data shows the racial composition of KPNW members as 87.1% Caucasian, 2.8% African-American, 1.4% Native American, 4.4% Asian American, and 4.3% other nonwhite individuals; 6% report a Hispanic background, similar to the Portland, Oregon, greater metropolitan area. KPNW maintains one hospital and 20 outpatient clinics and contracts with six area hospitals for additional inpatient services. All patient contacts within the system and all services referred outside the system are recorded in a single, comprehensive EMR (KP HealthConnect, based on EpicSystems’ EpicCare product) in place since 1998.
OCHIN, Inc. (OCHIN) is a non-profit collaboration of public and private community clinics. OCHIN’s mission is to meet the data management needs of Federally Qualified Health Centers (FQHCs) and other community health centers caring for indigent, uninsured, and underinsured
7

populations. OCHIN rolled out a comprehensive, integrated ambulatory system (EpicSystems’ Practice Management products), adapted for the special needs of FQHCs, in 2002, and a full EHR in 2005 (EpicCare). OCHIN processes and manages data from safety net clinics, providing support to users at 288 clinics. OCHIN member clinics are in both urban and rural areas. As of 2012, the EMR was in place at 240 clinic sites. In the last year, more than 670,000 patients were seen at OCHIN member clinics for a total of over 2.7 million encounters. Approximately 27% of encounters involved Hispanic patients; about 74% of patients were Caucasian; 11% African-American; 3% Asian/Pacific Islander; 1% Alaska Native/Native American; and 12% had other races, race was not collected, or were of an unknown race.
Study Population
Patients included in this study were 18-75 years of age, determined to be obese, overweight, or in the upper range of “normal” as captured by a single primary care encounter with a documented BMI >= 25, and did not have current diagnoses indicating pregnancy, active cancer treatment, an eating disorder or undergoing palliative care. Patients meeting these criteria during 2007 were evaluated. Children and teens under 18 years of age were excluded due to rapid and variable growth change and because of clinical uncertainty about what constitutes overweight and best clinical practices for weight management in this younger population.
Data Sources
For purposes of exclusion (see prior paragraph), diagnoses codes for all visits in the 2006-2009 calendar years were used. For all included patients, and at each project site, we extracted all primary care visit records in standardized XML format, for a 13 month observation period (from 1/1/2007 to 1/31/2008). Each record was structured in the standard format used by MediClass for processing, which is derived from HL7’s Clinical Document Architecture (CDA) standard [71,72]. Each encounter record includes study-coded patient and provider identifiers, as well as date and location of care, and all data linked to the visit in the following categories: vital signs, visit diagnoses, problems, medications ordered and dispensed (KPNW only), health maintenance alerts generated, procedures, referrals and other orders, progress notes and patient instructions.
Developing Measures of Care Quality
The OCQ Care Measures are an implementation of measures for the recommended care steps from NHLBI’s 1998 Clinical Guidelines on the Identification, Evaluation, and Treatment of Overweight and Obesity in Adults: The Evidence Report and the companion clinical handbook called The Practical Guide Identification, Evaluation, and Treatment of Overweight and Obesity in Adults. Although our original goal was to utilize new guidelines that are under development at NHLBI, these have not yet been released so we utilized the 1998 guidelines in this study. We held a meeting with a panel of clinicians and obesity researchers from the two health systems participating in this research and developed explicit criteria for patient inclusion and exclusion criteria for use in measurement of the care steps in primary care visit records. We refined the
8

meeting documents to produce the final versions shown as Table 1 (defining the populations) and Table 2 (defining the measures).
The OCQ study population. For each measurement study, we will include patients in each health system (KPNW and OCHIN) that are:
1. Between 18 and 75 years old during the observation period;
2. Seen at least once in primary care during the observation period;
3. For KPNW, continuous enrollment in health plan required;
4. Study Exclusions
• Pregnancy
• Active Treatment for Cancer (excl. non-malignant cancer)
• Eating disorders
• Palliative and hospice care
We focused on patients who are overweight or obese (BMI > 25). Risk Factors for Obesity.
• History of CHD
• Presence of atherosclerotic disease
• Type 2 diabetes
• Sleep apnea
• Other obesity–associated disease
• Cigarette smoking
• hypertension
• hyperlipidemia
• impaired fasting glucose
• family history of premature CHD
• Male age ≥45 years
9

• Female ≥55 years or postmenopausal
• Physical inactivity
• High triglycerides
Table 1. NHLBI Treatment Algorithm (Figure 4)
WAIST BMI Missing BMI <25 BMI 25 – 29.9 BMI 30+
BIG >35in (F) >40in (M)
Treat if:>2 risk factors
Treat if: >2 risk factors
OR < 2 risk factors & patient wants tx
Treat if: >2 risk factors
OR < 2 risk factors & patient wants tx
Treat
NOT BIG <=35in (F) <=40in (M)
No Treatment
Treat if: >2 risk factors
OR < 2 risk factors & patient wants tx
Treat
Missing
Treat if: >2 risk factors
OR < 2 risk factors & patient wants tx
Treat
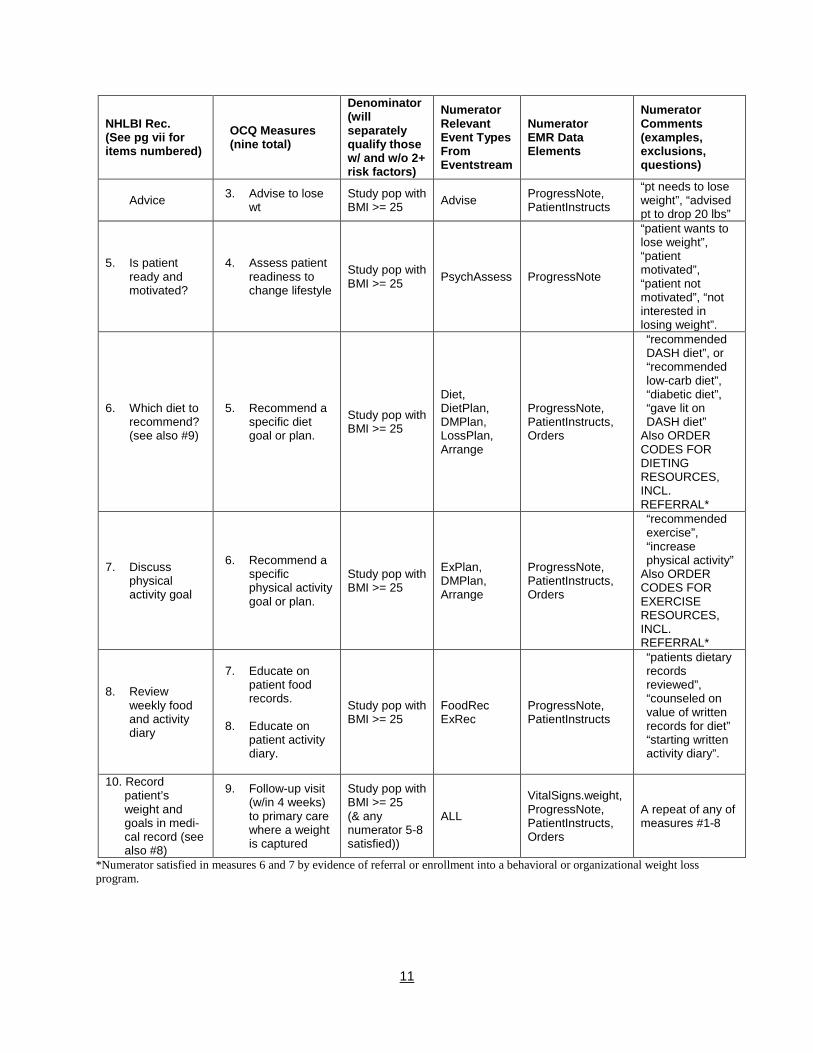
Table 2. The OCQ Measure Set
NHLBI Rec. (See pg vii for items numbered)
OCQ Measures (nine total)
Denominator (will separately qualify those w/ and w/o 2+ risk factors)
Numerator Relevant Event Types From Eventstream
Numerator EMR Data Elements
Numerator Comments (examples, exclusions, questions)
Adults are 18 – 75 y.o. To compute BMI, we will always use median height measurement for the patient, but no height to be included before age 18.
1. Measure Height and Weight
1. Adult patients should have weight BMI documented at every primary care visit
Study population WT, HT, BMI
VitalSigns.weight, VitalSigns.height, VitalSigns.bmi
2. Overweight and obese adult patients (25<=BMI<35) should have waist circumference documented at every primary care visit
2. Measure waist circumference
Study pop with BMI >= 25 and <35
Waist ProgressNote Very rare.
10
NHLBI Rec. (See pg vii for items numbered)
OCQ Measures (nine total)
Denominator (will separately qualify those w/ and w/o 2+ risk factors)
Numerator Relevant Event Types From Eventstream
Numerator EMR Data Elements
Numerator Comments (examples, exclusions, questions)
Advice 3. Advise to lose wt
Study pop with BMI >= 25 Advise ProgressNote,
PatientInstructs
“pt needs to lose weight”, “advised pt to drop 20 lbs”
5. Is patient ready and motivated?
4. Assess patient readiness to change lifestyle
Study pop with BMI >= 25 PsychAssess ProgressNote
“patient wants to lose weight”, “patient motivated”, “patient not motivated”, “not interested in losing weight”.
6. Which diet to recommend? (see also #9)
5. Recommend a specific diet goal or plan.
Study pop with BMI >= 25
Diet, DietPlan, DMPlan, LossPlan,
ProgressNote, PatientInstructs, Orders
“recommended DASH diet”, or “recommended low-carb diet”, “diabetic diet”, “gave lit on DASH diet”
Also ORDER Arrange CODES FOR
DIETING RESOURCES, INCL. REFERRAL*
7. Discuss physical activity goal
6. Recommend a specific physical activity goal or plan.
Study pop with BMI >= 25
ExPlan, DMPlan, Arrange
ProgressNote, PatientInstructs, Orders
“recommended exercise”, “increase physical activity”
Also ORDER CODES FOR EXERCISE RESOURCES, INCL. REFERRAL*
8. Review weekly food and activity diary
7. Educate on patient food records.
8. Educate on
patient activity diary.
Study pop with BMI >= 25
FoodRec ExRec
ProgressNote, PatientInstructs
“patients dietary records reviewed”, “counseled on value of written records for diet” “starting written activity diary”.
10. Record patient’s weight and goals in medi-cal record (see also #8)
9. Follow-up visit (w/in 4 weeks) to primary care where a weight is captured
Study pop with BMI >= 25 (& any numerator 5-8 satisfied))
ALL
VitalSigns.weight, ProgressNote, PatientInstructs, Orders
A repeat of any of measures #1-8
*Numerator satisfied in measures 6 and 7 by evidence of referral or enrollment into a behavioral or organizational weight loss program.
11
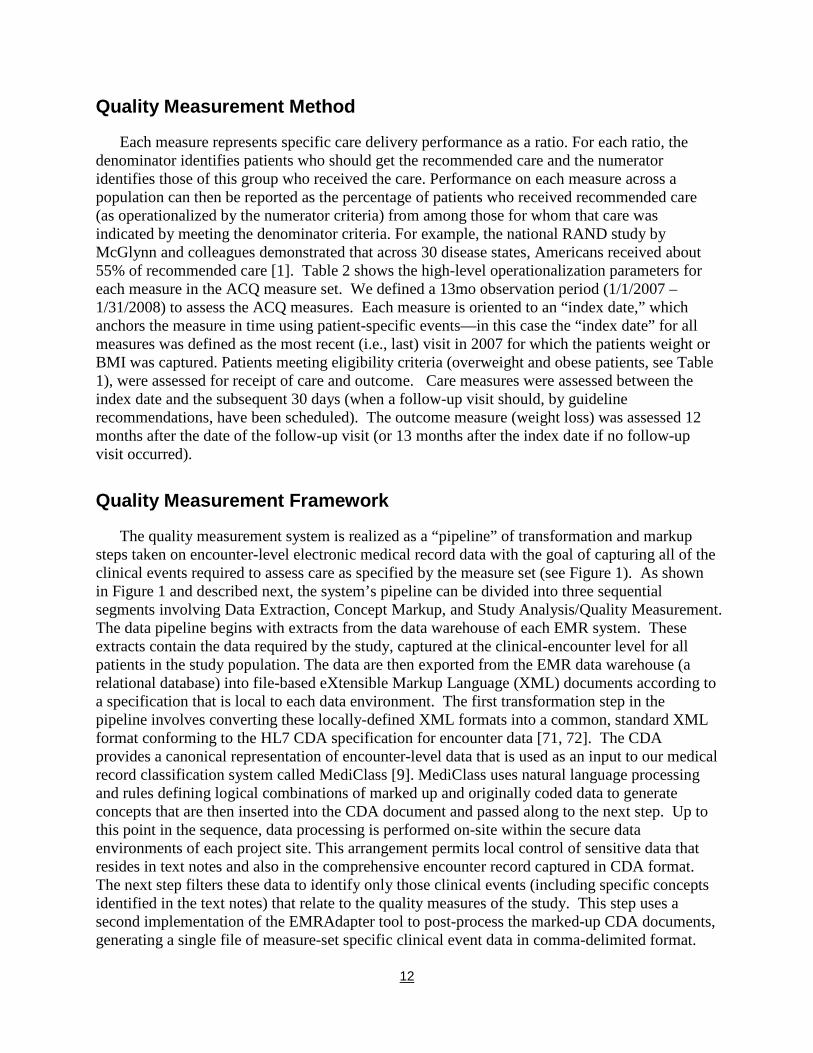
Quality Measurement Method
Each measure represents specific care delivery performance as a ratio. For each ratio, the denominator identifies patients who should get the recommended care and the numerator identifies those of this group who received the care. Performance on each measure across a population can then be reported as the percentage of patients who received recommended care (as operationalized by the numerator criteria) from among those for whom that care was indicated by meeting the denominator criteria. For example, the national RAND study by McGlynn and colleagues demonstrated that across 30 disease states, Americans received about 55% of recommended care [1]. Table 2 shows the high-level operationalization parameters for each measure in the ACQ measure set. We defined a 13mo observation period (1/1/2007 – 1/31/2008) to assess the ACQ measures. Each measure is oriented to an “index date,” which anchors the measure in time using patient-specific events—in this case the “index date” for all measures was defined as the most recent (i.e., last) visit in 2007 for which the patients weight or BMI was captured. Patients meeting eligibility criteria (overweight and obese patients, see Table 1), were assessed for receipt of care and outcome. Care measures were assessed between the index date and the subsequent 30 days (when a follow-up visit should, by guideline recommendations, have been scheduled). The outcome measure (weight loss) was assessed 12 months after the date of the follow-up visit (or 13 months after the index date if no follow-up visit occurred).
Quality Measurement Framework
The quality measurement system is realized as a “pipeline” of transformation and markup steps taken on encounter-level electronic medical record data with the goal of capturing all of the clinical events required to assess care as specified by the measure set (see Figure 1). As shown in Figure 1 and described next, the system’s pipeline can be divided into three sequential segments involving Data Extraction, Concept Markup, and Study Analysis/Quality Measurement. The data pipeline begins with extracts from the data warehouse of each EMR system. These extracts contain the data required by the study, captured at the clinical-encounter level for all patients in the study population. The data are then exported from the EMR data warehouse (a relational database) into file-based eXtensible Markup Language (XML) documents according to a specification that is local to each data environment. The first transformation step in the pipeline involves converting these locally-defined XML formats into a common, standard XML format conforming to the HL7 CDA specification for encounter data [71, 72]. The CDA provides a canonical representation of encounter-level data that is used as an input to our medical record classification system called MediClass [9]. MediClass uses natural language processing and rules defining logical combinations of marked up and originally coded data to generate concepts that are then inserted into the CDA document and passed along to the next step. Up to this point in the sequence, data processing is performed on-site within the secure data environments of each project site. This arrangement permits local control of sensitive data that resides in text notes and also in the comprehensive encounter record captured in CDA format. The next step filters these data to identify only those clinical events (including specific concepts identified in the text notes) that relate to the quality measures of the study. This step uses a second implementation of the EMRAdapter tool to post-process the marked-up CDA documents, generating a single file of measure-set specific clinical event data in comma-delimited format.
12
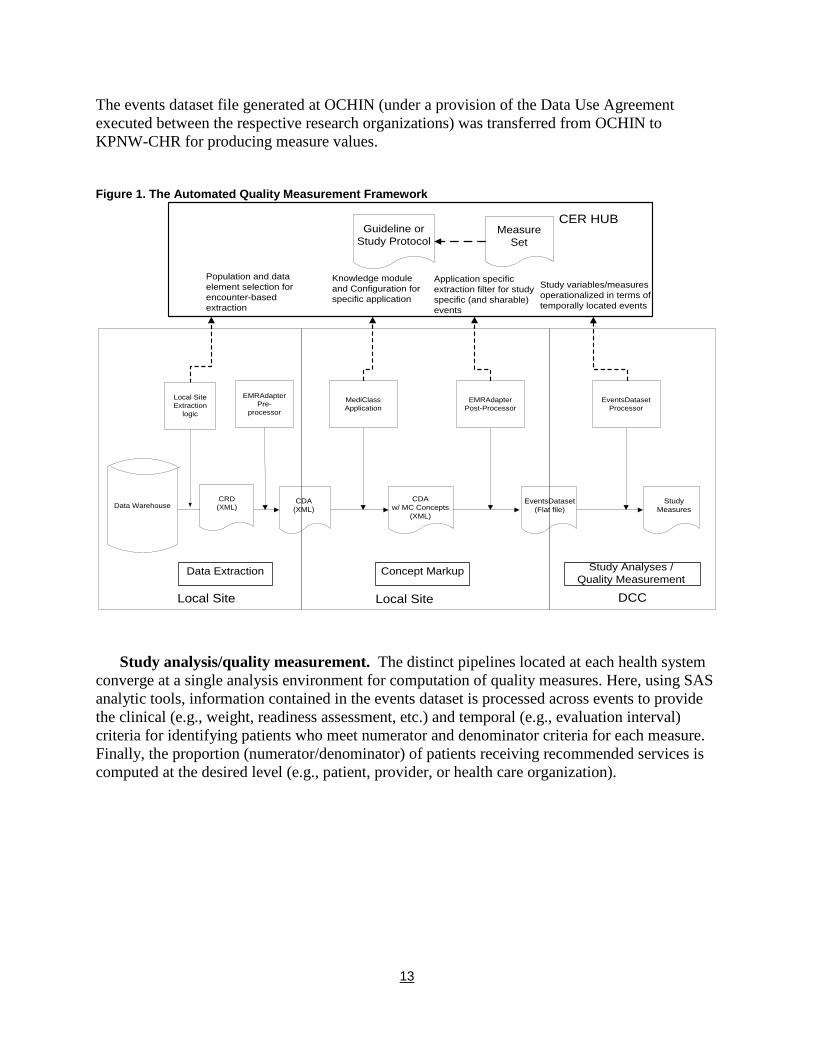
The events dataset file generated at OCHIN (under a provision of the Data Use Agreement executed between the respective research organizations) was transferred from OCHIN to KPNW-CHR for producing measure values. Figure 1. The Automated Quality Measurement Framework
EMRAdapterPre-
processor
Data Warehouse CDA(XML)
MediClass Application
CDAw/ MC Concepts
(XML)
EMRAdapterPost-Processor
EventsDataset(Flat file)
EventsDatasetProcessor
StudyMeasures
Data Extraction Concept Markup Study Analyses / Quality Measurement
Study variables/measures operationalized in terms of temporally located events
Application specific extraction filter for study specific (and sharable) events
Knowledge module and Configuration for specific application
Population and data element selection for encounter-based extraction
Guideline or Study Protocol
Local Site Local Site DCC
CER HUB
Local Site Extraction
logic
CRD(XML)
Measure Set
Study analysis/quality measurement. The distinct pipelines located at each health system converge at a single analysis environment for computation of quality measures. Here, using SAS analytic tools, information contained in the events dataset is processed across events to provide the clinical (e.g., weight, readiness assessment, etc.) and temporal (e.g., evaluation interval) criteria for identifying patients who meet numerator and denominator criteria for each measure. Finally, the proportion (numerator/denominator) of patients receiving recommended services is computed at the desired level (e.g., patient, provider, or health care organization).
13
Results
OCQ Measure Validation
Chart review. Validation of the automated OCQ measures was carried out based on chart review at the patient level on a total of 912 patients, 456 each at KPNW and OCHIN. In addition, the sample was stratified by sex, bmi (25-29 vs >30), and age (18-30, 40-64, and 65+).
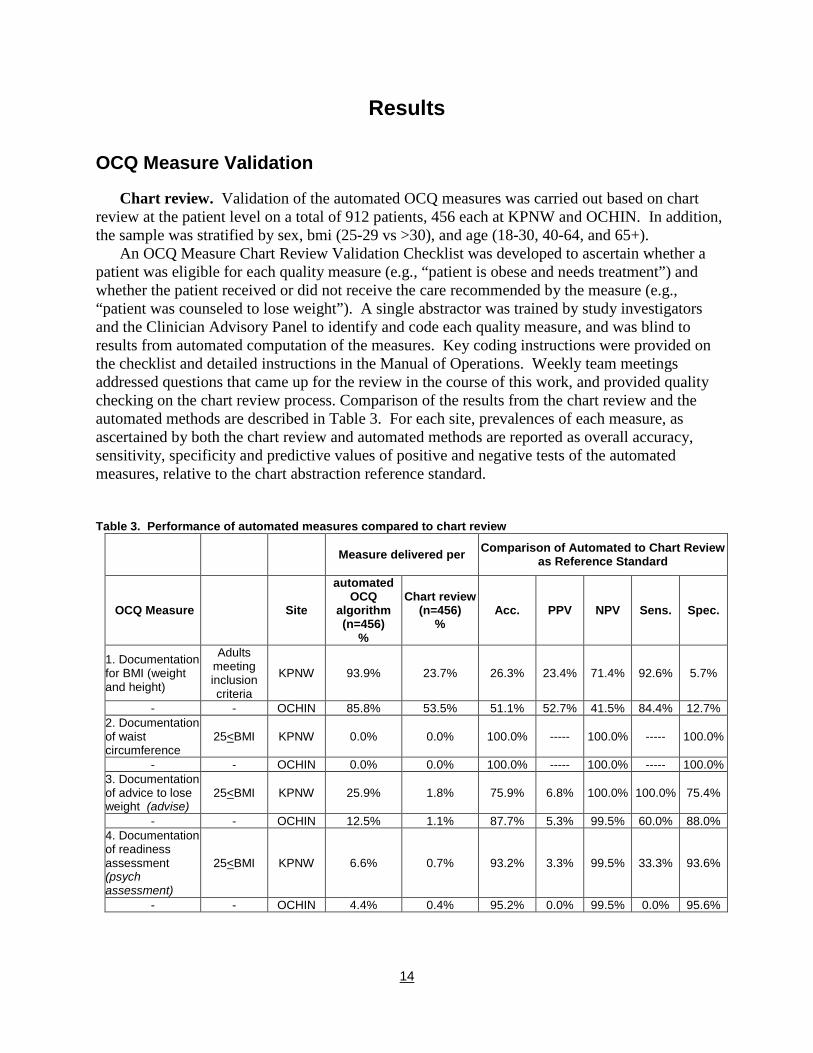
An OCQ Measure Chart Review Validation Checklist was developed to ascertain whether a patient was eligible for each quality measure (e.g., “patient is obese and needs treatment”) and whether the patient received or did not receive the care recommended by the measure (e.g., “patient was counseled to lose weight”). A single abstractor was trained by study investigators and the Clinician Advisory Panel to identify and code each quality measure, and was blind to results from automated computation of the measures. Key coding instructions were provided on the checklist and detailed instructions in the Manual of Operations. Weekly team meetings addressed questions that came up for the review in the course of this work, and provided quality checking on the chart review process. Comparison of the results from the chart review and the automated methods are described in Table 3. For each site, prevalences of each measure, as ascertained by both the chart review and automated methods are reported as overall accuracy, sensitivity, specificity and predictive values of positive and negative tests of the automated measures, relative to the chart abstraction reference standard. Table 3. Performance of automated measures compared to chart review
Measure delivered per Comparison of Automated to Chart Review
as Reference Standard
OCQ Measure Site
automated OCQ
algorithm (n=456)
%
Chart review (n=456)
% Acc. PPV NPV Sens. Spec.
1. Documentation for BMI (weight and height)
Adults meeting inclusion criteria
KPNW 93.9% 23.7% 26.3% 23.4% 71.4% 92.6% 5.7%
- - OCHIN 85.8% 53.5% 51.1% 52.7% 41.5% 84.4% 12.7% 2. Documentation of waist circumference
25<BMI KPNW 0.0% 0.0% 100.0% ----- 100.0% ----- 100.0%
- - OCHIN 0.0% 0.0% 100.0% ----- 100.0% ----- 100.0% 3. Documentation of advice to lose weight (advise)
25<BMI KPNW 25.9% 1.8% 75.9% 6.8% 100.0% 100.0% 75.4%
- - OCHIN 12.5% 1.1% 87.7% 5.3% 99.5% 60.0% 88.0% 4. Documentation of readiness assessment (psych assessment)
25<BMI KPNW 6.6% 0.7% 93.2% 3.3% 99.5% 33.3% 93.6%
- - OCHIN 4.4% 0.4% 95.2% 0.0% 99.5% 0.0% 95.6%
14
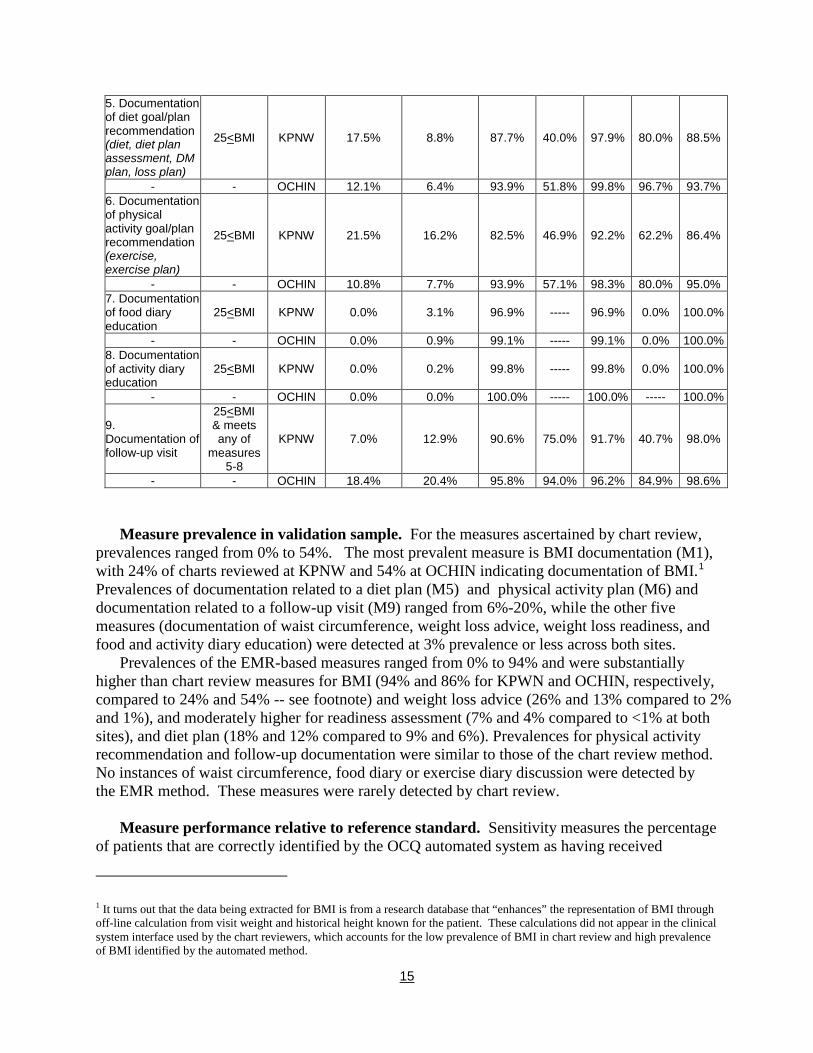
5. Documentation of diet goal/plan recommendation (diet, diet plan assessment, DM plan, loss plan)
25<BMI KPNW 17.5% 8.8% 87.7% 40.0% 97.9% 80.0% 88.5%
- - OCHIN 12.1% 6.4% 93.9% 51.8% 99.8% 96.7% 93.7% 6. Documentation of physical activity goal/plan recommendation (exercise, exercise plan)
25<BMI KPNW 21.5% 16.2% 82.5% 46.9% 92.2% 62.2% 86.4%
- - OCHIN 10.8% 7.7% 93.9% 57.1% 98.3% 80.0% 95.0% 7. Documentation of food diary education
25<BMI KPNW 0.0% 3.1% 96.9% ----- 96.9% 0.0% 100.0%
- - OCHIN 0.0% 0.9% 99.1% ----- 99.1% 0.0% 100.0% 8. Documentation of activity diary education
25<BMI KPNW 0.0% 0.2% 99.8% ----- 99.8% 0.0% 100.0%
- - OCHIN 0.0% 0.0% 100.0% ----- 100.0% ----- 100.0%
9. Documentation of follow-up visit
25<BMI & meets any of
measures 5-8
KPNW 7.0% 12.9% 90.6% 75.0% 91.7% 40.7% 98.0%
- - OCHIN 18.4% 20.4% 95.8% 94.0% 96.2% 84.9% 98.6%
Measure prevalence in validation sample. For the measures ascertained by chart review, prevalences ranged from 0% to 54%. The most prevalent measure is BMI documentation (M1), with 24% of charts reviewed at KPNW and 54% at OCHIN indicating documentation of BMI.1 Prevalences of documentation related to a diet plan (M5) and physical activity plan (M6) and documentation related to a follow-up visit (M9) ranged from 6%-20%, while the other five measures (documentation of waist circumference, weight loss advice, weight loss readiness, and food and activity diary education) were detected at 3% prevalence or less across both sites.
Prevalences of the EMR-based measures ranged from 0% to 94% and were substantially higher than chart review measures for BMI (94% and 86% for KPWN and OCHIN, respectively, compared to 24% and 54% -- see footnote) and weight loss advice (26% and 13% compared to 2% and 1%), and moderately higher for readiness assessment (7% and 4% compared to <1% at both sites), and diet plan (18% and 12% compared to 9% and 6%). Prevalences for physical activity recommendation and follow-up documentation were similar to those of the chart review method. No instances of waist circumference, food diary or exercise diary discussion were detected by the EMR method. These measures were rarely detected by chart review.
Measure performance relative to reference standard. Sensitivity measures the percentage of patients that are correctly identified by the OCQ automated system as having received
1 It turns out that the data being extracted for BMI is from a research database that “enhances” the representation of BMI through off-line calculation from visit weight and historical height known for the patient. These calculations did not appear in the clinical system interface used by the chart reviewers, which accounts for the low prevalence of BMI in chart review and high prevalence of BMI identified by the automated method.
15
recommended care (as ascertained by chart review). In general, higher sensitivity results in identification of more patients receiving care and a decreased likelihood of missing patients who received the care. Specificity measures the percentage of patients that are correctly identified as not receiving care. Overall accuracy is measured as the total percentage of patients classified correctly. We note that the chart review process is itself imperfect and it is not uncommon, e.g., for the automated approach to identify cases that are missed by chart review. In this context the sensitivity and specificity determinations reported here are relative to the chart review reference. Depending on the sensitivities and the specificities of the chart review reference to the true status (i.e., recommended care delivered vs. not), bias in the assessment of the comparison method (here the automated system) can be conservative or anti-conservative. Further work in this area would require a more in-depth chart review process carried out by a panel of experts to establish a “gold standard” reference set to obtain more accurate and precise estimates of the automated system.
With the exception of Measure 1 (documentation of BMI – see footnote above), overall accuracy of OCQ automated measures relative to chart review was good, ranging from 76% to 100%. High accuracy in these measures is due in large part to the agreement between the EMR and chart review measures on the absence of measure documentation for the large majority of patients (that is, few instances of advice or readiness, for example, were detected by either method ), which also produces good specificity (75% or higher for all measures except BMI). The low accuracy of the EMR-based BMI measure is due to the fact that the EMR measure found a much higher prevalence of BMI documentation than did the abstractors – thus specificity was low (6% and 13% for KPNW and OCHIN, respectively), while sensitivity was high (93% and 84%, respectively). Some variation in the performance of the measures across sites is evident in terms of sensitivity: diet (97% vs 80%), physical activity (80% vs 62%) and follow-up (85% vs 41%) measures performed better (relative to chart review) at OCHIN compared to KPNW, while advice (60% vs 100%) and readiness (0% vs 33%) performed worse.
In summary, the EMR-based advice and the diet and exercise plan measures performed best relative to the reference standard, with relatively good sensitivity and specificity. Some measures (waist circumference, food and exercise diary education) occurred too infrequently (by either method) to be able to evaluate well in this sample. For the remaining measures (documentation of BMI, readiness and follow-up visit), further work is needed by an expert panel to adjudicate discrepancies between the EMR and chart review measures. This work would inform next steps, i.e., determining which, if any, EMR-based measures need additional refining of specifications to more accurately identify measures of interest and which perform better in terms of locating information less accessible to manual chart reviewers.
OCQ Measures
As described above, patients eligible for this study include those aged 18-75 without diagnoses indicating pregnancy, active treatment for cancer, an eating disorder or receipt of palliative or hospice care. The prevalences of OCQ EMR-based measures 1 –8 for a patient population meeting inclusion criteria during 2007 (n=160,636) are presented in Table 4. Assessment of measures 2-8 was restricted to patients with a documented BMI of 25 or higher (n=112,066). For measure 1, (documentation of BMI) there is a large discrepancy between sites in the proportion of patients for whom documentation exists. This is likely reflective of the fact that KPNW’s EMR has been in place substantially longer (at least 10 years than that of OCHIN
16
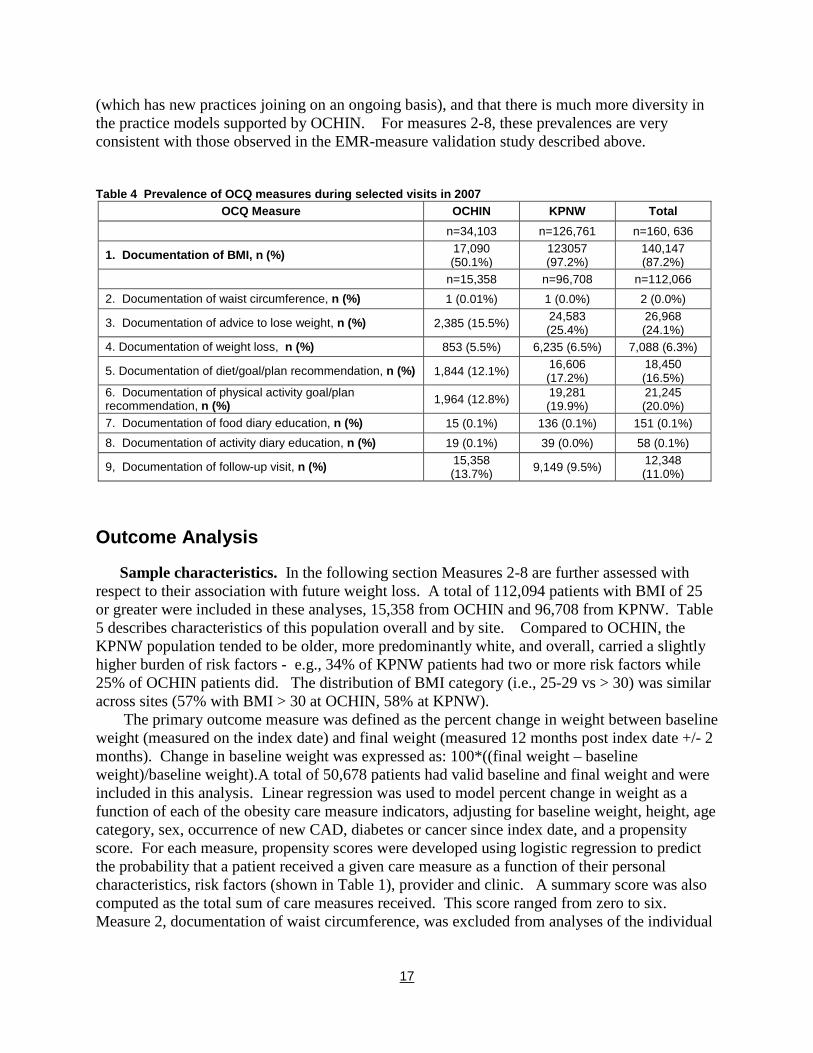
(which has new practices joining on an ongoing basis), and that there is much more diversity in the practice models supported by OCHIN. For measures 2-8, these prevalences are very consistent with those observed in the EMR-measure validation study described above.
Table 4 Prevalence of OCQ measures during selected visits in 2007 OCQ Measure OCHIN KPNW Total
n=34,103 n=126,761 n=160, 636
1. Documentation of BMI, n (%) 17,090 (50.1%)
123057 (97.2%)
140,147 (87.2%)
n=15,358 n=96,708 n=112,066 2. Documentation of waist circumference, n (%) 1 (0.01%) 1 (0.0%) 2 (0.0%)
3. Documentation of advice to lose weight, n (%) 2,385 (15.5%) 24,583 (25.4%)
26,968 (24.1%)
4. Documentation of weight loss, n (%) 853 (5.5%) 6,235 (6.5%) 7,088 (6.3%)
5. Documentation of diet/goal/plan recommendation, n (%) 1,844 (12.1%) 16,606 (17.2%)
18,450 (16.5%)
6. Documentation of physical activity goal/plan recommendation, n (%) 1,964 (12.8%) 19,281
(19.9%) 21,245 (20.0%)
7. Documentation of food diary education, n (%) 15 (0.1%) 136 (0.1%) 151 (0.1%) 8. Documentation of activity diary education, n (%) 19 (0.1%) 39 (0.0%) 58 (0.1%)
9, Documentation of follow-up visit, n (%) 15,358 (13.7%) 9,149 (9.5%) 12,348
(11.0%)
Outcome Analysis
Sample characteristics. In the following section Measures 2-8 are further assessed with respect to their association with future weight loss. A total of 112,094 patients with BMI of 25 or greater were included in these analyses, 15,358 from OCHIN and 96,708 from KPNW. Table 5 describes characteristics of this population overall and by site. Compared to OCHIN, the KPNW population tended to be older, more predominantly white, and overall, carried a slightly higher burden of risk factors - e.g., 34% of KPNW patients had two or more risk factors while 25% of OCHIN patients did. The distribution of BMI category (i.e., 25-29 vs > 30) was similar across sites (57% with BMI > 30 at OCHIN, 58% at KPNW).
The primary outcome measure was defined as the percent change in weight between baseline weight (measured on the index date) and final weight (measured 12 months post index date +/- 2 months). Change in baseline weight was expressed as: 100*((final weight – baseline weight)/baseline weight).A total of 50,678 patients had valid baseline and final weight and were included in this analysis. Linear regression was used to model percent change in weight as a function of each of the obesity care measure indicators, adjusting for baseline weight, height, age category, sex, occurrence of new CAD, diabetes or cancer since index date, and a propensity score. For each measure, propensity scores were developed using logistic regression to predict the probability that a patient received a given care measure as a function of their personal characteristics, risk factors (shown in Table 1), provider and clinic. A summary score was also computed as the total sum of care measures received. This score ranged from zero to six. Measure 2, documentation of waist circumference, was excluded from analyses of the individual
17
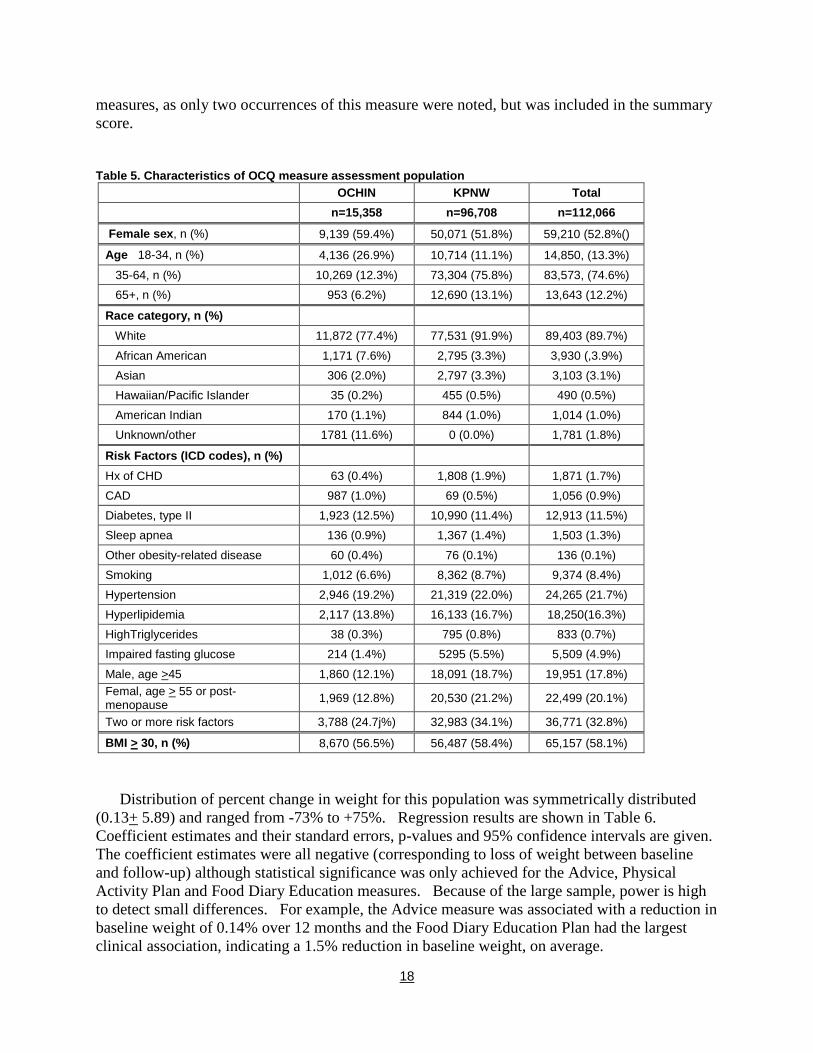
measures, as only two occurrences of this measure were noted, but was included in the summary score.
Table 5. Characteristics of OCQ measure assessment population OCHIN KPNW Total n=15,358 n=96,708 n=112,066
Female sex, n (%) 9,139 (59.4%) 50,071 (51.8%) 59,210 (52.8%()
Age 18-34, n (%) 4,136 (26.9%) 10,714 (11.1%) 14,850, (13.3%)
35-64, n (%) 10,269 (12.3%) 73,304 (75.8%) 83,573, (74.6%) 65+, n (%) 953 (6.2%) 12,690 (13.1%) 13,643 (12.2%)
Race category, n (%) White 11,872 (77.4%) 77,531 (91.9%) 89,403 (89.7%)
African American 1,171 (7.6%) 2,795 (3.3%) 3,930 (,3.9%) Asian 306 (2.0%) 2,797 (3.3%) 3,103 (3.1%) Hawaiian/Pacific Islander 35 (0.2%) 455 (0.5%) 490 (0.5%) American Indian 170 (1.1%) 844 (1.0%) 1,014 (1.0%) Unknown/other 1781 (11.6%) 0 (0.0%) 1,781 (1.8%)
Risk Factors (ICD codes), n (%) Hx of CHD 63 (0.4%) 1,808 (1.9%) 1,871 (1.7%) CAD 987 (1.0%) 69 (0.5%) 1,056 (0.9%) Diabetes, type II 1,923 (12.5%) 10,990 (11.4%) 12,913 (11.5%) Sleep apnea 136 (0.9%) 1,367 (1.4%) 1,503 (1.3%)
Other obesity-related disease 60 (0.4%) 76 (0.1%) 136 (0.1%) Smoking 1,012 (6.6%) 8,362 (8.7%) 9,374 (8.4%) Hypertension 2,946 (19.2%) 21,319 (22.0%) 24,265 (21.7%) Hyperlipidemia 2,117 (13.8%) 16,133 (16.7%) 18,250(16.3%) HighTriglycerides 38 (0.3%) 795 (0.8%) 833 (0.7%) Impaired fasting glucose 214 (1.4%) 5295 (5.5%) 5,509 (4.9%)
Male, age >45 1,860 (12.1%) 18,091 (18.7%) 19,951 (17.8%) Femal, age > 55 or post-menopause 1,969 (12.8%) 20,530 (21.2%) 22,499 (20.1%)
Two or more risk factors 3,788 (24.7j%) 32,983 (34.1%) 36,771 (32.8%)
BMI > 30, n (%)
8,670 (56.5%) 56,487 (58.4%) 65,157 (58.1%)
Distribution of percent change in weight for this population was symmetrically distributed (0.13+ 5.89) and ranged from -73% to +75%. Regression results are shown in Table 6. Coefficient estimates and their standard errors, p-values and 95% confidence intervals are given. The coefficient estimates were all negative (corresponding to loss of weight between baseline and follow-up) although statistical significance was only achieved for the Advice, Physical Activity Plan and Food Diary Education measures. Because of the large sample, power is high to detect small differences. For example, the Advice measure was associated with a reduction in baseline weight of 0.14% over 12 months and the Food Diary Education Plan had the largest clinical association, indicating a 1.5% reduction in baseline weight, on average.
18

The summary measure, a simple count of total services documented, was also small but statistically significant. This coefficient estimate suggests that, on average, there is an additional 0.06% reduction in baseline weight for each additional measure delivered.
There are some limitations to these findings. First, measures 2-8 were only analyzed in patients who had a documented BMI. Results are not generalizable to populations in which a BMI was not documented but may nevertheless benefit from (and should be) receiving obesity care services. Second, because not all patients had a follow-up visit within the window in which final weights were obtained, the outcome measure is missing for a substantial proportion of the population. Additional work is needed to understand how these missing patients may differ from the analysis set and to employ methodologies (e.g. survival methods) that better account for censoring. Third, additional work is needed in reconciling discrepancies between the EMR-based measures and the imperfect reference standard based on chart review to better understand the strengths and weaknesses of an automated system for assessing care quality. Finally, the measures investigated here, including the summary measure, are based on care events essentially occurring at a single point in time (even the follow-up visit should be arranged on the index date). It’s conceivable that, over a period of time, repeated delivery of care measures may have a cumulative impact (i.e. a “dose” effect). These limitations outline future work for understanding, refining and implementing a consistent and comprehensive assessment of the delivery and impact of obesity care measures.
Summary. Given the limitations described above, these results are nevertheless encouraging: 1) they provide external validation of the EMR-based measures in that the associated effects, while small, are consistently in the expected direction, 2) they provide some evidence that the delivery of these services can impact an important outcome and encourage work to find ways of increasing that impact and 3) they reinforce the notion that comprehensive obesity care quality assessment can be effectively and efficiently implemented.
Table 6. Results of linear regression analysis* of individual OQC measures on percent change in weight
Individual Measures Coef (sd) P-value 95% CI lower
95% CI uppper
2. Documentation of waist circumference † † † † † 3. Documentation of advice to lose weight -0.144 0.062 0.021 -0.266 -0.022 4. Documentation of weight loss readiness assessment -0.182 0.106 0.085 -0.390 0.025 5. Documentation of diet/goal/plan recommendation -0.053 0.073 0.466 -0.196 0.090 6. Documentation of physical activity goal/plan -0.162 0.068 0.017 -0.295 -0.029 7. Documentation of food diary education -1.518 0.718 0.035 -2.927 -0.110 8. Documentation of activity diary education -0.006 0.016 0.702 -0.037 0.025 9, Documentation of follow-up visit -0.046 0.078 0.553 -0.199 0.106
Summary Measure Sum of individual measures -0.059 0.024 0.015 -0.107 -0.012
* Adjusted for baseline weight, height, age category, sex, occurrence of new CAD, diabetes or cancer since index date, and a propensity score
† Not assessed
19

References
1. McGlynn EA, Asch SM, Adams J, Keesey J, Hicks J, DeCristofaro A, Kerr EA. The quality of health care delivered to adults in the United States. N Engl J Med 2003 Jun 26; 348(26):2635-2645.
2. Corrigan J, Donaldson MS, Kohn LT, (Eds). Crossing the Quality Chasm: A New Health System for the 21st Century. Washington, DC: National Academy Press; 2001.
3. Adams K, Corrigan J, (Eds). Priority Areas for National Actions: Transforming Health Care Quality. Institute of Medicine, National Academy Press; 2003.
4. Ogden CL, Carroll MD, Curtin LR, McDowell MA, Tabak CJ, Flegal KM. Prevalence of overweight and obesity in the United States, 1999-2004. JAMA 2006 Apr 5; 295(13):1549-1555.
5. Wang Y, Beydoun MA. The obesity epidemic in the United States--gender, age, socioeconomic, racial/ethnic, and geographic characteristics: a systematic review and meta-regression analysis. Epidemiol Rev 2007; 29:6-28.
6. NIH Publication number 00-4084. The Practical Guide: Identification, Evaluation, and Treatment of Overweight and Obesity in Adults. NIH Publication 2007 May 20.
7. Schneider EC, Riehl V, Courte-Wienecke S, Eddy DM, Sennett C. Enhancing performance measurement: NCQA's road map for a health information framework. National Committee for Quality Assurance. JAMA 1999 Sep 22; 282(12):1184-1190.
8. Chaudhry B, Wang J, Wu S, Maglione M, Mojica W, Roth E, Morton SC, Shekelle PG. Systematic review: impact of health information technology on quality, efficiency, and costs of medical care. Ann Intern Med 2006 May 16; 144(10):742-752.
9. Hazlehurst B, Frost HR, Sittig DF, Stevens VJ. MediClass: A system for detecting and classifying encounter-based clinical events in any electronic medical record. J Am Med Inform Assoc 2005 Sep; 12(5):517-529.
10. Chapman WW, Fizman M, Chapman BE, Haug PJ. A comparison of classification algorithms to automatically identify chest X-ray reports that support pneumonia. J Biomed Inform 2001 Feb; 34(1):4-14.
11. Friedman C, Knirsch C, Shagina L, Hripcsak G. Automating a severity score guideline for community-acquired pneumonia employing medical language
processing of discharge summaries. Proc AMIA Symp 1999;256-260.
12. Wilcox AB, Hripcsak G. The role of domain knowledge in automating medical text report classification. J Am Med Inform Assoc 2003 Jul; 10(4):330-338.
13. Hedley AA, Ogden CL, Johnson CL, Carroll MD, Curtin LR, Flegal KM. Prevalence of overweight and obesity among US children, adolescents, and adults, 1999-2002. JAMA 2004 Jun 16; 291(23):2847-2850.
14. Manson JE, Bassuk SS. Obesity in the United States: a fresh look at its high toll. JAMA 2003 Jan 8; 289(2):229-230.
15. Gelber RP, Kurth T, Manson JE, Buring JE, Gaziano JM. Body mass index and mortality in men: evaluating the shape of the association. Int J Obes (Lond) 2007 Aug; 31(8):1240-1247.
16. Botvin GJ, Baker E, Dusenbury L, Botvin EM, Diaz T. Long-term follow-up results of a randomized drug abuse prevention trial in a white middle-class population. JAMA 1995 Apr 12; 273(14):1106-1112.
17. Wilson PW, D'Agostino RB, Sullivan L, Parise H, Kannel WB. Overweight and obesity as determinants of cardiovascular risk: the Framingham experience. Arch Intern Med 2002 Sep 9; 162(16):1867-1872.
18. Field AE, Coakley EH, Must A, Spadano JL, Laird N, Dietz WH, Rimm E, Colditz GA. Impact of overweight on the risk of developing common chronic diseases during a 10-year period. Arch Intern Med 2001 Jul 9; 161(13):1581-1586.
19. Chang SC, Lacey JV, Jr., Brinton LA, Hartge P, Adams K, Mouw T, Carroll L, Hollenbeck A, Schatzkin A, Leitzmann MF. Lifetime weight history and endometrial cancer risk by type of menopausal hormone use in the NIH-AARP diet and health study. Cancer Epidemiol Biomarkers Prev 2007 Apr; 16(4):723-730.
20. Wenten M, Gilliland FD, Baumgartner K, Samet JM. Associations of weight, weight change, and body mass with breast cancer risk in Hispanic and non-Hispanic white women. Ann Epidemiol 2002 Aug; 12(6):435-4.
21. Narayan K, Boyle J, Thompson T, Gregg E, Williamson D. Effect of BMI on lifetime risk for diabetes in the U.S. Diabetes Care 2007 Mar 19; 30:1562-1566.
20

22. Allison DB, Fontaine KR, Manson JE, Stevens J, VanItallie TB. Annual deaths attributable to obesity in the United States. JAMA 1999 Oct 27; 282(16):1530-1538.
23. Wolf AM. Economic outcomes of the obese patient. Obes Res 2002 Nov; 10 Suppl 1:58S-62S.
24. Thompson D, Wolf AM. The medical-care cost burden of obesity. Obes Rev 2001 Aug; 2(3):189-197.
25. Finkelstein EA, Fiebelkorn IC, Wang G. National medical spending attributable to overweight and obesity: how much, and who's paying? Health Aff (Millwood ) 2003 Jan; Suppl Web Exclusives:W3-26.
26. Finkelstein E, Brown D, Trogdon JG, Segel JE, Ben-Joseph R. Age-specific impact of obesity on prevalence and costs of diabetes and dyslipidemia. Value in Health 2006 Dec 21; 10(s1):s45-s51.
27. Wang F, Schultz AB, Musich S, McDonald T, Hirschland D, Edington DW. The relationship between National Heart, Lung, and Blood Institute Weight Guidelines and concurrent medical costs in a manufacturing population. Am J Health Promot 2003 Jan; 17(3):183-189.
28. Ricci JA, Chee E. Lost productive time associated with excess weight in the U.S. workforce. J Occup Environ Med 2005 Dec; 47(12):1227-1234.
29. Finkelstein EA, Ruhm CJ, Kosa KM. Economic causes and consequences of obesity. Annu Rev Public Health 2005; 26:239-257.
30. Wadden TA, Butryn ML, Byrne KJ. Efficacy of lifestyle modification for long-term weight control. Obes Res 2004 Dec; 12 Suppl:151S-162S.
31. Jeffery RW, Drewnowski A, Epstein LH, Stunkard AJ, Wilson GT, Wing RR, Hill DR. Long-term maintenance of weight loss: current status. Health Psychol 2000 Jan; 19(1 Suppl):5-16.
32. Knowler WC, Barrett-Connor E, Fowler SE, Hamman RF, Lachin JM, Walker EA, Nathan DM. Reduction in the incidence of type 2 diabetes with lifestyle intervention or metformin. N Engl J Med 2002 Feb 7; 346(6):393-403.
33. Stevens VJ, Corrigan SA, Obarzanek E, Bernauer E, Cook NR, Hebert P, Mattfeldt-Beman M, Oberman A, Sugars C, Dalcin AT, . Weight loss intervention in phase 1 of the Trials of Hypertension Prevention. The TOHP Collaborative Research Group. Arch Intern Med 1993 Apr 12; 153(7):849-858.
34. Stevens VJ, Obarzanek E, Cook NR, Lee IM, Appel LJ, Smith WD, Milas NC, Mattfeldt-Beman M,
Belden L, Bragg C, Millstone M, Raczynski J, Brewer A, Singh B, Cohen J. Long-term weight loss and changes in blood pressure: results of the Trials of Hypertension Prevention, phase II. Ann Intern Med 2001 Jan 2; 134(1):1-11.
35. Tuomilehto J, Lindstrom J, Eriksson JG, Valle TT, Hamalainen H, Ilanne-Parikka P, Keinanen-Kiukaanniemi S, Laakso M, Louheranta A, Rastas M, Salminen V, Uusitupa M. Prevention of type 2 diabetes mellitus by changes in lifestyle among subjects with impaired glucose tolerance. N Engl J Med 2001 May 3; 344(18):1343-1350.
36. Whelton PK, Appel LJ, Espeland MA, Applegate WB, Ettinger WH, Jr., Kostis JB, Kumanyika S, Lacy CR, Johnson KC, Folmar S, Cutler JA. Sodium reduction and weight loss in the treatment of hypertension in older persons: a randomized controlled trial of nonpharmacologic interventions in the elderly (TONE). TONE Collaborative Research Group. JAMA 1998 Mar 18; 279(11):839-846.
37. Appel LJ, Champagne CM, Harsha DW, Cooper LS, Obarzanek E, Elmer PJ, Stevens VJ, Vollmer WM, Lin PH, Svetkey LP, Stedman SW, Young DR. Effects of comprehensive lifestyle modification on blood pressure control: main results of the PREMIER clinical trial. JAMA 2003 Apr 23; 289(16):2083-2093.
38. Svetkey LP, Stevens VJ, Brantley PJ, Appel LJ, Hollis JF, Loria CM, Vollmer WM, Gullion CM, Funk K, Smith P, Samuel-Hodge C, Myers V, Lien LF, Laferriere D, Kennedy B, Jerome GJ, Heinith F, Harsha DW, Evans P, Erlinger TP, Dalcin AT, Coughlin J, Charleston J, Champagne CM, Bauck A, Ard JD, Aicher K. Comparison of strategies for sustaining weight loss: the weight loss maintenance randomized controlled trial. JAMA 2008 Mar 12; 299(10):1139-1148.
39. Fiore MC. Treating tobacco use and dependence: an introduction to the US Public Health Service Clinical Practice Guideline. Respir Care 2000 Oct; 45(10):1196-1199.
40. Schappert SM, Burt CW. Ambulatory care visits to physician offices, hospital outpatient departments, and emergency departments: United States, 2001-02. Vital Health Stat 13 2006 Feb;(159):1-66.
41. Abid A, Galuska D, Khan LK, Gillespie C, Ford ES, Serdula MK. Are healthcare professionals advising obese patients to lose weight? A trend analysis. MedGenMed 2005; 7(4):10.
42. Jackson JE, Doescher MP, Saver BG, Hart LG. Trends in professional advice to lose weight among obese adults, 1994 to 2000. J Gen Intern Med 2005 Sep; 20(9):814-818.
21

43. Timmerman GM, Reifsnider E, Allan JD. Weight management practices among primary care providers. J Am Acad Nurse Pract 2000 Apr; 12(4):113-116.
44. Forman-Hoffman V, Little A, Wahls T. Barriers to obesity management: a pilot study of primary care clinicians. BMC Fam Pract 2006; 7:35.
45. Harris SB, Petrella RJ, Lambert-Lanning A, Leadbetter W, Cranston L. Lifestyle management for type 2 diabetes. Are family physicians ready and willing? Can Fam Physician 2004 Sep; 50:1235-1243.
46. Ruelaz AR, Diefenbach P, Simon B, Lanto A, Arterburn D, Shekelle PG. Perceived barriers to weight management in primary care--perspectives of patients and providers. J Gen Intern Med 2007 Apr; 22(4):518-522.
47. Gorin AA, Phelan S, Hill JO, Wing RR. Medical triggers are associated with better short- and long-term weight loss outcomes. Prev Med 2004 Sep; 39(3):612-616.
48. NHLBI. NHLBI expert panel on the identification, evaluation, and treatment of overweight and obesity in adults. Clinical Guidelines on the Identification, Evaluation, and Treatment of Overweight and Obesity in Adults--The Evidence Report. National Institutes of Health. Obes Res 1998 Sep; 6 Suppl 2:51S-209S.
49. US Preventative Services Task Force. Screening for obesity in adults: recommendations and rationale. Am J Nurs 2004 May; 104(5):94-8, 100, passim.
50. American Association of Clinical Endocrinoloists AACE/ACE Obesity Task Force. Aace/ace position statement on the prevention, diagnosis, and treatment of obesity. Endocrine Practice 1998; 4(5):297-300.
51. Stevens VJ, Solberg LI, Quinn VP, Rigotti NA, Hollis JA, Smith KS, Zapka JG, France E, Vogt T, Gordon N, Fishman P, Boyle RG. Relationship between tobacco control policies and the delivery of smoking cessation services in nonprofit HMOs. J Natl Cancer Inst Monogr 2005;(35):75-80.
52. Institute of Medicine, Dick R, Steen E, Detmer D. The Computer-Based Patient Record: An Essential Technology for Health Care. Revised Ed. Washington, DC: National Academy Press; 1997.
53. Thompson T, Brailer D. The Decade of Health Information Technology: Delivering consumer-centric and information-rich helth care-Framework for Strategic Action. 2004 Jul 21.
54. Walsh SH. The clinician's perspective on electronic health records and how they can affect patient care. BMJ 2004 May 15; 328(7449):1184-1187.
55. Coiera E. When conversation is better than computation. J Am Med Inform Assoc 2000 May; 7(3):277-286.
56. Hunt DL, Haynes RB, Hanna SE, Smith K. Effects of computer-based clinical decision support systems on physician performance and patient outcomes: a systematic review. JAMA 1998 Oct 21; 280(15):1339-1346.
57. Kaushal R, Shojania KG, Bates DW. Effects of computerized physician order entry and clinical decision support systems on medication safety: a systematic review. Arch Intern Med 2003 Jun 23; 163(12):1409-1416.
58. Rottger P, Sunkel H, Reul H, Klein I. [New possibilities of statistical evaluation of autopsy records. Computer free text analysis]. Methods Inf Med 1970 Jan; 9(1):35-44.
59. Fenichel RR, Barnett GO. An application-independent subsystem for free-text analysis. Comput Biomed Res 1976 Apr; 9(2):159-167.
60. Sager N, Wong R. Developing a database from free-text clinical data. J Clin Comput 1983; 11(5-6):184-194.
61. Hripcsak G, Austin JH, Alderson PO, Friedman C. Use of natural language processing to translate clinical information from a database of 889,921 chest radiographic reports. Radiology 2002 Jul; 224(1):157-163.
62. Jain NL, Knirsch CA, Friedman C, Hripcsak G. Identification of suspected tuberculosis patients based on natural language processing of chest radiograph reports. Proc AMIA Annu Fall Symp 1996;542-546.
63. Hripcsak G, Friedman C, Alderson PO, DuMouchel W, Johnson SB, Clayton PD. Unlocking clinical data from narrative reports: a study of natural language processing. Ann Intern Med 1995 May 1; 122(9):681-688.
64. Friedman C, Shagina L, Lussier Y, Hripcsak G. Automated encoding of clinical documents based on natural language processing. J Am Med Inform Assoc 2004 Sep; 11(5):392-402.
65. Elkins JS, Friedman C, Boden-Albala B, Sacco RL, Hripcsak G. Coding neuroradiology reports for the Northern Manhattan Stroke Study: a comparison of natural language processing and manual review. Comput Biomed Res 2000 Feb; 33(1):1-10.
66. Sager N, Lyman M, Bucknall C, Nhan N, Tick LJ. Natural language processing and the representation of clinical data. J Am Med Inform Assoc 1994 Mar;
22

1(2):142-160.
67. Honigman B, Lee J, Rothschild J, Light P, Pulling RM, Yu T, Bates DW. Using computerized data to identify adverse drug events in outpatients. J Am Med Inform Assoc 2001 May; 8(3):254-266.
68. Mamlin BW, Heinze DT, McDonald CJ. Automated extraction and normalization of findings from cancer-related free-text radiology reports. AMIA Annu Symp Proc 2003;420-424.
69. Hazlehurst B, Sittig DF, Stevens VJ, Smith KS, Hollis JF, Vogt TM, Winickoff JP, Glasgow R, Palen TE, Rigotti NA. Natural language processing in the electronic medical record: assessing clinician adherence to tobacco treatment guidelines. Am J Prev Med 2005 Dec; 29(5):434-439.
70. Hazlehurst B, Mullooly J, Naleway A, Crane B. Detecting possible vaccination reactions in clinical notes. AMIA Annu Symp Proc 2005;306-310.
71. Dolin RH, Alschuler L, Beebe C, Biron PV, Boyer SL, Essin D, Kimber E, Lincoln T, Mattison JE. The HL7 Clinical Document Architecture. J Am Med Inform Assoc 2001 Nov; 8(6):552-569.
72. Dolin RH, Alschuler L, Boyer S, Beebe C, Behlen FM, Biron PV, Shabo SA. HL7 Clinical Document Architecture, Release 2. J Am Med Inform Assoc 2006 Jan; 13(1):30-39.
73. Hazelhurst B, McBurnie MA, Mularski RA, Puro JE, Chauvie SL. Automating care quality measurement with health information technology. Am J Manag Care 2012 Jun; 18(6):313-319.
List of Publications and Products
Several manuscripts are in production, none have been submitted for publication at this time.
23