automating the generation of … the generation of subcatchments . contents background automated...
TRANSCRIPT
INNOVYZE EUROPEAN USER CONFERENCE IWAN JONES
AUTOMATING THE GENERATION OF SUBCATCHMENTS

CONTENTS
Background
Automated Method
Examples
Dealing with Dummy subcatchment
2
BACKGROUND - PURPOSE OF SUB CATCHMENTS
IWAN JONES INNOVYZE EUROPEAN USER CONFERENCE
3
PU
RP
OS
E O
F S
UB
CA
TC
HM
EN
TS
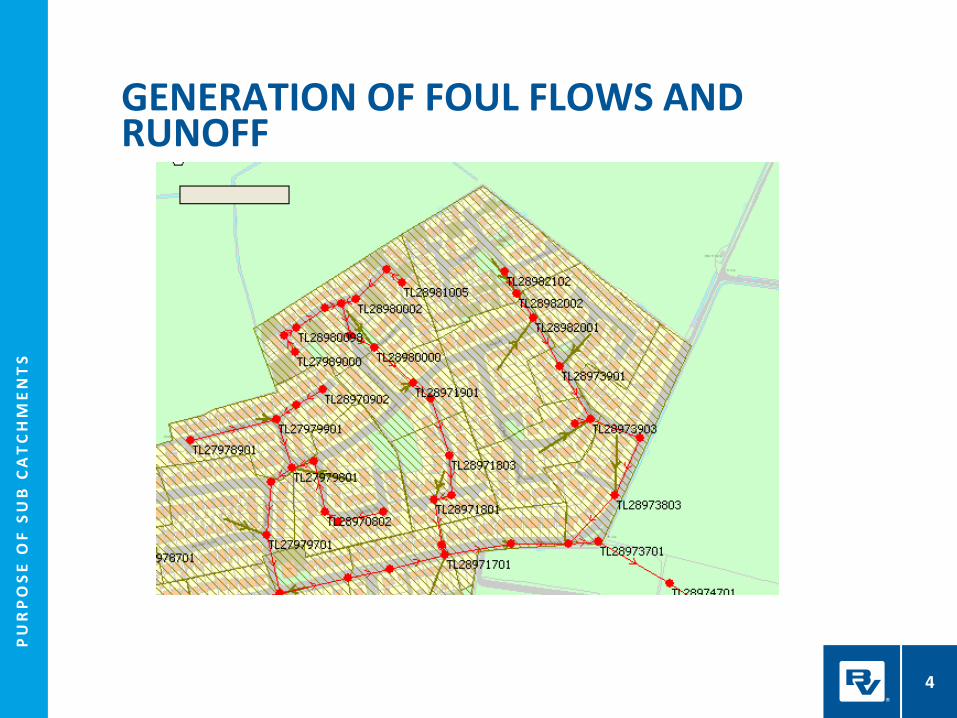
GENERATION OF FOUL FLOWS AND RUNOFF
4

PU
RP
OS
E O
F S
UB
CA
TC
HM
EN
TS
A single sub catchment stores many variables
GENERATION OF FOUL FLOWS AND RUNOFF
5
Infiltration
Domestic FF
Commercial
Trade Flow
Runoff x12
GI Module
Time
Flo
w
PU
RP
OS
E O
F S
UB
CA
TC
HM
EN
TS
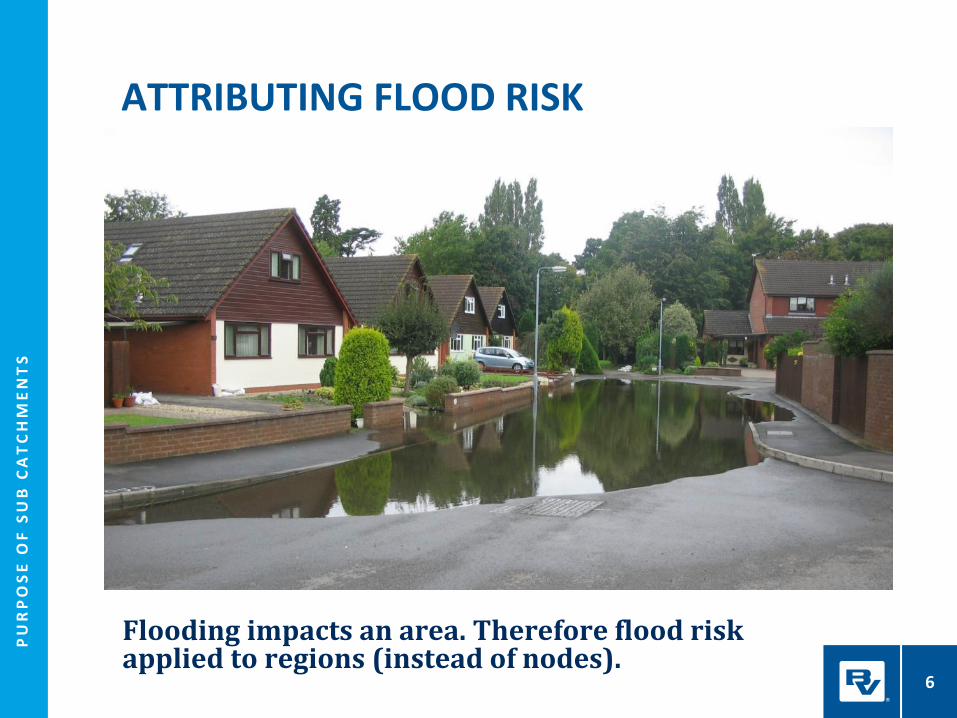
Flooding impacts an area. Therefore flood risk applied to regions (instead of nodes).
ATTRIBUTING FLOOD RISK
6
AUTOMATED METHODS USED TO GENERATE SUBCATCHMENTS
IWAN JONES INNOVYZE EUROPEAN USER CONFERENCE
7

Subcatchments produced for Theissen Polygon
SE
CT
ION
HE
AD
ING
–O
PT
ION
AL
Generally used outside of driver locations, for skeletal models (model type 1).
• Extensively used as requires minimal data.
• Quick and easy to use with InfoWorks facility.
• Boundaries do not follow properties boundaries.
• Definition of boundaries are dictated by number of nodes used to generate boundaries.
• No consideration of hydrology.
THEISSEN POLYGONS
8
AN
ID
EA
L S
UB
CA
TC
HM
EN
T?
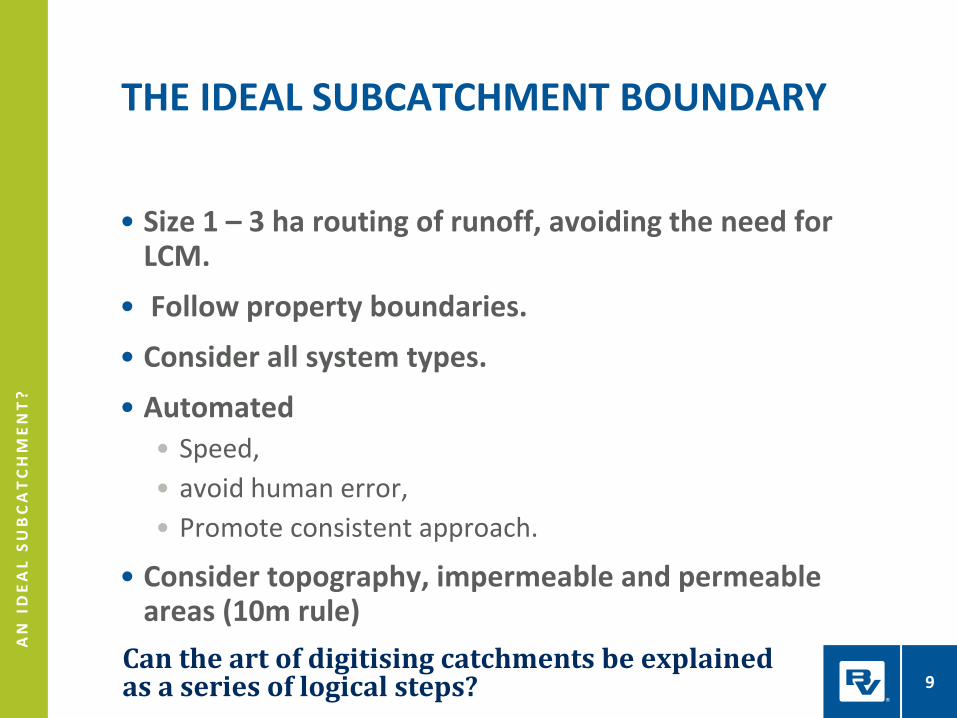
Can the art of digitising catchments be explained as a series of logical steps?
• Size 1 – 3 ha routing of runoff, avoiding the need for LCM.
• Follow property boundaries.
• Consider all system types.
• Automated
• Speed,
• avoid human error,
• Promote consistent approach.
• Consider topography, impermeable and permeable areas (10m rule)
THE IDEAL SUBCATCHMENT BOUNDARY
9

AUTOMATING CONTRIBUTING AREAS TO SUIT PROPERTY BOUNDARIES
IWAN JONES INNOVYZE EUROPEAN USER CONFERENCE
10

The Process
AU
TO
MA
TIO
N O
F D
IGIT
ISIN
G C
ON
TR
IBU
TIN
G A
RE
A
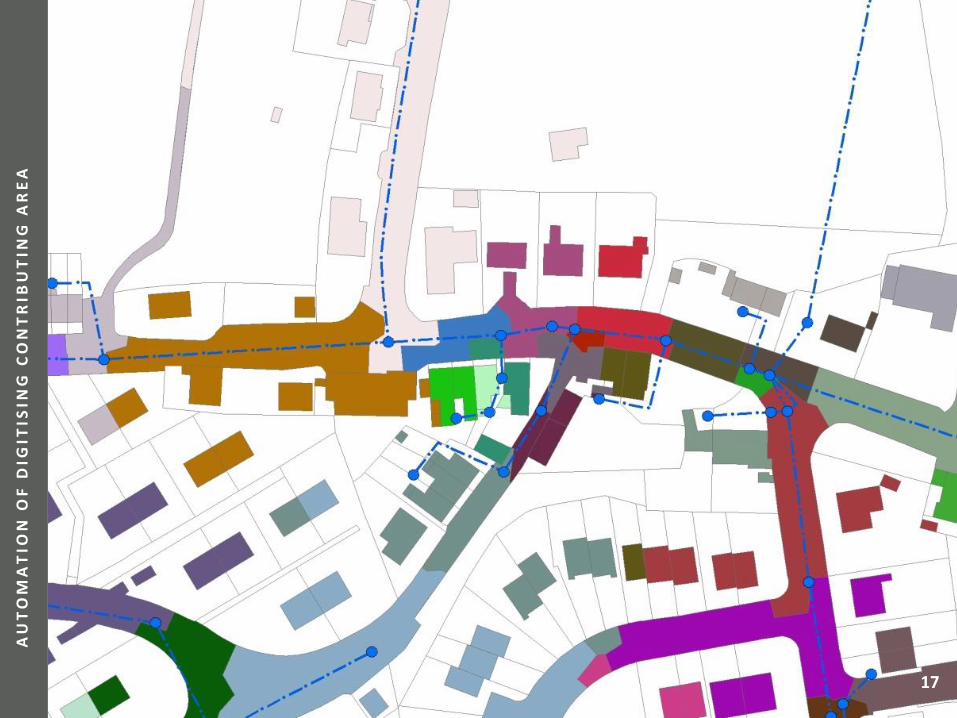
Automated process follows property boundary, its definition is limited to the number of manholes within sewer records.
• Paved areas divided within smaller areas.
• Roof areas attributed to nearest node
• Property boundaries are combined for each node.
• Total potential Impermeable area imported into User Number.
AUTOMATED PROCESS
11
OS MasterMap and Sewer Records
AU
TO
MA
TIO
N O
F D
IGIT
ISIN
G C
ON
TR
IBU
TIN
G A
RE
A
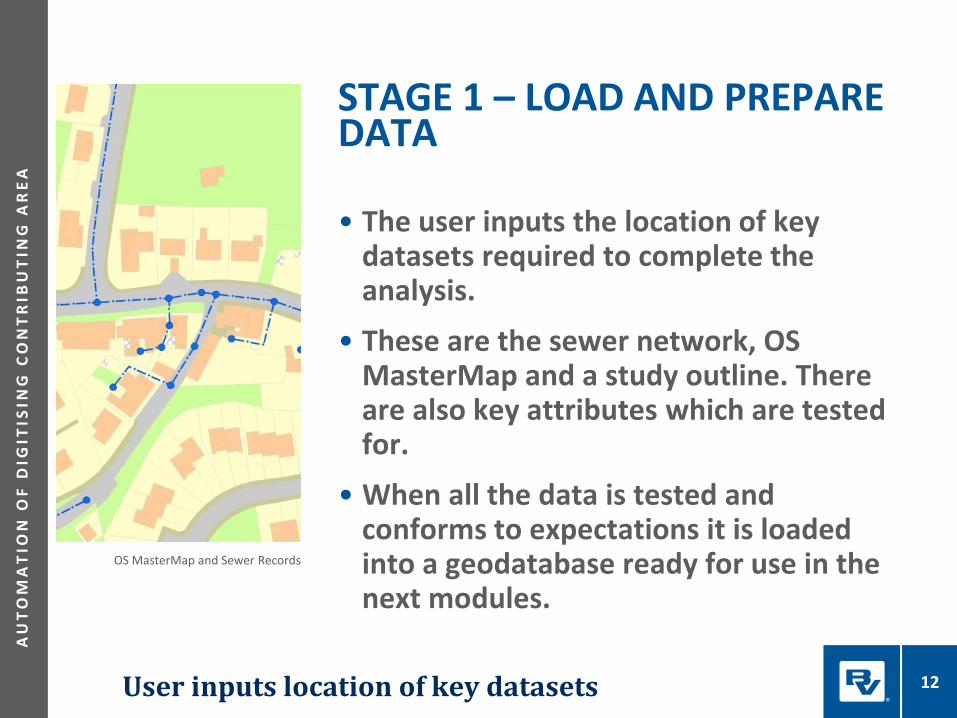
User inputs location of key datasets
• The user inputs the location of key datasets required to complete the analysis.
• These are the sewer network, OS MasterMap and a study outline. There are also key attributes which are tested for.
• When all the data is tested and conforms to expectations it is loaded into a geodatabase ready for use in the next modules.
STAGE 1 – LOAD AND PREPARE DATA
12
AU
TO
MA
TIO
N O
F D
IGIT
ISIN
G C
ON
TR
IBU
TIN
G A
RE
A
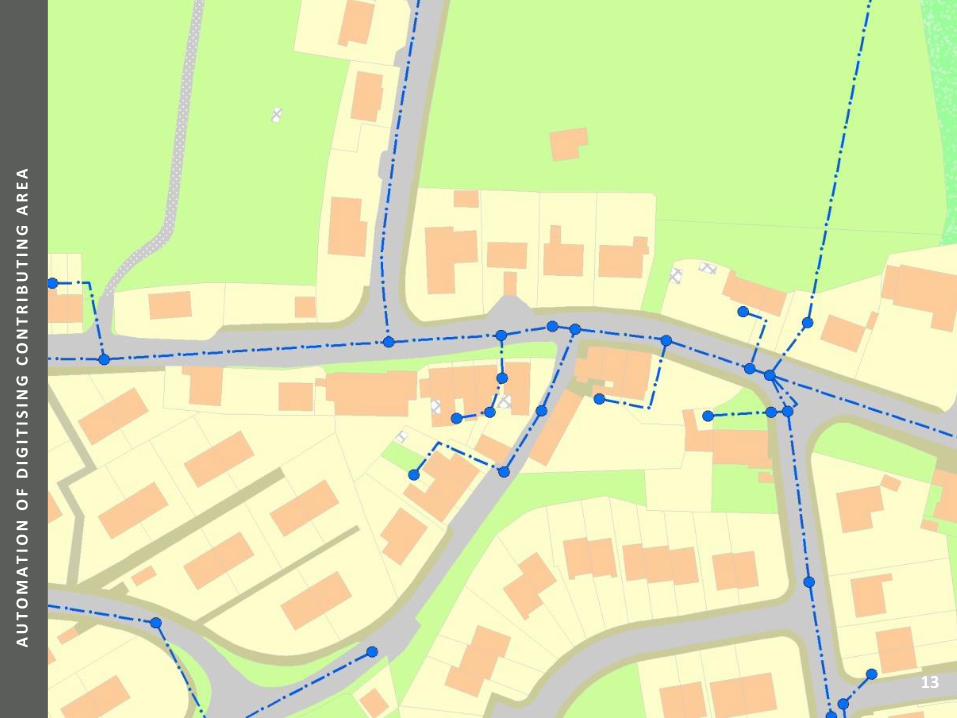
OS MasterMap and Sewer Records 13

Roof Area attributed to nearest sewer
AU
TO
MA
TIO
N O
F D
IGIT
ISIN
G C
ON
TR
IBU
TIN
G A
RE
A
• Properties are queried from OS MasterMap data before nearest neighbour analysis is undertaken to determine the nearest sewer feature.
• Its unique ID is assigned to the property polygon.
STAGE 2 – ANALYSE ROOF AREA
14

AU
TO
MA
TIO
N O
F D
IGIT
ISIN
G C
ON
TR
IBU
TIN
G A
RE
A
13 January 2012 PowerPoint Sample
15

• Roads are queried from OS MasterMap data before being split using Theissen analysis. These segment the road features into thousands of manageable sections.
• Once divided nearest neighbour analysis is undertaken to determine the nearest sewer feature. Its unique ID is assigned to each road polygon.
STAGE 3 – ANALYSE HIGHWAY AREA
16
AU
TO
MA
TIO
N O
F D
IGIT
ISIN
G C
ON
TR
IBU
TIN
G A
RE
A
17

Attribute Property Boundary to nearest sewer
• Properties boundaries e.g. gardens are queried from OS MasterMap data before nearest neighbour analysis is undertaken to determine the nearest sewer feature.
• Its unique ID is assigned to each property boundary polygon.
STAGE 4 – ANALYSE PROPERTY BOUNDARY AREA
18

AU
TO
MA
TIO
N O
F D
IGIT
ISIN
G C
ON
TR
IBU
TIN
G A
RE
A
19
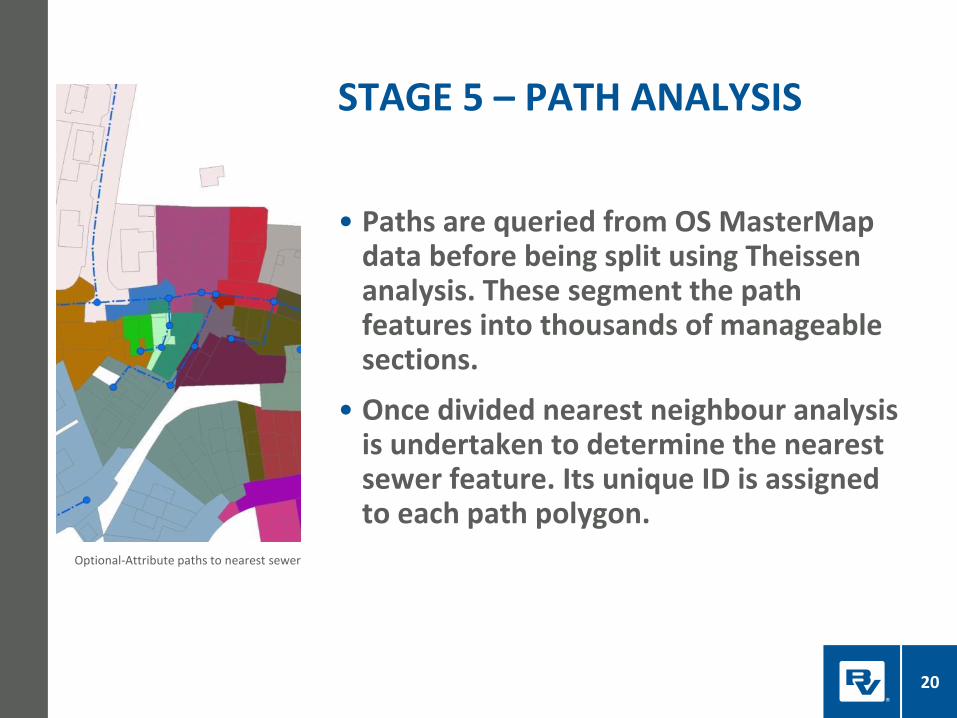
Optional-Attribute paths to nearest sewer
• Paths are queried from OS MasterMap data before being split using Theissen analysis. These segment the path features into thousands of manageable sections.
• Once divided nearest neighbour analysis is undertaken to determine the nearest sewer feature. Its unique ID is assigned to each path polygon.
STAGE 5 – PATH ANALYSIS
20

AU
TO
MA
TIO
N O
F D
IGIT
ISIN
G C
ON
TR
IBU
TIN
G A
RE
A
21

Fill gaps
• Remaining land within the study area but not yet assigned to a sewer feature is queried from OS MasterMap.
• Rules are applied to fill gaps.
• For example holes under a certain area, completely surrounded by polygons assigned to a single sewer feature are assigned to the same feature; whereas large gaps surrounded by multiple polygons assigned to more than one feature may be split and portioned to match the surrounding polygons.
STAGE 6 – ‘OTHER’ LAND USE ANALYSIS
22

AU
TO
MA
TIO
N O
F D
IGIT
ISIN
G C
ON
TR
IBU
TIN
G A
RE
A
23
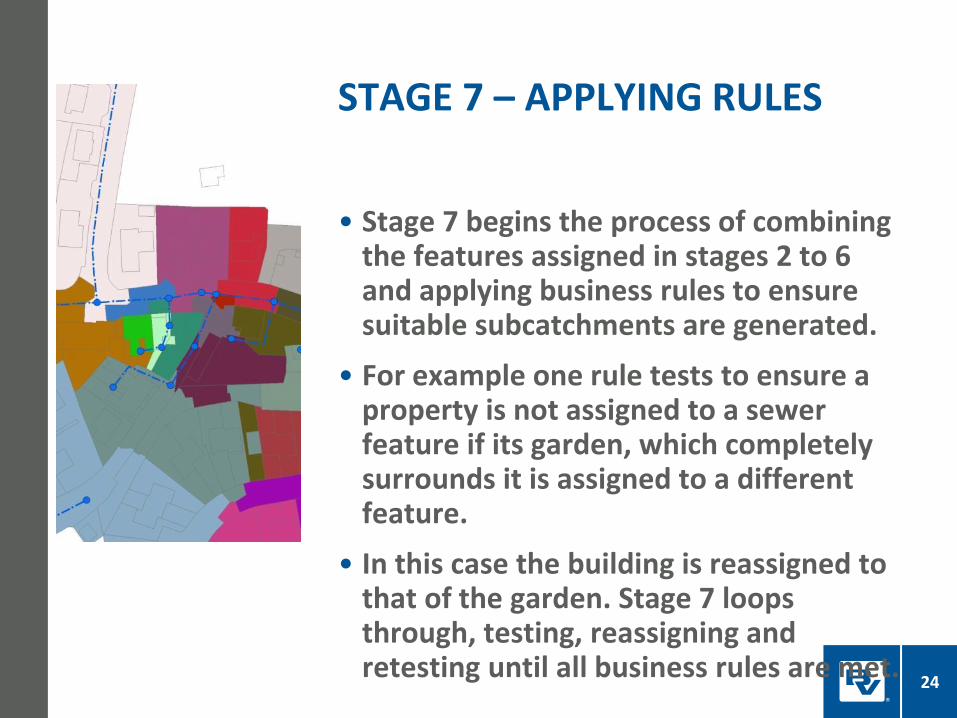
• Stage 7 begins the process of combining the features assigned in stages 2 to 6 and applying business rules to ensure suitable subcatchments are generated.
• For example one rule tests to ensure a property is not assigned to a sewer feature if its garden, which completely surrounds it is assigned to a different feature.
• In this case the building is reassigned to that of the garden. Stage 7 loops through, testing, reassigning and retesting until all business rules are met.
STAGE 7 – APPLYING RULES
24

AU
TO
MA
TIO
N O
F D
IGIT
ISIN
G C
ON
TR
IBU
TIN
G A
RE
A
13 January 2012 PowerPoint Sample
25
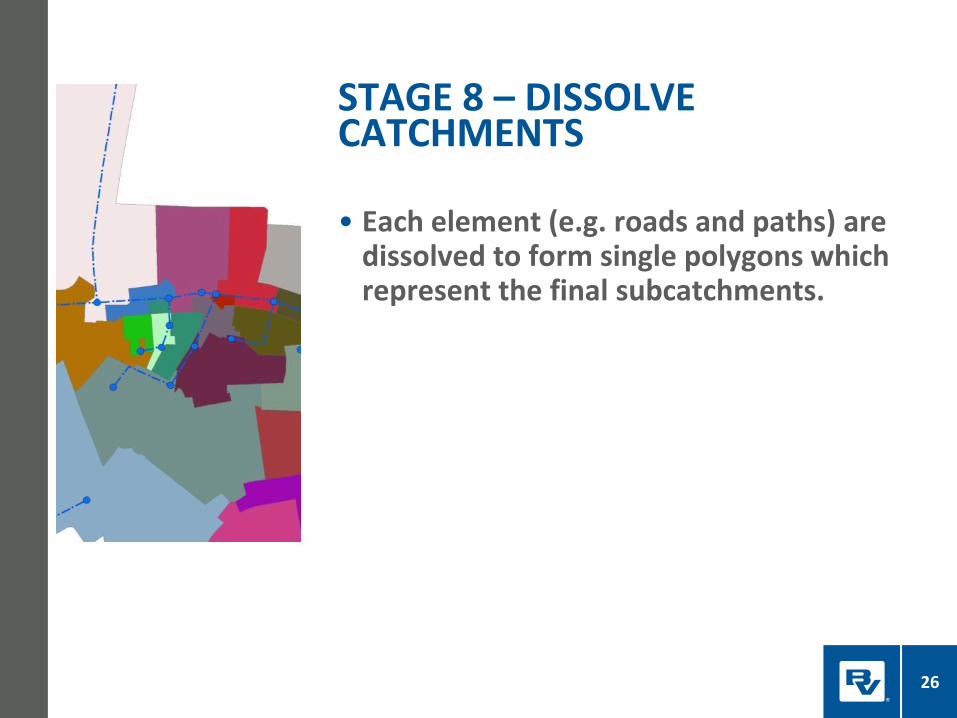
• Each element (e.g. roads and paths) are dissolved to form single polygons which represent the final subcatchments.
STAGE 8 – DISSOLVE CATCHMENTS
26

AU
TO
MA
TIO
N O
F D
IGIT
ISIN
G C
ON
TR
IBU
TIN
G A
RE
A
27

• Attributes are added to the data in line with output format the user selected when starting the tool.
STAGE 9 – ADDING MODEL ATTRIBUTES
28
AU
TO
MA
TIO
N O
F D
IGIT
ISIN
G C
ON
TR
IBU
TIN
G A
RE
A
29

• Network attributes such as unique subcatchment ID are added to the data.
• Impermeability calculations are performed based on area of road, path and building within each subcatchment.
• Optional 10m2 is added to account for driveways, decking and other impermeable structures not fully accounted for in OS MasterMap.
• The raw area and percentage values are added to the correct fields in the data ready for review and use in the model. At this stage these values are considered ‘maximum impermeable area’. Standard impermeability codes are also added for use in the modelling software.
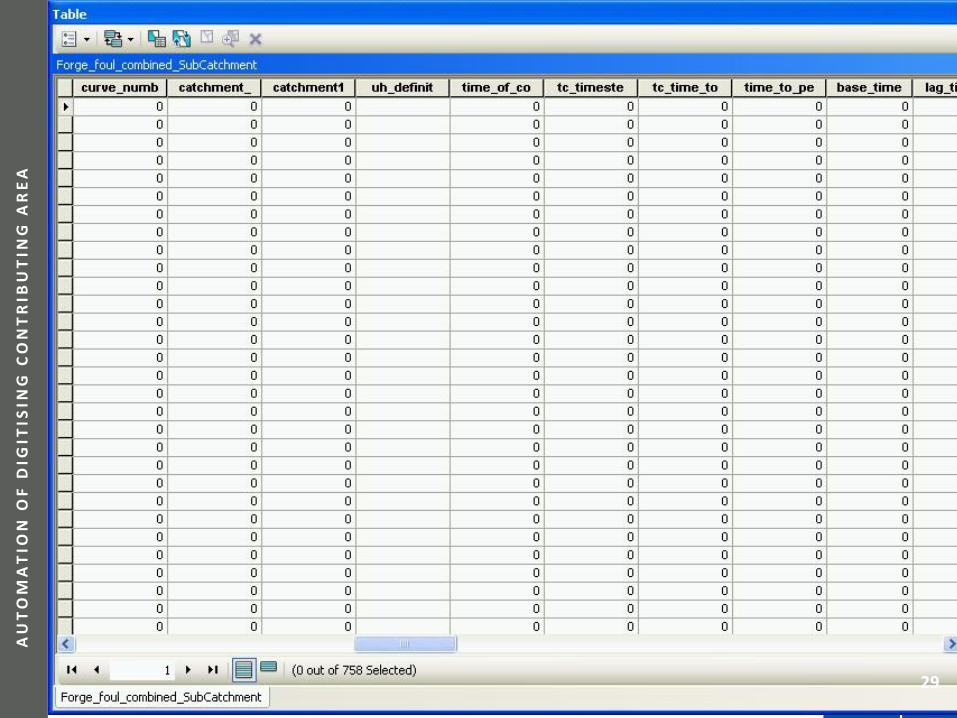
STAGE 10/11 – POPULATE NETWORK ATTRIBUTES
30

AU
TO
MA
TIO
N O
F D
IGIT
ISIN
G C
ON
TR
IBU
TIN
G A
RE
A
31
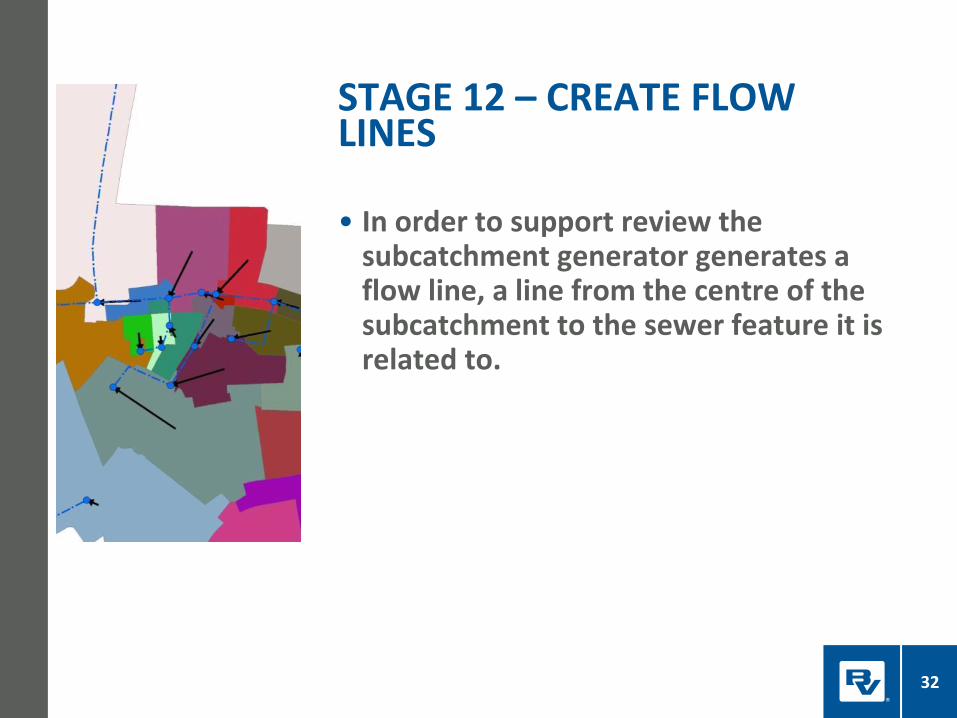
• In order to support review the subcatchment generator generates a flow line, a line from the centre of the subcatchment to the sewer feature it is related to.
STAGE 12 – CREATE FLOW LINES
32

AU
TO
MA
TIO
N O
F D
IGIT
ISIN
G C
ON
TR
IBU
TIN
G A
RE
A
13 January 2012 PowerPoint Sample
33
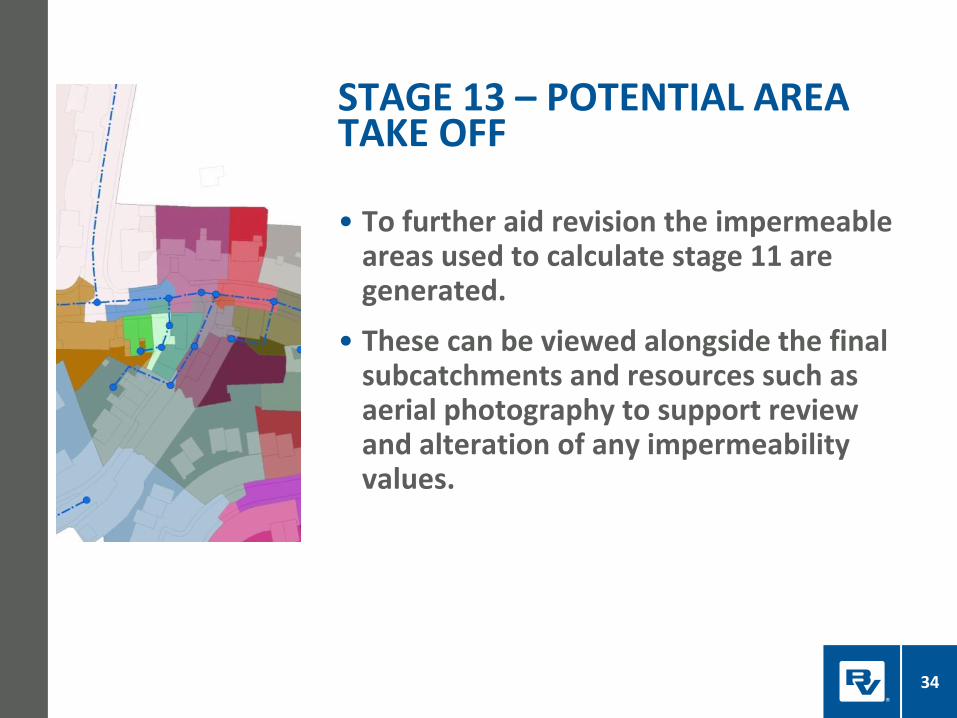
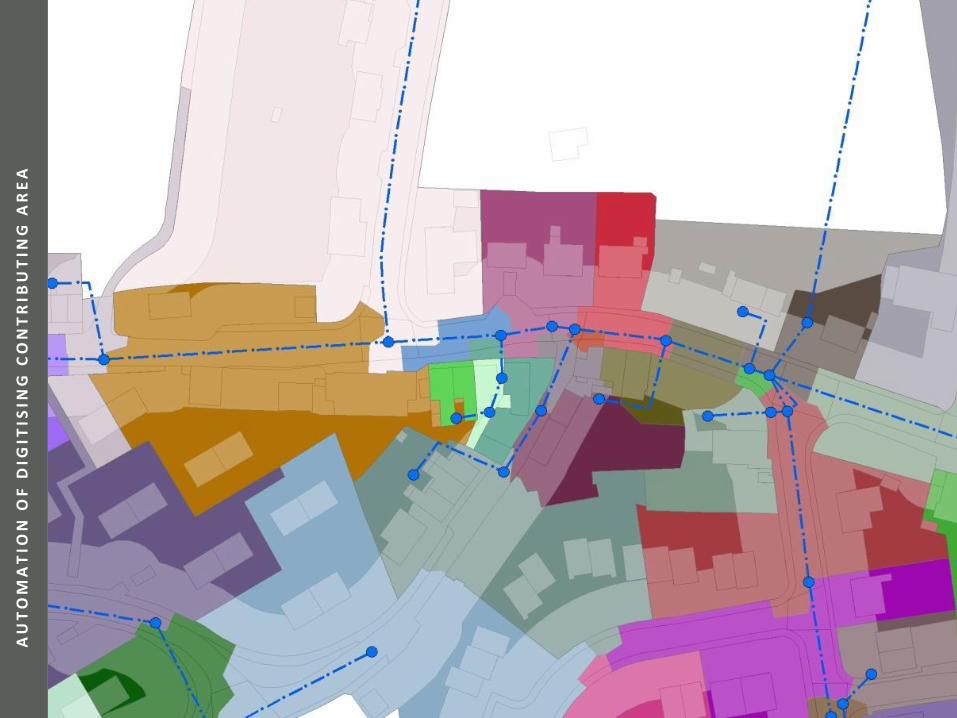
• To further aid revision the impermeable areas used to calculate stage 11 are generated.
• These can be viewed alongside the final subcatchments and resources such as aerial photography to support review and alteration of any impermeability values.
STAGE 13 – POTENTIAL AREA TAKE OFF
34
AU
TO
MA
TIO
N O
F D
IGIT
ISIN
G C
ON
TR
IBU
TIN
G A
RE
A
13 January 2012 PowerPoint Sample
35

10m rule applied
AD
DIT
ION
AL
RU
LE
S
• Optional 10m rule (roof or road) to minimise inclusion of permeable area.
INCLUSION OF ADDITIONAL RULES
36

EX
AM
PL
E -
21
2 S
UB
CA
TC
HM
EN
TS
13 January 2012
37
PowerPoint Sample

EX
AM
PL
E -
23
14
SU
BC
AT
CH
ME
NT
S
13 January 2012
38
PowerPoint Sample

EX
AM
PL
E -
68
72
SU
BC
AT
CH
ME
NT
S
13 January 2012
39
PowerPoint Sample

OTHER ASSOCIATED APPLICATIONS
IWAN JONES INNOVYZE EUROPEAN USER CONF
40

Dummy Subcatchments
DU
MM
Y D
IGIT
ISIN
G S
UB
CA
TC
HM
EN
TS
Dummy subcatchments can also be automated with impermeable area also digitised.
• Dummy subcatchments identified and their zones digitised.
• Contributing areas for dummy subcatchments stored and re-applied within digitised Subcatchment boundaries.
• Maintaining integrity of previously verified models.
DIGITISING DUMMY SUBCATCHMENTS AND MAINTAINING APPLIED AREAS
41

Audit trail ?
42
DU
MM
Y D
IGIT
ISIN
G S
UB
CA
TC
HM
EN
TS
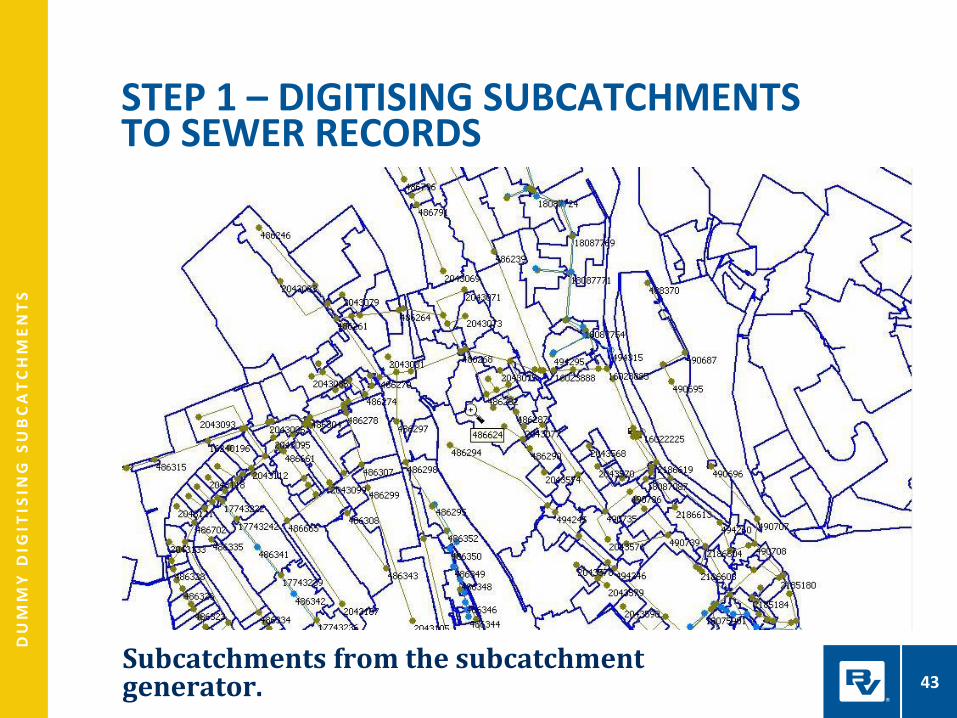
Subcatchments from the subcatchment generator.
STEP 1 – DIGITISING SUBCATCHMENTS TO SEWER RECORDS
43

DU
MM
Y D
IGIT
ISIN
G S
UB
CA
TC
HM
EN
TS
Subcatchments digitised from the subcatchment generator for contributing nodes.
STEP 2 – DIGITISING SUBCATCHMENTS TO CONTRIBUTING NODES
44

DU
MM
Y D
IGIT
ISIN
G S
UB
CA
TC
HM
EN
TS
Contributing node subcatchments from the subcatchment generator.
STEP 2 – DIGITISING SUBCATCHMENTS TO CONTRIBUTING NODES
45
DU
MM
Y D
IGIT
ISIN
G S
UB
CA
TC
HM
EN
TS
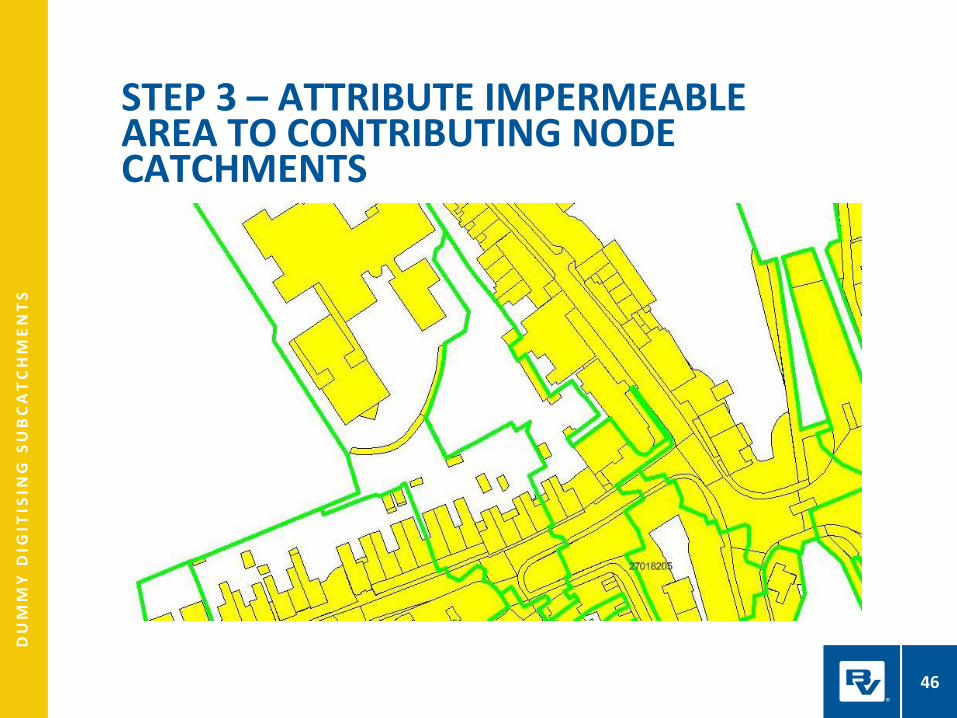
STEP 3 – ATTRIBUTE IMPERMEABLE AREA TO CONTRIBUTING NODE CATCHMENTS
46

STEP 3 – ADD STATUS CODE TO POLYGONS
47
DU
MM
Y D
IGIT
ISIN
G S
UB
CA
TC
HM
EN
TS
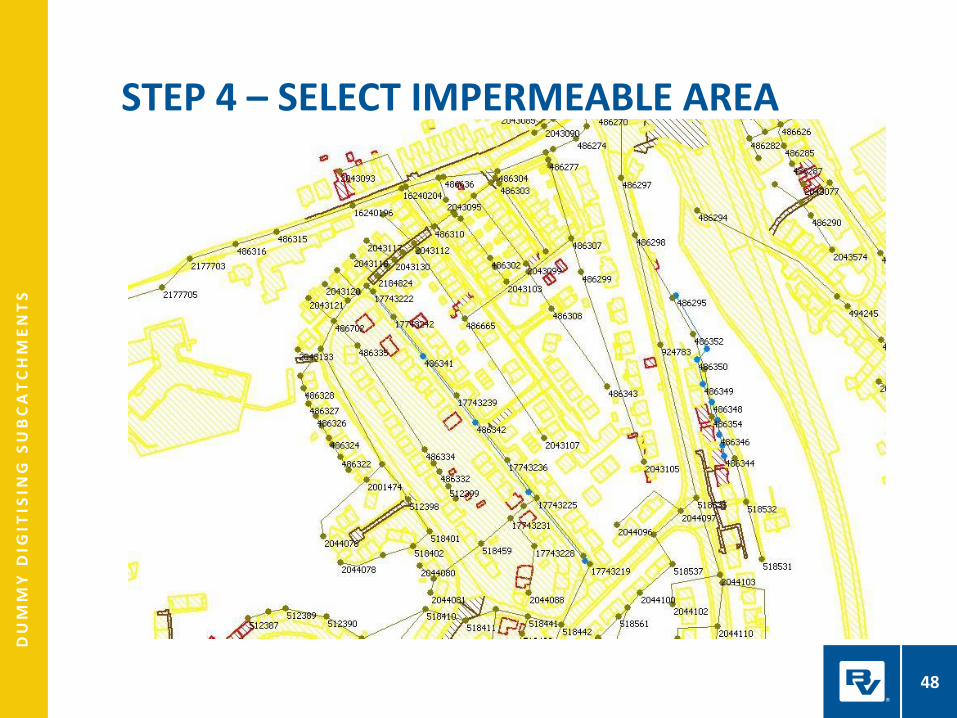
STEP 4 – SELECT IMPERMEABLE AREA
48
DU
MM
Y D
IGIT
ISIN
G S
UB
CA
TC
HM
EN
TS
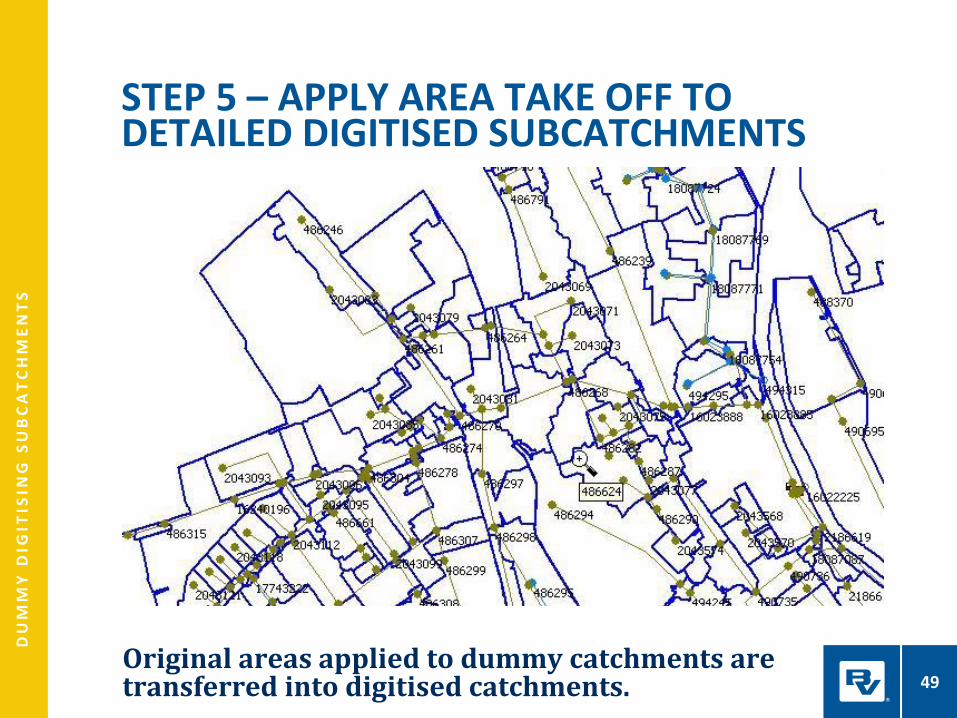
Original areas applied to dummy catchments are transferred into digitised catchments.
STEP 5 – APPLY AREA TAKE OFF TO DETAILED DIGITISED SUBCATCHMENTS
49
Other associated applications
• Automated process, and therefore quick.
• Attempts to identify impermeable area based on areas applied within dummy areas.
• Enables visual inspection of applied areas.
BENEFITS OF DIGITISING DUMMY AREAS
50

CONCLUSIONS
IWAN JONES INNOVYZE EUROPEAN USER CONFERENCE
51

CO
NC
LU
SIO
NS
Production of contributing areas is a process that can be automated.
• Time saving for modellers, time spent amending rather than creating.
• Better definition - Ratio of contributing nodes to modelled nodes 1:1.
• Promotes SWEAR opportunities.
• Next stage – Rolling ball/ Lidar?
CONCLUSION
52
CO
NC
LU
SIO
NS
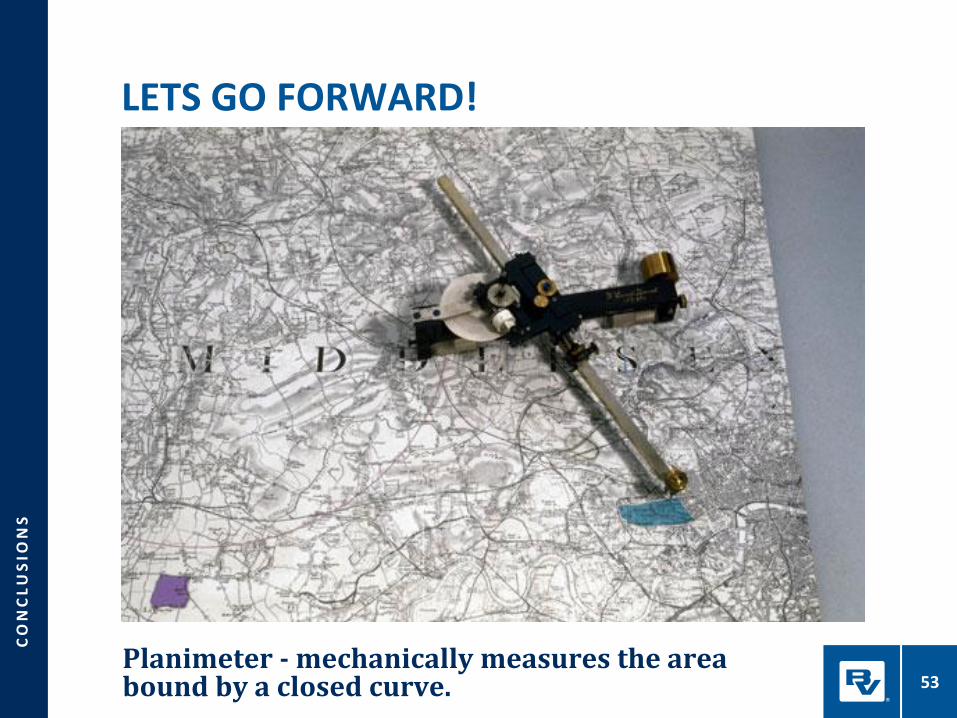
Planimeter - mechanically measures the area bound by a closed curve.
LETS GO FORWARD!
53

CO
NC
LU
SIO
NS
Planimeter - mechanically measures the area bound by a closed curve.
LETS GO FORWARD!
54
CO
NC
LU
SIO
NS
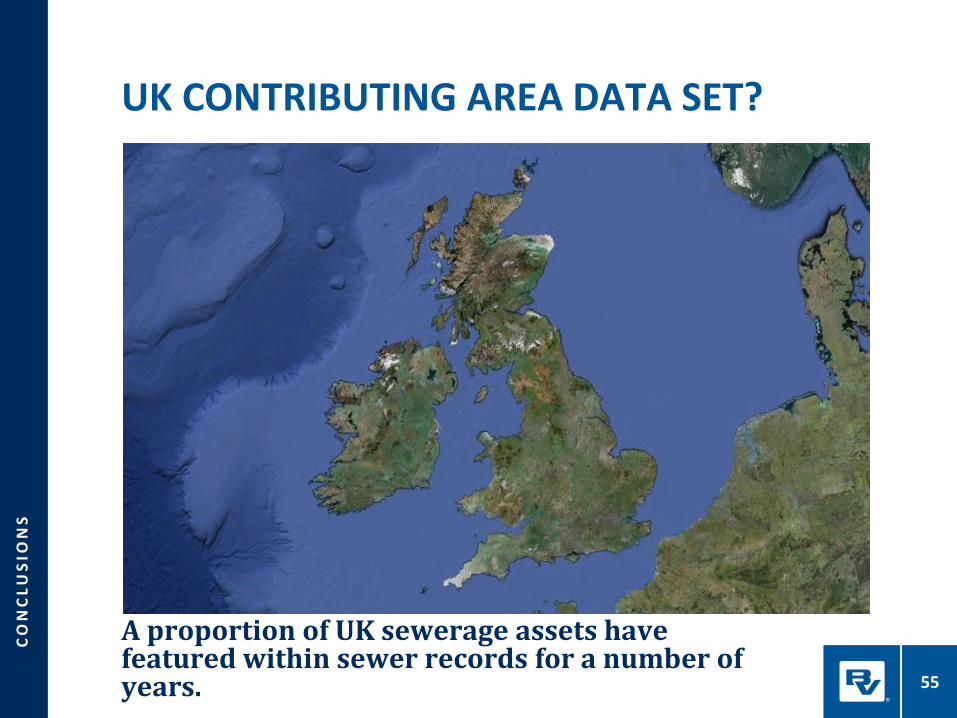
A proportion of UK sewerage assets have featured within sewer records for a number of years.
UK CONTRIBUTING AREA DATA SET?
55

56
ANY QUESTIONS?