automobile fuel economy and greenhouse gas emissions...
TRANSCRIPT

Automobile Fuel Economy and Greenhouse Gas Emissions Standards
G RA DY K I L L E E N A N D A R I K L E V I N SO N
Georgetown University, Washington DC, USAEmail: [email protected]
ABSTRACT In March 2017, EPA Administrator Scott Pruitt reopened an evaluation of the automotive fuel economy andgreenhouse gas emissions standards that the EPA had finalized in January. This case provides a history of the rules, alongwith assessments of their costs and benefits. It addresses numerous debates, including the environmental benefits ofthe rules, the role of electric vehicles, whether the standards should be less strict for larger cars, and tradeoffs betweenfuel economy and safety.
K E Y M E S S AG EThis case describes the history and details of American auto-mobile environmental and fuel economy standards, in suffi-cient detail for students to be able to have an informed dis-cussion as to their merits. Students should be able to articu-late the tradeoffs between the per-mile standards and alter-native regulations, describe the rebound effect and how thatrelates to the estimated costs and benefits of the standards,discuss the pros and cons of weaker standards for larger carsand trucks, and enumerate components of the benefits,including value of a statistical life, the social cost of carbon,accident risk, and congestion.
I N T R O D U C T I O NIn January, 2017, the U.S. Environmental ProtectionAgency (EPA) Administrator Gina McCarthy finalizedthe greenhouse gas (GHG) emissions rules for cars andlight trucks through 2025, saying they will save Americandrivers billions of dollars at the pump while protecting ourhealth and the environment [1]. Two months later, thenew EPA Administrator Scott Pruitt reversed that deci-sion: “These standards are costly for automakers and theAmerican people. We will work with our partners at DOTto take a fresh look to determine if this approach is real-istic. This thorough review will help ensure that thisnational program isgood for consumers and good for the
environment” [2]. By statute, that EPA review is due byApril 1, 2018.
C A S E E X A M I N AT I O N
BackgroundIn 1975, the U.S. Congress passed the Energy Policy andConservation Act, which gave the Department of Trans-portation (DOT), the authority to set and enforce fleetaverage miles per gallon (mpg) targets for new cars andlight trucks sold in the United States. The new regula-tions, called Corporate Average Fuel Economy (CAFE)standards, climbed quickly to their statutory maximum of27.5 mpg for cars, where they remained for the next twodecades [3]. Since 2011, the CAFE standards have beenmodified in several ways: they have increased in strin-gency, are relatively less strict for larger cars, and are trad-able among carmakers. Table 1 contains a timeline forimportant events in the development of the policy andthis case study.
The National Academy of Sciences and DOT StudyIn May 2000, the Senate asked the National Academy ofSciences (NAS) and DOT to analyze a potential CAFEincrease [4]. The resulting report concluded that morestringent CAFE standards were justified in order to com-bat dependence on imported oil and climate change asso-ciated with GHGs emitted by vehicles. The study foundthat car manufacturers were already introducing new effi-
ARTICLE CASE
Case Studies in the Environment, 2017, pps. 1–12. electronic ISSN 2473-9510. © 2017 by the Regents of the University of California. All rights reserved.Please direct all requests for permission to photocopy or reproduce article content through the University of California Press’s Reprints and Permissions webpage, www.ucpress.edu/journals.php?p=reprints. DOI: https://doi.org/10.1525/cse.2017.000380
1
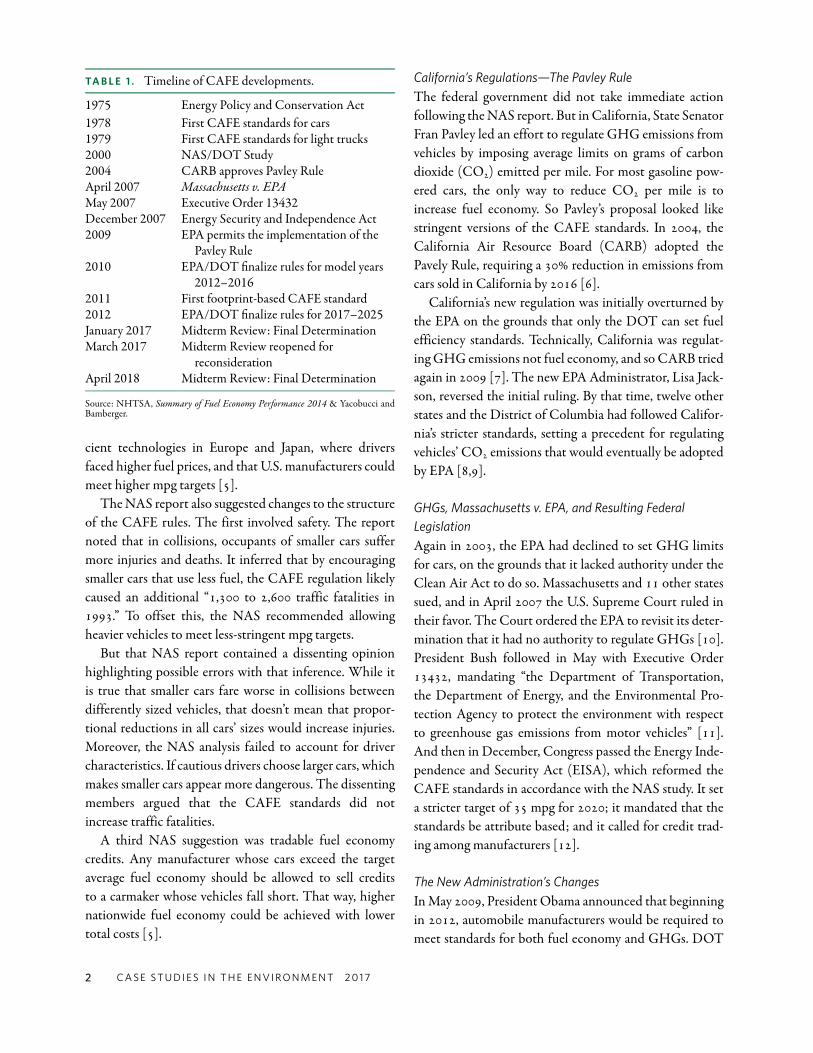
TA B L E 1 . Timeline of CAFE developments.
1975 Energy Policy and Conservation Act1978 First CAFE standards for cars1979 First CAFE standards for light trucks2000 NAS/DOT Study2004 CARB approves Pavley RuleApril 2007 Massachusetts v. EPAMay 2007 Executive Order 13432December 2007 Energy Security and Independence Act2009 EPA permits the implementation of the
Pavley Rule2010 EPA/DOT finalize rules for model years
2012–20162011 First footprint-based CAFE standard2012 EPA/DOT finalize rules for 2017–2025January 2017 Midterm Review: Final DeterminationMarch 2017 Midterm Review reopened for
reconsiderationApril 2018 Midterm Review: Final Determination
Source: NHTSA, Summary of Fuel Economy Performance 2014 & Yacobucci andBamberger.
cient technologies in Europe and Japan, where driversfaced higher fuel prices, and that U.S. manufacturers couldmeet higher mpg targets [5].
The NAS report also suggested changes to the structureof the CAFE rules. The first involved safety. The reportnoted that in collisions, occupants of smaller cars suffermore injuries and deaths. It inferred that by encouragingsmaller cars that use less fuel, the CAFE regulation likelycaused an additional “1,300 to 2,600 traffic fatalities in1993.” To offset this, the NAS recommended allowingheavier vehicles to meet less-stringent mpg targets.
But that NAS report contained a dissenting opinionhighlighting possible errors with that inference. While itis true that smaller cars fare worse in collisions betweendifferently sized vehicles, that doesn’t mean that propor-tional reductions in all cars’ sizes would increase injuries.Moreover, the NAS analysis failed to account for drivercharacteristics. If cautious drivers choose larger cars, whichmakes smaller cars appear more dangerous. The dissentingmembers argued that the CAFE standards did notincrease traffic fatalities.
A third NAS suggestion was tradable fuel economycredits. Any manufacturer whose cars exceed the targetaverage fuel economy should be allowed to sell creditsto a carmaker whose vehicles fall short. That way, highernationwide fuel economy could be achieved with lowertotal costs [5].
California’s Regulations—The Pavley RuleThe federal government did not take immediate actionfollowing the NAS report. But in California, State SenatorFran Pavley led an effort to regulate GHG emissions fromvehicles by imposing average limits on grams of carbondioxide (CO2) emitted per mile. For most gasoline pow-ered cars, the only way to reduce CO2 per mile is toincrease fuel economy. So Pavley’s proposal looked likestringent versions of the CAFE standards. In 2004, theCalifornia Air Resource Board (CARB) adopted thePavely Rule, requiring a 30% reduction in emissions fromcars sold in California by 2016 [6].
California’s new regulation was initially overturned bythe EPA on the grounds that only the DOT can set fuelefficiency standards. Technically, California was regulat-ing GHG emissions not fuel economy, and so CARB triedagain in 2009 [7]. The new EPA Administrator, Lisa Jack-son, reversed the initial ruling. By that time, twelve otherstates and the District of Columbia had followed Califor-nia’s stricter standards, setting a precedent for regulatingvehicles’ CO2 emissions that would eventually be adoptedby EPA [8,9].
GHGs, Massachusetts v. EPA, and Resulting FederalLegislationAgain in 2003, the EPA had declined to set GHG limitsfor cars, on the grounds that it lacked authority under theClean Air Act to do so. Massachusetts and 11 other statessued, and in April 2007 the U.S. Supreme Court ruled intheir favor. The Court ordered the EPA to revisit its deter-mination that it had no authority to regulate GHGs [10].President Bush followed in May with Executive Order13432, mandating “the Department of Transportation,the Department of Energy, and the Environmental Pro-tection Agency to protect the environment with respectto greenhouse gas emissions from motor vehicles” [11].And then in December, Congress passed the Energy Inde-pendence and Security Act (EISA), which reformed theCAFE standards in accordance with the NAS study. It seta stricter target of 35 mpg for 2020; it mandated that thestandards be attribute based; and it called for credit trad-ing among manufacturers [12].
The New Administration’s ChangesIn May 2009, President Obama announced that beginningin 2012, automobile manufacturers would be required tomeet standards for both fuel economy and GHGs. DOT
2 C A S E ST U D I E S I N T H E E N V I R O N M E N T 2 0 1 7

would continue overseeing fuel economy, while EPAwould monitor GHGs, requiring cooperation betweenthe agencies. To comply with EISA’s requirement that thenew standards be attribute based, the new rules set mpgtargets that differed based on vehicles’ sizes, as measuredby their footprints—the area under the vehicles’ four tires.Cars and trucks with larger footprints would have lowermpg targets. EPA and DOT finalized that rule in 2010, formodel years 2012–2016.
The switch to footprint-based standards was justifiedmainly by concerns about safety. The NAS report had foundthat the uniform CAFE standards encouraged sales of smallercars, and that in collisions, occupants of smaller cars sufferworse injuries. But as dissenters to the NAS report noted, it isnot clear whether that was the fault of the larger cars causingmore damage or the smaller cars sustaining more. A propor-tional reduction in all cars sizes might have no effect oninjuries, or even reduce them. As an alternative explanationfor the switch, some observers have noted that the originaluniform standards disadvantaged American carmakers, andthat the switch to footprint-based standards imposes a cost onimports equivalent to a tariff of several hundred dollars pervehicle [13].
The new target, a sales-weighted 35.5 mpg by 2016 forcars, was based on an unadjusted or “2-cycle” fuel econ-omy test. It weights city driving at 55% and highway dri-ving at 45%. The EPA also calculates an adjusted or“5-cycle” mpg estimate that factors in high speed driving,air conditioning, and cold temperatures. New car stickersreport this lower, adjusted mpg because it more accuratelycaptures real driving conditions. But the higher unad-justed numbers are used to set CAFE requirements, andthat’s what we report in all the tables and figures below.On average, the 2-cycle estimates are 25% larger than5-cycle measurements [14].
Immediately after issuing the rules for 2012–2016, EPAand DOT proposed fuel economy and GHG rules withincreasing stringency for the next nine model years,2017–2025 [15]. That quick turnaround left no time toevaluate the consequences of the earlier rule change. Thus,as a part of their 2017–2025 rulemaking, the Agenciespromised to conduct a “mid-term evaluation” of the regu-lations before finalizing standards for the last three modelyears, 2022–2025.
Figure 1 traces CAFE standards for cars from the pro-gram’s introduction through 2014. For context, the graph
F I G U R E 1 . Passenger vehicle CAFE standard and gasconsumption/capita. Sources: Calculations based on datafrom EIA, EPA, DOT, U.S. Census Bureau, U.S. Bureau ofEconomic Analysis, and the National Bureau of EconomicResearch (NBER). Notes: Vertical gray bands correspond toU.S. business cycle downturns. Real gas prices and total U.S.gas per capita are included as indexes, with 1978 values set to100.
includes the actual fleet-average mpg along with gas pricesand economic conditions.
How the Rules Work in PracticeBefore 2011, regulatory compliance had been based on thesales-weighted average fuel economy of each manufacturer’scar or light truck fleet sold in the United States. If that averagefell short of the target mpg, a fee of US$5.50 would beimposed for each tenth of an mpg below the target, multipliedby the number of vehicles sold [6]. Figure 3 plots total finespaid each year. Table 2 provides more detail [16].
Under the new footprint-based standards, manufactur-ers’ each have different targets based on the sales-weightedfootprints of their fleets [17]. The target for any particularcar depends on its footprint. While the formula used iscomplex, it can easily be seen graphically in Figure 21. Thethick segmented line plots the footprint-based formula. In2015, new small cars with footprints less than 41 squarefeet had to achieve 39 mpg. New large cars with footprints
1.1. The formula is the following: Target (mpg) = 1/ Min[ Max ( c * foot-print + d ,1/ a ),1/ b ] where a is the function’s upper limit (in mpg), b is thelower limit (in mpg), c is line’s slope, and d is an intercept added for correctscaling. The standard gets more stringent each year by raising a and b, andlowering d. For 2016 the parameters were a=41.09; b=30.96; c=0.0005308;d=0.002573.
Automobile fuel economy standards 3

TA B L E 2 . Real Civil Penalties 1978–2014 (1 =US$100,000 measured in 2007 dollars).
Manufacturers Imported fleet Domestic fleet
BMW 3,101.2 0.0Mercedes Benz 3,025.4 0.0Daimler–Chrysler a 1,165.9 0.0Volvo 901.2 0.0Jaguar 684.7 0.0Porsche 661.0 0.0Daimler 203.4 0.0Fiat 187.4 0.0Sterling 69.7 0.0Ferrari Maserati 53.5 0.0Peugeot 46.3 0.0Maserati 40.2 0.0Ferrari 27.8 0.0Small Luxury
Manufacturers b2.5 5.2
Chrysler a 0.9 0.0Ford 0.0 0.0General Motors 0.0 0.0Fleet share of
total fines99.95% 0.05%
Notes: Fines are expressed in real values based on the Consumer Price Index forAll Urban Consumers (1982–1984 dollars). (a) Chrysler merged with Daimlerfrom 1998–2007, forming Daimler–Chrysler during that period. (b) Includes PAS,Lotus, Saleen, Panoz, Vector, Aston Martin, Spyker, Callaway, Consulier, and SunInternational.Sources: CAFE Public Information Center, U.S. Bureau of Labor Statistics.
greater than 56 square feet only had to achieve 30 mpg. Cars in between were on a sliding scale. The dashed line at 36 mpg represents the overall average target. Each year the formula gets more stringent by raising the mpg required for cars of every size.
In Figure 2, each cross represents one make and model.Any model sold that is below the thick segmented foot-print line misses its mpg target, and to avoid fines, its salesmust be offset by other vehicles that exceed the standardfor their footprint.
As of 2014, the cumulative fines paid by all carmakerstotaled just under US$900 million. Over 99% of thesepenalties were charged to imported vehicles. Since theadoption of the credit trading program, manufacturershave paid far less in fines. Total annual fines paid are plot-ted in Figure 3 and totals by manufacturer are reported inTable 2.
F I G U R E 2 . 2015 CAFE target. Source: EPA Trends &NHTSA MY 2012-16 Final Rule. Note: Each cross representsa separate make and model.
F I G U R E 3 . Real fines paid (1 = US$100,000 measured using2007 values). Source: NHTSA, Summary of CAFE CivilPenalties Collected & BLS.
CO S T- B E N E F I T A N A LYS I SThe costs and benefits of the 2012–2016 CAFE rule aretabulated in Table 3. DOT considered two categories ofcosts: private and social. Private costs involve the increasedexpense of manufacturing more fuel efficient cars. Socialcosts include increased fatalities and injuries linked tolower vehicle weight, as well as congestion, accident risk,and pollution associated with the increased driving thatresults from better fuel economy. Some of these socialcosts are borne by drivers and their passengers; some areborne by other drivers and pedestrians. Fines were notincluded, as they represent transfer payments without anet burden to the United States.
4 C A S E ST U D I E S I N T H E E N V I R O N M E N T 2 0 1 7

TA B L E 3 . Costs and benefits of 2012-16 CAFE standards, 3% discount rate ($2007 millions).
MY2012
MY2013
MY2014
MY2015
MY2016
Sum2012−2016
Private costs and benefits (costs shown as negative benefit)Technology −5,902 −7,890 −10,512 −12,539 −14,903 −51,748Lifetime fuel expenditures 9,264 20,178 29,082 37,700 46,824 143,048Consumer surplus from additional driving 696 1,504 2,151 2,754 3,387 10,492Refueling time value 707 1,383 1,939 2,464 2,950 9,443
Net private benefits 4,765 15,175 22,660 30,379 38,258 111,235Social costs and benefit (costs shown as negative benefit)Congestion −447 −902 −1,282 −1,634 −2,000 −6,265Accidents −217 −430 −614 −778 −950 −2,989Noise −9 −17 −25 −32 −39 −122GHG reductions 921 2,025 2,940 3,840 4,804 14,530Petroleum market externalities 546 1,153 1,630 2,079 2,543 7,951Conventional air pollutants 475 947 1,310 1,646 1,991 6,369
Net social benefits 1,269 2,776 3,959 5,121 6,349 19,474Net total benefits 6,033 17,950 26,619 35,501 44,606 130,709Addendum: Net benefits at 7% 3,587 12,792 19,230 25,998 32,888 94,495
Source: Final Regulatory Impact Analysis: Corporate Average Fuel Economy for MY 2012-MY 2016 Passenger Cars and Light Trucks, 14, Table 12.
Private CostsDOT divided the private costs into two categories: direct,which refers to the per-vehicle technology costs; and indi-rect, which refers to the overhead costs associated withdeveloping and marketing these technologies for all cars(Table 4). The projected direct costs per passenger vehicleof the final rule vary from a low of US$29 (Toyota in MY2013) to US$1,884 (Ford in MY 2016), with an average of$695 per vehicle annually. Most of these involve techno-logical improvements such as weight reduction and engineefficiency.
For indirect costs, DOT simply scaled up the directcosts by a multiplier, ranging from 1.10 to 1.64 dependingon the complexity of the technology. The multipliers werederived from historical data on direct costs, revenues, andprofits, along with the fact that profits are just revenuesminus total costs (direct and indirect) [18]. The privatecosts of the CAFE standards were estimated to a total ofUS$51.7 billion (Table 3).
Social CostsDOT considered social costs to be those unrelated to thefuel-saving technologies. One such cost involves the“rebound effect.” Fuel efficiency makes driving less expen-sive. If drivers respond by driving more, this will increasecongestion, accidents, and noise. For passenger cars, DOTestimated these rebound costs at 5.4 cents per mile for
congestion, 2.3 cents per mile for accidents, and 0.1 centsper mile for noise. DOT combined these values with theprojected rebound effect to calculate their costs. Theresults are tabulated in Table 5.
A second social cost involves potentially reduced safety.The new footprint-based regulations were designed toreduce incentives to sell smaller cars, but still might resultin lighter cars. DOT modified the earlier NAS analysisto estimate the effect of vehicle weight on fatalities. Theresults are given in Table 6. The upper estimates presumethat manufacturers will reduce weight without compen-sating for associated safety reductions. The lower esti-mates assume that safety technologies offset lower vehicleweights. In the case of larger trucks, weight reductionsreduce projected fatalities suffered by other drivers.
DOT monetized fatalities at $6.1 million per life.That’s the agency standard value of a statistical life (VSL)of $5.8 million plus $ 0.3 million in medical care, insur-ance, and legal fees. The VSL is based on empirically esti-mated willingness to pay for risk reductions. For instance,if workers demand an extra US$1,000 per year to accept ajob that increases their annual risk of death by 1 in 10,000,the VSL would be US$10 million [19]. DOT multipliedthe VSL by 2.3 to include injury costs, based on past stud-ies, and then applied discount rates because accidents tocurrent model cars occur in future years. These costs aresummarized in Table 7.
Automobile fuel economy standards 5

TA B L E 4 . Direct cost per vehicle of CAFE regulations ($2007).
MY 2012 MY 2013 MY 2014 MY 2015 MY 2016
BMW 157 196 255 443 855Chrysler 794 1,043 1,129 1,270 1,358Daimler 160 198 564 944 1,252Ford 1,641 1,537 1,533 1,713 1,884GM 552 896 1,127 1,302 1,323Honda 33 98 205 273 456Hyundai 559 591 768 744 838Kia 110 144 177 235 277Mazda 632 656 799 854 923Mitsubishi 644 620 1,588 1,875 1,831Nissan 119 323 707 723 832Porsche 316 251 307 390 496Subaru 413 472 988 1,385 1,361Suzuki 242 625 779 794 1,005Tata 243 258 370 532 924Toyota 31 29 41 121 126Volkswagen 293 505 587 668 964Average 505 573 690 799 907
Source: Final Regulatory Impact Analysis: Corporate Average Fuel Economy for MY 2012-MY 2016 Passenger Cars and Light Trucks, 312, Table VII-2a.
TA B L E 5 . Passenger car social costs caused by the rebound effect (millions US$2007), 3% discount rate.
MY 2012 MY 2013 MY 2014 MY 2015 MY 2016 Total: 2012–2016
Passengers carsVMT Increase(billion miles) 6.8 13.9 19.5 25.4 30.8 96.4
Congestion costs 292 603 849 1,106 1,344 4,194Accident costs 133 268 379 492 595 1,868Noise costs 6 11 16 21 25 79Combined passenger cars and trucksCongestion costs 447 902 1,282 1,634 2,000 6,264Accident costs 217 430 614 778 950 2,989Noise costs 9 17 25 32 39 122
Source: Final Regulatory Impact Analysis: Corporate Average Fuel Economy for MY 2012-MY 2016 Passenger Cars and Light Trucks, 14 & 405–410.
Private BenefitsAs with costs, the CAFE standards have both private andsocial benefits; private benefits are fuel savings and socialbenefits are pollution reductions. Both depend on howmany new vehicles are purchased, changes in drivingbehavior due to the rebound effect, the implication ofdeclining U.S. consumption on global oil prices, and howthe DOT’s estimated mpg improvements translate intoactual efficiency.
DOT begins with manufacturers’ own sales projec-tions. They then factor in a rebound effect of 10%, whichis lower than historical estimates from the 1980s and1990s because household incomes have risen and demandfor driving becomes more inelastic as income grows [20].Finally, DOT subtracted 20% from its target mpg to con-vert the unadjusted 2-cycle values in the CAFE standardsto the more realistic 5-cycle mpg values that are closer toactual on-road fuel economy. Together, these calculations
6 C A S E ST U D I E S I N T H E E N V I R O N M E N T 2 0 1 7

TA B L E 6 . Estimated fatality change (%) per 100 lbs massreduction with constant footprint.
Lowerestimate (%)
Upperestimate (%)
Cars below 2,950 pounds 1.02 2.21Cars above 2,950 pounds 0.44 0.90Light trucks below 3,870
pounds0.41 0.17
Light trucks above 3,870pounds
−0.73 −1.90
Source: Final Regulatory Impact Analysis: Corporate Average Fuel Economy for MY2012-MY 2016 Passenger Cars and Light Trucks, 469.
yield the net change in gasoline use necessary to calculateprivate and social benefits.
Savings from reduced fuel consumption were deter-mined by multiplying each year’s fuel savings by expectedfuture gasoline prices. Gas tax savings were ignored, asthey correspond to reduced gas tax revenues. Externalitiesassociated with fuel consumption were added to includesocial costs. Table 3 includes a summary of the economicsavings tied to decreased fuel use. The sum of lifetime ben-efits is $143 billion.
Consumers also benefit from the increased driving theydo as a consequence of these reduced costs—the reboundeffect. DOT approximated the associated increase in con-sumer surplus: one half of the change in operating costsper mile times the change in miles traveled. And, drivers offuel efficient cars spend less time at gas stations. A CARBstudy determined that drivers typically purchase enoughgas to fill 55% of a tank [21]. Using an average occupancyof 1.6 passengers and the DOT-recommended hourly
value of travel time of US$24, DOT estimated the value ofthese time savings, reported in Table 3.
According to DOT’s calculations, the private benefitsof the CAFE standards exceed the private costs of the pro-gram by US$111 billion. That led some commenters towonder why the rules were necessary. DOT provided sev-eral responses. First, consumers may place less weight onfuture benefits than DOT chose to. If car buyers discountfuture fuel savings more, they’ll value fuel efficient carsless. Second, DOT speculated that consumers may be con-fused by so-called “mpg illusion”—the fact that gas sav-ings are linear in gallons per mile, but fuel economy isdescribed by its inverse, miles per gallon.
There are also several possible explanations from thesupplier side of the market. DOT argued that a combina-tion of monopolistic competition and information asym-metries between producers and consumers could lead tounderinvestment in fuel economy. Finally, manufacturersmay simply have underestimated the value that consumersplace on fuel efficiency.
Social BenefitsThe DOT considered three possible benefits related todecreased petroleum imports. First, reduced U.S. demandreduces global oil prices. A study conducted by Oak RidgeNational Laboratories (ORNL) in 2008 estimated thesebenefits to be about US$ 0.298/gallon in 2007 [22]. How-ever, DOT considers that to be a transfer among nations,not a net global gain, and hence excluded it from theircalculation of the benefits of CAFE. Second, oil importsdepend on military outlays to secure supply routes. DOTdid not believe that the CAFE standards would cause a
TA B L E 7. Projected change in traffic fatalities and resulting economic costs (upper estimates).
MY 2012 MY 2013 MY 2014 MY 2015 MY 2016
Estimated change in total fatalities over the fleet lifetimePassenger cars 11 17 57 100 134Light trucks −2 −3 −31 −77 −112Combined 9 14 26 24 22Economic costs (US$2007 millions)Passenger cars $126 $193 $658 $1,167 $1,557Light trucks −$19 −$29 −$344 −$859 −$1,259Combined $107 $164 $314 $307 $298
Note: Costs are monetized at DOT’s estimated cost per life of $6.1 million ($5.8 million for the value of a statistical life plus associated external medical, insurance, andlegal costs). This is multiplied by 2.3, to include injury costs, and discounted at 3%.Source: Final Regulatory Impact Analysis: Corporate Average Fuel Economy for MY 2012-MY 2016 Passenger Cars and Light Trucks, 547-551.
Automobile fuel economy standards 7

change in U.S. military policy and thus also excluded thesecalculations from its main cost-benefit analysis. Finally,reduced oil imports make the U.S. economy less vulnera-ble to volatile international petroleum prices. ORNL esti-mates these benefits at US$ 0.169 per gallon [22]. DOTdid include these benefits, and they are listed in Table 3as “Petroleum market externalities,” summing to just under$8 billion.
Burning a gallon of motor fuel produces about 20pounds of CO2 [23]. DOT multiplied the gasoline sav-ings from CAFE, times 20, times the social cost of carbon(SCC) as calculated by an interagency government panel[24]. The SCC is reported in Table 8 and the benefits arelisted in Table 3. These included changes in refinery emis-sions.
DOT also measured the net changes in local air pol-lutants such as carbon monoxide, nitrogen oxides, hydro-gen compounds, and sulfur dioxide created by increasedtravel and decreased fuel consumption per mile. Pollutioneffects caused by decreased gasoline use also includedchanges in refinery emissions.
T H E E PA’ S M O D E L Y E A R 2 0 1 2–2 0 1 6S TA N DA R D SWhile the DOT’s fuel economy program aims to increasemiles per gallon, the EPA’s program aims to reduce gramsof CO2 per mile. The two agencies coordinated, resultingin similarly stringent, footprint-based standards [25]. TheEPA standards are summarized at the top of Table 10,tightening from 288 grams per mile in 2012 to 250 gramsper mile in 2016.
EPA projected that the regulations would result inaggregate net benefits of around US$190 billion with a 3%discount rate or US$140 billion with a 7% discount rate.The values are generally consistent with DOT’s findings:the regulations are tied to a significant social gain. How-ever, EPA’s estimate of net benefits exceeds that of DOTby almost US$60 billion. The majority of this difference,about US$40 billion, is due to higher EPA projections forfuel savings. Such differences are a product of differingestimations as well as real distinctions between the regu-lations. Two of the notable differences involve air condi-tioning credits and electric vehicle (EV) incentives.
EPA’s cost-benefit analysis is summarized in Table 10.Social benefits were understated by a now-acknowledgederror that reduced the measured risk from imported oildependence. Despite that mistake, EPA concluded that
TA B L E 8 . CO2 costs $/additional metric ton.
Discount rate
5.0% 3.0% 2.5%
2010 4.7 21.4 35.12030 9.7 32.8 50.02050 15.7 44.9 65.0
Source: Final Regulatory Impact Analysis: Corporate Average Fuel Economy for MY2012-MY 2016 Passenger Cars and Light Trucks, 395, Table VIII-7.
TA B L E 9 . Cars and light-truck GHG breakdown by cause.
Emission sourcePercent of total car/truck
emissions
Tailpipe CO2 (no AC) 88.6Coolant leakage 5.1CO2 from AC (excluding
leakage)3.9
N2O 2.3CH4 0.2
Source: Final Rulemaking to Establish Light-Duty Vehicle Greenhouse Gas EmissionStandards and Corporate Average Fuel Economy Standards, 2-4, Table 2-1.
both social and private benefits exceeded the respectivecosts of the program. The regulations have a projected netgain of US$189 billion.
EV IncentivesOne key difference between the DOT and EPA regulationis that the EPA rule included provisions to spur develop-ment of EVs, plug-in hybrids, and fuel cell vehicles. TheEPA rule treats EVs as if they are responsible for no CO2
emissions and have sales weight of up to two, meaning thata manufacturer selling a single EV can receive credits forselling two zero-emission vehicles in their sales-weightedaverage grams of CO2 per mile [25]. EPA initially consid-ered eliminating the sales multiplier and capping the num-ber of vehicles considered to produce zero CO2. In theend, however, EPA included an unlimited sales multiplier.The agency estimated that double counting EVs as if theyproduced no CO2 would generate an additional 24.8 mil-lion metric tons of CO2 over these vehicles lifetimes.
T H E C A F E S TA N DA R D S G O I N G F O RWA R D
The 2017–2025 RulesUnder EISA, DOT has the statutory authority to set reg-ulations only in five-year increments. As a result, for thenew round of CAFE regulations governing model years
8 C A S E ST U D I E S I N T H E E N V I R O N M E N T 2 0 1 7

TA B L E 1 0 . EPA 2012-16 aggregate costs and benefits, 3% discount rate ($2007 million).
MY 2012 MY 2013 MY 2014 MY 2015 MY 2016 Sum 2012-16
Average emissions (CO2 g/mile) 288 281 275 263 250 n/aPrivate costs and benefits (costs shows as negative benefit)Technology costs −4,900 −8,000 −10,300 −12,700 −15,600 −51,500Pretax fuel savings 16,100 23,900 32,200 46,000 63,500 181,800Value of additional driving 2,400 3,400 4,400 6,000 7,900 24,000Reduced refueling time 1,100 1,600 2,100 3,000 4,000 11,900
Net private benefits 14,700 20,900 28,400 42,300 59,800 166,200Social costs and benefits (costs shown as negative benefit)Noise, accidents, and congestion −1,100 −1,600 −2,100 −2,900 −3,900 −11,600Oil market externalities* 900 1,400 1,800 2,500 3,500 10,100Conventional air pollutants 700 900 1,300 1,800 2,400 7,000GHGs 1,700 2,400 3,100 4,400 5,900 17,000
Net social benefits 2,200 3,100 4,100 5,800 7,900 22,500Net total benefits 16,900 24,000 32,500 48,100 67,700 188,700
Note: *Due to a calculation error in the rule, these benefits were roughly half of what they should have been.Source: Final Rulemaking to Establish Light-Duty Vehicle Greenhouse Gas Emission Standards and Corporate Average Fuel Economy Standards, 2-4, 8-26 to 8-28, Table 2-1,Table 8-14 and Table 8-16.
2017 through 2025, the agencies promised to conduct amidterm review of the program, with the option of mod-ifying the rules in light of any new information. The rulerequired that EPA finalizes that review and the CAFErules for model years 2022 through 2025, by April 1, 2018.
The 2017–2025 regulations retain the footprint-basedstandards, general methodologies for calculating costs andbenefits, and a similar pattern for increasing regulatorystringency [26].
Table 11 reports the projected mpg, fuel savings, costs,and benefits of DOT’s 2017–2025 rule. By 2025, theAgency projects a fleet-average mpg near 50 mpg and overUS$430 billion in net benefits. As with the earlier rule,DOT estimates that private savings from lower fuel expen-ditures—US$436 billion—will be responsible for themajority of the benefits.
Two noticeable differences from DOT’s earlier costbenefit analysis stand out. First, DOT used an updatedstudy on the relationship between vehicle weight reduc-tion and fatality risk. The new analysis shows that lightercars are less dangerous than previously thought. As aresult, the Agency projected an overall drop in fatalitiesdue to weight reductions associated with the rule. Second,DOT decreased the benefits from EVs due to their shorteruseful life spans.
The EPA’s analysis of the 2017–2025 rule for CO2
emissions uses a virtually identical methodology to theiranalysis of the 2012–2016 regulations (Table 12). As
before, both private and social benefits exceed costs, withprivate benefits dwarfing social ones. EPA projected netbenefits of US$429 billion. The DOT net benefits inTable 11 are slightly higher due to minor differences inassumptions about individual costs and benefits. In bothtables, the estimated private fuel savings (US$436 andUS$452 billion, respectively) are far greater than any otherfigures including aggregate costs [27].
The Midterm ReviewIn July 2016, the EPA, DOT, and CARB began thepromised midterm review by issuing an evaluation of thelast four years of the 2017–2025 rules. The Draft Techni-cal Assessment Report found that automakers are innovat-ing and adopting new technologies, and that the standardsfor model years 2022–2025 appear attainable with con-ventional gas-powered cars at lower costs than anticipatedin the original analysis [17]. The agencies circulated thereport for public comment. Then on November 30, 2016,EPA Administrator Gina McCarthy issued a “ProposedDetermination” that “based on her evaluation of techni-cal information available to her and significant input fromthe industry and other stakeholders, and in light of thefactors listed in the 2012 final rule establishing theMY2017-2025 standards, those standards remain appro-priate under section 202 (a) (1) of the Clean Air Act” [28].As part of that determination, EPA found that that thempg and CO2 targets were achievable “without extensive
Automobile fuel economy standards 9

TA B L E 1 1 . Summary of DOT’s 2017-25 rule, using a 3% discount rate and 2010 fleet.
MY 2017 MY 2025 Sum 2017–2025
Fleet-average mpg 35.1 48.7 –Fuel saved (bil. gal.) 4.8 29.0 161.2Private costs and benefits ($2007 million, costs shown as negative benefit)Technology implementation −3,539 −19,030 −108,327Maintenance −12 −1,239 −4,947Pretax fuel savings 12,498 80,175 436,469Consumer surplus from additional driving 1,193 7,391 40,184Value of saved refueling time 449 2,329 13,090
Net private benefits 10,589 69,627 376,469Social costs and benefits ($2007 million, costs shown as negative benefit)Congestion (rebound effect) −512 −3,126 −17,081Accidents (rebound effect) −236 −1,466 −8,010Noise (rebound effect) −10 −58 −318Decreased lifespan of EVs 0 −40 −87Petroleum market externalities 681 4,081 22,643Vehicle safety changes 9 54 18GHGs 1,195 8,433 44,577Conventional air pollutants 408 2,350 13,616
Net social benefits 1,535 10,229 55,357Net total benefits 12,121 79,857 431,655
Source: DOT, CPI and author calculations.
TA B L E 1 2 . EPA 2017–2025 costs and benefits, 3% discount rate ($2007 millions).
MY 2017 MY 2025 Sum 2017–2025
Private costs and benefits (costs shown as negative benefit)Technology −2,634 −31,946 −142,618Pretax fuel savings 6,694 101,734 451,624Increase in consumer surplus due to the rebound effect 951 12,931 59,424Reduced refueling time 260 4,069 17,780
Net private benefits 5,270 86,788 386,210Social costs and benefits (costs shown as negative benefit)Accidents, congestion and noise −521 −6,694 −30,710Oil market externalities 347 5,467 23,960GHG reductions 610 10,269 44,307Conventional air pollutants 70 1,150 5,191
Net social benefits 507 10,192 42,747Net total benefits 5,781 96,980 428,805
Source: EPA, Final Rulemaking for 2017–2025, 7-27 to 7-29.
use of strong hybrid or electric vehicles.” Public commentswere accepted until December 30, 2016.
In January 2017, over a year in advance of the deadline,this determination was finalized, concluding that “theMY2022-2025 standards remain appropriate under sec-tion 202 (a) (1) of the Clean Air Act,” and leaving the
originally proposed standards “entirely as they now exist,unaltered” [29].
On March 3, 2017, the new EPA Administrator ScottPruitt announced that the EPA and DOT would recon-sider the Final Determination as to whether the CAFEstandards for model years 2022–2025 are appropriate
1 0 C A S E ST U D I E S I N T H E E N V I R O N M E N T 2 0 1 7

[30]. As described by the schedule in the initial rulemak-ing, they intend to make a new Final Determination nolater than the original deadline on April 1, 2018.
C A S E S T U DY Q U E S T I O N S
1. What are the goals of the standards? Are there bet-ter ways to achieve these goals?
2. Discuss Figure 1. What do you think the relation-ship is between gas prices, economic conditions,CAFE standards, and the actual sales-weightedaverage fuel economy of new cars sold?
3. Why did the regulations switch from uniform tofootprint-based standards? Who were the winnersand losers from that switch?
4. Of what significance is the fact that, according tothe EPA, the private benefits exceed the costs ofthe regulations?
5. How should electric cars be treated by GHG emis-sions standards? How should they be treated byfuel economy standards?
6. If you were advising the EPA, how would you sug-gest the standards be changed for model years2022–2025?
F U N D I N GGrady Killeen’s work on this case was supported in partby funding from the Georgetown Environmental Initia-tive (environment.georgetown.edu).
CO M P E T I N G I N T E R E S T SThe authors have declared that no competing interestsexist.
R E F E R E N C E S1. US Environmental Protection Agency. News Release: Carbon
Pollution Standards for Cars and Light Trucks to RemainUnchanged Through 2025; 13 Jan 2017. Available: https://www.epa.gov/newsreleases/carbon-pollution-standards-cars-and-light-trucks-remain-unchanged-through-2025.
2. US Environmental Protection Agency. News Release:EPA to Reexamine Emission Standards for Cars and Light DutyTrucks – Model Years 2022-2025; 15 March 2017. Available:https://www.epa.gov/newsreleases/epa-reexamine-emission-standards-cars-and-light-duty-trucks-model-years-2022-2025.
3. NHTSA. Summary of Fuel Economy Performance(Department of Transportation: 2014), 3, Available:http://www.nhtsa.gov/staticfiles/rulemaking/pdf/cafe/Performance-summary-report-12152014-v2.pdf.
4. Transportation Research Board and National ResearchCouncil. Effectiveness and Impact of Corporate Average FuelEconomy (CAFE) Standards. Washington DC: NationalAcademy Press; 2002.
5. Committee on the Effectiveness and Impact of CorporateAverage Fuel Economy (CAFE) Standards. Effectiveness andImpact of Corporate Average Fuel Economy (CAFE) Standards.Washington, DC: National Academy Press; 2001. pp. 112–113.Available: http://www.nhtsa.gov/cars/rules/cafe/docs/162944_web.pdf.
6. Yacobucci B, Bamberger R. CRS Report for Congress:Automobile and Light Truck Fuel Economy, RL33413; May2008, p.13.
7. Air Resource Board. Clean Car Standards – Pavley,Assembly Bill 1493. California Environmental ProtectionAgency; 2013. Available: http://www.arb.ca.gov/cc/ccms/ccms.htm.
8. California Clean Cars Campaign. Other States; 2016.Available: http://www.calcleancars.org/other-states/http://www.calcleancars.org/learnMore-state.html.
9. NHTSA. Final Regulatory Impact Analysis: CorporateAverage Fuel Economy for MY 2012-MY 2016 Passenger Cars andLight Trucks. Washington, DC: DOT; March 2010, pp. 45–51.Available: http://www.nhtsa.gov/staticfiles/rulemaking/ pdf/cafe/CAFE_2012-2016_FRIA_04012010.pdf.
10. Massachusetts v. EPA, 127 S.Ct. 1438; 2007. Available:https://www.supremecourt.gov/opinions/06pdf/05-1120.pdf.
11. President George W. Bush, Executive Order 13432.(Washington, DC: FR 72, no. 94), 27712. Available:https://www.gpo.gov/fdsys/pkg/FR-2007-05-16/pdf/07-2462.pdf.
12. Energy Independence and Security Act of 2007. PublicLaw No. 110-140, 121 Stat. 1499-1503; 2007. Available:https://www.gpo.gov/fdsys/pkg/PLAW-110publ140/pdf/PLAW-110publ140.pdf.
13. Levinson A. Environmental Protectionism: The Case ofCAFE, working paper; Available:http://faculty.georgetown.edu/aml6/papers/EnvProtect.pdf
14. Environmental Protection Agency. Greenhouse GasEmission Standards for Light-Duty Vehicles (EPA-420-R-16-014,November 2016), 3, Available: https://nepis.epa.gov/Exe/ZyPDF.cgi/P100PKP1.PDF?Dockey=P100PKP1.PDF.
15. NHTSA. 2017 and Later Model Year Light-Duty VehicleGreenhouse Gas Emissions and Corporate Average Fuel EconomyStandards; Final Rule (40 CFR Parts 85, 86, and 600 & 49 CFRParts 523, 531, 533. et al. and 600). Washington, DC: DOT &EPA; 2012. Available: http://www.nhtsa.gov/staticfiles/rulemaking/pdf/cafe/2017-25_CAFE_Final_Rule.pdf.
16. CAFE Public Information Center. Summary of CAFECivil Penalties Collected (NHTSA: 2016). Available:
Automobile fuel economy standards 1 1

http://www.nhtsa.gov/CAFE_PIC/CAFE_PIC_Fines_LIVE.html.
17. EPA. Draft Technical Assessment Report: MidtermEvaluation of Light-Duty Vehicle Greenhouse Gas EmissionsStandards and Corporate Average Fuel Economy Standards forModel Years 2022-2025.EPA-420-D-16-900, July 2016.
18. DOT & EPA. Joint Technical Support Document:Rulemaking to Establish Light-Duty Vehicle Greenhouse GasEmission Standards and Corporate Average Fuel EconomyStandards (April 2010), 3-12 to 3-15.
19. Trottenberg P, Rivkin R. Memorandum: Guidance onTreatment of the Economic Value of a Statistical Life in USDepartment of Transportation Analyses. Washington, DC:DOT; 2015. Available: https://www.transportation.gov/regulations/economic-values-used-in-analysis.
20. Small KA, Van Dender K. Fuel efficiency and motorvehicle travel: the declining rebound effect. Energy J.2007;28(1): 25–51. Available: http://www.jstor.org/stable/41323081.
21. California Air Resource Board. Draft Assessment of theReal-World Impacts of Commingling California Phase 3Reformulated Gasoline (California Environmental ProtectionAgency: May 2002). Available: http://www.arb.ca.gov/regact/mtbepost/appf.PDF.
22. Leiby PN. Estimating the Energy Security Benefits ofReduced US Oil Imports. Oak Ridge: National Laboratory;2008. Available: https://cfpub.epa.gov/si/si_public_file_download.cfm?p_download_id=504469.
23. Energy Information Administration. How much carbondioxide is produced by burning gasoline and diesel fuel?Available: http://www.eia.gov/tools/faqs/faq.cfm?id=307&t=11.
24. Interagency Working Group on Social Cost of Carbon.Technical Support Document: Social Cost of Carbon forRegulatory Impact Analysis Under Executive Order 12866 (USGovernment: February 2010). Available:https://obamawhitehouse.archives.gov/sites/default/files/omb/inforeg/scc-tsd-final-july-2015.pdf.
25. EPA. Final Rulemaking to Establish Light-Duty VehicleGreenhouse Gas Emission Standards and Corporate AverageFuel Economy Standards (EPA-420-R-10-009: April 2010), 3-1to 3-2. Available: https://www.epa.gov/regulations-emissions-vehicles-and-engines/final-rule-model-year-2012-2016-light-duty-vehicle.
26. EPA and NHTSA. 2017 and Later Model Year Light-Duty Vehicle Greenhouse Gas Emissions and CorporateAverage Fuel Economy Standards; Final Rule (40 CFR Parts 85,86, and 600: 10-1502012), 62627-62628; 2012.
27. EPA. Regulatory Impact Analysis: Final Rulemaking for2017-2025 Light-Duty Vehicle Greenhouse Gas EmissionStandards and Corporate Average Fuel Economy Standards(August 2012), 7-27 to 7-29.
28. EPA. Proposed Determination on the Appropriateness ofthe Model Year 2022-2025 Light-Duty Vehicle Greenhouse GasEmissions Standards under the MidtermEvaluation,EPA-420-R-16-020. November 2016.
29. Final Determination on the Appropriateness of the Modelyear 2022-25 Light-Duty Vehicle GHG Emissions StandardsEPA-420-R-17-001 January 2017. Available:https://www.epa.gov/regulations-emissions-vehicles-and-engines/midterm-evaluation-light-duty-vehicle-greenhouse-gas
30. Federal Register Volume 82, Number 54, Wednesday,March 22, 2017.
1 2 C A S E ST U D I E S I N T H E E N V I R O N M E N T 2 0 1 7