automobile pollution control in brazil - pubs.iied.orgpubs.iied.org/pdfs/8137iied.pdf · automobile...
TRANSCRIPT
Automobile Pollution Controlin Brazil
Claudio Ferraz and Ronaldo Seroa da Motta
Working Paper No 29
June 2000
Jointly published by the International Institute for Environment and Development, London andthe Institute for Environmental Studies, Amsterdam.
The authors
Ronaldo Seroa da Motta is Coordinator of Environmental Studies at the Research Institute for AppliedEconomics (IPEA), and Professor at the Universidade Santa Ursula, Brazil. Claudio Ferraz is aResearcher with Environmental Studies at IPEA. They can be reached at:
IPEAAv. Presidente Antonio Carlos 5117 andarRio de Janeiro, RJ20020 – 010Brazil
Tel: 55-21-8048184 (R. Seroa da Motta) 55 21 804 8130 (C. Ferraz)F: 55-21-8048115email: [email protected] email: [email protected]
The programme of Collaborative Research in the Economics of Environment and Development(CREED) was established in 1993 as a joint initiative of the International Institute for Environment andDevelopment (IIED), London, and the Institute for Environmental Studies (IVM), Amsterdam. TheSecretariat for CREED is based at IIED in London. A Steering Committee is responsible for overallmanagement and coordination of the CREED Programme.
Environmental Economics Programme, IIED
IIED is an independent, non-profit organisation which seeks to promote sustainable patterns of worlddevelopment through research, training, policy studies, consensus building and public information. TheEnvironmental Economics Programme is one of seven major programmes of IIED; it conducts economicresearch and policy analysis for improved management of natural resources and sustainable economicgrowth in the developing world.
Environmental Economics ProgrammeIIED, 3 Endsleigh StreetLondon WC1H 0DD, UKTel +44 (0)171 388 2117; Fax +44 (0)171 388 2826e-mail: [email protected]
Institute for Environmental Studies, (IVM)
IVM is a non-profit research institute, based at Vrije Universiteit, Amsterdam. The Institute's primaryobjective is to carry out multi- and interdisciplinary research on environmental issues, based on cross-fertilisation of monodisciplinary sciences. Environment and the Third World is one of eight major IVMresearch programmes.
IVM, Vrije UniversiteitDe Boelelaan 11151081 HV AmsterdamThe NetherlandsTel: +31 20 444 9555; Fax: +31 20 444 9553e-mail:[email protected]
CREED Steering Committee members include:
Prof Johannes Opschoor, Institute for Social Studies, The Netherlands (Chair)Prof Gopal Kadekodi, Centre for Multidisciplinary Development Research, IndiaDr Ronaldo Seroa da Motta, IPEA, BrazilDr Mohamud Jama, Institute for Development Studies, KenyaDr Anantha Duraiappah, IVM, The NetherlandsProf Harmen Verbruggen, IVM, The NetherlandsJoshua Bishop, IIED, UKMaryanne Grieg-Gran, IIED, UK

Acknowledgements
This paper is part of the project “Effects of vehicle characteristic taxes on pollution control in Braziland Costa Rica”. Financial support from the Dutch Ministry of Foreign Affairs under theCollaborative Research on the Economics of Environment and Development (CREED) programme isgratefully acknowledged. We would also like to thank Volf Steinbaun, Elcio Farah, Renato Linke andHomero de Carvalho at the CETESB for making the emissions data available and Eduardo Fiuza forhis help with the database organisation. Additionally, Cicero Pimenteira, Alexia Rodrigues, ViniciusBueno, Bruno Machado and Sabrina Azamor provided excellent research assistance. We also thankNick Johnstone for helpful discussions and comments.

Abstract
Air pollution concentrations have been rapidly increasing in the major urban areas of Brazil caused mainly bythe increasing use of vehicles. Policies to control car emissions in Brazil have relied basically on mandatoryemission standards and subsidies for specific cleaner technology resulting in substantial decrease of car emissionrates. Nevertheless, taxes on car sales, differentiated by vehicles’ size and fuel, have also influenced caremission patterns. This paper analyses the compliance trend of the Brazilian fleet with environmental standardsbetween 1992 and 1997. We find that larger automobiles had the fastest compliance schedule while popularmodels adjusted very slowly. Also gasoline-fuelled models had a faster adjustment pattern than ethanol cars.Additionally, we analyse the current relationship between pollution emissions and car characteristics in order toorient policy formulation. We find a positive relationship between emissions rates and horse power, concludingthat although the current value-added sale car tax is not environmental harmful, a tax differentiating clean fromdirty models, within each tax bracket, could create substantial incentives for emission control in the future.
Contents
Introduction 1
Environmental Regulations, Fiscal Policies and the Brazilian Car Market 5The Vehicle Air Pollution Control programme (PROCONVE) 5Car tax structures 5
Car Emissions and Characteristcs 8
Econometric Reuslts 10The evolution of emissions compliance, 1992-97 10Emissions and characteristics in the 1997 model 15
Concluding Remarks 17
Bibliography 19
CREED Working Paper Series No 29 1
Introduction
Urban air pollution is a serious environmental problem in developed as well as in mostdeveloping countries. In the case of Brazil, air pollution concentrations have been rapidlyincreasing in the major urban areas over the last decades. As elsewhere, this expansion hasbeen caused mainly by the increasing use of vehicles. Today, emissions from vehicles are themajor source of air pollution in Brazil’s largest cities. In 1997 in São Paulo, for example,private cars were responsible for approximately 75% of carbon monoxide (CO), 73% ofhydrocarbons (HC), 23% of nitrogen oxides (NOx) and 10% particulate matter (PM)1.
Costs associated with high air pollution concentrations in large cities are known to beimportant. Human health costs predominate, and range from eye irritations to respiratoryproblems and increasing cancer rates, all of which induce direct and indirect costs to society2.
Seroa da Motta and Fernandes Mendes (1995) estimate a reduction of 7% in the mortalityrate from respiratory diseases in São Paulo, if particulate levels were reduced to minimumlegal standards. They also estimate the health costs associated with concentration levels inexcess of air pollution standards, finding a loss of approximately US$ 700 million per year inthe early 1990s.
Even when consumers can perceive individual emission damage, they are unable to reducealone the aggregate social emission costs. Consequently, their preferences will usually notconsider fuel and car cleanliness. In the presence of this negative externality, environmentalregulation is required.
The economic literature is replete with identifying market-based instruments (MBIs), such astaxes and tradable permits, as more efficient ways to achieve environmental goals thanemission and technological standards, commonly referred to as command-and-controlmechanisms (C&C). C&C instruments are based on standards which all users are forced tocomply with in order to reach the minimum desirable level of pollution. In the case of caremissions, all automobiles and fuels are sold according to certain mandatory technological oremission standard targets. If enforcement is strong, non-compliance would mean no sale andusers would either comply or leave the market. There are no trade-off schemes amongproducers or consumers to allow for cost minimisation strategies. Such lack of flexibilityimpedes cost-effectiveness gains.
Alternatively, by introducing an environmental tax equivalent to the social marginal cost ofpollution emission (Pigovian tax), regulators force consumers to internalise their contributionto the aggregate social costs. In doing so, society reaches the optimal level of pollution whenthe marginal cost of pollution damages equals the marginal cost of pollution control.However, such optimal taxation requires the measurement of emissions from every singleemission source and the determination of the marginal damage cost of one unit of emission.
1 See CETESB (1998). Also in São Paulo, according to CETESB (1998), the air quality is considered to bebelow the human health minimum standard at least 25% of the days in a year.2 See Watkins (1991) and Maddison et al. (1996) for further analysis of health effects associated with vehiclesource air pollution.
CREED Working Paper Series No 29 2
If we were able to measure emissions by individual cars, the first best incentive option for caremission control would be the imposition of a Pigovian tax on each source according to itsmarginal contribution to air pollution damages. This would allow flexibility for car owners inthe choice of emission reduction strategies. However, such first best approaches can incurhigh administrative cost. As put by Innes (1996), even if tamper-resistant emission-measurement from tailpipes were available at reasonable costs, such devices do not detectimportant non-tailpipe pollution and, therefore, high costly reliable periodic car monitoringwould be required. Consequently, the application of car emission control policies would haveto reckon on regimes which do not require direct emission monitoring.
When emission output measurements are difficult, the economic literature on MBIs proposesinstead that regulators may apply first best taxes on the use of inputs and products which arerelated to emissions. For car emissions, fuel and automobile taxes are good candidates forthis option. Fullerton and West (1999 - hereafter FW), have derived a set of fuel and caroptimal taxes which are able to mimic, at least in theory, the unavailable tax on emissions. Inorder to derive a closed form solution, FW consider emissions per gallon (EPG) and milesper gallon (MPG) only to depend on si, the size of the car. Under these specific technologicalconditions, FW propose a closed form solution for a fuel tax (tg) differing according tocharacteristics of the vehicle at the pump.
The owner of car model i, would pay a tax given by
)()( iigi sMPGsEPMt µ=where µ, represents the marginal social cost of a unit of emissions and EPG and MPGrepresent car features. More generally, we could specify such a tax to be a function of othercar characteristics which are likely to affect EPG and MPG, as well as emission features ofdifferent fuel types.
Admitting regulators know the mileage consumption and useful life of each car model iowned by consumer j, an equivalent car sale tax would consist of the present value of theabove fuel tax. This car tax could be, instead, applied periodically for licensing purposes, andits value would be set by monitored mileage at that period.
Both fuel and car taxes would make consumers perceive the emission-increasing cost of extramileage consumption and recognise the emission-reducing benefits of fuel cleanness andeconomy as well as car pollution abatement devices.
Note that under this approach regulators must know the marginal social cost of a unit ofemissions (µ). Moreover, this parameter will be location-specific since marginal damages aredependant on total pollution charges and the environment assimilative capacity which, inturn, varies according to atmospheric variables (e.g., wind speed, temperature, humidity, etc).
Suppose, however, that regulators know µ and location-specific taxes can be applied.Although the fuel tax is simpler than the equivalent car tax, it would still require car featuresto be identifiable at the gas station. Again such an approach is likely to generate highadministrative costs in order to be feasible and reliable. Therefore, if we cannot mimic thefirst best solution with alternative taxation schemes, we would have to rely on second bestmarket instruments. The ideal second best mechanism should create price incentives for
CREED Working Paper Series No 29 3
consumers to drive fewer miles and, at the same time, buy cleaner cars. While the formerdecision is related to fuel use, the latter works through car price differentiation3.A car tax based on the estimation of a vehicle’s annual emission is proposed by Eskeland(1994) and Sevigny (1998). Emission rates per mile would be estimated based on carcharacteristics, and miles travelled could be measured by the change in the vehicle’sodometer in a given year4. What makes this proposal different from the first best alternativeproposed by FW is the lack of knowledge on each specific car’s EPM. While FW’s modelassumes that it is possible to estimate individual EPM for all car models in order to charge anemission gas tax at the fuel pump, Sevigny (1998) only expects to be able to derive averageEPM figures. Again, implementation may prove to be costly for the case of odometermeasurement procedures.
An alternative constrained optimal regulation is proposed by Innes (1996). A combination oftaxes on gasoline and automobiles could be combined with a government fuel contentstandard. The fuel tax would be independent of individual automobiles, but the car tax woulddepend on auto characteristics (eg, power, size, style), fuel economy and abatement features.Since mileage demand is highly correlated with automobile features, the automobile taxwould also affect miles driven. Moreover, additional incentives could be created. In adynamic setting, a car sale tax could be partially returned to consumers as incentive forscrapping older models according to the abbreviation of the car’s useful life5.
For the previous mechanism, a subsidy for pollution control equipment is relatively simple todefine since control equipment such as catalytic converters and filters are directly observable.The same applies for fuel, insofar as that emissions will rise more or less proportionately withfuel consumption for a given vehicle and given driving conditions6. On the other hand, a taxon car characteristics requires a periodic identification of the relationship between carcharacteristics and emissions.
In general, market based instruments are difficult to implement and regulators wishing toapply them would have to combine tax schemes with technological and emission standards.This approach does not maximise social welfare by setting optimal levels of pollution.Rather, the aim is to use pricing mechanisms to increase cost-effectiveness in achieving acertain standard compliance regarded as desirable7. That is, once environmental goals aredefined, economic instruments can reduce the social costs of achieving them. The rationale israther simple. Since users face different marginal control cost schedules, pollution taxesvarying directly with users’ pollution levels will make users adopt control levels up to thepoint where pollution control costs are equal, at the margin, to non-compliance tax costs.Taxes are set at certain level which will make the maximised individual decisions, inaggregate, to meet the desirable standards. Society will first start to control from the least-cost users which will reduce total control cost. In this case, individual emission standards are
3 See Johnstone and Karousakis (1998) for a review.4 This tax would take the form of Annual tax =, VMTcEPMbEPMaEPM *)( 321 ++ where EPM is the emissionper mile, VMT is the vehicle mile traveled and a, b, c are tax rates set to induce the desired level of abatementfor each pollutant.5 Road fees, varying with air pollution concentration levels and car’s characteristics, are also regarded aspossible second best options, although they may induce longer travel distances to avoid charges.6 See Seroa da Motta and Mendes (1996) for an analysis of fuel taxation in Brazil.7 Desirable here may mean either one standard politically acceptable or targeted at one specific damage. In thecase of urban pollution, human health damages are usually targeted.
CREED Working Paper Series No 29 4
dropped out and regulators become only concerned with ambient standards which reflect totalemissions.
Instead of setting prices, regulators may distribute pollution permits to users, as a share of thedesired total emission targets and allow these permits to be traded among users. Thismechanism creates incentives for achieving the same marginal cost equalising outcome giventhe competitive structure of the prices emerging from the permit market transactions.
Apart from cost-effectiveness benefits, such economic instruments can generate revenue. Inthe case of pricing mechanisms, note that users with non-compliance will face the respectivetax costs and thereby generate a tax revenue. In the case of tradable permits, they can bedistributed through auctioning mechanisms8.
Car emission control policy in Brazil is basically defined on mandatory emission standards.Since 1988 the Brazilian governmental authorities have implemented a regulatory mechanismcalled The Vehicle Air Pollution Control Programme (PROCONVE), establishing maximumpollution emission standards (in grams per kilometer) for new vehicles entering the market.The program has been very successful in reducing emissions per kilometer for new carmodels. Nevertheless, as with any command and control approach, it is inflexible andincreases the costs of reducing pollution.
This paper analyses the evolution of average emissions in the Brazilian fleet between 1992and 1997 (the final compliance date). Together with environmental policy, car tax structureshave been differentiated by car characteristics such as size and fuel use, in order toaccommodate sectoral policy aims. Therefore, government initiatives have affected the carmarket and consequently the emission pattern of new automobiles. We try to relate thesesectoral policies with the average emission compliance trends comparing the averageemission changes across car sizes and fuel types. Additionally, we analyse the presentrelationship between pollution emissions and car characteristics in order to orient currentpolicy formulation. Our analysis is based on emission data recorded from laboratory testsundertaken by the São Paulo Environmental Agency (CETESB) which electronicallymeasures emissions of HC, CO and NOx for each car model along with the model’scharacteristics.
The rest of this paper is structured as follows: the next section presents the Brazilianregulatory framework for car pollution control and the car tax structure. This is followed by adescription of our database and model characteristics. Section 4 presents the econometricresults; concluding remarks and policy recommendations are discussed in the final section.
8 Cost-effectiveness of permits does not depend on permit auctioning. Freely distributed permits have differentequity effects, although they are equally cost-effective if transactions costs are assumed not constrained.
CREED Working Paper Series No 29 5
Environmental Regulation, Fiscal Policiesand the Brazilian Car Market
Recently, three different policies have shaped the size, the structure and the composition ofthe car fleet in Brazil: the ethanol programme, the sale car tax changes and the environmentalregulation. Moreover, all of them had substantially affected the pattern of pollutionemissions9.
The Vehicle Air Pollution Control programme (PROCONVE)
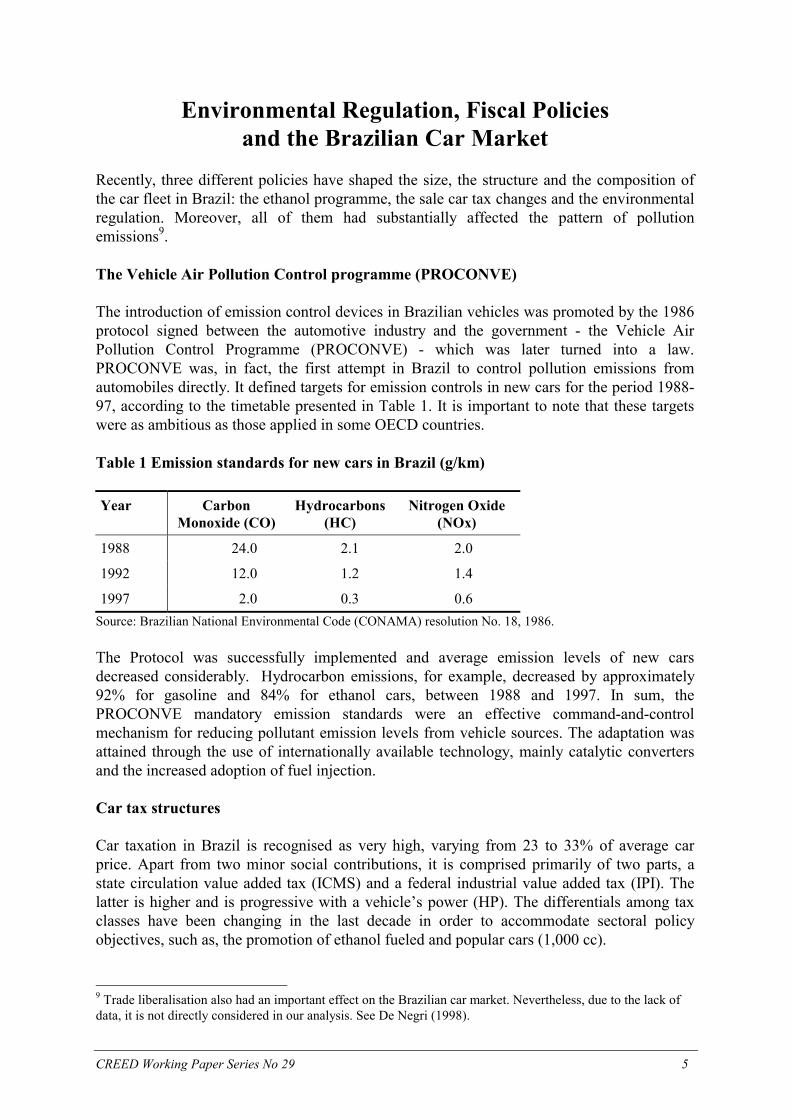
The introduction of emission control devices in Brazilian vehicles was promoted by the 1986protocol signed between the automotive industry and the government - the Vehicle AirPollution Control Programme (PROCONVE) - which was later turned into a law.PROCONVE was, in fact, the first attempt in Brazil to control pollution emissions fromautomobiles directly. It defined targets for emission controls in new cars for the period 1988-97, according to the timetable presented in Table 1. It is important to note that these targetswere as ambitious as those applied in some OECD countries.
Table 1 Emission standards for new cars in Brazil (g/km)
Year CarbonMonoxide (CO)
Hydrocarbons(HC)
Nitrogen Oxide(NOx)
1988 24.0 2.1 2.0
1992 12.0 1.2 1.4
1997 2.0 0.3 0.6Source: Brazilian National Environmental Code (CONAMA) resolution No. 18, 1986.
The Protocol was successfully implemented and average emission levels of new carsdecreased considerably. Hydrocarbon emissions, for example, decreased by approximately92% for gasoline and 84% for ethanol cars, between 1988 and 1997. In sum, thePROCONVE mandatory emission standards were an effective command-and-controlmechanism for reducing pollutant emission levels from vehicle sources. The adaptation wasattained through the use of internationally available technology, mainly catalytic convertersand the increased adoption of fuel injection.
Car tax structures
Car taxation in Brazil is recognised as very high, varying from 23 to 33% of average carprice. Apart from two minor social contributions, it is comprised primarily of two parts, astate circulation value added tax (ICMS) and a federal industrial value added tax (IPI). Thelatter is higher and is progressive with a vehicle’s power (HP). The differentials among taxclasses have been changing in the last decade in order to accommodate sectoral policyobjectives, such as, the promotion of ethanol fueled and popular cars (1,000 cc).
9 Trade liberalisation also had an important effect on the Brazilian car market. Nevertheless, due to the lack ofdata, it is not directly considered in our analysis. See De Negri (1998).
CREED Working Paper Series No 29 6
Tax rate differential by fuel type cars
The first major factor contributing to the reduction of vehicle emissions in Brazil occurredindirectly as a response to the first oil crisis in the 1970s with the addition of ethanol togasoline through the Brazilian National Alcohol Programme (PROALCOOL). Its mainenvironmental benefit was the complete removal of lead from gasoline. After the second oilcrisis, Brazil initiated a further phase of PROALCOOL, aimed at the sale of pure ethanol-fueled cars. Pure ethanol-fueled vehicles were, at that time, relatively cleaner in terms ofcertain pollutants than gasoline-fueled vehicles. Nevertheless, they require a highervolumetric fuel consumption per mile travelled10.
To promote the sale of pure ethanol cars, the government relied on very aggressive fiscal andcredit demand and supply-side incentives. Ethanol fuel prices were set favourably relative togasoline (reducing its relative price) and ethanol cars were also sold with lower sale tax ratesand better financing schemes.
In the late 1980s, the continuous decline in international oil prices and the severe publicdeficits faced by the Brazilian economy caused a cut in ethanol subsidy mechanisms. The fuelparity was substantially reduced and subsidies for producers were also dramatically cut.Ethanol car sales declined dramatically and almost disappeared at the beginning of the 1990s.This process suggests that the tax rate differential was not sufficient to avoid the dramaticdrop in ethanol car sales. Relative fuel prices and availability, which directly affect car uselevels, played a far more important role for consumer’s choice11.
Finally in 1991, after some periods of fluctuation in the ethanol content of the gasoholmixture, a law was passed stating that the gasohol mixture had to be kept at the constant 22%level12, changed to 24% later on. Gasohol then became the main source of ethanol demand,particularly in recent years when fuel consumption peaked after the macroeconomicstabilisation. The stability of the mixture used for automobile fuel allowed the automotiveindustry to accelerate the introduction of technological innovations, particularly those for caremission control.
Tax rate differential by engine size
Car taxation is also used in Brazil to achieve sectoral policy objectives. Value added taxeswere reduced for cars with lower horsepower (cheaper automobiles) in order to promoteproduction and employment. This differentiation has had significant environmentalconsequences.
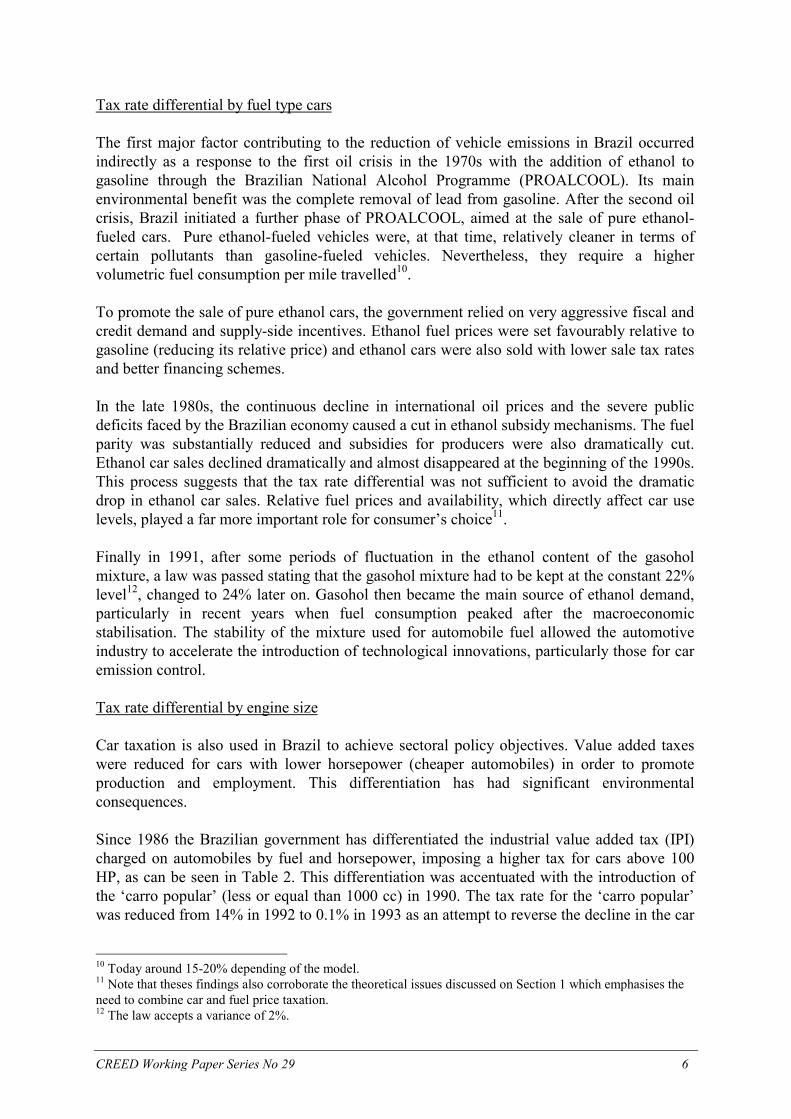
Since 1986 the Brazilian government has differentiated the industrial value added tax (IPI)charged on automobiles by fuel and horsepower, imposing a higher tax for cars above 100HP, as can be seen in Table 2. This differentiation was accentuated with the introduction ofthe ‘carro popular’ (less or equal than 1000 cc) in 1990. The tax rate for the ‘carro popular’was reduced from 14% in 1992 to 0.1% in 1993 as an attempt to reverse the decline in the car
10 Today around 15-20% depending of the model.11 Note that theses findings also corroborate the theoretical issues discussed on Section 1 which emphasises theneed to combine car and fuel price taxation.12 The law accepts a variance of 2%.
CREED Working Paper Series No 29 7
market13. It was further increased to 8% in 1995 and to 13% in 1997. As can be seen, thesetax reductions are more substantial than those offered for ethanol cars.
Table 2 Evolution of the IPI for automobiles in Brazil (%)
Year Up to1000cccarro
popular
More than1000cc, but up
to 100 HPgasoline
More than 1000cc,but up to 100HP
ethanol
More than1000cc, over
100 HPgasoline
More than1000cc,over 100 Hp
ethanol
1986 - 100 92 107 1001987 - 45 40 50 451988 - 45 40 50 451989 - 33 28 38 331990 20 37 32 42 371991 20 37 32 42 371992 14 31 26 36 311993 0.1 25 20 30 251994 0.1 25 20 30 251995 8 25 20 30 251996 8 25 20 30 251997a 13 30 25 35 30
Source: Anfavea (1999), a tax implemented in November, 1997.
In order to subsidise environmental compliance to the 1992 PROCONVE targets,government offered a reduction of 5% on the industrial value added tax levels for some largecars (between 100 and 127 HP) which adopted fuel injection devices from 1992 onwards.This incentive worked well and from 1992 onwards all models over 100 HP had alreadyadopted fuel injection devices. It is important to note that the electronic injection subsidyworked equivalently to a sale tax on dirtiest large cars which would have not adopt thisemission control device.
13 In this case, the state value-added tax (ICMS) was also differentiated for ‘popular cars’ for certain periods.14 Since we are interested in local pollution, we chosen not to use data on CO2 emissions which are verycontroversial.
CREED Working Paper Series No 29 8
Car Emissions and Characteristics
Emissions and characteristics data have been used to analyse pollution regulations and thepossibility of implementing an environmental vehicle characteristic tax. White (1982) andKahn (1996) use cross-section data to investigate the evolution of manufacturers' compliancewith pollution regulation in the United States. Under a different approach, Johnstone andKarousakis (1998) use emissions and characteristics to study the possibility of implementinga vehicle characteristic tax. We build upon these previous studies in order to analyse both theevolution of compliance to the new regulation and the current relationship betweencharacteristics and emissions for the Brazilian fleet.
We assume that automobile i has a production function for pollution emissions representedby:
),( iii CMYfE = (1)
where MY is model year and C is a vector of characteristics which includes, among others,engine size, horse power, electronic injection, fuel type and catalytic converter.
Based on this model, our econometric exercise analyses the evolution of the emissioncompliance pattern in the car industry in Brazil for the period 1992-97. The emission trend isanalysed across fuel types and engine size categories. Additionally, a specific cross-sectionregression is undertaken for 1997 in order to analyse the relationship between emissions andcharacteristics.
Our data was obtained from laboratory tests undertaken by the São Paulo EnvironmentalAgency (CETESB) which recorded the emissions of HC, CO and NOx for each car modelalong with the model’s characteristics14. Since CETESB only tests auto engine andemissions by family type, the same emission test is usually used for cars with the sameengine, but with different weight, size and maximum speed. Consequently, we can only useone of the observations for statistical analysis purposes. Furthermore, since different weightsare associated with the same emission rate, we cannot use such a variable for our analysis.
Other characteristics like cylinders and transmission are not used since they are almostuniform in Brazil (most cars have four cylinders and use manual transmission). Informationon catalytic converters is also available, but only for part of the database and consequentlycould not be used. The variables left for inclusion in our analysis with enough precision arefuel type, engine size, horsepower, rpm, fuel injection type/carburetor and the year of the test.Nevertheless, due to the high correlation between engine size and horsepower, which causedsignificant multicolinearity in our model, we opted to include only horsepower in theestimation15.
Additionally, we merged the CETESB database with our price and quantity database obtainedfrom the Quatro Rodas magazine and Auto Part Manufacturer’s National Syndicate(Sindipeças) in order to ensure that only car models with positive sales were included in the 15 The results do not change substantially when we include engine size instead of horse power. Nevertheless, dueto its greater variability, the model has a better fit with horse power.
CREED Working Paper Series No 29 9
analysis. Since many different car models had the same emission test, we had to clean thedatabase until there was only one observation from each family of cars. On this basis weended up with 444 observations from 1992 to 1997.
The emission compliance process is analysed by fuel type (gasoline and ethanol) and car size(small, medium and large). Controlling for horsepower and rpm (since CETESB tests areundertaken in different rpm), we include dummies for test years and obtain the percentagechange in emissions through time.
The analysis is undertaken for the three pollutants CO, HC and NOx using a simplifiedversion of equation (1) given by:
∑=
++++=4
121log
jijijiii dyearrpmhpe εγββα (2)
where hp is horse power, rpm is rotations per minute and dyear are dummies taking the value1 if the car was tested in that year and zero otherwise and ε is the error term. The dummy yearfor the test is used as proxy for the model year.
Based on this semi-logarithmic specification, the coefficient estimate gives us the percentagechange in average emissions due to a unit change in the independent variable. Note that forthe dummy variables, the correct expression for this percentage change is given by .1−γeThe results are discussed based on the transformed coefficients. It is also important to pointout that, since model year dummies have 1992 as the base year, all year dummy coefficientsrepresent variations against 1992.
The second regression equation aims at analysing the current relationship between emissionsand characteristics in the Brazilian fleet. We use 1997 test data and a model similar toJohnstone and Kourasakis (1998). Regressing emissions on vehicle characteristics andcontrolling for rpm, we are able to distinguish the different effects of horse power, single-point or multi-point fuel injection and fuel type on emissions of CO, HC and NOx. Theeconometric model estimated is given by:
iiiiii gassinglefuelrpmhpe εββββα +++++= 4321log (3)
where hp is horse power, rpm is rotations per minute, singlefuel is a dummy variable takingthe value of 0 if the car has multi-point and 1 if it has single-point fuel injection and gas is adummy variable taking the value of 1 if the car is gas-fueled and 0 if it is ethanol-fueled. Dueto the presence of heteroscedasticity in some regressions, White-consistent standard errors areused.
CREED Working Paper Series No 29 10
Econometric Results
The evolution of emissions compliance, 1992-1997
Due to the small number and unequal distribution of observations across time, it is notpossible to undertake a cross-section analysis for each pollutant by each model year.Moreover, car models vary across years, hence it is also not possible to use panel-dataestimation techniques. We opted for pooling all observations controlling for variables thatinfluence emissions such as the horse power, rotations per minute and the presence of fuelinjection and adding dummy variables for each test year. Following Kahn (1996) we use across-section regression to analyse the effects of pollution regulation in Brazil through theperiod 1992-97.
Compliance schedules and emission trends by fuel type
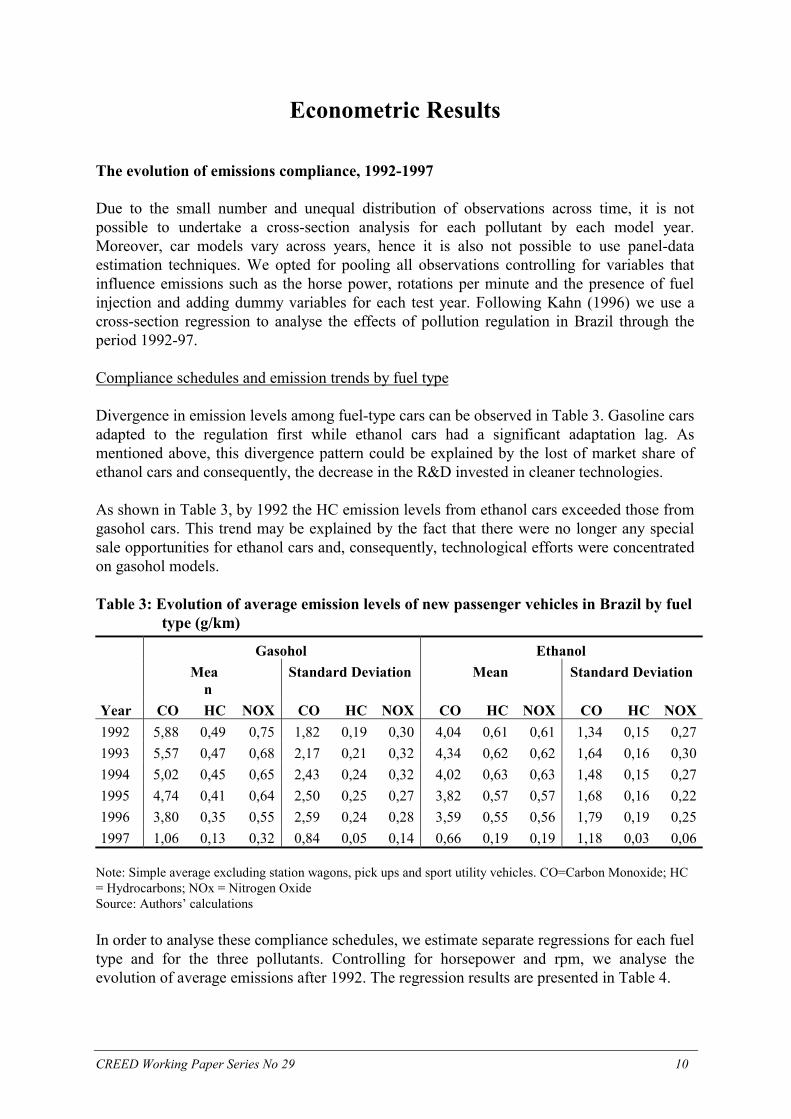
Divergence in emission levels among fuel-type cars can be observed in Table 3. Gasoline carsadapted to the regulation first while ethanol cars had a significant adaptation lag. Asmentioned above, this divergence pattern could be explained by the lost of market share ofethanol cars and consequently, the decrease in the R&D invested in cleaner technologies.
As shown in Table 3, by 1992 the HC emission levels from ethanol cars exceeded those fromgasohol cars. This trend may be explained by the fact that there were no longer any specialsale opportunities for ethanol cars and, consequently, technological efforts were concentratedon gasohol models.
Table 3: Evolution of average emission levels of new passenger vehicles in Brazil by fueltype (g/km)
Gasohol EthanolMea
nStandard Deviation Mean Standard Deviation
Year CO HC NOX CO HC NOX CO HC NOX CO HC NOX1992 5,88 0,49 0,75 1,82 0,19 0,30 4,04 0,61 0,61 1,34 0,15 0,271993 5,57 0,47 0,68 2,17 0,21 0,32 4,34 0,62 0,62 1,64 0,16 0,301994 5,02 0,45 0,65 2,43 0,24 0,32 4,02 0,63 0,63 1,48 0,15 0,271995 4,74 0,41 0,64 2,50 0,25 0,27 3,82 0,57 0,57 1,68 0,16 0,221996 3,80 0,35 0,55 2,59 0,24 0,28 3,59 0,55 0,56 1,79 0,19 0,251997 1,06 0,13 0,32 0,84 0,05 0,14 0,66 0,19 0,19 1,18 0,03 0,06
Note: Simple average excluding station wagons, pick ups and sport utility vehicles. CO=Carbon Monoxide; HC= Hydrocarbons; NOx = Nitrogen OxideSource: Authors’ calculations
In order to analyse these compliance schedules, we estimate separate regressions for each fueltype and for the three pollutants. Controlling for horsepower and rpm, we analyse theevolution of average emissions after 1992. The regression results are presented in Table 4.
CREED Working Paper Series No 29 11
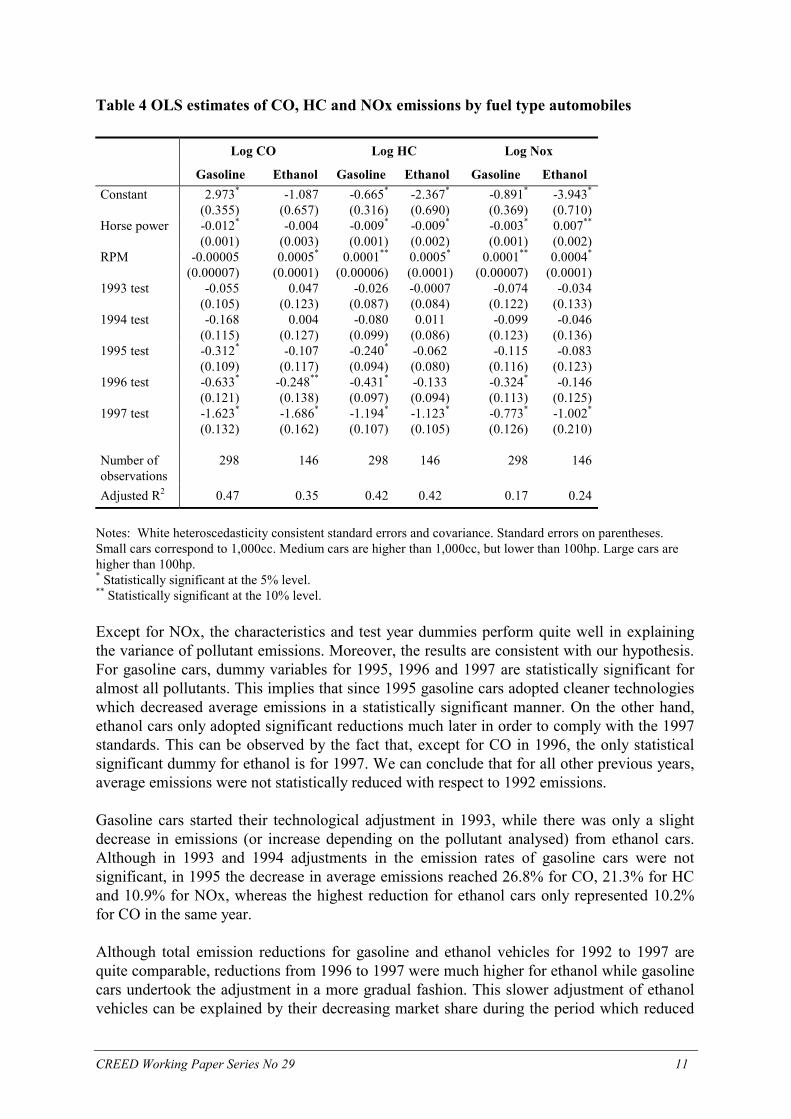
Table 4 OLS estimates of CO, HC and NOx emissions by fuel type automobiles
Log CO Log HC Log Nox
Gasoline Ethanol Gasoline Ethanol Gasoline EthanolConstant 2.973*
(0.355)-1.087
(0.657)-0.665*
(0.316)-2.367*
(0.690)-0.891*
(0.369)-3.943*
(0.710)Horse power -0.012*
(0.001)-0.004
(0.003)-0.009*
(0.001)-0.009*
(0.002)-0.003*
(0.001)0.007**
(0.002)RPM -0.00005
(0.00007)0.0005*
(0.0001)0.0001**
(0.00006)0.0005*
(0.0001)0.0001**
(0.00007)0.0004*
(0.0001)1993 test -0.055
(0.105)0.047
(0.123)-0.026
(0.087)-0.0007(0.084)
-0.074(0.122)
-0.034(0.133)
1994 test -0.168(0.115)
0.004(0.127)
-0.080(0.099)
0.011(0.086)
-0.099(0.123)
-0.046(0.136)
1995 test -0.312*
(0.109)-0.107
(0.117)-0.240*
(0.094)-0.062(0.080)
-0.115(0.116)
-0.083(0.123)
1996 test -0.633*
(0.121)-0.248**
(0.138)-0.431*
(0.097)-0.133(0.094)
-0.324*
(0.113)-0.146
(0.125)1997 test -1.623*
(0.132)-1.686*
(0.162)-1.194*
(0.107)-1.123*
(0.105)-0.773*
(0.126)-1.002*
(0.210)
Number ofobservations
298 146 298 146 298 146
Adjusted R2 0.47 0.35 0.42 0.42 0.17 0.24
Notes: White heteroscedasticity consistent standard errors and covariance. Standard errors on parentheses.Small cars correspond to 1,000cc. Medium cars are higher than 1,000cc, but lower than 100hp. Large cars arehigher than 100hp.* Statistically significant at the 5% level.** Statistically significant at the 10% level.
Except for NOx, the characteristics and test year dummies perform quite well in explainingthe variance of pollutant emissions. Moreover, the results are consistent with our hypothesis.For gasoline cars, dummy variables for 1995, 1996 and 1997 are statistically significant foralmost all pollutants. This implies that since 1995 gasoline cars adopted cleaner technologieswhich decreased average emissions in a statistically significant manner. On the other hand,ethanol cars only adopted significant reductions much later in order to comply with the 1997standards. This can be observed by the fact that, except for CO in 1996, the only statisticalsignificant dummy for ethanol is for 1997. We can conclude that for all other previous years,average emissions were not statistically reduced with respect to 1992 emissions.
Gasoline cars started their technological adjustment in 1993, while there was only a slightdecrease in emissions (or increase depending on the pollutant analysed) from ethanol cars.Although in 1993 and 1994 adjustments in the emission rates of gasoline cars were notsignificant, in 1995 the decrease in average emissions reached 26.8% for CO, 21.3% for HCand 10.9% for NOx, whereas the highest reduction for ethanol cars only represented 10.2%for CO in the same year.
Although total emission reductions for gasoline and ethanol vehicles for 1992 to 1997 arequite comparable, reductions from 1996 to 1997 were much higher for ethanol while gasolinecars undertook the adjustment in a more gradual fashion. This slower adjustment of ethanolvehicles can be explained by their decreasing market share during the period which reduced
CREED Working Paper Series No 29 12
incentives for innovations. Due to the decline in the market share of ethanol-fueled vehicles,we could expect ethanol cars to have adopted pollution control strategies at the very end ofthe compliance period, while gasoline cars, which were gaining market share, probablyadopted cleaner technologies earlier.
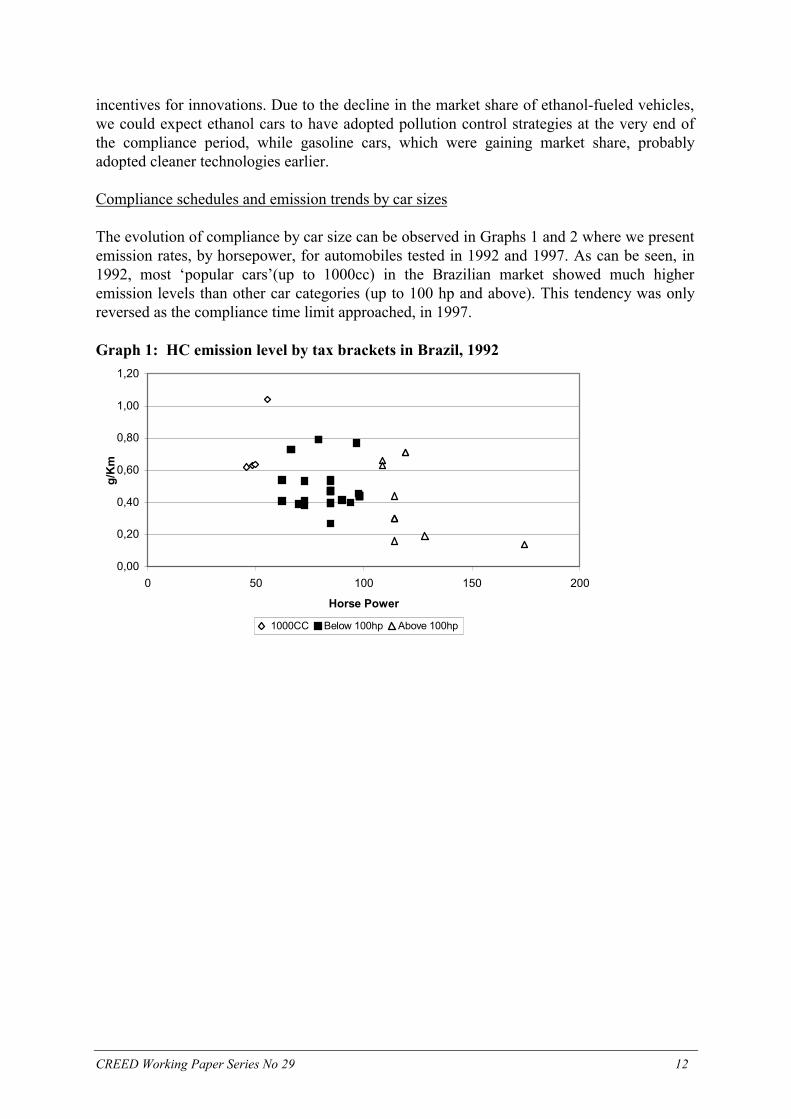
Compliance schedules and emission trends by car sizes
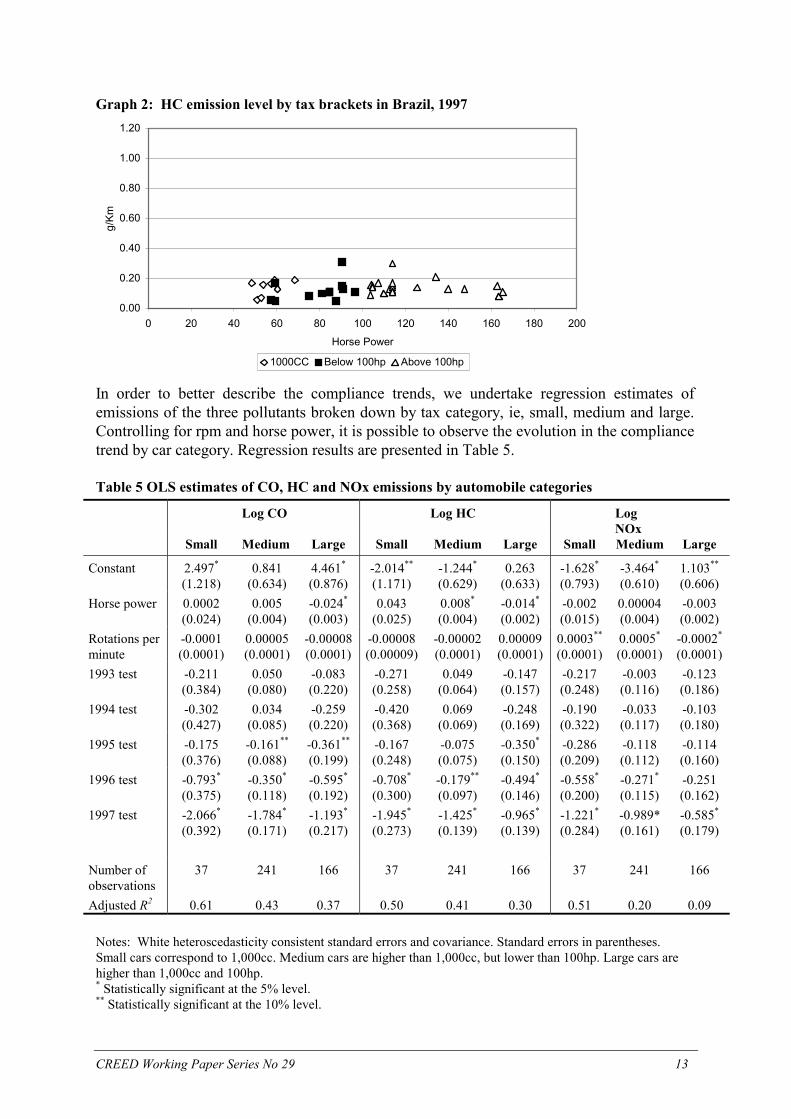
The evolution of compliance by car size can be observed in Graphs 1 and 2 where we presentemission rates, by horsepower, for automobiles tested in 1992 and 1997. As can be seen, in1992, most ‘popular cars’(up to 1000cc) in the Brazilian market showed much higheremission levels than other car categories (up to 100 hp and above). This tendency was onlyreversed as the compliance time limit approached, in 1997.
Graph 1: HC emission level by tax brackets in Brazil, 1992
0,00
0,20
0,40
0,60
0,80
1,00
1,20
0 50 100 150 200
Horse Power
g/K
m
1000CC Below 100hp Above 100hp
CREED Working Paper Series No 29 13
Graph 2: HC emission level by tax brackets in Brazil, 1997
0.00
0.20
0.40
0.60
0.80
1.00
1.20
0 20 40 60 80 100 120 140 160 180 200
Horse Power
g/Km
1000CC Below 100hp Above 100hp
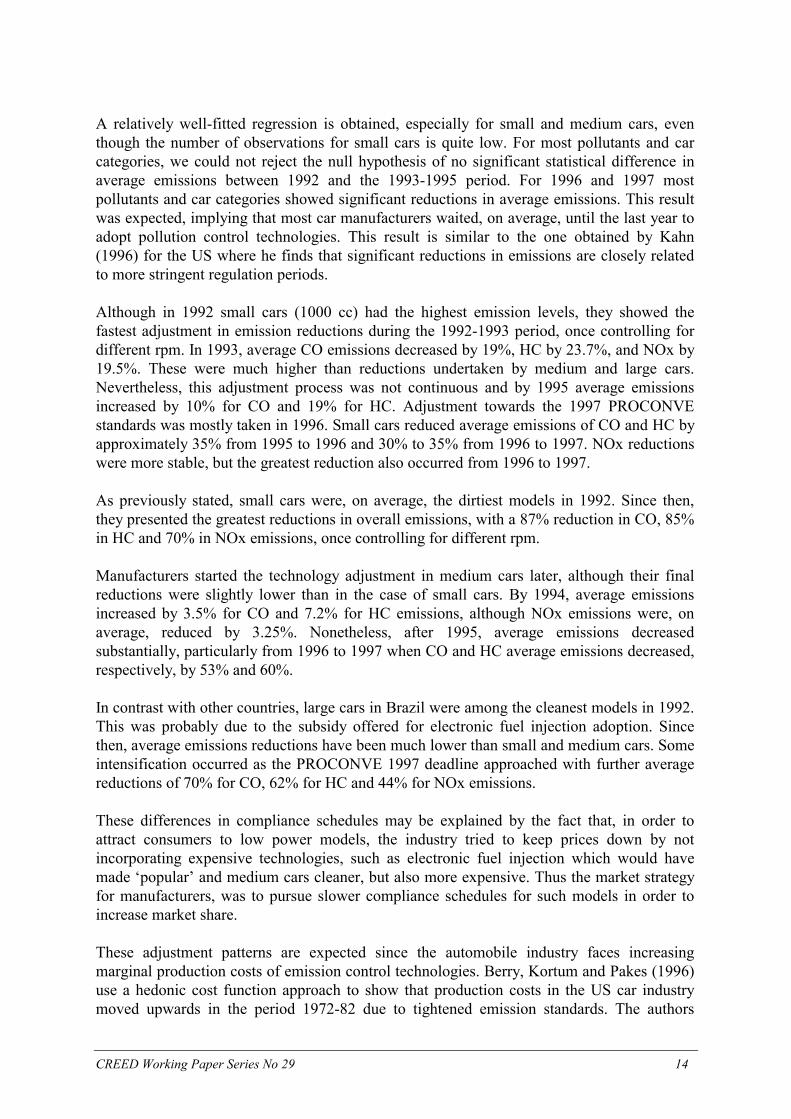
In order to better describe the compliance trends, we undertake regression estimates ofemissions of the three pollutants broken down by tax category, ie, small, medium and large.Controlling for rpm and horse power, it is possible to observe the evolution in the compliancetrend by car category. Regression results are presented in Table 5.
Table 5 OLS estimates of CO, HC and NOx emissions by automobile categories
Log CO Log HC LogNOx
Small Medium Large Small Medium Large Small Medium Large
Constant 2.497*
(1.218)0.841
(0.634)4.461*
(0.876)-2.014**
(1.171)-1.244*
(0.629)0.263
(0.633)-1.628*
(0.793)-3.464*
(0.610)1.103**
(0.606)Horse power 0.0002
(0.024)0.005
(0.004)-0.024*
(0.003)0.043
(0.025)0.008*
(0.004)-0.014*
(0.002)-0.002(0.015)
0.00004(0.004)
-0.003(0.002)
Rotations perminute
-0.0001(0.0001)
0.00005(0.0001)
-0.00008(0.0001)
-0.00008(0.00009)
-0.00002(0.0001)
0.00009(0.0001)
0.0003**
(0.0001)0.0005*
(0.0001)-0.0002*
(0.0001)1993 test -0.211
(0.384)0.050
(0.080)-0.083(0.220)
-0.271(0.258)
0.049(0.064)
-0.147(0.157)
-0.217(0.248)
-0.003(0.116)
-0.123(0.186)
1994 test -0.302(0.427)
0.034(0.085)
-0.259(0.220)
-0.420(0.368)
0.069(0.069)
-0.248(0.169)
-0.190(0.322)
-0.033(0.117)
-0.103(0.180)
1995 test -0.175(0.376)
-0.161**
(0.088)-0.361**
(0.199)-0.167(0.248)
-0.075(0.075)
-0.350*
(0.150)-0.286(0.209)
-0.118(0.112)
-0.114(0.160)
1996 test -0.793*
(0.375)-0.350*
(0.118)-0.595*
(0.192)-0.708*
(0.300)-0.179**
(0.097)-0.494*
(0.146)-0.558*
(0.200)-0.271*
(0.115)-0.251(0.162)
1997 test -2.066*
(0.392)-1.784*
(0.171)-1.193*
(0.217)-1.945*
(0.273)-1.425*
(0.139)-0.965*
(0.139)-1.221*
(0.284)-0.989*(0.161)
-0.585*
(0.179)
Number ofobservations
37 241 166 37 241 166 37 241 166
Adjusted R2 0.61 0.43 0.37 0.50 0.41 0.30 0.51 0.20 0.09
Notes: White heteroscedasticity consistent standard errors and covariance. Standard errors in parentheses.Small cars correspond to 1,000cc. Medium cars are higher than 1,000cc, but lower than 100hp. Large cars arehigher than 1,000cc and 100hp.* Statistically significant at the 5% level.** Statistically significant at the 10% level.
CREED Working Paper Series No 29 14
A relatively well-fitted regression is obtained, especially for small and medium cars, eventhough the number of observations for small cars is quite low. For most pollutants and carcategories, we could not reject the null hypothesis of no significant statistical difference inaverage emissions between 1992 and the 1993-1995 period. For 1996 and 1997 mostpollutants and car categories showed significant reductions in average emissions. This resultwas expected, implying that most car manufacturers waited, on average, until the last year toadopt pollution control technologies. This result is similar to the one obtained by Kahn(1996) for the US where he finds that significant reductions in emissions are closely relatedto more stringent regulation periods.
Although in 1992 small cars (1000 cc) had the highest emission levels, they showed thefastest adjustment in emission reductions during the 1992-1993 period, once controlling fordifferent rpm. In 1993, average CO emissions decreased by 19%, HC by 23.7%, and NOx by19.5%. These were much higher than reductions undertaken by medium and large cars.Nevertheless, this adjustment process was not continuous and by 1995 average emissionsincreased by 10% for CO and 19% for HC. Adjustment towards the 1997 PROCONVEstandards was mostly taken in 1996. Small cars reduced average emissions of CO and HC byapproximately 35% from 1995 to 1996 and 30% to 35% from 1996 to 1997. NOx reductionswere more stable, but the greatest reduction also occurred from 1996 to 1997.
As previously stated, small cars were, on average, the dirtiest models in 1992. Since then,they presented the greatest reductions in overall emissions, with a 87% reduction in CO, 85%in HC and 70% in NOx emissions, once controlling for different rpm.
Manufacturers started the technology adjustment in medium cars later, although their finalreductions were slightly lower than in the case of small cars. By 1994, average emissionsincreased by 3.5% for CO and 7.2% for HC emissions, although NOx emissions were, onaverage, reduced by 3.25%. Nonetheless, after 1995, average emissions decreasedsubstantially, particularly from 1996 to 1997 when CO and HC average emissions decreased,respectively, by 53% and 60%.
In contrast with other countries, large cars in Brazil were among the cleanest models in 1992.This was probably due to the subsidy offered for electronic fuel injection adoption. Sincethen, average emissions reductions have been much lower than small and medium cars. Someintensification occurred as the PROCONVE 1997 deadline approached with further averagereductions of 70% for CO, 62% for HC and 44% for NOx emissions.
These differences in compliance schedules may be explained by the fact that, in order toattract consumers to low power models, the industry tried to keep prices down by notincorporating expensive technologies, such as electronic fuel injection which would havemade ‘popular’ and medium cars cleaner, but also more expensive. Thus the market strategyfor manufacturers, was to pursue slower compliance schedules for such models in order toincrease market share.
These adjustment patterns are expected since the automobile industry faces increasingmarginal production costs of emission control technologies. Berry, Kortum and Pakes (1996)use a hedonic cost function approach to show that production costs in the US car industrymoved upwards in the period 1972-82 due to tightened emission standards. The authors
CREED Working Paper Series No 29 15
indicate that catalytic converters, usually the first control device introduced in the US as wellas in Brazil, did not have significant impacts on costs, but more advanced technologies suchas electronic fuel injection affected costs significantly. Moreover, these additional costs ofintroducing fuel injection were passed to consumers.
Using a hedonic price analysis, Fonseca (1997) estimates a quality index for the Brazilianautomobile industry. He finds that the trend of price increases from 1980 to 1994 was highlyassociated to increases in car quality, including emission control devices during the lateryears. That is, the costs of technological improvements in cars were passed through toconsumer prices, as one would expect in an oligopolistic market.
Emissions and characteristics in the 1997 models
The pattern of emissions across models and engine sizes changed considerably from 1992 to1997. After the adjustment to the 1997 PROCONVE standards, this relationship changedwhen 1997 car models incorporated the existent technological devices.
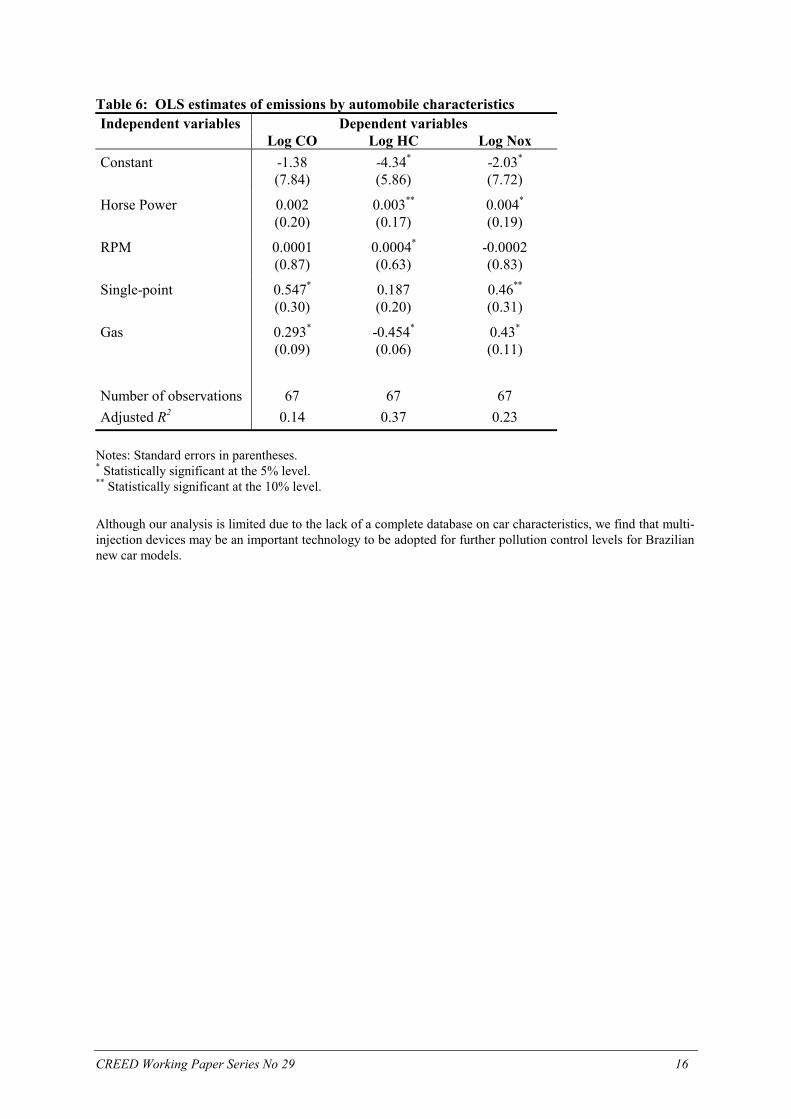
Our results in Table 6 show that, after controlling for rpm, fuel type and single-point fuelinjection, emissions tend to increase with horsepower. Moreover a unit increase inhorsepower increases emissions by 0.002% to 0.004% depending on the pollutant analysed.Nevertheless, this linear increasing relationship between emission and horse power is notgeneric. We also estimated a quadratic model which was found significant for CO emissionswhich seems to follow an inverted-U shaped curve, first increasing and then decreasing withhorse power. This finding differs from the ones obtained by Fullerton and West (1999)showing an opposite relationship.
Although for the linear model horsepower is not a significant determinant of CO emissions, itis statistically significant for HC and NOx. On the other hand, single-point and gasolinedummies are statistically significant for almost all pollutants. We find that, on average,single-point fuel injection cars emit 73% more CO than multi-point fuel injection cars and58% more NOx, after controlling for rpm, horsepower and fuel type. For HC, the differencebetween multi-point and single-point fuel injection does not seem to be significant inexplaining average emissions.
Another interesting result is related to the difference between gas-fueled and ethanol-fueledvehicles. Although ethanol-fueled vehicles make up an increasingly small part of the market,they still have lower CO and NOx average emissions than gasoline-fueled cars. On the otherhand, we find that, after controlling for rpm and horse power, ethanol-fueled vehicles emit,on average, 36% more HC than gasoline-fueled vehicles with multi-point fuel injection (themost advanced technology for reducing emissions currently adopted in Brazil).
CREED Working Paper Series No 29 16
Table 6: OLS estimates of emissions by automobile characteristicsIndependent variables Dependent variables
Log CO Log HC Log NoxConstant -1.38
(7.84)-4.34*
(5.86)-2.03*
(7.72)
Horse Power 0.002(0.20)
0.003**
(0.17)0.004*
(0.19)
RPM 0.0001(0.87)
0.0004*
(0.63)-0.0002(0.83)
Single-point 0.547*
(0.30)0.187(0.20)
0.46**
(0.31)
Gas 0.293*
(0.09)-0.454*
(0.06)0.43*
(0.11)
Number of observations 67 67 67Adjusted R2 0.14 0.37 0.23
Notes: Standard errors in parentheses.* Statistically significant at the 5% level.** Statistically significant at the 10% level.
Although our analysis is limited due to the lack of a complete database on car characteristics, we find that multi-injection devices may be an important technology to be adopted for further pollution control levels for Braziliannew car models.
CREED Working Paper Series No 29 17
Concluding Remarks
Average emissions from cars produced in Brazil decreased substantially with the impositionof mandatory car emission standards. The compliance trend shows interesting adaptationschedules among car sizes and fuel types. Nevertheless, the gradual compliance approach ofPROCONVE, based on the 1992 and 1997 deadlines, avoided a rapid introduction of alreadyexisting emission control technologies. During the middle years of the period 1992-97models differed substantially in emission levels. Ethanol cars lost significant market shareand are currently hardly sold. This was reflected in their compliance schedule which did notincorporate new technology as fast as gasoline cars. Compared to gasoline models, they stillhave lower average emissions for CO and NOx, but higher levels for HC.
Car tax structure subsidising large cars with fuel injection devices allowed this segment tospeed up compliance. Conversely, small cars, due to their low price characteristic, had theslowest compliance schedule across all categories. However, after the adjustment to fullcompliance, they became the least polluting category in terms of average emissions.Therefore, we conclude that the current value added tax structure is not running against theemission pattern of manufactured Brazilian cars. Can this tax structure be modified to createadditional incentives for lower emission levels in the current models?
With the full enforcement of PROCONVE in 1997, vehicle manufacturers do not have anyfurther incentives to reduce emissions. Moreover, demand for new automobiles is still veryhigh, increasing aggregate emissions with substantial pressures on air quality in major urbanareas. In order to mitigate this problem, additional policy actions are required to createincentives for a cleaner profile of the Brazilian vehicle fleet. The idea of combining fuel taxesto decrease miles driven with a vehicle characteristics tax in order to encourage the purchaseof cleaner automobiles was discussed and it is recognised as a cost-effective solution.
Since the current automobile policy regime is already offering wide tax incentives, a possiblealternative is a tax discrimination between a clean and dirty car tax within each tax bracketbased on clean-car characteristics, such as the multi-injection devices as pointed out in oureconometric analysis. The application of this scheme for all categories would change therelative price of clean and dirty cars throughout all market sectors and will create incentivesfor the purchase of cleaner vehicles. Additionally, incentives for R&D in cleaner technologieswould be induced. Note that this differentiation could be used alongside the already adoptedtax differentiation across small, medium and large cars.
An important question relates to the neutrality of such a tax differential. Although in theorywe could design a fiscal-neutral policy, the final result would depend fundamentally onrelative elasticities across sizes and models, as well as the supply response to such a taxpolicy.
In spite of the fact that a subsidy on cleaner automobiles was given to fuel injection in thepast, the choice among a tax on dirty cars or a subsidy on cleaner models does not dependsolely on fiscal constraints. Subsidies for environmental purposes create substantial negativedynamic supply side responses.
CREED Working Paper Series No 29 18
The proposed characteristic tax can also be applied to annual licensing taxes (IPVA) creatingan additional incentive for the substitution of dirty for cleaner used cars. There are somedistributive concerns with that tax scheme since older and more polluting cars are usuallyowned by lower income households which would pay higher taxes.16 Nonetheless, in adynamic perspective, the lower tax on newer cars could create an additional incentive forricher households to buy new automobiles more frequently generating a reduction on usedcars average prices. In that case, net welfare gains may arise for lower income households.
Another policy aiming at avoiding equity problems on the pursue of the fleet modernisation isa car sale tax rebate offered to new buys and linked to the selling of an old car varyingaccording to car’s age.
Regardless of the option, any taxation scheme based on clean car characteristic has to bereviewed periodically following the adaptations and innovations of these characteristics in thecar market. Moreover, the dirty surtax levels must be somehow related to the marginalproduction costs of introducing these characteristics and also to the expected additional costsborn by owners due to car maintenance and performance affected by these cleancharacteristics. In sum, although these cost-effective instruments are simple in theory, theyare not easily implemented and should deserve further research efforts.
16 See Harrington et al. (1994) for the analysis of the case of United States.
CREED Working Paper Series No 29 19
Bibliography
Anfavea (1999). Brazilian automotive industry statistical yearbook. Anfavea, São Paulo
Berry, S., Kortum, S. and Pakes, A. (1996). “Environmental change and hedonic cost functions forautomobiles.” Proceedings of the National Academy of Sciences 93: 12731-12738.
CETESB (1998). “Relatório de qualidade do ar no estado de São Paulo: 1997”. Série Relatórios, CETESB: SãoPaulo.
De Negri, J.A. (1998). “Avaliação do Regime Automotivo Brasileiro”. Mimeo, IPEA, Brasília.
Eskeland, G.S. (1994). “A presumptive Pigovian Tax: complementing regulation to mimic an emission fee.” TheWorld Bank Economic Review 8(3).
Fonseca, R. (1997). “Mensuração da mudança qualitativa dos automóveis brasileiros: 1960-94.” Pesquisa ePlanejamento Econômico 27(1).
Fullerton, D. and West, S. (1999). “Can taxes on Cars and on gasoline mimic an unavailable tax on emissions?”NBER Working Paper Series, No 7059.
Harrington, et al. (1994). Shifting gears: new directions for cars and clean air? Discussion Paper 94-26.Resources for the Future, Washington, DC.
Innes, R (1996). “Regulating automobile pollution under certainty, competition and imperfect information.”Journal of Environmental Economics and Management 31(2).
Johnstone, N. and Karousakis, K. (1998). “Economic incentive policies to reduce pollution emissions fromtransport: the case for vehicle characteristics taxes”. Mimeo. IIED, London.
Kahn, M. (1996). “New evidence on trends in vehicle emissions.” Rand Journal of Economics 27(1): 183-196.
Maddison, D. et al. (1996). The true costs of road transport. Earthscan, London.
Seroa da Motta, R. and Mendes, F.E. (1996). “Uma proposta de um imposto ambiental sobre os combustíveis. ”In Economia Brasileira em Perspectiva. IPEA, Rio de Janeiro.
Seroa da Motta, R. and Fernandes Mendes, A.P. (1995). “Custos de saúde associados à poluição do ar noBrasil.” Pesquisa e Planejamento Econômico 25(1).
Sevigny, M. (1998). Taxing automobile emissions for pollution control. Edward Elgar. Cheltenham, UK.
Watkins, L.H. (1991). Air pollution from road vehicles. HMSO, London.
White, L.J. (1982). “U.S. automotive emissions control: how well are they working?” AER 72(2).
CREED Working Paper Series No 29 20
PUBLICATIONS AND ORDER FORM
Paper Nos. 1-16 may be obtained free of charge; however orders for large quantities (more than6) will incur full postal charges. Papers Nos. 17 onwards may be downloaded in full from theCREED web site free of charge, at http://www.iied.org/creed. Alternatively hard copies may beobtained from IIED; a charge of £5 plus postage, will be levied for northern readers only.
The following papers are available from the CREED Programme. Please check the publications youwish to obtain and return the order form to Jacqueline Saunders, Environmental Economics Programme,International Institute for Environment and Development, 3 Endsleigh Street, London WC1H 0DD, oremail your requests to [email protected].
CREED Working Paper Series.
No 1. Adjustment Policies and the Environment: A Critical Review of the Literature.Carlos E.F. Young and Joshua Bishop. July 1995.
No 2. Environmental Regulations as Trade Barriers for Developing Countries: Eco-labelling and the Dutch Cut Flower Industry. Harmen Verbruggen, Onno Kuik & MartijnBennis. July 1995.
No 3. Economic Incentives for Watershed Protection: A Report on an Ongoing Study ofArenal, Costa Rica. Bruce Aylward, Jaime Echeverría & Edward B. Barbier. September 1995.
No 4. Economic Policies for Sustainable Water Use in Thailand. Ritu Kumar and CarlosYoung. June 1996.
No 5. The Informal Sector and Waste Paper Recovery in Bombay. Pieter van Beukering,Edwin Schoon and Ajit Mani. June 1996.
No 6. Economic Trends in the Timber Industry of the Brazilian Amazon: Evidence fromParagominas. Steven Stone. July 1996.
No 7. Input Substitution in the Indian Paper Industry: A Variable Cost FunctionApproach. K.V. Ramaswamy, R.R. Vaidya, M.J. Bennis and J.G.M. Hoogeveen. July 1996.
No 8. Poverty and Environmental Degradation: A Literature Review and Analysis. Anantha K. Duraiappah. October 1996.
No 9. Valuation and Evaluation of Management Alternatives for the Pagbilao MangroveForest. Ron Janssen and Jose E Padilla. October 1996.
No 10. The Economic and Environmental Impacts of the Waste Paper Trade andRecycling in India: A Material Balance Approach. Pieter van Beukering and Anantha K.Duraiappah. November 1996.
No 11. Incentives for Eco-efficiency: Lessons from an Evaluation of Policy Alternatives;A Case Study of the Steel Sector in India. Ritu Kumar, Nick Robins, A.K. Chaturvedi, R.Srinivasan and J. Gupta. December 1996.
No 12. Poverty and Environment Linkages in Mountains and Uplands: Reflections on the‘Poverty Trap’ Thesis. Sanjeev Prakash. February 1997.

CREED Working Paper Series No 29 21
No 13. The Economic Importance of Wild Resources in the Hadejia-Nguru Wetlands,Nigeria. Derek Eaton and Marie-Thérèse Sarch. May 1997.
No 14. Economic Valuation of Mangrove Ecosystems: Potential and Limitations. FrankSpaninks and Pieter van Beukering. July 1997.
No 15. The Use of Environmental Functions to Evaluate Management Strategies for thePagbilao Mangrove Forest. Alison J. Gilbert and Ron Janssen. August 1997.
No 16 Trends and Issues in the Plastics Cycle in China, with Special Emphasis on Trade& Recycling. Pieter van Beukering, Li Yongjiang, Zhao Yumin & Zhou Xin. December 1997.
No 17. Economic Valuation of Communal Rangelands in Botswana: A Case Study. JaapArntzen. February 1998.
No 18. Environmental Product Measures: Barriers for South-North Trade? HarmenVerbruggen, Onno Kuik, Martijn Bennis, Hans Hoogeveen, Roland Mollerus. March 1998
No 19. The Shrimp Aquaculture Sector in Thailand: A Review of Economic,Environmental and Trade Issues. Direk Patmasiriwat, Onno Kuik and Sunil Pednekar.October 1998.
No 20. An Analysis of Private and Social Discount Rates in Costa Rica. Bruce Aylwardand Ina Porras. December 1998.
No 21. Institutional Arrangements for Watershed Management: A Case Study ofArenal Costa Rica. Bruce Aylward and Alvaro Fernandez Gonzalez. December 1998.
No 22. Farmers’ Perceptions and Sustainable Land Use in the Atacora, Benin. A.Adegbidi, K. Burger, E. Gandonou and I. Mulder. February 1999.
No 23. Sustainable Livestock Management in the Kalahari: an Optimal LivestockRangeland Model. Anantha K. Duraiappah and Jeremy S. Perkins. March 1999.
No 24. Analysing Urban Solid Waste in Developing Countries: A Perspective onBangalore, India. Pieter van Beukering, Madhushree Sekher, Reyer Gerlagh and VijayKumar. March 1999.
No 25. Market and Policy Incentives for Livestock Production and WatershedProtection in Arenal, Costa Rica. Bruce Aylward, Jaime Echeverría, Katherine Allen,Ronald Mejías and Ina T. Porras. March 1999.
No 26. Integrated Modelling of Solid Waste in India. Reyer Gerlagh, Pieter vanBeukering, Madhu Verma, P.P. Yadav and Preety Pandey. March 1999.
No 27. The Plastics Sector in China: Issues in Production, Recycling and InternationalTrade. Anantha K. Duraiappah, Zhou Xin and Pieter van Beukering. March 1999.
No 28. Farmers’ Perceptions of Soil Fertility in Benin Ingrid Mulder. February 2000.
No 29. Automobile Pollution Control in Brazil. Claudio Ferraz and Ronaldo Seroa daMotta. June 20000.
CREED Working Paper Series No 29 22
CREED Final Reports
The following reports are available from recently completed CREED projects. A charge is levied for allreaders as indicated.
International Trade and Recycling in Developing Countries: The Case of Waste PaperTrade in India. P. van Beukering and V. Sharma (eds). November 1996. 155 pages. £20
The importance of international trade in the global economy is expanding, not only forprimary products but also for recyclable waste. The main objectives of this study were todetermine the economic, social and environmental impacts of international trade of wastepaper for recycling purposes in India. The report addresses three main sectors: (i) the worldmarket for waste paper, (ii) the local waste paper market and (iii) the Indian paper industry.It also makes recommendations for policy makers at an international, national and locallevel: international agreements should distinguish between hazardous and non-hazardouswaste; national trade barriers to waste imports should be eliminated; and existing localinformal recovery sectors should be favoured over formal Western-style recycling systems.
Mangroves or Fishponds? Valuation and Evaluation of Alternative Uses of aMangrove Forest in the Philippines. Ron Janssen & Jose Padilla. September 1997. 258pages. £25.
One of the major threats to mangroves in the Philippines is the rapidly increasing aquacultureindustry. This study includes a review of valuation methodologies and their application tothe case study area of the Pagbilao experimental mangrove forest in the Philippines.Valuations of goods and services and environmental functions of the forest are employed toassess alternative management regimes using both cost-benefit analysis as well as a multi-criteria approach. Much depends on the management objectives: conversion to aquacultureis the most economically efficient management option. However, if equity and sustainabilityobjectives are included, commercial forestry is the preferred alternative.
Incentives for Eco-Efficiency. Market Based Instruments for Pollution Prevention: ACase Study of the Steel Sector. Ritu Kumar, Nick Robins, A.K. Chaturvedi, R. Srinivasanand J. Gupta. December 1997. 96 pages. £20.
Mounting pressures on industry to reduce pollution, to remain globally competitive and tomeet the requirements of international standards, require fundamental changes in governmentpolicy and corporate approaches to environmental management. This report presents theresults of an international study assessing the potential for market-based instruments forpollution prevention in the steel sector in India. It recommends a set of policy measures toreduce discharge levels in the most cost effective manner, to induce firms to adopt cleanertechnologies and to encourage firms to economise on energy and water resources. In thisregard, the importance of achieving coherence with existing policies, building trust amongkey stakeholders and gradually phasing in market-based instruments is emphasised.
Economic Incentives for Watershed Protection: A Case Study of Lake Arenal, CostaRica. Bruce Aylward, Jaime Echeverria, Alvaro Fernandez Gonzalez, Ina Porras, KatherineAllen, Ronald Mejias. February 1998. 323 pages. £30.
Conventional wisdom holds that cutting down tropical forests for livestock production is notonly bad business but bad for the environment. In particular, it is thought that conversion ofnatural forest to pasture leads to a rise in the sedimentation of waterways and resevoirs,increased risk of flooding and loss of dry season water supply. In the case of Lake Arenal,
CREED Working Paper Series No 29 23
Costa Rica, this conventional view is stood on its head by research showing that ranching,dairy farming and associated downstream hydrological effects represent important positivevalues to the Costa Rican economy, values that significantly outweigh expected returns fromreforestation
Plastics Recycling in China. An International Life Cycle Approach. Edited by Pieter vanBeukering. April 1999. 148 pages. £20.
Please check the papers you wish to obtain and use this form for delivery. In the first instance we willsend electronic versions of the paper.
Name ...................................................................................................................................................Organisation.......................................................................................................................................
Address ..........................................................................................................................................................................................................................................................................................................I enclose a cheque for *£......................made payable to IIED/I authorise you to debit my creditcard for £.............. My Access/Visa/Mastercard number (please tick as applicable) is:
Expiry date.................................... . Name of cardholder.............................................................Cardholder address............................................................................................................................
* For postage within the UK please add 20%, minimum £1 (first class or equivalent)For postage to Europe please add 25%, minimum £2 (printed matter airmail or equivalent)For postage to the rest of the world, please add 40% (printed matter airmail or equivalent) or
25% (surface)