automobile_car
TRANSCRIPT

Group-1
Dushyant Singh
Sagar Reddy
Saurav Kumar
Roopsa Nath
Rasleen Ahluwalia
Sankalp Singh
AUTOMOBILE INDUSTRYANALYSIS

CONTENTS
1. INTRODUCTION2. GLOBAL SCENARIO FOR CARS3. INDIAN SCENARIO4. MICHEAL PORTER FIVE FORCES MODEL5. HERFINDAHL INDEX6. CONDUCT6. PERFORMANCE ANALYSIS7. FUTURE OUTLOOK

INTRODUCTION
The Automobile sector is divided into four segments Two wheelers Passenger cars Commercial vehicle Three wheelers
The automobile industry impacts on Indian economy
The industry contributes 7 percent to India's GDPThe industry is responsible for 7 to 8 percent of India's total employed population
Source Siam.com

GLOBAL SCENARIO OF PASSENGER CARS
• The passenger car segment has emerged as a major driving force for upstream industries like steel, iron, aluminium, rubber, plastics, glass, and electronics and down stream industries like advertising and marketing, transport and insurance.
• The car industry generates large amount of employment opportunities in the economy. For example in the US, every sixth worker is involved in the making of an automobile.
• The USA and Japan are the leaders with around 42% of the total world market. Major players in the US Market
KPMG Executive automotive summary
Company Name Market Share General Motors Company (GM) 18.70%
Ford Motor Co. (F) 15.90%Toyota Motors Corp. (TM) 15.10%
Chrysler-Fiat 11.30%Honda Motor Co. (HMC) 9.00%
Nissan Motor Co. (NSANY) 7.80%

GLOBAL SCENARIO OF PASSENGER CARS (PRODUCTION)
Source oica.net
Sr. No. Country Cars Production %age1 China 180,85,213 27.662 Japan 81,89,323 12.523 Germany 54,39,904 8.324 USA 43,46,958 6.655 South Korea 41,22,604 6.306 India 31,38,988 4.807 Brazil 27,42,309 4.198 Russia 19,19,636 2.949 Mexico 17,71,987 2.71
10 Spain 17,19,700 2.6311 UK 15,09,762 2.3112 France 14,60,000 2.2313 Czech Rep. 11,28,473 1.7314 Thailand 11,22,780 1.7215 Slovakia 9,75,000 1.4916 Canada 9,65,191 1.4817 Indonesia 9,25,111 1.4118 Turkey 6,33,604 0.9719 Malaysia 5,40,200 0.8320 Iran 5,38,170 0.82

COMPARISON OF WORLD VS INDIAN AUTOMOBILE INDUSTRY
Years World IndiaIndia
contribution in % age
2008 527,26,117 18,46,051 3.50
2009 477,72,598 21,75,220 4.55
2010 583,41,703 28,31,542 4.85
2011 598,97,273 30,40,144 5.08
2012 630,74,662 32,85,496 5.212008 2009 2010 2011 20120
500,000
1,000,000
1,500,000
2,000,000
2,500,000
3,000,000
3,500,000
Comparison
World Linear ( World) India
Source oica.net

KPMG’s VIEW ON GLOBAL VECHICLE SEGMENT DEFINITIONS

INDIAN SCENARIO
Source- www.siamindia.com
Produced 2.58 million vehicles in August 2013 as against 1.96 million in august 2012
Total vehicles sold were 2.56 million during 2013-2014
Expected growth rate is at 14% during 2012-2021.Exports grew by 2.03 per cent during April-august 2013
Market share of two wheeler is 76.49%, passenger cars is 15.96%, commercial vehicles and three wheelers has 7.55%
Commercial vehicle recorded growth of rate of 20% p.a, passenger vehicle at 15% p.a and three wheeler grew at 11% p.a

SEGMENTWISE SALES
Source- www.siamindia.com

RECENT DEVELOPMENTS IN INDIAN AUTOMOBILE MARKET
• Hero MotoCorp plans to establish 20 manufacturing facilities across 50 countries by 2020
• Maruti Suzuki India Ltd (MSIL) is setting up an operational integrated research & development
(R&D) center in Rohtak, Haryana
• Daimler India Commercial Vehicles (DICV) has expanded its network across the country. The
company plans to establish dealership facilities in over 100 identified locations across India by
2014

• Major Indian Companies • Major Multi-national companies
AUTOMOBILE COMPANIES IN INDIA
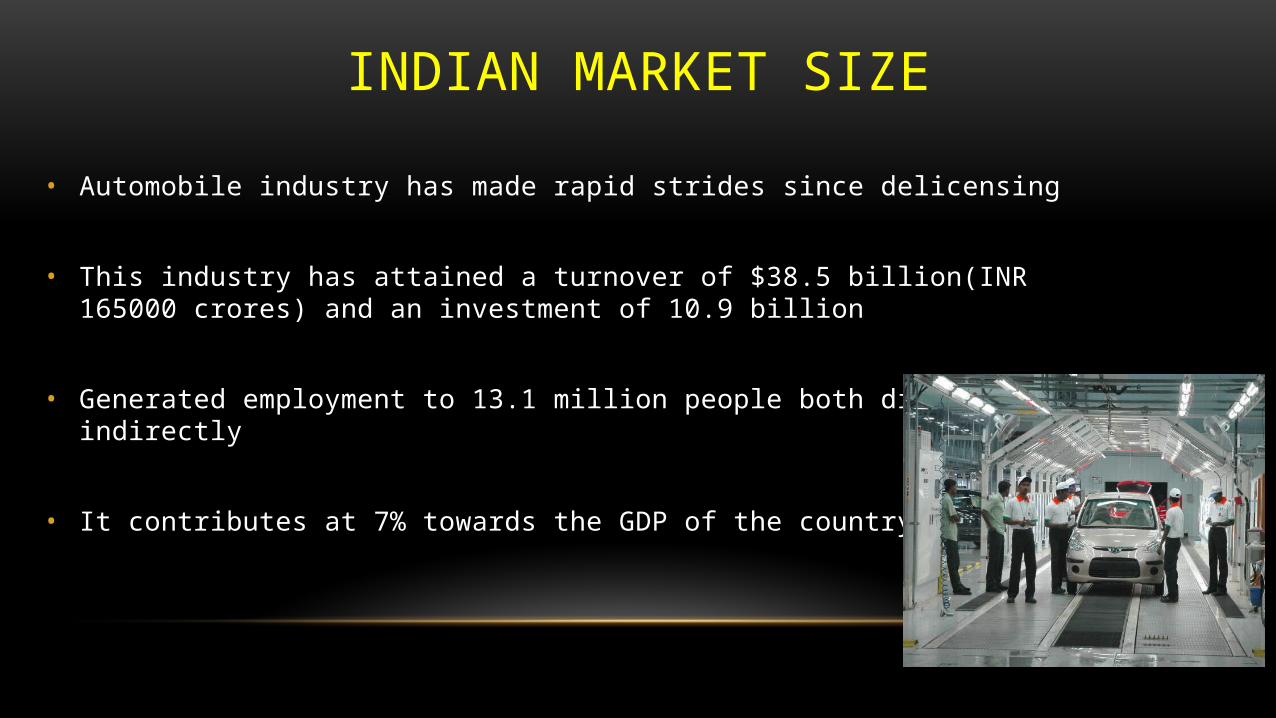
INDIAN MARKET SIZE
• Automobile industry has made rapid strides since delicensing
• This industry has attained a turnover of $38.5 billion(INR 165000 crores) and an investment of 10.9 billion
• Generated employment to 13.1 million people both directly and indirectly
• It contributes at 7% towards the GDP of the country
INDUSTRY ASSISTANCE
• Major players like Maruti Suzuki India ltd and Tata Motors has been recording profits of 6% to 11%
• Acute slowdown in production due to rupee dollar crisis
• The passenger vehicle segment saw its sharpest drop in the month of June 2013 with 2,15,146 being produced.

PASSENGER CARS PRODUCTION AND SALES
Source- www.siamindia.com

PORTER’S FIVE FORCES MODEL
• Porter five forces analysis is a framework for industry analysis and business strategy development. To derive five forces that determine the competitive intensity and therefore attractiveness of a market.
Competition among players:
• The competition is very fierce in automobile industry in India.
• Honda (15,714) has grown to the Fourth largest seller in India beating Tata(13,800) and Toyota(10,910).

• BUYER’S POWER
• The Indian market has large number of players (at least 10 ) From
Maruti Suzuki(96,569) to Volkswagen(4,107)
• This has vastly shifted power to customers as there are two to three
options in each price range
SUPPLIER POWER
• Supplier power is very limited in India as the small scale
manufactures are very large in number
• There are about 675 members in ACMA which constitute about 85%
production of India

•Threat of New Entrants:
• The threat of New Entrants is low.• • Capital requirement is high
• Brand image and reputation of existing companies.
• Government regulations for entering into an industry.
•Threats of Substitutes:
• The Threat of Substitutes is low.• • There are many alternative types of Transportation such as Bicycles, motorcycles, trains, buses.
• Substitutes can rarely offer the same convenience.

'HERFINDAHL-HIRSCHMAN INDEX - HHI'
• Herfindahl-Hirschman Index is a measure of the size of firms in relation to the industry• and an indicator of amount of competition among them.
• A HHI index below 0.01 (or 100) indicates a highly competitive index.
• A HHI index below 0.15 (or 1,500) indicates an un concentrated index.
• A HHI index between 0.15 to 0.25 (or 1,500 to 2,500) indicates moderate concentration.
• A HHI index above 0.25 (above 2,500) indicates high concentration

HERFINDAHL INDEXAUTOMOBILE-CARS
Cars Sales Market share HHIDaewoo Motors 221.78 0.21 0.042579Fiat India Auto. 1,922.10 1.79 3.198162
Ford India 6,604.18 6.14 37.75603Gen Motors India 2,940.47 2.74 7.484832
Hind.Motors 722.89 0.67 0.452369Honda Siel Cars 3,936.85 3.66 13.41672Hyundai Motor I 22,103.48 20.57 422.9313Maestro Motors 2.2 0.00 4.19E-06Mahindra Reva 36.34 0.03 0.001143Maruti Suzuki 43,587.90 40.55 1644.676Pal-Peugeot 251.97 0.23 0.05496
Toyota Kirloskar 11,452.21 10.66 113.5343
Volkswagen Group 8,780.65 8.17 66.74241Volkswagen India 4,916.50 4.57 20.92477
107479.5 100 2331.216
Source=Capitaline.com


POLITICAL FACTORS
• In 2002, the Indian government formulated an auto policy that aimed at promoting integrated, phased, enduring and self-sustained growth of the Indian automobile industry
• Allows automatic approval for foreign equity investment up to 100% in the automobile sector and does not lay down any minimum investment criteria.
• Formulation of an appropriate auto fuel policy to ensure availability of adequate amount of appropriate fuel to meet emission norms
Economic factors
• Govt. has granted concessions, such as reduced interest rates for export financing.
• Indian Economy has grown at 9% rate over past 5 years, which drove increase in affordability in population of India. But the predicted growth rate for the current year 2014 is around 4.5% which has an huge impact on sales of passenger as well as commercial vehicles.

• Since changed lifestyle of people, leads to increased purchase of automobiles, so automobile sector have a large customer base to serve.
• Indian customers are highly discerning, educated and well informed. They are price sensitive and put a lot of emphasis on value for money
• Preference for fuel efficient cars with low running costs.
Technological factors
• More and more emphasis is being laid on R & D activities carried out by companies in India
• Customized solutions (designer cars, etc) can be provided with the proliferation of technology
• Internet makes it easy to collect and analyse customer feedback
• With the entry of global companies into the Indian market, advanced technologies, both in product
and production process have developed.
Social factors

• Legal provision relating to environmental pollution by automobiles.
• Legal provisions relating to safety measures.
Environmental factors
• Automobile industry in India in recent years has therefore started to give more importance to greener and eco friendly cars which will considerably reduce the level of carbon emissions
Legal factors
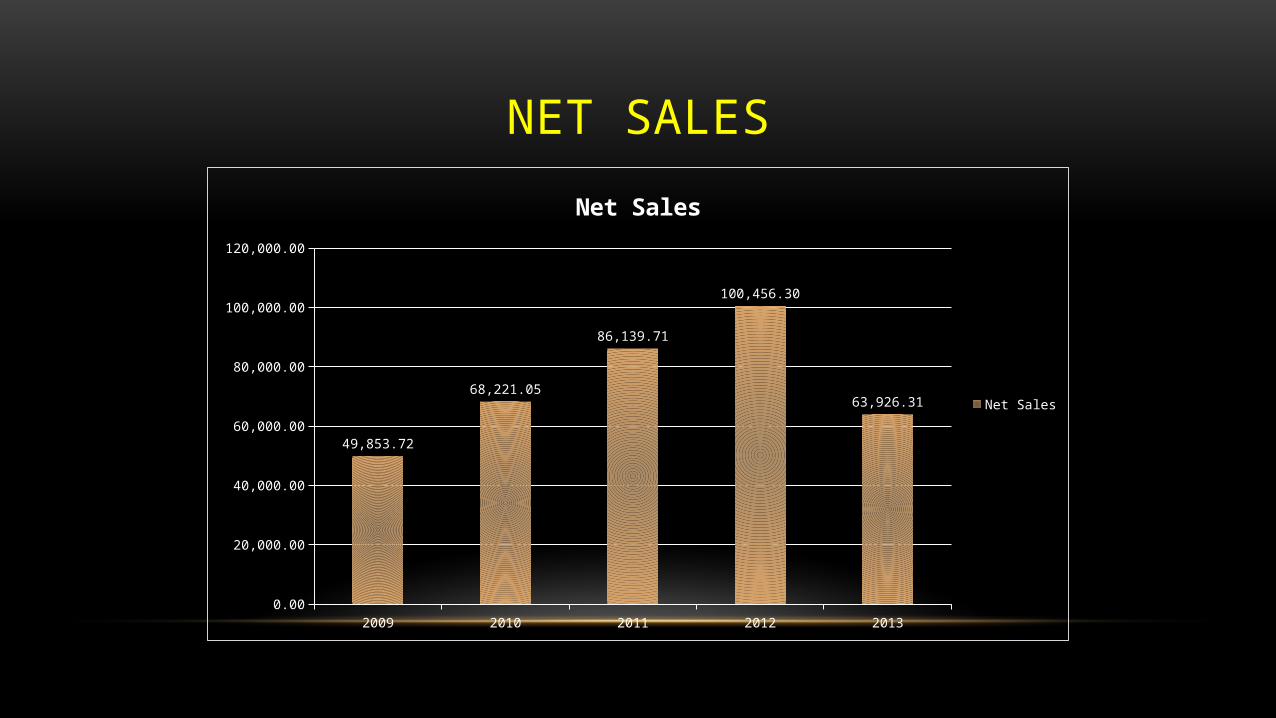
NET SALES
2009 2010 2011 2012 20130.00
20,000.00
40,000.00
60,000.00
80,000.00
100,000.00
120,000.00
49,853.72
68,221.05
86,139.71
100,456.30
63,926.31
Net Sales
Net Sales

R&D EXPENDITURE
2009 2010 2011 2012 20130.00
20.00
40.00
60.00
80.00
100.00
120.00
99.40
82.46
28.03
42.70 43.80
R&D
R&DLinear (R&D)
Year Net sales R& D R&D/Net Sales
2009 49,853.72 99.4 0.0020
2010 68,221.05 82.46 0.0012
2011 86,139.71 28.03 0.0003
2012 1,00,456.30 42.7 0.0004
2013 63,926.31 43.8 0.0007

EXPORTS
Year Exports Net Sales Export/ Net Sales2008-09 3,35,729 49,853.72 6.732009-10 4,46,145 68,221.05 6.542010-11 4,44,326 86,139.71 5.1652011-12 5,07,318 1,00,456.31 5.052012-13 5,54,686 63,926.31 8.68
2008-09 2009-10 2010-11 2011-12 2012-130
100,000
200,000
300,000
400,000
500,000
600,000
335,729
446,145 444,326507,318
554,686
Exports

OPERATING PROFIT
2009 2010 2011 2012 20130.00
1,000.002,000.003,000.004,000.005,000.006,000.007,000.008,000.009,000.00
3,180.74
7,111.397,870.77 8,092.81
5,765.78
Operating Profit
Year Net Sales Operating Profit OP/Net Sales
2009 49,853.72 3,180.74 0.064
2010 68,221.05 7,111.39 0.104
2011 86,139.71 7,870.77 0.091
2012 1,00,456.30 8,092.81 0.081
2013 63,926.31 5,765.78 0.090

PERFORMANCE ANALYSIS
India represents one of the world’s largest and fastest growing automobile markets
Increasing large middle class population, improving income levels and strong technological capability have been boosting automobile demand in the country for past few years.
The cumulative production data for April-March 2012 shows production growth of 13.83 percent over same period last year.
Passenger Vehicles segment grew at 4.66 percent during April-March 2012 over same period last year. Passenger Cars grew by 2.19 percent, Utility Vehicles grew by 16.47 percent and Vans by 10.01 percent during this period.
In March 2012, domestic sales of Passenger Cars grew by 19.66 percent over the same month last year.

CAR INDUSTRY PROFITABILITY ANALYSIS
Year Sales
Turnover Operating
Profit Net Profit margin
2004 20,534.69 2,281.86 11.11
2005 28,097.47 3,295.19 11.73
2006 33,893.95 3,751.99 11.07
2007 41,824.98 4,714.36 11.27
2008 48,940.20 5,588.30 11.42
2009 55,073.43 3,180.74 5.78
2010 74,037.23 7,111.39 9.61
2011 94,550.56 7,870.77 8.32
2012 1,07,945.30 8,092.81 7.5
2013 70,544.47 5,765.78 8.17
Latest 1,23,708.87 8,683.06 7.02 2004 2005 2006 2007 2008 2009 2010 2011 2012 2013 Latest 0
2
4
6
8
10
12
14
Net Profit margin

Year Sales (No. of units)
2007-08 15,49,882
2008-09 15,52,703
2009-10 19,51,333
2010-11 25,01,542
2011-12 26,18,072
2012-13 26,86,429
2007-08 2008-09 2009-10 2010-11 2011-12 2012-130
500,000
1,000,000
1,500,000
2,000,000
2,500,000
3,000,000
Sales (No. of units)
SALES GROWTH OF CARS

• Significant increase in volumes on MOM basis is something positive for the industry.
• In October 2013, few public sector banks announced cuts of around 0.2% in interest rates for autos
• New launches in 2013 have helped to beat the demand slowdown
FUTURE OUTLOOK

• Better mileage from new efficiency norms
• Government has announced to review the guidelines for passenger cars in 2016
• Exports are expected to increase by 11000 crore
• More improvement in research and development
FUTURE OF THE AUTOMOBILE INDUSTRY

CONCLUSION• The interim budget is positive for the auto industry.
• The growth till now is largely rural centric and festive season, the key trigger is likely to be product launches.
