automobility in india: a study of car acquisition...
TRANSCRIPT

Automobility in India: A Study of Car Acquisition & Ownership Trendsin the City of Surat
by
Ipsita Banerjee
A dissertation submitted in partial satisfaction of therequirements for the degree of
Doctor of Philosophyin
Engineering - Civil and Environmental Engineering
in the
GRADUATE DIVISION
of the
UNIVERSITY OF CALIFORNIA, BERKELEY
Committee in charge:
Professor Adib K. Kanafani, ChairProfessor Joan L. Walker
Professor Elizabeth A. Deakin
Spring 2011

Automobility in India: A Study of Car Acquisition & Ownership Trends in the City
of Surat
Copyright c© 2011
by
Ipsita Banerjee

Abstract
Automobility in India: A Study of Car Acquisition & Ownership Trends in the City
of Surat
by
Ipsita Banerjee
Doctor of Philosophy in Engineering - Civil and Environmental Engineering
University of California, Berkeley
Professor Adib K. Kanafani, Chair
Aided by economic development, India is undergoing rapid motorization. Growth ofcar ownership and use is attributed to rising per capita income and introduction ofmany car models are promoting the growth of ownership and use of cars. This growthportends a sea change in a country that relies mostly on non-motorized and publicmodes of transportation. It also signifies the transformation to a car based lifestyle ina country where motorized two-wheelers are the dominant personal motorized vehicle.
Such a transformation calls for various policy pertaining to auto-ownership thataim to i) reduce fuel emissions, ii) enable environmental protection, and iii) supportinfrastructure development. This research aims to support such policy developmentby providing information on the substitutions among various categories of motorizedvehicles owned by households. To this end, a primary survey was conducted in Surat,a prosperous, industrial city in western India in 2009. The survey involved homeinterviews of 196 motorized vehicle owning households.
The research explains the effects of increased per capita income and of the decreas-ing sizes of households on the composition of motorized vehicle fleet. The analysisinvolves econometric modeling supplemented with qualitative observations based oninterviews and interactions with the residents. The research focuses on the possibleshift from motorized two-wheelers to cars, and the substitutions among different sizesof cars. It reveals that household income is the key determinant of the number and thesizes of cars that households own, and that household size is a much less significantfactor; smaller vehicles are preferred even by larger households. Some of the possiblereasons for this preference are the relative expense of larger vehicles, lax enforcementof regulations allowing many more passengers than mandated by the seating capacity,and the need for maneuverability for driving in congestion and for parking.
An integrated choice and latent variable model is used to study the effect of dif-ferent attitudes on the type of vehicles purchased, such as new versus pre-ownedmotorized two-wheelers or different sizes of cars. The results reveal that underly-ing perceptions and cultural beliefs regarding the different modes of transportation,
1

attitudes on saving or spending money and similar subjective factors are not signifi-cant in explaining the type choice behavior of the households surveyed. Instead, themeasurable vehicle attributes, such as price and cost of fuel, and those of householdcharacteristics, such as household size, are what explains purchase behavior of thesehouseholds.
The contribution of this research is in analyzing the choice of car size categoriesin a developing country. In a single framework, it studies the substitutions amongi) motorized two-wheelers and different sizes of cars, and ii) between new and usedvehicles.
2

To my father.
i

Contents
Contents ii
List of Figures iv
List of Tables vi
Acknowledgements vii
1 Introduction 11.1 Background of Motorization in India . . . . . . . . . . . . . . . . . . 31.2 India in the Global Context . . . . . . . . . . . . . . . . . . . . . . . 51.3 Changing mode shares in India . . . . . . . . . . . . . . . . . . . . . 71.4 Different Car Size Categories . . . . . . . . . . . . . . . . . . . . . . . 81.5 Transport Characteristics . . . . . . . . . . . . . . . . . . . . . . . . 101.6 Salient Transportation Policies in India . . . . . . . . . . . . . . . . . 111.7 Research Questions and Methodology . . . . . . . . . . . . . . . . . . 13
2 Literature 142.1 Vehicle Type Choice . . . . . . . . . . . . . . . . . . . . . . . . . . . 142.2 Vehicle Type and Mode Choice . . . . . . . . . . . . . . . . . . . . . 152.3 Mode Choice Studies Conducted in India . . . . . . . . . . . . . . . . 172.4 Discussion . . . . . . . . . . . . . . . . . . . . . . . . . . . . . . . . . 19
3 Survey 213.1 The City . . . . . . . . . . . . . . . . . . . . . . . . . . . . . . . . . . 213.2 Population Charcteristics . . . . . . . . . . . . . . . . . . . . . . . . . 233.3 Travel Activity . . . . . . . . . . . . . . . . . . . . . . . . . . . . . . 253.4 Observations on Trip Characteristics . . . . . . . . . . . . . . . . . . 27
3.4.1 Work Trip Patterns . . . . . . . . . . . . . . . . . . . . . . . . 273.4.2 Education Trips . . . . . . . . . . . . . . . . . . . . . . . . . . 283.4.3 Maintenance Trips . . . . . . . . . . . . . . . . . . . . . . . . 283.4.4 Discretionary Trips . . . . . . . . . . . . . . . . . . . . . . . . 293.4.5 Travel Patterns of the Senior Male Member of the Household . 293.4.6 Women’s Travel . . . . . . . . . . . . . . . . . . . . . . . . . . 29
ii

3.5 Survey, Sample Size and Secondary Data . . . . . . . . . . . . . . . . 303.6 The Questionnaire . . . . . . . . . . . . . . . . . . . . . . . . . . . . 313.7 Details of Survey: Time and Duration . . . . . . . . . . . . . . . . . 323.8 Lessons Learnt . . . . . . . . . . . . . . . . . . . . . . . . . . . . . . 323.9 Secondary Data . . . . . . . . . . . . . . . . . . . . . . . . . . . . . . 333.10 Survey Validation, Data Entry, Cleaning, and Imputation . . . . . . . 34
4 Analysis of Vehicle Fleet Mix 354.1 Socio-economics of the Survey Sample . . . . . . . . . . . . . . . . . 354.2 Vehicle Ownership . . . . . . . . . . . . . . . . . . . . . . . . . . . . 384.3 Substitutions in the Type of Motorized Vehicle Ownership . . . . . . 464.4 Size Category of Car Owned . . . . . . . . . . . . . . . . . . . . . . . 494.5 Vehicle Purchase . . . . . . . . . . . . . . . . . . . . . . . . . . . . . 52
4.5.1 Likert Scale Questions for Attitude Analysis . . . . . . . . . . 554.5.2 Factor Analysis on the Likert Scale Responses . . . . . . . . . 564.5.3 Integrated Choice and Latent Variable Model . . . . . . . . . 584.5.4 Vehicle Choice . . . . . . . . . . . . . . . . . . . . . . . . . . . 594.5.5 Discussion . . . . . . . . . . . . . . . . . . . . . . . . . . . . . 63
5 Conclusions 645.1 Possible Use of Current Research and its Extensions . . . . . . . . . . 655.2 Need for Innovative Policy Framework . . . . . . . . . . . . . . . . . 665.3 Contributions . . . . . . . . . . . . . . . . . . . . . . . . . . . . . . . 67
Bibliography 69
A Car Size Categories 74
B Secondary Data on Socio-Economics, Vehicle Ownership and UseCharacteristics in Surat 78
C Survey Proforma 82
D Exploratory Factor Analysis 90
iii

List of Figures
1.1 Sales of cars and motorized two-wheelers 1980-2007, (SIAM, 2009). . 41.2 Motorization and economic growth in developing countries: 2002-2007,
logarithmic scale, (Kutzback, 2010). . . . . . . . . . . . . . . . . . . . 61.3 Trip shares of selected Indian and international cities; Indian cities
in descending order of population; Mumbai (16.3M) and Lucknow(2.26M). Sources: Pendakur (2002) for Mumbai, Delhi, Bangalore,Kanpur; and World Bank (2002) for Kolkata, Hyderabad, Pune, Luc-know; Ni (2008) for other cities. . . . . . . . . . . . . . . . . . . . . . 7
1.4 Percent trips by various modes in cities of different sizes (1998). Note:Intermediate public transport (IPT) includes both motorized and non-motorized modes. Source: (Associates, 1998) . . . . . . . . . . . . . . 8
1.5 Percent trips by various modes in cities of different sizes (2007) Source:(Associates, 2008) . . . . . . . . . . . . . . . . . . . . . . . . . . . . . 9
1.6 Trends in sales of cars of different sizes, 2001-2007 . . . . . . . . . . . 11
2.1 Research contributions . . . . . . . . . . . . . . . . . . . . . . . . . . 19
3.1 Zonal map of Surat . . . . . . . . . . . . . . . . . . . . . . . . . . . . 233.2 Trend in population and gender ratio in Surat . . . . . . . . . . . . . 243.3 Auto-rickshaw . . . . . . . . . . . . . . . . . . . . . . . . . . . . . . . 263.4 Unmarked parking . . . . . . . . . . . . . . . . . . . . . . . . . . . . 27
4.1 Age pyramid of the sample . . . . . . . . . . . . . . . . . . . . . . . . 364.2 Households owning vehicles in i) Urban Gujarat (Census 2001) and ii)
survey sample . . . . . . . . . . . . . . . . . . . . . . . . . . . . . . . 374.3 Car and motorized two-wheeler ownership before and after purchase . 394.4 Combinations of car and motorized two-wheeler ownership . . . . . . 404.5 Effect of household size and income on car and motorized two-wheeler
ownership . . . . . . . . . . . . . . . . . . . . . . . . . . . . . . . . . 414.6 Progression in household car and motorized two-wheeler ownership . 454.7 Household size and size of largest car owned . . . . . . . . . . . . . . 524.8 Car size categories purchased by car ownership . . . . . . . . . . . . . 544.9 Integrated choice and latent variable model . . . . . . . . . . . . . . . 59
iv

B.1 Distribution of households by sizes: i) in state of Gujarat from Census2001, ii) in sample . . . . . . . . . . . . . . . . . . . . . . . . . . . . 78
B.2 Average trip length by modes in Surat based on i) CRRI 1988 ii) CRRI2004 iii) CES 2005 iv) WS 2008 . . . . . . . . . . . . . . . . . . . . . 80
B.3 Average trip length by modes in Surat based on i) CRRI 1988 ii) CRRI2004 Studies . . . . . . . . . . . . . . . . . . . . . . . . . . . . . . . . 81
D.1 Scree plot . . . . . . . . . . . . . . . . . . . . . . . . . . . . . . . . . 95
v

List of Tables
1.1 Comparative statistics of India and other countries . . . . . . . . . . 51.2 Car size segments in India . . . . . . . . . . . . . . . . . . . . . . . . 10
3.1 Surat: summary of characteristics . . . . . . . . . . . . . . . . . . . . 223.2 Demographic data . . . . . . . . . . . . . . . . . . . . . . . . . . . . 243.3 Distribution of vehicle ownership in India (urban & rural), India (ur-
ban), and Surat (urban), Census 2001 . . . . . . . . . . . . . . . . . . 253.4 Secondary data sources . . . . . . . . . . . . . . . . . . . . . . . . . . 34
4.1 Income distribution of the sample compared with that of the popula-tion of Surat in 2004 . . . . . . . . . . . . . . . . . . . . . . . . . . . 37
4.2 Logit model on number of vehicles owned . . . . . . . . . . . . . . . . 444.3 Differing characteristics of households owning different vehicle fleets . 474.4 Logit model on the type of motorized vehicle owned . . . . . . . . . . 484.5 Car-ownership and household sizes of cars-only households . . . . . . 484.6 Car size categories . . . . . . . . . . . . . . . . . . . . . . . . . . . . 504.7 Logit model on the size category of a household’s largest car . . . . . 514.8 Statements with the highest loadings and names of the factors . . . . 574.9 Correlation matrix of the latent factors . . . . . . . . . . . . . . . . . 574.10 Choice and latent variable model on the recent vehicle purchase of a
household . . . . . . . . . . . . . . . . . . . . . . . . . . . . . . . . . 61
B.1 Distribution of households by home ownership status: i) in state ofGujarat from Census 2001, ii) in survey sample . . . . . . . . . . . . 79
B.2 Per capita daily trip rate from i) CRRI 1988, ii) CRRI 2004, iii) CES2005, iv) WS 2008 Studies . . . . . . . . . . . . . . . . . . . . . . . . 79
B.3 Average vehicle occupancy in Surat: CRRI 2004 Study . . . . . . . . 81
D.1 KMO Measure of Sampling Adequacy & Barlett’s Test of Sphericity . 90D.2 Communalities . . . . . . . . . . . . . . . . . . . . . . . . . . . . . . 91D.3 Total Variance Explained . . . . . . . . . . . . . . . . . . . . . . . . . 92D.4 Rotated Factor Matrix . . . . . . . . . . . . . . . . . . . . . . . . . . 93
vi
Acknowledgments
There are many that I would like to acknowledge for the completion of my dissertationand graduate studies. I will begin with my advisor, Professor Adib Kanafani. I owe alot to Adib, for his patience and understanding as I juggled school work with raisinga child. I appreciate the freedom he allowed me in choosing my dissertation topic andin deciding my approach to the research. His keen and perceptive advice has beenvery useful in shaping my research, and it is my honor to have worked with him.
I owe sincere thanks to my committee members, Professors Joan L. Walker andElizabeth Deakin. I could never thank Joan enough for the multiple times she helpedeliminate bottlenecks in my research. She is a great inspiration. This work wouldnot have been possible without Betty’s support. In addition to funding the fieldworkin Surat, she provided very timely advice, especially in helping me work through acritical issue with the survey team. Those were strange hours in the morning for heras she was in China, and I really appreciate her support. Dr. Lee Schipper providedmany references and contacts for the field work, as well as shared useful reports andsecondary data sources. Professors Samer Madanat and Mark Hansen provided usefulcritiques.
I am grateful to Mr. Bhisham Rai, Society of Indian Automobile Manufactur-ers, Mr. Jitendrasinh Vaghela, Regional Transport Officer, Surat, and Ms. AnumitaRoychowdhury, Centre for Science and Environment, for their help in secondary datacollection. Dr. M.P. Raju, Lea Associates South Asia Private Limited, and Dr. San-jay Gupta, School of Planning and Architecture, provided valuable inputs. ProfessorShivanand Swamy of Center for Environmental Planning and Technology, ArchitectsSnehal and Saloni Shah of S. Team Design Services, Mr. Heckson Christian of CurveConcepts, and Mr. Rikhav Shah helped organize the field work. Gaurav Joshi and hisfamily were instrumental in arranging for my accommodation in Surat and helpinglocate data sources. Thanks also to friends and colleagues, Uttam K. Roy, AqeelAhmad, and Akshat Jain for their help in selecting the study location. Dr. AnjanRay provided logistical support and very useful critique to the survey questionnaire.My landlord and neighbors in Surat were very supportive and made our stay in Surata really enjoyable experience.
I have had the honor of working with many bright and encouraging peers inBerkeley. I owe sincere thanks to my friends Avijit Mukherjee, Elliot Martin, GautamGupta, Edward Huang, Offer Grembek, Swati Pande, Aditya Medury, Akshay Vij,Eric Gonzales, and Jeff Lidicker for the many invaluable discussions. Jing Xiong, JoshPilachowski, Megan Smirti, Amy Kim, Nikolaos Geroliminis, Manish Shirgaokar, andTierra Bills provided useful input.
Finally, I would like to thank my everyone in my family for the love and support,especially my husband, Ayan, and son, Atri, who have been through each trial withme, and my father, whose pride and enthusiasm has helped me through the process.I am grateful for my husband’s unconditional support, for his ability to provide veryuseful suggestions, and for taking up more than his share of responsibilities even inthe most trying of times. Atri, then a four year old adjusted to Surat, a city unknown
vii

to us both and he did not even speak the local language! I am really grateful for thetrouble my father took in helping me set up in Surat. Finally, thanks to my extendedfamily for all the encouragement and logistical support, especially to Samik, for hishelp in planning all the travel.
viii

ix

Chapter 1
Introduction
Aided by its economic growth, India moves towards a car-based culture. Whilemost Indians still use non-motorized modes and those in the larger cities use publictransport, with the growth of the economy, personal motorized vehicle ownership andits use is growing rapidly. With the liberalization of markets in the nineties, leadingto the introduction of foreign competition and collaboration, consumerism began,spurred by the wide variety of goods in the market (Nagaraj, 2008). This boosted thegrowth of motorized vehicle ownership in India. Now, with the availability of easyfinancing with low-interests, and the growing purchasing power of the burgeoningmiddle-class, Indians are increasingly buying personal motorized vehicles, namelymotorized two-wheelers and cars.
Studies show that growth in income leads to growth in car ownership. As theeconomy of lower-income countries like India, with relatively uniform distribution ofincome grows, the growth in car ownership happens very rapidly (Kutzback, 2010).Congestion and its associated malaises, such as increased fuel consumption, emis-sions, and decreasing road safety, are unavoidable by-products of this growth. Yetthe benefits of motorized vehicles are many; motorized two-wheelers offer speed andflexibility of both time and route, increasing mobility and access to jobs and goods;cars, in addition to those benefits, offer greater safety to the passengers and increasedconvenience. As per the last census of the country taken in 2001, a mere 2.5 per-cent of the population owned cars and 11.7 percent owned motorized two-wheelers.Consequently, owning a motorized vehicle, especially a car, is associated with highsocietal status, and is the aspiration of the ‘have-nots’ in the country.
Policies being implemented have been dichotomous. On one hand, some manifestinterest in encouraging use of transit and non-motorized modes. On the other hand,others support the growth of the booming automotive industry that provides employ-ment to many and is a major support for the economic development of the country.Except for a negligible share of exports, most of the cars and motorized two-wheelersmanufactured in India are sold within the country. Policies that support the sales of
1

the personal motorized vehicles indirectly add to the growth in its ownership and sub-sequent use. This in turn increases congestion on the roads, affecting travel time byroad-based public transport more adversely than travel times by cars, and thereforecausing public transport to lose ridership to cars.
Infrastructure building in the country also follows a similar two-pronged approach.While bus rapid transit is being introduced in many cities with varying levels ofsuccess, highways, roads and flyovers are also being built to accommodate the growingnumbers of cars.
At the confluence of such growth and infrastructure building activities, it is im-portant to study the factors that affect the future composition of the vehicle fleet.As India moves away from public and non-motorized modes towards personal motor-ized modes, there is also a shift from owning motorized two-wheelers to cars. Thisphenomenon is in line with observations in other developing countries with rising percapita income. Furthermore, Indian consumers who could afford a personal motorizedvehicle, have so far bought new vehicles and held them for a long time (Roychowd-hury, 2007). This trend has also changed with the increase in consumerism andincreasing preference for owning the latest models. The share of used cars in the carsales figures has increased from half to two-third or more. Finally, Indian consumershave preferred small cars, those forming the majority of what the market offered fora long time. Now, with the introduction of many new models in various sizes, itremains to be seen whether the Indian consumer would continue to prefer the smallcars. Knowledge of the composition of the vehicles on the road would assist bothinfrastructure building and framing policies for reducing fuel use and emissions, andimproving traffic safety. Knowledge of the factors that influence this compositioncould be useful to policy makers for designing means to direct development towardsmore environment-friendly options.
Along with increasing income, the household structure of the Indian populationis also changing with traditional joint families giving way to nuclear families. Thegoal of this research is to study whether these changes would change the preferenceof personal motorized vehicle types. The research question that we aim to answerin this dissertation is: what is the effect of changing income and household size onthe vehicle ownership and purchase characteristics of the Indian citizen? To do that,we study the motorized vehicle fleet and recent motorized vehicle purchase of urbanresidents in Surat, a rapidly motorizing city in India. We obtain the data through asurvey of vehicle-owning households.
The outline of this dissertation is as follows: Chapter 1 describes the motivation,followed by the research question and the methodology. Chapter 2 describes previousstudies that the dissertation draws from, and finds the gap in the existing studythat this work aims to fill. Chapter 3 describes the survey process. Chapters 4and 5 describe the analyses of the vehicle type choice and observations on the travelcharacteristics of the survey respondents. Finally, Chapter 6 concludes the study with
2

a summary of main findings, their implications, and a description of the contributionsmade by this dissertation. Appendix A outlines some of the salient policies relatingto vehicle ownership and use in India. Appendix B appends secondary data on thesocio-demographics, vehicle ownership, and use characteristics of Surat. AppendixC contains the survey questionnaire. Finally, Appendix D outlines the details of theexploratory factor analysis process.
1.1 Background of Motorization in India
As a British colony, India witnessed the use of the personal motorcar from the earlypart of the twentieth century. Indigenous motorization had a modest beginning in1957, ten years after independence from British rule, with Hindustan Motors designingthe Ambassador based on the Morris Oxford Series II and Series III designs. The onlyother car in the market was the Premier Padmini, a Fiat 1100 assembled in India.Under strict government control of industrial production, these cars monopolized theIndian market for many years to come.
The Ambassador reached its peak sales in the seventies at 30,000 units per an-num. Until the 1980s, industrial production was still licensed and the car industrywas comprised of two models selling 40,000 cars a year. In February 1981 anotherindigenous automobile manufacturing company Maruti Udyog Limited was founded,and they built the then ‘people’s car’, the hatchback Maruti 800. Entering into ajoint venture with Suzuki they became Maruti Suzuki in October 1982. With thecars instantaneous popularity, the company captured a majority of the market sharein a very short while.
Liberalization of the economy took place in the early 1990s. Maruti continuedto be the market leader in the late 1990s and introduced new models to competewith foreign brands and other joint ventures. Tata Motors, a third Indian auto-manufacturing company, shifted its focus from building trucks to building SUVs andsedans. Car sales started on an increasing trend, along with that of the sales ofmotorized two-wheelers, and continued until 2002 (BBC, 2007) as shown in Figure1.1. The rapid pace of growth of the economy since 2002 became a source of additionalstimulus to the growth of motorized vehicle sales. Currently, India is the eleventhlargest passenger car market globally and the fourth largest commercial vehicle marketin the world. It is thus a good venue for a study of vehicle ownership and its use.
In the year 2005 through 2006, Maruti was the market leader controlling over halfof the market share. Hyundai Motors India Limited followed next with 19 percentand Tata Motors with 16.6 percent of the market share. HondaSiel cars India Lim-ited and Ford India Private Limited held a major share of the remaining market.In the SUV market, Mahindra & Mahindra Limited controlled 45 percent with theother major players being Toyota Kirloskar Motor Private Limited, Tata Motors, and
3

Figure 1.1. Sales of cars and motorized two-wheelers 1980-2007, (SIAM, 2009).
General Motors India Private Limited (SIAM, 2009). Concurrently, Audi, BMW,Chevrolet, Fiat, Mercedes, Mitsubishi, Skoda, Suzuki, Volkswagen, and Volvo haveset up manufacturing facilities in India. Manufacturers now import cars and sparesto meet the demands of this growing market.
India is the second largest two-wheeler market in the world. The sales of twowheelers have exceeded that of cars by multiples since the seventies. Until the mid-eighties however, there were very few competitors in that market. Scooters andmotorcycles were each manufactured by only three companies. With opening of themarket to foreign manufacturers and collaborators, many new models have been in-troduced. At present, the Indian market carries a wide range of two-wheelers thatinclude scooters, motorcycles, mopeds, electric bikes, and motorcycles with highervolume engines. (Automobileindia.com, 2009) It is postulated that a large segmentof the target consumers of the affordable Mini cars will constitute consumers who, inits absence, would have bought two wheelers. This large consumer base shifting tocars could cause drastic changes in the market and in mode shares. While the firstaffordable Mini car, the much publicized Nano by Tata Motors, did not contributesignificantly to the growth in car ownership, other small cars, priced both at and be-low the prices of cars in the market at present, are either being launched or would belaunched in the near future. Overall, the market share of cars is expected to increase.
4

1.2 India in the Global Context
Unlike the United States, growing demand of motorized vehicles in India is concen-trated in the urban areas. As per census 2001, 28 percent of the billion-plus populationof India lives in the urban areas of which more than 27 percent lives in the millionplus cities. The million-plus cities are expected to witness the fastest growth rates.Like most other developing economies, urbanization in India is taking place rapidly.
Table 1.1, presented below, compares the income, population, vehicles, and theirgrowth rates for India along with that of China and the United States.
Table 1.1. Comparative statistics of India and other countries
India China United States
PopulationTotal (billions, 2003) 1.14 1.33 0.3Growth rate (percent, 2000-2005) 1.5 0.7 1
Per Capita IncomeTotal (thousands, 1995 $ PPP, 2002) 2.3 4.3 31.9Growth rate (percent, 1960-2002) 2.3 6.5 2.1
Vehicles/1000 peopleTotal (2002) 17 16 812Growth rate (percent, 1960-2005) 6.8 9.8 1.6
VehiclesTotal (millions, 2002) 17.4 20.5 233.9Growth rate (percent, 1960-2002) 9.1 12 2.8
Growth rate: Annual Average Growth RateSource: UNFPA, State of the World Population 2003, (Dargay et al., 2007)
Table 1.1 shows that India’s rate of population growth is the highest among thethree countries compared. China exceeds India in the growth of per capita income,vehicles per thousand persons, and total number of vehicles. But India’s rate ofgrowth is still very high compared to that of more developed economies like theUnited States. In the ten years interval since 1995, the GDP of India has doubledand its annual sales of two wheelers and cars have tripled. From 1970 to 2000,motorized mobility or passenger-kilometers has risen by 888 percent, compared withan 88 percent population growth (Singh, 2006). Consequently, its fuel consumptionand emissions are also rising rapidly.
Studies link the rise in car ownership of a country to the increase in its percapita income (Button et al., 1993), (Dargay et al., 2007), (Gakenheimer, 1999).Figure 1.2 shows the motorization and economic growth in developing countries from2002-2007 (Kutzback, 2010). Among low-income countries, countries with less equalincome distribution like Nicaragua and Bolivia tend to have higher car ownershipthan the more equal societies of India. The order reverses for middle income countrieswhere the more equal societies have higher car ownership than the less equal ones.This is because, when income rises in countries with more equal income distribution,car purchases occur more quickly across a large share of the population, causing arapid increase in car ownership and use (Kutzback, 2010). The vehicle ownership of
5

Figure 1.2. Motorization and economic growth in developing countries: 2002-2007,logarithmic scale, (Kutzback, 2010).
India was at 17 vehicles per thousand persons as compared 812 vehicles per thousandpersons in the United States in 2002 (Dargay et al., 2007). Even in urban India, withhigher concentrations of motorized vehicles, only 5.6 percent of the Indian householdsin India owned cars, and 24.7 percent owned motorized two wheelers as per the Census2001. Making up rapidly in terms of growth in car ownership, the country’s volume ofsales in light vehicles is now projected to grow at 14.5 percent in the next five years,one of the fastest of all the developing economies. India is also developing as a carproducer being the eleventh in the world in the production of cars.
The used car market of India is growing faster than the new car market. Asof 2007, the sales of used cars to new cars was estimated to be 1:1, which is lessthan the global ratio of 2:1. This is primarily because Indians held their cars longer(Roychowdhury, 2007). Now with rapid introduction of new models and many Indianspreferring to own the latest models, the market for used cars is growing. Vehicledealers and media sources estimate the present ratio of used to new cars as 2.5:1.
Figure 1.3 compares mode shares in Indian cities with those of other world cities.All developing economies record higher percent of public transport and non-motorizedtrips, as compared to the developed economies that record higher percent of privatemotorized vehicle use. Among the Indian cities, public transport contributes more to
6

mode shares in bigger cities, and non-motorized modes contribute more to the modeshares in the smaller ones. A large majority of trips by private motorized modes inIndian cities are by motorized two wheelers.
Figure 1.3. Trip shares of selected Indian and international cities; Indian cities indescending order of population; Mumbai (16.3M) and Lucknow (2.26M). Sources:Pendakur (2002) for Mumbai, Delhi, Bangalore, Kanpur; and World Bank (2002) forKolkata, Hyderabad, Pune, Lucknow; Ni (2008) for other cities.
1.3 Changing mode shares in India
Mode share and proportion of passenger kilometers traveled by cars in India ismarginal. Of the total annual passenger kilometers traveled in 2001, India recorded21 percent of passenger kilometers in private motorized modes with 9 percent tripsby cars and 12 percent by motorized two wheelers. In comparison, United Statesrecorded 90 percent share of private motorized vehicles with 54 percent in passengercars and 36 percent in light trucks.
7

With the rise in car ownership, the mode share of cars is also increasing. Figures1.4 and 1.5 compare percent trips by various modes in cities of different sizes inIndia. Comparing between 1998 and 2007, it is evident that the percent car tripshave increased in all city types at the cost of public transport and non-motorizedtrips. This shift has been more marked in smaller cities.
Figure 1.4. Percent trips by various modes in cities of different sizes (1998). Note: In-termediate public transport (IPT) includes both motorized and non-motorized modes.Source: (Associates, 1998)
The anticipated rapid growth of car ownership and use (Padam & Singh, n.d.),(Sibal & Sachdeva, 2001) could amount to major changes in the modal shares. With-out policy interventions, there is likely to be a shift i) from non-motorized to mo-torized means of transport, ii) from public to private modes, and iii) from motorizedtwo-wheelers to cars. The ownership of used cars is also likely to rise. Since themodal composition affect the road capacity, emissions, and even safety, it is impor-tant to study the motivation for use of different types of personal motorized vehicles,including different sizes of cars.
1.4 Different Car Size Categories
Currently, there are eight different categories of cars in India. Of these, six categoriesare segregated on the basis of length. The remaining two categories are segregatedon the basis of weight and seating capacity. These are the Utility Vehicle (UV),
8

Figure 1.5. Percent trips by various modes in cities of different sizes (2007) Source:(Associates, 2008)
equivalent of the Sports Utility Vehicle (SUV), and the Multi-Purpose Vehicle (MPV),equivalent of the Minivan. Table 1.2 lists the number of models in each car segment,their respective five-year compound annual growth rate, the number of seats, andthe price of the category averaged over the constituent models in the category forSeptember 2009, concurrent with the study.
The constituent variants of a car model are considered together as one whenaccounting for the number of models. For example, the 3-series, 5-series, and 7-seriesin BMW, and the C-class, E-class, and S-class in Mercedes are each broadly consideredas one model. The numbers of models in this nascent market vary vastly across thedifferent size categories. Manufacturers assess the consumer demand for a particularsize category and launch models in the category. As such, the size categories withmore models are more popular. Until 2007, the Mini car segment comprising only onemodel, the Maruti 800, had shown a decline in growth with the five-year compoundannual growth rate (CAGR) being -11 percent. The introduction of the Nano byTata Motors in this size category, as the least expensive car in the world, led tospeculations on the projected consumer preference of the car over other pre-ownedcars available for the same price. The sales of this car was not enough to change themarket share of Mini cars, but other affordable, small cars poised to be launched inthe market may bring about some changes. The next size category, Compact cars, isubiquitous comprising half of the car market.
All categories other than the Mini car have positive five year CAGR with theExecutive category recording as high as 112 percent (Center for Science and Environ-
9

ment, 2008). The large growth in the higher priced Executive or Luxury car sectorsis due to their very low initial sales. The Executive, Premium, and Luxury class ofcars record low sales, owning to their prohibitively high prices. These are also evidentfrom Figure 1.6, that plots the sales in the different car size segments from 2001 to2007.
The prices of different models in the same car size category vary widely, leadingto an overlap in the prices of the models across the categories. For example, the priceof the BMW 3-series or the Mercedes Benz C-class in the Executive size category isequal to the average price of the Premium size category. Typically, the average priceof a particular size category increases with size. The two exceptions to this rule arethe Minivan and the SUV. The average price of the Minivan is lower than that ofthe Compact car category although the size is larger as evident from the number ofseats. The average price of the SUV is higher than than of the Midsize and lowerthan that of the Executive category, although its size and seating capacity are largerthan both categories. The price of each size category is presented in 2008 dollars atpurchase power parity. The price in dollars at purchase power parity indicates therelative expense of buying cars in India.
Appendix A shows the basis for classification of the different categories, called‘segments’ in India, along with the names of the constituent models in September2009, concurrent with the field data collection for this research (Nations, 2011).
Table 1.2. Car size segments in India
Number Five year Compound Average‘Segment’ of Annual Growth Rate Seats Price (in
Models (CAGR) percent 2008 $ PPPA1 Mini 2 -11 4 11900A2 Compact 18 22 4 25200A3 Mid-size 15 19 4 36000A4 Executive 11 112 5 82900A5 Premium 11 6 5 184900A6 Luxury 4 33 5 499820B Utility Vehicle/Sports
Utility Vehicle48 16 7-13 57200
C Multi-PurposeVehicle/Minivan
3 6 5-8 19850
1.5 Transport Characteristics
India has its unique transport characteristics that influence the nature of trips madeand vehicles purchased by households. Most developments are dense with mixed landuse; neighborhood grocery and provision stores, and vendors selling fresh produce oncarts, are still prevalent over consolidated departmental stores. As a result, grocerytrips are everyday walk trips. Roads are congested; there are no marked lanes and
10

Figure 1.6. Trends in sales of cars of different sizes, 2001-2007
lane driving is not common; the traffic consists of a mix of different motorized andnon-motorized modes. Additionally, marked slots for parking are also not present atmost locations. All of these factors make it easier to maneuver smaller vehicles.
Safety norms are often flouted due to relatively lax enforcement of regulations.Vehicles are frequently overloaded; small businessmen carrying goods on bicyclesor motorized two-wheelers, or householders carrying a family with young childrenon motorized two-wheelers are common sights; riders of motorized two wheelers orbicycles often do not wear helmets and drivers commonly use their cellular phoneswhile driving.
Private transport in general and cars in particular are expensive to own and use.A trip made by public transport is substantially less expensive than the fuel costof the same trip made using personal car or motorized two-wheeler. However, sincelabor is inexpensive, many car-owning households employ drivers.
Household sizes are large with a prevalence of traditional joint families, the mem-bers of which frequently make discretionary trips together. Informal social trips arefrequent between neighbors, friends, and relatives, especially in smaller cities andolder neighborhoods.
1.6 Salient Transportation Policies in India
In the last couple of years, several new transportation policies have been implementedin India. Some of these support sustainable, transit oriented development and dis-courage private motorized vehicle use. Yet others support the booming automobileindustry of the country.
11

The Jawaharlal Nehru National Urban Renewal Mission (JnNURM) was launchedin 2005 to improve urban infrastructure and service delivery mechanisms. It wasaimed to improve community participation and accountability of urban local bodiesor parastatal agencies towards citizens. Beginning from the year 2005-06 the windowof this mission is open until 2011. It aims to invest a total of INR 120,536 crore (28billion USD) in urban infrastructure in 63 cities across the country. The program hastwo parts: one focuses on services for the urban poor and the other on infrastructuredevelopment. The latter is administered by the Ministry of Urban Development(MoUD) and includes among others, projects in road network and urban transport.
The same ministry also launched the National Urban Transport Policy (NUTP) inmid-2006. This policy was created to improve access to the growing number of urbanresidents to work, education and recreation. It was further aimed to enable peoplecentric developments instead of developments that are centered on improving condi-tions for private motor vehicles. It recommends integrated land use and transportplanning, equitable allocation of road space, priority to public and to non-motorizedtransport, coordinated planning, and association with the private sector, and dis-courages use of personal motor vehicles. After the launch of the NUTP, a decisionwas made for all urban projects that receive financial assistance from JnNURM toconfirm to NUTP. This policy motivates cities to implement bus rapid transit (BRT)along with other sustainable transport solutions.
Taxes and excise are structured to discourage ownership of ‘big cars’. Vehicleslonger than 4 meters and engines above 1200 cc for gasoline based engines and above1500 cc for diesel based engines are classified as big cars. At present, the excise dutyon big cars is 22 percent whereas that on small cars is 10 percent. There is also a taxworth INR 15,000 on big cars.
While developing policies that encourage public and non-motorized modes oftransport, the government has also developed policies to boost the growth of theautomobile industry. The Automotive Mission Plan 2006-16 aims at doubling thecontribution of the automotive sector in GDP by taking the turnover to 145 billionUSD in 2016 with special emphasis on export of small cars, vans, two wheelers andauto components. The plan outlines policies to boost the industry that include fiscalincentives, education and training, enhancement of transport, communications andexport infrastructure (Government of India, 2006).
In end-2008, the government reduced excise duty on cars and two wheelers by 4percent to aid the struggling industry in the middle of recession. The Reserve Bankof India lowered policy rates and other banks followed. At the time of the launch ofthe affordable small car, the Tata Nano in 2009, the State Bank of India had loweredinterest rates on car loans to 10 percent. The income eligibility of car loans for thiscar has also been relaxed from INR 1,00,000 to INR 75,000.
The National Highway Authority of India (NHAI) has been instrumental in de-veloping, maintaining, and managing a national network of intra and interstate high-
12

ways. Since its opening in 1995, it has undertaken major road initiatives such as theGolden Quadrilateral, North-South and East-West Connectors and Port Connectivityprojects. While this does not affect urban trips, it may be expected to increase thenumber of road tripsl.
1.7 Research Questions and Methodology
This dissertation aims to answer the question: what is the effect of changing incomeand size of household on vehicle ownership and purchase characteristics of the Indiancitizen? Given the landmark changes expected in motorized vehicle ownership inIndia, and the unique characteristics of the Indian culture, urban environment, andtransportation, studying vehicle ownership and use in India justifies itself in manyways. The knowledge of the factors affecting vehicle ownership and purchase decisionswill help framing policies that are best for the community and the environment.Correct prediction of future vehicle composition will assist policy decisions relatingto infrastructure, energy, emissions, and road safety.
This research is based on observations and interviews, as well as findings from dataanalysis and models. The methodology and the survey questionnaire are based on thefindings of earlier studies of similar nature that we will discuss in Chapter 2. A studyof this nature has not been undertaken in India or other developing economies before,possibly because it was not as relevant even some years ago, and primarily because ofthe challenges of obtaining the data required. The data and observations are obtainedfrom a survey conducted in late 2009 in the city of Surat, a fast-motorizing, second tiercity with population over four million. The survey involves home interviews of 196vehicle owning households. Through broad statistical analysis, we identified manyof the important factors that affect the nature of vehicle ownership and purchase.We then used models to assess the extent to which each factor affected the variousdecisions. Data limitations due to the small sample size were overcome by analysison aggregate level.
The contribution of this research is in analyzing preference among car categoriesin a developing nation. We study the substitutions across motorized two-wheelers anddifferent car categories, as well as between new and used vehicles in a single frame-work. Chapter 2 discusses the existing literature on this topic and better explainsthe relevance of the present research.
13

Chapter 2
Literature
In this chapter, studies on vehicle choice and mode choice are reviewed. While ve-hicle choice is the focus of the research, the few studies based in developing economiesmostly address vehicle choice along with vehicle use or mode choice. There are manystudies based in India that shed light on the effect of owning cars and motorized two-wheelers on mode choice. Only one Indian study directly addresses vehicle choice.
These are the three sections in which the literature is categorized:
1. Vehicle type choice
2. Vehicle type choice along with vehicle use or mode choice
3. Mode choice studies conducted in India
2.1 Vehicle Type Choice
This discussion focuses on the type choice of a single vehicle. Most studies on the typechoice of a single vehicle are based on new vehicle purchase, while some are basedon the choice of the most expensive or most frequently used vehicle in the householdfleet. Some of the studies focus on the details of makes, models, and vintages, whileothers focus on the choices of vehicle classes.
The multinomial logit (MNL) model is most commonly used in studies on vehicletype choice. Among the explanatory variables, the vehicle attributes of purchase price,operating cost, number of seats, luggage space, vehicle weight, and age are typicallyfound to be explanatory (Berkovec & Rust, 1985), (Mannering & Mahmassani, 1985),(Mannering & Winston, 1985), (Manski & Sherman, 1980), (Martin, 2009). Thetwo household attributes that are found to influence vehicle type choice in many ofthese studies are income and the number of household members (Bunch, 2008). In
14

many studies, one or more vehicle attributes are interacted with socio-demographicattributes to explore the change in preferences with change in socio-demographics.The interaction of income with vehicle price is a typical example. Some studiescapture the effect of the household size on vehicle choice (Kitamura et al., 2000),(Lave & Train, 1977). Lave and Train find that increasing household size decreasesthe probability of a household owning a sports or a specialty vehicle. Kitamura et.al. find that it has a positive effect on the choice of vans and wagons. Kitamura et.al.also explore the effect of transit accessibility and find that four door sedans, vans,and station wagons tend to be favored in areas with public transit access, while SUVand trucks are favored in the metropolitan fringe. In studying the choice of makesand models, Mannering and Winston find the effect of brand loyalty to be substantial(Mannering & Winston, 1985). Manski and Sherman find the effect of transactionsearch cost to be an important explanatory variable in household vehicle holdings(Manski & Sherman, 1980). The increase in the share of used vehicles of all vehiclesales in India leads to the hypothesis that there has been a change in transactioncost, and is a potential subject of interest in a study of vehicle purchase, holding,and scrappage. Choo and Mokhtarian explore attitude and lifestyle preferences inthe form of attributes like subjective and objective mobility, travel liking, attitudes,personality, lifestyle and demographics. They find that owners of cars of differentsize categories vary in many of attitude and lifestyle preference factors (Choo &Mokhtarian, 2004).
Specification issues are a concern for the MNL models due to the independenceof irrelevant alternative (IIA) property of these models (Train, 2003). Manneringand Mahmassani, while not specifically addressing IIA, find that vehicle attributesare valued differently for foreign vehicles than they are for domestic vehicles (Man-nering & Mahmassani, 1985). Nested multinomial models and mixed logit modelshave been used in choice model literature to deal with IIA violations. Additionally,nested multinomial models have also been used to model the joint probability of twodecisions. For example, Berkovec studies the choice of the number of vehicles ownedat the upper level, and of the type choice among 131 vehicle classes and vintages atthe lower level (Berkovec, 1985).
2.2 Vehicle Type and Mode Choice
Some studies of vehicle choice, specifically those in developing economies, cover boththe choice of modes and vehicles. Besides addressing vehicle choice, some studiesresearch the number of miles traveled on each vehicle in the household fleet. Someof them estimate the two choices separately while others estimate them in a singlemodel framework.
The three studies based in developing economies estimate the two choices usingseparate models. Ni, in his study on motorization pathways, vehicle purchase, and use
15

behavior in Shanghai, estimates MNL models for the most expensive vehicle owned,and the most frequently used mode for weekday and weekend travel. He conductsa factor analysis on Likert scale questions exploring attitudes and preferences, anduses the output to analyze choice of the most expensive vehicle owned. He findsgender, income, and the perceived effect of status to have significant effects on vehiclepurchase and use behavior (Ni, 2008). Joewono, Susilo and Mohamad calibrate anordered probit model to study the number of vehicles per household. They furthercalibrate multinomial logit models for choice of vehicle type and vehicle brand anda regression model for car use in Kuala Lumpur region and its surroundings. Theyfind that lower salaried households prefer motorcycles and that households in generalprefer the national vehicle brand (Joewono & Susilo, 2008).
Srinivasan et.al. find in their study of Chennai city conducted between 2004 and2005, that income, presence of female workers, and of school age children lead toincreased probability of a household owning a car. Their study of longitudinal dataof the current year, and that of five years before, capture some of the key transitionsin the Indian society, for example, decreasing family sizes and increasing participationof women in the workforce. Their key findings are that peer pressure and credit cardholdings influence car ownership positively; households with grocery stores or marketsnearby are less likely to acquire cars than other households; and the propensity tobuy motorized two-wheelers or cars is the largest among households that did notown motorized two-wheelers or cars respectively five years earlier. Given that manyhouseholds possessed motorized two-wheelers and more than seventy percent of thehouseholds did not possess a car, the authors conclude that car ownership may growfaster than motorized two-wheeler ownership in the future (Srinivasan et al., 2007b).
The studies discussed in the remaining part of this section are those in whichestimation of vehicle type choice and mode choice are combined. These are based onthe premise that vehicle ownership and mode choice decisions are made endogenouslyand that treating one of these as exogenous in the decision process of the other leadto inconsistent estimation of model parameters (Train, 1980).
Lerman and Ben-Akiva, and Ben-Akiva et.al. (Ben-Akiva et al., 1976), (Lerman &Ben-Akiva, 1976), model the joint probability of owning a certain number of vehiclesand taking a certain mode to work. Lerman and Ben-Akiva formulate a variablefor the remaining income in which considerations of the total income, the number ofhousehold members, and the number of vehicles owned gives a value for the disposableincome. However, the value estimated for the variable is approximate since vehiclemakes and models are not considered separately. The authors find that introducingnew transit service to areas can have a measurable decreasing effect on auto ownership,but the effects on auto ownership of improvement in existing transit is marginal.
Train estimates a model of automobile ownership, and a work-trip mode choicemodel conditional on automobile ownership level. The models are estimated sepa-rately but are connected through an aggregate work trip utility term estimated as
16

a part of the auto ownership model (Train, 1980). Dissanayake and Morikawa, intheir study of Bangkok Metropolitan area use a nested logit model in which the up-per level represents vehicle ownership types and the lower level represents work tripmode choices for two worker households. Because the sharing of a vehicle is verycommon in developing countries, the authors consider trip chaining by two householdworkers as one of the mode choice options.They find that the presence of schoolchil-dren in households increases the probability of owning cars (Dissanayake & Morikawa,2002), Dissanayake & Morikawa (2003).
Although the combined estimation framework is adopted to eliminate the endo-geneity between vehicle choice and mode choice, none of the studies conduct anytests to demonstrate the existence of such endogeneity. It may be argued that othervariables like location of residence or work, or the decision of whether or not to workis also endogenous to vehicle ownership and mode choice. Additionally, combinedestimation models have their limitations too. Many of the studies do not attempt toseparate variables that affect only vehicle ownership or mode choice but not both.While Train’s model allows use of a separate set of variables to explain vehicle owner-ship and mode choice, in Ben-Akiva’s model, the same set of variables explains both.Ni, in his estimation using separate models find that purchasing a car is positivelyassociated with household income; however, weekday car use is positively associatedwith personal income (Ni, 2008). It is also challenging to capture the effect of ahousehold vehicle ownership decision on the mode choice of all household members.
Based on our review, the longitudinal study conducted by Srinivasan et.al. isthe only one study on vehicle choice in India. For further information on the trans-portation characteristics of India we reviewed some mode choice studies that discussthe influence of the type of vehicles owned. We summarize these studies in the nextsection.
2.3 Mode Choice Studies Conducted in India
Most of the studies in this section discuss the differing effects of the ownership of carsand motorized two-wheelers on mode choice. Sarna, in his study based on a surveyconducted in 1969-70 in Delhi, finds that households with more motor vehicles recorda higher percent use of private motor vehicles as compared to the use of transit orbicycles (Sarna & Sarin, 1985). Parida et.al. infer that a very small percent of thosewho owned a car or owned both a car and a two-wheeler used public transport inDelhi, which implies that people owning cars are almost captive to their own modes.However, a fair share of those who owned a two-wheeler alone used public transport(Parida et al., 1993).
Different studies explore the concept of captivity due to ownership or lack thereofof private vehicles. Srinivasan et.al. stratify the sample of survey respondents in
17

Chennai based on the extent of captivity, namely availability of private vehicle as amodal option for the commuter (Srinivasan et al., 2007a). Chari and Khanna defineworkers using a government or company vehicle for the work journey as captive anddo not include them in modeling mode choice (Chari & Khanna, n.d.).
Saleh and Sikdar find from a survey of Guwahati conducted in 1991-92, that mostmodes have their characteristic lead distance within which they are used the most.Trip data suggests that transit is the choice for large household size, low-incomegroups and long distance travel for households without vehicles. Self-driven vehicleis more appropriate to small household size, high-income groups and medium traveldistance (Saleh & Sikdar, 1996).
On the basis of a survey conducted in Ahmedabad in 1972-73, Chari and Khannafind that car owners have the highest value of time, followed respectively by twowheeler owners, bicycle owners and those who do not own any vehicle. They also findthat people who walk or ride bicycles have the greatest propensity to shift towardsbus use (Chari & Khanna, n.d.).
Arasan, Rengaraju, and Krishna Rao, observe in their study of Tiruchirapalli inthe mid-1990s that the demand for travel by bus with respect to travel time is highlyelastic for both owners of motorcycles and that of cars. This indicates that a reductionin travel time by bus may result in a substantial shift of travelers to the bus frompersonal transportation modes. The authors further observe that in India, motorizedvehicle ownership is an index of the economic status of the households (Arasan et al.,1998).
By means of a stated preference study conducted in Hyderabad in 2004, Gorhamet.al. explore the possibility of personal vehicle users shifting to buses. They findthat all else being equal, as levels of vehicle ownership rise, households become moresensitive to time and reliability and less sensitive to cost. They also find for all groupsthat reliability is a more important criterion than time and that buses suffer from animage problem. Even after controlling for time, cost and reliability, vehicle ownersprefer their own vehicles and non-vehicle owners prefer to walk (Gorham et al., 2004).
Based on the analysis of a survey conducted in Chennai in 2005-06, Srinivasanet.al. observe significant differences in two-wheeler and four wheeler use propensitiesdue to income, vehicle ownership, length of commutes and costs. The authors findthat the sensitivity to travel time and cost vary across different user groups basedon captivity status and work distance. Subjective ratings of comfort, reliability, andflexibility affect the choice of public transportation modes. The authors further findthat of the different road users, motorized two-wheeler and bus users are likely to beaffected by an increase in fuel price, vehicle ownership, and by transit improvementmeasures (Srinivasan et al., 2007a).
Rajagopalan and Srinivasan study mode choice and modal expenditure in adiscrete-continuous framework based on the Chennai Household Travel Survey data
18

(2004-05). They find that the four-wheeler owners show stronger preference for per-sonal vehicle and informal public transport (IPT) usage while two-wheeler ownersexhibit positive preference for public transport and IPT. Increased congestion onroads increases a household’s modal expenditure on trains and decreases that on pri-vate vehicles. Poor pedestrian safety levels reduce the household’s marginal utilitiesfor public transport and increases usage tendencies for personal vehicles and IPT.Finally, state dependence or inertia in mode switching is evident among all modeusers but households that previously chose bus have a tendency to spend on personalvehicles instead (Rajagopalan & Srinivasan, 2008).
2.4 Discussion
In addition to identifying factors for input into the survey design, the literature re-viewed provides a datum with which to compare the findings of the present study.Studies based on developed economies infer that changes in size of the household, ac-cessibility to transit, and different attitudes and perceptions, are some of the variablesthat cause households to own and purchase different size categories of cars. From thestudies on developing economies we find that higher income households own cars andlower income households own motorized two-wheelers. Most studies concur that in-creased ownership of motorized vehicles, especially cars, is associated with reduceduse of public transport. In the present research, we will update these findings basedon the analysis of the survey data obtained from Surat, a rapidly motorizing city ofpopulation over four million.
Figure 2.1. Research contributions
Review of the literature on vehicle choice, and vehicle and mode choice, revealsthat while studies on vehicle choice in developed economies focus on the choice among
19

makes and models, or size categories of cars, that in the developing economies re-searches the choices across the broad categories of car, motorized two-wheeler, andbicycle etc. There is no study that researches the substitutions across car size cate-gories as well as motorized two-wheelers, a research necessary in the present contextas cars take away from the shares of motorized two-wheelers. Additionally, none ofthe studies reviewed, research substitutions across new and used vehicles. In thiswork, we study the substitutions across i) different size categories of cars and motor-ized two-wheelers, in addition to that between ii) new and used motorized vehicles.This integrated framework is important to observe the substitutions by affordablemini cars being introduced in the market, in the share of motorized two-wheelers andof used vehicles Another important contribution of this research is in studying vehiclepurchase in developing economies. Figure 2.1 represents the research contributionsof this study.
20

Chapter 3
Survey
The data for the research was obtained through a survey conducted in the cityof Surat in western India. The city well represents the issues of growth in personalmotorized vehicle ownership, having witnessed its sharp rise due to a rapid growthin per capita income. Home-interviews were conducted from July through October2009 and the respondents interviewed on their recent vehicle purchase, existing vehiclefleet, demographic composition of household, and the previous day’s travel diary. Therespondents also expressed their opinion on a set of Likert scale questions relating totheir attitudes and perceptions on status, peer influence, image and convenience ofpublic and non-motorized modes, and on cost and utility consciousness. This chapterincludes a discussion of the following:
• City characteristics as obtained from previous studies on the city
• City characteristics as obtained from observations and interviews
• Details of the survey
3.1 The City
Surat is situated in the west coast of India at the mouth of the river Tapi. Located inthe state of Gujarat, it is 270 km to the north of Mumbai. It the 9th most populatedcity in India (Parimal, 2001). With its annual population having grown at aroundsix percent since 1960, the city is projected to double its population by 2021 (Pai,n.d.). The city has extended its boundaries several times since then, of which themost recent extension took place in 2006. Table 3.1 shows the area and population inthe 2001 city limits, and that in the extended 2006 city limits, based on the previouscensus. The table also cites the 2009 population estimates.
21

Table 3.1. Surat: summary of characteristics
Area and Population Value
Population 2.43 millionMunicipal Area (2001) 112.28 square kilometerMunicipal Area (2006) 326.52 square kilometerPopulation of extended municipal area 2.88 millionPopulation 2009 (estimated) 5.06 million
The city is characterized by a large number of small and medium unorganizedindustries. A major manufacturing center, the economic base of Surat comprisestextile manufacturing, diamond cutting and polishing, intricate ‘zari’ (gold and silverthread) works, chemical, petrochemical, and natural gas industries. Special economiczones, in which industries are exempt from duties, tariffs and many of the taxes, arebeing set up in and near the city to further boost its industrial development. Thediamond factories of Surat constitute 42 percent of the world’s total rough diamondcutting and polishing, while the textile factories constitute 40 percent of the nation’stotal synthetic fabric production (CEPT and Urban Initiatives, Surat, 2004).
The municipal area is divided into seven administrative zones. The traditional oldcity with narrow alleyways, one-way streets, and old houses constitutes the centralzone of the city. Most of the government offices are housed here in historical buildings.The other six zones surround the central zone. Of these, the more affluent residentslive in the southwest zone and some in the west zone across the river. The east zonehouses the laborers with the lower literacy and income, of which many are diamondcutters and textile workers. The south zone is mostly industrial. Eight bridges acrossthe river connect the main development on the south and the east of the river to thaton the west and the north. Figure 3.1 shows the zonal map of Surat.
22
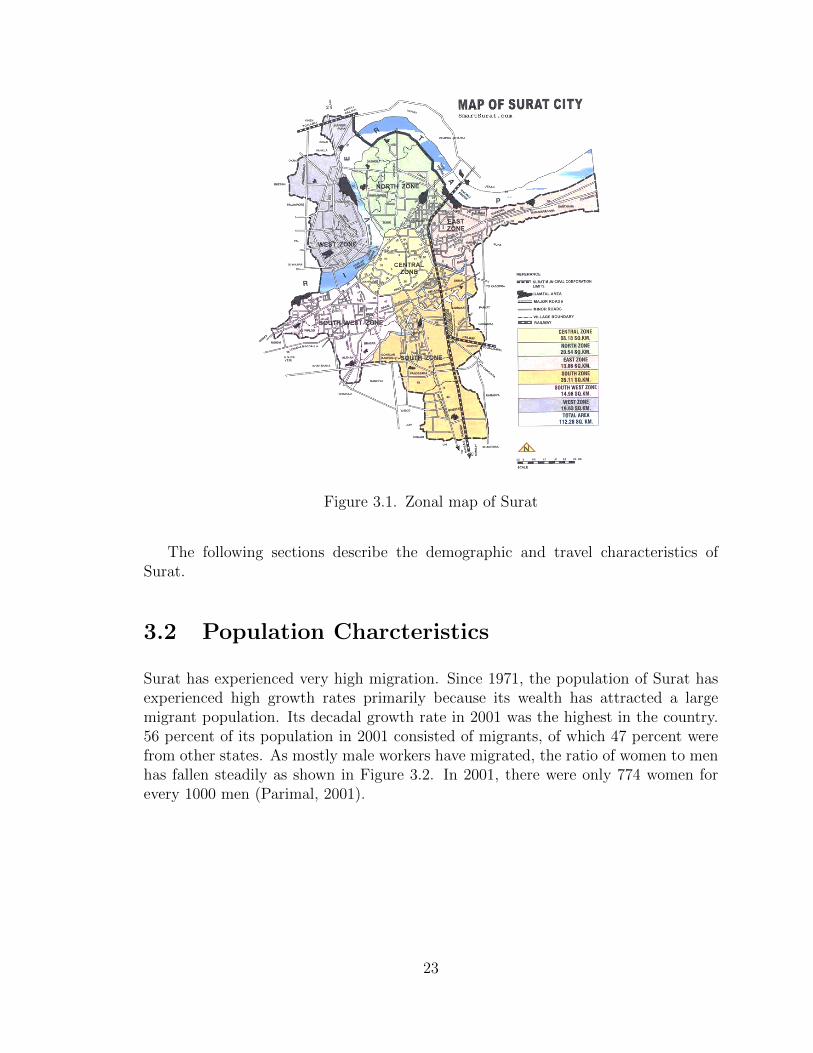
Figure 3.1. Zonal map of Surat
The following sections describe the demographic and travel characteristics ofSurat.
3.2 Population Charcteristics
Surat has experienced very high migration. Since 1971, the population of Surat hasexperienced high growth rates primarily because its wealth has attracted a largemigrant population. Its decadal growth rate in 2001 was the highest in the country.56 percent of its population in 2001 consisted of migrants, of which 47 percent werefrom other states. As mostly male workers have migrated, the ratio of women to menhas fallen steadily as shown in Figure 3.2. In 2001, there were only 774 women forevery 1000 men (Parimal, 2001).
23

Figure 3.2. Trend in population and gender ratio in Surat
In India, the participation rate of women in the workforce rose from 14 percentto 26 percent over the past 30 years. Comparatively, the participation rate of womenin the workforce in Surat was only 8 percent in 2001. Since a recent study of travelbehavior in India has found households with female workers more likely to buy a car(Srinivasan et al., 2007b), changes in ratio of females to males and in the female workforce participation rates are potentially important factors affecting trip making andvehicle buying characteristics. Some key demographic characteristics of Surat arecompiled in Table 3.2 (Parimal, 2001).
Table 3.2. Demographic data
Year Population Decadal growth rate Gender ratio Female WFPR Male WFPR
2001 2,433,785 62 percent 774: 1000 8 percent 61 percent
The census on urban households in the state of Gujarat, in which the city of Suratis located, lists the number of households of different sizes. Households with 6 to 8members consist nearly a quarter of all households. Together with the 4 to 6 personhouseholds, they comprise nearly seventy percent. 73 percent of the households owntheir residence while only 23 percent rent, the remaining having other dwelling optionssuch as employer provided housing. The number of vehicles in the city has grownfrom 0.29 million in 1991 to 1.5 million in 2009 due to the rapid addition of motorizedtwo-wheelers and car. Of all vehicles registered, the share of motorized two-wheelershas changed from 78.6 percent in 1994 to 79.1 percent in 2009, while that of cars hasgrown from 7 percent to nearly 10 percent. In 2009, there were 335 personal motorizedvehicles per thousand persons but only 35 cars and jeeps (Regional Transport Office,
24

Surat, 2009), (?). Table 3.3 compares the ownership of different personal vehicles inthe city of Surat, urban India, and India total (urban & rural) (Parimal, 2001). Sincevehicles are concentrated in urban areas, a higher percent of residents of Surat as wellas urban India owned vehicles at the time of the last census. While the car ownershipof Surat approximated that of urban India, a much higher percent of Surat residentsowned motorized two-wheelers compared to urban Indians overall, and a much lowerpercent owned bicycles.
Table 3.3. Distribution of vehicle ownership in India (urban & rural), India (urban),and Surat (urban), Census 2001
Vehicles India (urban & rural) 2001 India (urban) 2001 Surat (urban) 2001Households percent percent Households percent
Bicycle 83,838,450 43.7 46 182,396 37.2Motorized two-wheeler 22,484,686 11.7 24.7 156,013 31.8Car 4,801,899 2.5 5.6 26,889 5.5
Total 191,963,463 100 100 489,969 100
3.3 Travel Activity
Three wheelers known as ‘auto-rickshaws’ provide informal public transport in thecity. A typical three-wheeler is shown in Figure 3.3. They are widely availableand serve all neighborhoods. These vehicles are lightweight, but with inadequatevibration dampers, sound proofers, and shock absorbers. They offer three differenttypes of services. ‘Private’ or ‘special’ auto-rickshaws have flexible routes and areless expensive to hire than taxicabs. Drivers usually serve passengers from the fixedneighborhood where their ‘stand’ or ‘stop’ is located. Usually ‘private’ three-wheelersalso offer hired service in return for a monthly wage. The most common instance ofthis is children’s transportation during school and after-school hours. The third three-wheeler service moves on fixed routes. Called ‘shuttle’ or ‘shared auto-rickshaws’ theystop along the way to pick up or drop off passengers, and usually proceed on theirroute only when their vehicle is full. They are inexpensive and are mostly used bylower-income workers or young students.
Since 2007, Surat has city bus services that are operated by private contractorson a route contract basis. The Surat Municipal Corporation allocates routes andservices. However, buses are rarely used within the city. They are believed to beinefficient and unreliable.
Information on the travel activity of Surat is based on data obtained from fourtransportation studies of the city conducted by three different consultants (Rayle,n.d.), (Associates, 2008), (Rayle & Pai, 2010). Central Road Research Institute
25

Figure 3.3. Auto-rickshaw
conducted a study in 1988 and another in 2004. Consulting Engineering Servicesconducted a study in 2005. Finally, Wilbur Smith Associates conducted a study in2008. These four studies are good references that form a datum for the present study.Details of travel behavior and mod share obtained from these studies are in AppendixB.
In 1986, the municipal area of Surat was expanded to 55.56 square kilometers fromthe initial 111.16 square kilometers. The 1988 study by the Central Road ResearchInstitute captured the trip lengths of the residents during and shortly after the ac-quisition of additional area. However, it is the 2004 study that captured the impactof this acquisition, a possible reason being that, by then the newly acquired areadeveloped and integrated with the main city. Trip lengths by all modes increased.The length of the private car and bus trips more than doubled. However, the modeshare of buses fell to less than half its original share in this interval while that ofcars doubled. As such, more people were driving longer distances by cars than ridingbuses for long distances.
The average vehicle occupancy of cars at 1.25 passengers is only slightly abovethat of motorized two-wheelers at 1.11 passengers. This indicates that there is alarge number of drive alone car trips similar to the more motorized western countries.Informal public transport in the form of three-wheeled auto rickshaws have higheroccupancy levels of 2.65 for the privately hired auto-rickshaws and 3.42 for the sharedor ‘shuttle’ auto-rickshaws.
As with most Indian cities, Surat has inadequate enforcement of traffic laws,signage and road marking. Parking is mostly on street, informal, and high density,
26

Figure 3.4. Unmarked parking
with double, triple, or more tiers of parking being prevalent, as shown in Figure 3.4.It is easier to find a gap for parking motorized two-wheelers and small cars as parkinglocations do not have demarcated slots for vehicles. For an Indian city of its size,Surat has many flyovers and a bus rapid transit system is being introduced. Theresidents of Surat take pride in their city being one of the cleanest in India. Themunicipal corporation has been very efficient especially in cleaning up the city afteran epidemic of plague in 1994. It has successfully maintained the standards, despitethe city being affected by floods every couple of years.
3.4 Observations on Trip Characteristics
Traditions, culture, as well as the built environment of a city lead to the unique trip-making characteristics of its residents. During the home interviews we observe thefollowing trends among the households in Surat.
3.4.1 Work Trip Patterns
A majority of those surveyed are owners of businesses of various sizes, from largediamond businesses to neighborhood level small laundry and clothes ironing services.For them, a typical work day starts before 10 am and ends beyond 6 pm, with a lunchtrip home between 1 pm and 3 pm. Since the work is shared in a family business,
27

household members, usually brothers, split the time among themselves. Businessmensometimes work through the weekend.
Salaried workers, especially those employed in the government, have shorter workhours. Their work sometimes includes commuting to the various office locations ev-eryday. Work related trips are common overall. Commuting between office locationsand various clients is a part of the job of some government or privately employedworkers; Business owners in the textile market make multiple work related walk tripswithin the extended market area. The east zone in Surat houses diamond polishers,who are daily wage earners paid by the number of diamonds they polish. They workthe longest hours and are the poorest of the laborers. Their workdays often start at 6am and end as late as 11 pm. They and other low-income salaried workers frequentlywork over weekends.
While in many Indian cities workers typically use employer-provided vehicles,there are very few instances employer provided vehicle use in our sample of mostlyprivate business owners. Some salaried workers working in the distant industrial zoneof Hazira, use their company-provided buses to commute.
3.4.2 Education Trips
A child’s school day starts with the onward trip at 6:30 am and the return trip atnoon or 1 pm. Younger school children usually travel in groups of six or more bymeans of a hired three-wheeler or a minivan service that is paid on a monthly basis.Some students also travel by school buses and others are transported to and fromschool by parents on their motorized two-wheelers. Older schoolchildren ride theirbicycles to school. Most children attend after-school preparatory classes in the earlyevening, which is again served by the three-wheelers or vans.
College going students drive motorized two-wheelers, share rides with classmates,or take the ‘shuttle’ auto-rickshaw or the bus.
3.4.3 Maintenance Trips
Local grocery and convenience shopping trips are typically everyday walk trips. Oc-casional motorized vehicle trips are made to the departmental stores which offer agreater choice of brands, for buying items in bulk. The high-density mixed land usefosters more walk trips and less trips by cars or informal public transport. However,since even the specialty stores may be accessed by a short trip on the motorized ve-hicle, even the specialty shopping trips are made relatively frequently, possibly moreso because of lower participation of women in the work force, which allow more timefor household chores. Comparing with a city in which the commercial land-use iszoned separately from the residential land-use, and that which has more female work-
28

ers, would help assess whether it is the mixed land use or the lower participation ofwomen in the work force that affect the frequency and mode choice of maintenancetrips.
3.4.4 Discretionary Trips
The religious trip is the most common discretionary trip. Many Hindu residents ofSurat stop by the neighborhood temple early in the morning or on their way to workand Muslims frequent the mosque. Religious trips with family and friends are commonoutings and sometimes such outings involve long distance trips. Social trips form theother major discretionary trip category, with frequent, informal interactions betweenneighbors, relatives and friends. Others discretionary trips are those to the movietheaters, the beach, the malls or the traditional markets. Car-owners use their carsfor this purpose. Trips for physical fitness or outdoor sports purposes are negligible.Intercity trips are usually rail-based.
Among children’s trips, apart from after-school preparatory classes, there arefew examples of regular organized discretionary activities that need transportation.Informal play in the neighborhood is the most common activity.
3.4.5 Travel Patterns of the Senior Male Member of theHousehold
In business-owning households, the male head of the household sometimes retireswhen his sons begin to work in the business. The retirees typically do not use mo-torized vehicles with most of their trips being short, walk trips. Their travel consistsof trips to the neighborhood park, social trips, or everyday grocery shopping. If thesenior male continues to work, his work trips follow the typical work trip pattern withshorter work hours in the case of a family business.
3.4.6 Women’s Travel
Most women in our survey sample are homemakers. Their travel consists of daily walktrips to the local grocery, vendor or convenience store, dropping off kids to school or toafter school classes on their motorized two-wheelers, and occasional specialty shoppingtrips. Younger women or those from lower income households ride their motorizedtwo-wheelers or sometimes hire a three-wheeler, whereas those from higher incomehouseholds either ride their chauffeur-driven cars or drive themselves. Women mostlydrive smaller vehicles and cars, with maneuverability being the primary consideration.Lower participation of women in the workforce lead to fewer trips for childcare, for
29

carry-outs and eating outside, and fewer trip chains for workers to pick up groceryon their return trip.
3.5 Survey, Sample Size and Secondary Data
While home interview surveys are logistically harder to conduct, (Cherry, 2007), itwas the chosen means of surveying for the present research. This is because this studyaims to capture characteristics of households that have recently bought new motorizedvehicles. Since motorized vehicle ownership especially car ownership is low, addressesof households that had recently purchased a motorized vehicle were obtained fromgovernment and private sources. 3000 addresses compiled from different sources weresorted by the seven different municipal zones and by the type of vehicle bought,for example, new motorized two-wheeler or used compact car. We aimed to getrepresentative surveys of all vehicle types from each zone, and to capture a samplesize proportional to the total number of households in the zone. As we intended tocapture the effect of vehicle acquisition on the household trips, we surveyed a set ofhouseholds that have obtained their vehicle shortly before the survey, assuming nomajor change in household socio-demographic structure, work or residence locationcould have occurred in the interim period to distort the effect. Since the scope ofour survey was limited to household vehicle use, we typically eliminated vehicles thatwere registered to a business. Small business owners often used their vehicles bothfor business and household purposes. We included their instances in our survey.
Since the survey started in August, we chose households that had bought newvehicles since April 2009. The mini car Nano by Tata Motors was launched in themarket at this time. However, our data collected so shortly after its launch holdsonly a negligible sample of households that acquired this car.
For the study of vehicle ownership, we interviewed other vehicle-owning householdthat had not purchased new vehicles in the study period. We surveyed 128 householdsthat had acquired new or used vehicles since April 2009, and 68 households that hadnot.
Besides the face-to face interview that we conducted,the following methods ofsurvey were considered: a) drop off and mail back or pick up survey, b) telephoneinterview survey, and c) internet based survey. Literature on earlier survey studiesrevealed that the response rate depends on the method of disbursement of the surveyquestionnaire. Ni used internet-based surveys in Shanghai, China, successfully (Ni,2008). Muralidhar et.al. found telephone interview, drop off and mail back to beunsuccessful in Thane, India (Muralidhar et al., 2006). Based on the suggestionsof the local surveyors and past experience, face to face interview was used as theprimary method of survey. Most Surat residents were hospitable to the surveyors.However, the surveys were more succcessful if the respondent was approached at his
30

home, and less so if the survey team tried to arrange for an appointment beforehand.In instances when it was especially difficult to interview the head of the householdduring regular hours, survey questionnaires were dropped off to be picked up later.Telephone interviews were mostly used as a follow-up for survey validation or furtherclarification.
We interviewed the vehicle buyer and his household members in their homes or,if necessary, in their workplaces. An interview took 25 minutes on average.
3.6 The Questionnaire
While the focus was on the study for the present reserach on vehicle ownership andpurchase, the survey questionnaire also included questions on trip patterns for use infuture reserach. Questions were asked on the following broad subjects:
New vehicle purchased : Details of the new vehicle purchased, such as make andmodel, fuel type, and new or pre-owned, were noted.
Existing vehicle fleet : Make, model, and year of purchase of all vehicles ownedwere noted along with availability of parking at home.
Socio-economic details : The age, gender, and occupation of all members of thehousehold were recorded.
Previous day’s travel diary : Details of the previous day’s travel, i.e. purpose,mode, destination, and time of travel were noted for all the members of the household.
Likert Scale questions : The respondents were asked to express their opinion onvarious statements relating to different attitudes and perceptions of the respondentson a five point scale: definitely agree, somewhat agree, neither agree nor disagree,somewhat disagree, definitely disagree. Some of these statements were inspired bystatements from a similar survey conducted in Shanghai (Ni, 2008). The respondentwrote his own responses to this section and then marked the income category that hebelonged to. The respondents were given the options of responding to this section inone of three languages, English, Hindi, and Gujarati.
The type of dwelling unit, for example: apartment or single family house, and theownership type, for example: owned or rented, were noted to validate the responseson stated income. Due to lack of data on transit accessibility, respondents were askedhow long it took to walk to the nearest auto-rickshaw or bus stop. Before embarking
31

on the actual survey, the survey questionnaire was pre-tested on various respondentsboth within and outside the study city and modified to adhere to cultural norms andminimize survey duration. Appendix C shows the final survey questionnaire.
3.7 Details of Survey: Time and Duration
The interviews were conducted from August through October 2009. Households whohad obtained new vehicles between April and September 2009 were surveyed. Vehi-cle purchase in Surat is marked by seasonal variations. Traditionally, the monsoonmonths, or Shravan, are a period of high sales in Surat. This is followed by a fort-night of Shraadh, which has traditionally been a period of low sales. Shraadh leadsto Navratri marking the beginning of the festive season and the highest volumes ofsales and registrations of vehicles. Most Surat residents adhere to these norms intheir purchase behavior. Since our study period spanned both the high and low salesperiod, such seasonal variations did not affect the survey process.
3.8 Lessons Learnt
The survey faced its share of challenges. These are outlined along with some sugges-tions for overcoming them, with the intent that future researchers would take thesefactors into account when planning their survey.
As mentioned, since motorized vehicle ownership is low in India, a random surveywould have produced a negligible sample of new vehicle buyers. As such, addressesof such buyers needed to be obtained in advance. The addresses being proprietaryinformation, multiple endorsements and authorizations were needed to obtain those.
While electronic records of purchase and registrations could be obtained for buyersof new vehicles, those of used vehicles were non-electronic. Hand written registrationentries in bound volumes were manually sifted through, to arrive at the 200 recordsof vehicles that had undergone a transfer of titles to a second owner after April 2009.This process was time-consuming and tedious.
Locating the addresses of the vehicle buyers on ground was an involved process,since Surat, like many older Indian cities, follows an arbitrary system of numberingplots. Addresses are located by the proximity to a neighborhood landmark, which issometimes difficult to locate. Occasionally, the addresses listed are of businesses orresidences under construction or uninhabited. The additional time for locating suchaddresses needed to be built into the survey process. We also needed to build in thetime spent in locating those addresses in which the households either did not respond,or gave incomplete responses to the interview.
32

We were especially interested in interviewing the male head of the household,as typically he was the most knowledgeable about the new vehicle purchased. Wesucceeded in interviewing them in the surveys we conducted before 9 am or after 6pm, and those we conducted over the weekends. Weekends are fewer in Surat as onlythe second and the fourth Saturdays of the month are observed as holidays besidesall Sundays. Additionally, some laborers and private business owners worked overthe weekends. While there were many religious and cultural holidays observed at thetime of the survey, they were not ideal for conducting surveys as the residents eithertraveled or socialized with family and friends during those times. We supplementedour early morning and late evening surveys with surveys conducted during lunchtime,as most workers came home for lunch. Outside of these times, we mostly interceptedthe women and children in the household. To obtain the responses of the male headfor these households, we either followed up with a second visit to the household attheir suggested times, or interviewed them at their workplace after obtaining theaddress from other household members. Because of these reasons, each survey tooklonger to complete.
The respondents were sometimes concerned that the information they revealed tothe survey group might reach the tax authorities. As such, they were cautious aboutany indication of their wealth. Many suppressed information on their householdincome levels and some about their recent vehicle purchase.
The biggest challenge faced was that the survey organizations, paid by the numberof forms they filled, had little interest in the outcome of the survey and the qualityof the data. The employees conducting the surveys obtained a minimal share ofthe payment, which further decreased their interest in accuracy and data quality.Rigorous supervision was required to ensure data quality, and as a result only a smallsample could be obtained. To motivate the surveyors to follow procedure and obtainaccurate information, future surveys could include an additional amount per form tobe paid to the surveyor once the forms were checked and found to be satisfactory. Inlight of the issues outlined, it is useful for outside or foreign researchers to conductsurveys collaboratively with an ongoing survey conducted by a local group, so thatthe interest in data quality is shared. Alternatively, it is imperative to work witha local contact known personally to a member of the research group, whose advicecan be trusted in matters relating to finance and labor rules. It is also advisableto adhere to formal legal contracts. In the case of informal contracts, a system ofdaily or weekly payments, in place of a lump-sum payment would minimize the lossto either group in the case of a disagreement.
3.9 Secondary Data
We obtained supplementary secondary data from various sources. The data obtainedand their sources are listed in Table 3.4.
33

Table 3.4. Secondary data sources
Data type Data source
1 New vehicle prices by makes and models; showroomprice, registration and taxes
Vehicle dealers
2 Used vehicle prices by makes, models, vintage andkilometers on vehicle
Authorized used vehicle dealers
3 Number of different vehicles registered Regional Transport Office4 Fuel costs Fuel stations5 Fuel consumption: values certified by Automotive
Research Association of IndiaSociety of Indian Automobile Manufacturers
6 Zonal distribution of households; zonal densities andschedule of parking rates
Surat Municipal Corporation
7 Details of vehicle loans Housing Development Finance Corporation8 Details of vehicle insurance Axis Bank9 Public transport: routes and fares Regional Transport Office10 Fares of informal public transport Informal public transport operators
3.10 Survey Validation, Data Entry, Cleaning, and
Imputation
We validated the household surveys by follow-up telephone calls in which we askedabout the vehicles owned, number of members in the household, occupations, andprincipal work destinations. This method worked for validating the vehicle ownership,household socio-demographic and trip information. The Likert scale questions couldnot be validated as the responses would change based on the respondent, and couldeven change for the same respondent at different times.
The raw data from the survey forms was transcribed into Excel 2007. Afterconverting the data to electronic format, each field was filtered for outliers. Next, 20household entries were randomly selected and each field checked to ensure that all theinformation was consistent. For any field for which the information did not fit thatfor the rest of the household, the entries were re-checked and re-entered in the correctsequence. There were some fields for which the data entered was exceptionally sparsedue to multiple no-responses. Depending on the type of analysis, we either did notuse the fields that had more than 20 percent of missing data or in some cases cutdown further on the sample size to use only those entries that had responses for thespecific field. For example, of the 196 households, only 116 had stated their income.Where possible, we used car ownership as a proxy for income as we had completeinformation for that field. For the models in which income was a better explanatoryvariable, we used logistic regression to impute the missing income values, using homeownership, type and zone of residence, and the number of years the household hasowned the newest and the oldest car in the fleet, as explanatory variables.
34

Chapter 4
Analysis of Vehicle Fleet Mix
Analysis of survey data sheds light on the numbers and types of vehicles owned bya household, and on the type of vehicle recently purchased by some households. Thesample consists of 196 motorized vehicle-owning households. Of these households,128 had purchased a motorized vehicle since April 2009 and the other 68 had not.Before discussing the analysis, it is useful to discuss the socio-economic characteristicsof the survey sample. Comparing these characteristics with those of the populationin Surat enables better understanding of the social stratum that the vehicle owningpopulation studied belongs to.
The analysis begins with a study of the various factors that affect ownership ofmotorized two-wheelers and cars, and the factors that influence the transition fromowning motorized two-wheelers to owning cars. We next explore the size of car owned.For households owning more than one car, we study the size of the largest car owned.The final analysis is a study of the purchases made by a subset of these households insome months before the survey, and the various factors that affect the purchase. Allanalyses involve statistical analysis of data including the estimation of choice models,and qualitative observations based on the interviews.
4.1 Socio-economics of the Survey Sample
The two dynamic factors that influence vehicle purchasing and ownership behaviorare the size and the income of a household. Per capita income is rising rapidly withthe improvement of the economy. Household sizes continue to be larger than those inmore industrialized nations, but they are declining over time with more householdsopting for a nuclear family instead of the traditional joint family structure. Theaverage household size is 5.19, and that obtained in 2001 for the urban populationof India was 5.1 (Government of India, 2001a). 57 percent of the households in thesample are traditional joint families with more than one married couple or more than
35

two generations living in the same unit. Appendix B contains the details of thedistribution of households of different sizes both in the survey sample, and in thestate of Gujarat.
Summing over all members of the hosueholds surveyed, a gender ratio of 845women per 1000 men is obtained. This is larger than that obtained for Surat fromCensus 2001. Section 3.2 suggests the large proportion of male immigrants in thepopulation as the reason for there being only 774 women for every 1000 men inSurat. The difference in gender ratio between that obtained for the survey sampleand in the Census 2001 could be due to a change in the demographic structure since2001. A more likely reason is that the sample of motorized vehicle-owning householdssurveyed has a negligible number of immigrant male-only households. Figure 4.1plots the gender and age distribution of the sample. The age pyramid representingmotorized vehicle owning, higher income households in Surat is more ‘constricting’compared to the present age pyramid of India, and highly similar to the age pyramidof more industrialized nations with low birth and mortality rates. The bulge of thepyramid lies in the age ranges of 17 and 31.
Figure 4.1. Age pyramid of the sample
35 percent of the household members in the survey sample are workers comparedto 32 percent for the urban Indian population in 2001. 64 percent of the householdssurveyed own cars and 94 percent own motorized two-wheelers. As per Census 2001,5.5 percent of the population of Surat owned cars and 32 percent owned motorizedtwo-wheelers. Assuming that the purchasing power of Surat residents have increasedsince 2004, the households surveyed would belong to the top two quintiles of the pop-
36

ulation. Figure ?? compares the distribution of vehicle ownership in urban Gujaratas per Census 2001 with that of the households surveyed in Surat. The sample over-represents car owners and does not represent households that do not own motorizedvehicles.
Figure 4.2. Households owning vehicles in i) Urban Gujarat (Census 2001) and ii)survey sample
Table 4.1 compares the income categories of the 59 percent of the sample thatstated their income with that obtained for the city in 2004 (CEPT and Urban Ini-tiatives, Surat, 2004). Assuming that the income distribution has remained constantbetween 2004 and 2009, 89 percent of the households surveyed belonged to the mostaffluent 7 percent of the Surat residents. However, since income is rising rapidly, thesurvey samplewould now represent a larger percent of the population. The incomecategory ‘less than 120,000’ is an aggregate of more than four categories in the 2004study. Thus the income quintiles for the 11 percent of the survey sample belongingto the ‘less than 120,000’ income category remains indeterminate.
Table 4.1. Income distribution of the sample compared with that of the populationof Surat in 2004
Income Distribution of Sample Income Distribution of Surat, 2004Annual Income Ranges (’000 INR) Percent Annual Income Ranges (’000 INR) Percent
Less than 120 11 Less than 25 60120-360 57 25-50 27360-1500 14 50-75 51500-3000 12 75-100 13000-15000 5 100-150 115000-30000 1 150-200 3- - More than 200 3
Income ranges may also be assessed from the home ownership, type of residence,and location in the city. While the percent of households owning their dwelling unitwas 73 in the state of Gujarat (Government of India, 2001c), that in our motorized
37

vehicle-owning sample is much higher at 94. The remaining 6 percent of householdsin our sample mostly live in rented houses and occasionally in employer-providedhousing. Motorized vehicle owners live in four types of residences: bungalows, rowhouses, apartments and ‘gala types’. 1 26 percent of the households surveyed livein bungalows, 23 percent in row houses, 33 percent in apartments, and 18 percentin ‘gala type’. The wealthiest households live in bungalows with the exception ofthe households in the southwest zone, of which many wealthy households also livein apartment complexes. Many of these apartment dwellers are more affluent thanresidents of bungalows in some of the other zones. Apartments also house mediumincome households such as small business owners or salaried persons, especially inzones other than the southwest zone. The row house owners form the next categoryin terms of their wealth and the ‘gala type’ houses the least wealthy. Exceptionscan be found especially in the central zone in which, households that have alwayslived in a ‘gala type’ of residence continue to live in their traditional home even afterbecoming affluent.
The first three residential types typically provide abundant parking space. Bunga-low owners have drive yards or paved front yards to park their vehicles. Ground-levelfloors of apartments are dedicated to parking and the cost of the parking space isincluded in the maintenance fee. Vehicles are parked in the unmarked and unpavedstreet shoulder or on the semi-private access street in front of row houses. The onlyresidential type with a relatively inconvenient parking situation is the ‘gala type’, inwhich bicycles and motorized two wheelers are sometimes kept inside the house in ahallway or under the staircase. These households mostly park their vehicles on thepublic road or its shoulder abutting their home.
Excel 2007 was used for the data analysis, along with SPSS 17, and MATLAB7.7.0. BIOGEME 2.0 and Python BIOGEME 1.8 are used for estimating the choicemodels. Different subsets of the data is used for the different analyses. The anal-ysis of number of vehicles owned and of transition from motorized two-wheeler tocar ownership is done using the sample of 112 households that stated their incomecategory. The analysis of the largest car owned by the household includes the 123households that owned cars. Finally, the analysis of vehicle purchase is done on the128 households that had purchased a vehicle in the last few months.
4.2 Vehicle Ownership
The sample consists of households that have and ones that have not made recentvehicle purchases. For the households that made a recent vehicle purchase, we count
1The ‘gala type’ of residence is old-style vernacular architecture similar to a smaller row housewithout the front and rear setbacks. The word may have its origin in the word ‘galo’ in Gujarati, thelocal language, which means ‘a narrow bay’ and roughly translates to a plot of land with a narrowfrontage.
38

the recently purchased vehicle with the rest of the vehicles in the fleet. All householdssurveyed own either one or more motorized two-wheelers or cars or both, the numberof cars ranging from zero to four and that of motorized two-wheelers ranging fromzero to six. Figure 4.3 shows the number of households owning different numbersof cars and motorized two-wheelers before and after purchase. Post-purchase, whilethe maximum number of cars owned increases from three to four, that of motorizedtwo-wheelers owned remains at six. Households with no cars constitute the largestshare before purchase and those with one car, the largest share after purchase. Post-purchase, 71 percent of the car owning households own one car. Households owningtwo motorized two-wheelers continue to hold the largest share both before and afterpurchase.
Figure 4.3. Car and motorized two-wheeler ownership before and after purchase
Figure 4.4 shows the various combinations of number of cars and motorized two-wheelers owned by the households surveyed. The number of motorized two-wheelersthat households own increases with the number of cars owned, up to two cars. Beyondtwo cars, the number of motorized two-wheelers owned drops with the increase in thenumber of cars owned. The majority in the sample own zero or one car, and up tothree motorized two-wheelers.
The correlation between the number of cars and motorized two-wheelers ownedby households is low (correlation coefficient: -0.028). We next examine the numberof cars and motorized two-wheelers owned by a household and the influence of thefollowing factors:
• income
• size of the household
• zonal density
• typology of residence: ‘gala type’
39

• accessibility to transit and informal transit
Figure 4.4. Combinations of car and motorized two-wheeler ownership
Income and size of household are the two dynamic socio-demographic factors in theIndian society with incomes increasing with the economic development of the countryand household sizes reducing with more households choosing to live as a nuclearover a traditional, joint family (Government of India, 2001b). Household annualincome is noted in six categories that range from ‘below INR 120,000’ to‘15,000,000- 30,000,000’. The sizes of households vary from one to twelve persons. Increasein household size would increase the need for mobility and the number of personalvehicles owned. Increase in income will raise the affordability of households to buythe additional vehicle. Broadly, the price of the least expensive, commonly ownedcompact car is the same as that of five motorized two-wheelers of average prices.Motorized two-wheelers being far less expensive compared to cars, an increase inincome is not as important for a household to own an additional motorized two-wheeler, for the income category surveyed. Also, while only one car would sufficeto hold three or more adults going to the same destination, two separate motorizedtwo-wheelers would be needed to serve the same trips. The numbers of motorizedtwo-wheelers owned are likely to be more sensitive to an increase in the size of thehousehold. Figure 4.5 shows the average car and motorized two-wheeler ownershipfor households of different income and size.
The four plots suggest the following: that car ownership increases with increasein household income and motorized two-wheeler ownership increases with increase inhousehold size. Additionally, household size affects car ownership to a much lesserextent than does income. In addition to the reason that cars have capacity to carryseveral extra persons over motorized two-wheelers and are as such less sensitive toincrease in the household size, this is also explained by the fact that cars are much
40
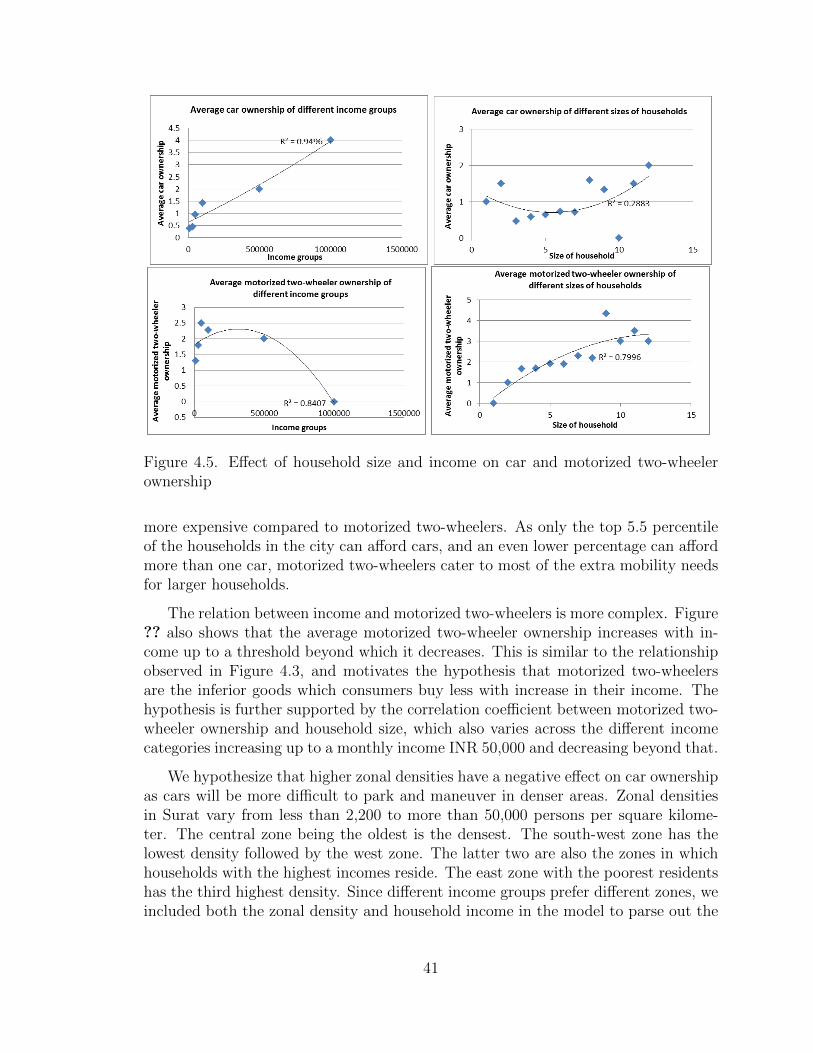
Figure 4.5. Effect of household size and income on car and motorized two-wheelerownership
more expensive compared to motorized two-wheelers. As only the top 5.5 percentileof the households in the city can afford cars, and an even lower percentage can affordmore than one car, motorized two-wheelers cater to most of the extra mobility needsfor larger households.
The relation between income and motorized two-wheelers is more complex. Figure?? also shows that the average motorized two-wheeler ownership increases with in-come up to a threshold beyond which it decreases. This is similar to the relationshipobserved in Figure 4.3, and motivates the hypothesis that motorized two-wheelersare the inferior goods which consumers buy less with increase in their income. Thehypothesis is further supported by the correlation coefficient between motorized two-wheeler ownership and household size, which also varies across the different incomecategories increasing up to a monthly income INR 50,000 and decreasing beyond that.
We hypothesize that higher zonal densities have a negative effect on car ownershipas cars will be more difficult to park and maneuver in denser areas. Zonal densitiesin Surat vary from less than 2,200 to more than 50,000 persons per square kilome-ter. The central zone being the oldest is the densest. The south-west zone has thelowest density followed by the west zone. The latter two are also the zones in whichhouseholds with the highest incomes reside. The east zone with the poorest residentshas the third highest density. Since different income groups prefer different zones, weincluded both the zonal density and household income in the model to parse out the
41
effect of one from the other on vehicle ownership. Initial model runs showed zonaldensities to be insignificant in explaining vehicle ownership of a household.
Since residents of ‘gala type’ houses do not have private parking space and canonly park their cars on the city streets, we hypothesized that residents of ‘gala type’houses would be less likely to own cars or greater numbers of motorized two-wheelers.Initial models estimated also negated this hypothesis.
For information on neighborhood accessibility to transit, we noted the time ittook for the survey respondents to walk to the auto-rickshaw stop and to the bus stopnearest their home. We found both of these factors to be insignificant in explainingvehicle ownership.
We estimated a multinomial logit model with the different combinations of carand motorized two-wheeler ownership as the dependent variables, and income andhousehold size as the two independent variables. We used multinomial logit insteadof a model that pertains to count data, since we found it to fit the data well. Addi-tionally, Bhat and Pulugurta found that the multinomial logit explains the variationsin count data on car ownership better than an ordered logit or ordered probit model(Bhat & Pulugurta, 1998) (De Jong et al., 2004). We estimated the model using theopen source software BIOGEME 2.0 (Bierlaire, 2003), (Bierlaire, 2008). The choiceset follows:
1. zero car and one motorized two-wheeler
2. zero car and two motorized two-wheelers
3. zero car and three motorized two-wheelers
4. zero car and four motorized two-wheelers
5. one car and zero motorized two-wheeler
6. one car and one motorized two-wheeler
7. one car and two motorized two-wheelers
8. one car and three motorized two-wheelers
9. one car and four motorized two-wheelers
10. two cars and zero motorized two-wheeler
11. two cars and one motorized two-wheeler
12. two cars and two motorized two-wheelers
13. two cars and three motorized two-wheelers
42

14. two cars and four through six motorized two-wheelers
15. three cars and zero motorized two-wheeler
16. three cars and two motorized two-wheelers
17. three cars and three motorized two-wheelers
18. four cars and zero motorized two-wheeler
In this model, we test the hypothesis that the socio-demographic and built environ-ment variables affect car ownership and motorized two-wheeler ownership differently.To that end, we estimate different sets of coefficients for each variable, income forexample, for the different numbers of cars owned, and for the different numbers ofmotorized two-wheelers owned. Since these are more aggregate than alternative spe-cific coefficients, we refer to them as cluster specific coefficients. There are eighteenelements in the choice set. For the purpose of estimating coefficients, alternativeswith less than ten responses are combined together with adjacent alternatives. Forexample, we estimate one aggregated constant for the two and three car owninghouseholds. Additionally, we estimate a set of alternative specific constants for thedifferent numbers of cars owned and the different numbers of motorized two-wheelers(mtw) owned. Coefficients for owning zero cars are fixed to zero as were those forowning one two-wheeler. A typical utility functions is as follows:
V (0car, 3mtw) = α0car + α2+mtw + β0carIncome+ β2+mtwIncome+ ......
V (1car, 4mtw) = α1car + α2+mtw + β1carIncome+ β2+mtwIncome+ ......
β0car, β1car, β2+mtw, are the cluster specific coefficients.
Table 4.2 shows the model results. They suggests that while household size isnot significant in explaining the shift from owning zero to one car, a larger householdis more likely to own two or more cars. Similarly, household size does not explainwhether a household owns zero, one, or two motorized two-wheelers. But a largerhousehold is more likely to own three or more motorized two-wheelers. Income is notsignificant in explaining the number of motorized two-wheelers owned by a household.However, it significantly explains that a household is likely to shift to car ownershipand to own more cars with increasing income. The other three variables, zonal density,dummy for living in ‘gala’ type of residence, and access to informal transit are notsignificant in explaining the numbers of cars or motorized two-wheelers owned.
We summarize two important insights from this analysis: i) that as income in-creases, households buy more cars; and ii) household size is not significant in ex-plaining small increases in owning cars or motorized two-wheelers, but does explainowning two plus cars and three plus motorized two-wheelers. Despite small samplesizes, the model indicates that income is more significant than household size in ex-plaining increase in car ownership. As increase in household size or population of a
43

Table 4.2. Logit model on number of vehicles owned
Name Parameter Value t-statistic
Const0Car 0.000 BaseConst1CAR -2.060 -2.21Const1+CAR -6.900 -4.47Const0MTW -1.810 -1.01Const1MTW 0.000 BaseConst2MTW 0.195 0.21Const2+MTW -3.440 -3.23Beta0CAR HHSIZE 0.000 BaseBeta1CAR HHSIZE 0.225 1.45Beta1+CAR HHSIZE 0.536 2.41Beta0MTW HHSIZE -0.581 -1.45Beta1MTW HHSIZE 0.000 BaseBeta2MTW HHSIZE 0.016 0.09Beta2+MTW HHSIZE 0.621 3.18Beta0CAR INCOME 0.00 BaseBeta1CAR INCOME 0.048 2.82Beta1+CAR INCOME 0.058 3.34Beta0MTW INCOME 0.017 1.84Beta1MTW INCOME 0.000 BaseBeta2MTW INCOME 0.008 1.02Beta2+MTW INCOME 0.002 0.26Built environment variables -0.616 - 0.751 not significant
Dependent variable Probability of owning x cars and y two-wheelersNumber of observations 112Initial log-likelihood -323.722Final log-likelihood -223.968Rho bar 0.215
city is not influential in increasing the number of cars, increase in car ownership hashitherto never been an issue despite the explosive population growth in the countryuntil the recent increase in per capita incomes. While the model does not capture thatwith increase in income beyond a threshold, households tend to own less motorizedtwo-wheelers, as observed in the plots, we follow this up with some further statisticalanalysis plotted in Figure 4.6.
Figure 4.6 shows the average motorized two-wheeler ownership of households ofdifferent car ownership. Assuming that the plot represents the vehicle ownershipof a household with growing affluence over time, since increase in car ownershipis influenced by increase in income. There is no significant change in motorizedtwo-wheeler ownership as car ownership increases from zero to two, with householdsowning close to two or more motorized two-wheelers. However, when ownershipincreases to 3 cars, there is a significant drop in motorized two-wheeler ownershipbringing it close to one. Earlier we saw that motorized two-wheeler ownership of ahousehold increases with increase in size of the household. The average size of a twocar-owning household does not differ significantly from that of a three car-owninghousehold. As such, the decrease in motorized two-wheeler ownership is not due toany significant decrease in household size.
44
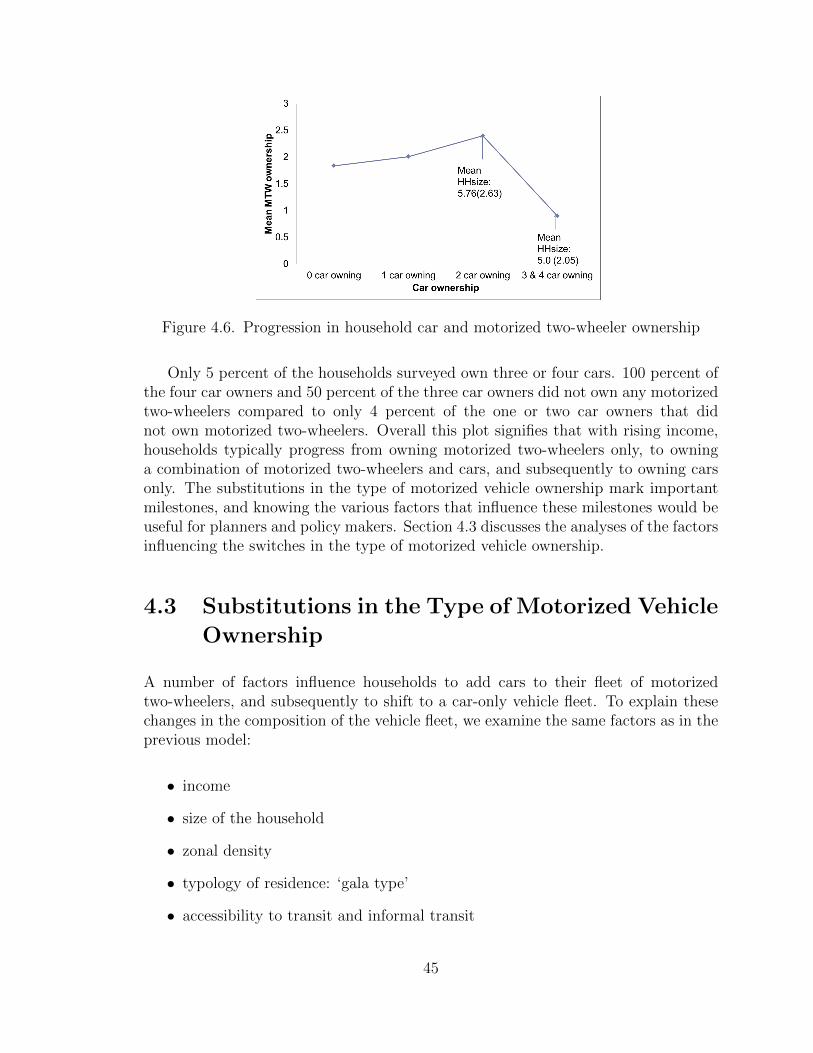
Figure 4.6. Progression in household car and motorized two-wheeler ownership
Only 5 percent of the households surveyed own three or four cars. 100 percent ofthe four car owners and 50 percent of the three car owners did not own any motorizedtwo-wheelers compared to only 4 percent of the one or two car owners that didnot own motorized two-wheelers. Overall this plot signifies that with rising income,households typically progress from owning motorized two-wheelers only, to owninga combination of motorized two-wheelers and cars, and subsequently to owning carsonly. The substitutions in the type of motorized vehicle ownership mark importantmilestones, and knowing the various factors that influence these milestones would beuseful for planners and policy makers. Section 4.3 discusses the analyses of the factorsinfluencing the switches in the type of motorized vehicle ownership.
4.3 Substitutions in the Type of Motorized Vehicle
Ownership
A number of factors influence households to add cars to their fleet of motorizedtwo-wheelers, and subsequently to shift to a car-only vehicle fleet. To explain thesechanges in the composition of the vehicle fleet, we examine the same factors as in theprevious model:
• income
• size of the household
• zonal density
• typology of residence: ‘gala type’
• accessibility to transit and informal transit
45

Additionally, we examine if the household has any children younger than fourteen,to test the hypothesis that ceteris paribus, households with children will be moreinclined to own cars for safety. We considered fourteen as the limiting age for childrensince, beyond that age, many children ride bicycles and take public transport totravel independently. Therefore, their travel is not an important consideration duringpurchase of a household vehicle.
Table 4.3 shows the average values of the different socio-economic and built en-vironment characteristics for households owning different vehicle types. We comparethe means to observe if there is a statistically significant difference across householdsowning different vehicle types. Households owning mixed fleets are found to havehigher income, reside in zones with lower population density, and be less likely to livein ‘gala’ type of residences compared to those owning motorized two-wheelers only.But while households that own cars alone have a higher sample mean for incomethan those owning a mixed fleet, the difference in the sample means between the twogroups is statistically significant only if both variances are assumed to be equal. Weearlier saw that it is not the increase in the household size that causes a householdto buy the first car. But households that own only cars in their fleet have signifi-cantly smaller households than those owning a mixed fleet. Note that the sample size(N) over which the mean income is computed is lower than that for the rest of thevariables since a smaller percent of respondents stated their income.
Table 4.3. Differing characteristics of households owning different vehicle fleets
MTW only MTW & car Car only t-statistic* t-statistic*Factor mean/std dev mean/std dev mean/std dev MTW & Mixed &
Mixed Car
N 68 117 11
Size of household 4.96/1.91 5.44/1.97 3.73/1.56 X XChildren dummy 0.38/0.49 0.52/0.50 0.27/0.47 X XZonal density(persons/sq. km)
25260/20050 14800/18020 18000/21570 X X
‘Gala’ type dummy 0.43/0.49 0.2/0.41 0.09/0.30 X XWalk time tothree-wheeler stop(minutes)
6.78/4.72 7.59/5.54 5.64/3.29 X X
N 50 56 6
Income(monthly INR) 29400/13763 80900/120518 275000/401833 X X(if equalvariances)
*for difference in meansT-statistic significant XT-statistic not significant X
As discussed, households select residential types and specific zones for residencebased on income. As such, the previous univariate analysis comparing across themeans of single variables does not explain the relative significance of these factors in
46
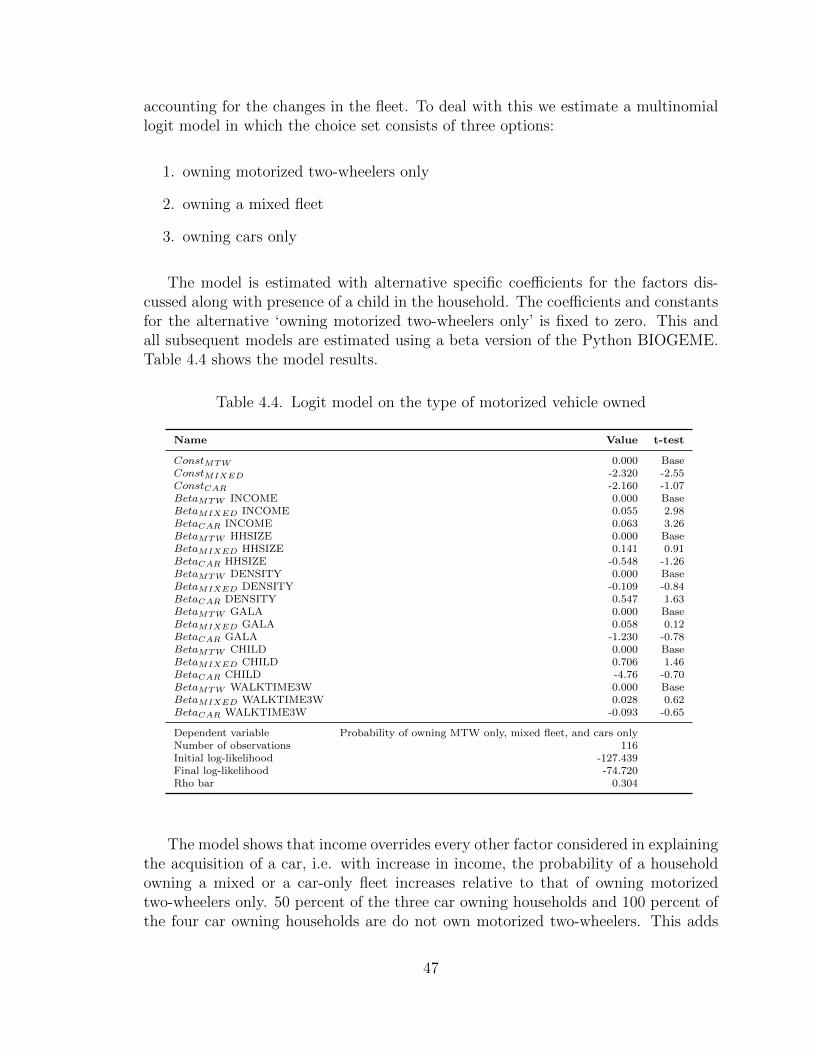
accounting for the changes in the fleet. To deal with this we estimate a multinomiallogit model in which the choice set consists of three options:
1. owning motorized two-wheelers only
2. owning a mixed fleet
3. owning cars only
The model is estimated with alternative specific coefficients for the factors dis-cussed along with presence of a child in the household. The coefficients and constantsfor the alternative ‘owning motorized two-wheelers only’ is fixed to zero. This andall subsequent models are estimated using a beta version of the Python BIOGEME.Table 4.4 shows the model results.
Table 4.4. Logit model on the type of motorized vehicle owned
Name Value t-test
ConstMTW 0.000 BaseConstMIXED -2.320 -2.55ConstCAR -2.160 -1.07BetaMTW INCOME 0.000 BaseBetaMIXED INCOME 0.055 2.98BetaCAR INCOME 0.063 3.26BetaMTW HHSIZE 0.000 BaseBetaMIXED HHSIZE 0.141 0.91BetaCAR HHSIZE -0.548 -1.26BetaMTW DENSITY 0.000 BaseBetaMIXED DENSITY -0.109 -0.84BetaCAR DENSITY 0.547 1.63BetaMTW GALA 0.000 BaseBetaMIXED GALA 0.058 0.12BetaCAR GALA -1.230 -0.78BetaMTW CHILD 0.000 BaseBetaMIXED CHILD 0.706 1.46BetaCAR CHILD -4.76 -0.70BetaMTW WALKTIME3W 0.000 BaseBetaMIXED WALKTIME3W 0.028 0.62BetaCAR WALKTIME3W -0.093 -0.65
Dependent variable Probability of owning MTW only, mixed fleet, and cars onlyNumber of observations 116Initial log-likelihood -127.439Final log-likelihood -74.720Rho bar 0.304
The model shows that income overrides every other factor considered in explainingthe acquisition of a car, i.e. with increase in income, the probability of a householdowning a mixed or a car-only fleet increases relative to that of owning motorizedtwo-wheelers only. 50 percent of the three car owning households and 100 percent ofthe four car owning households are do not own motorized two-wheelers. This adds
47
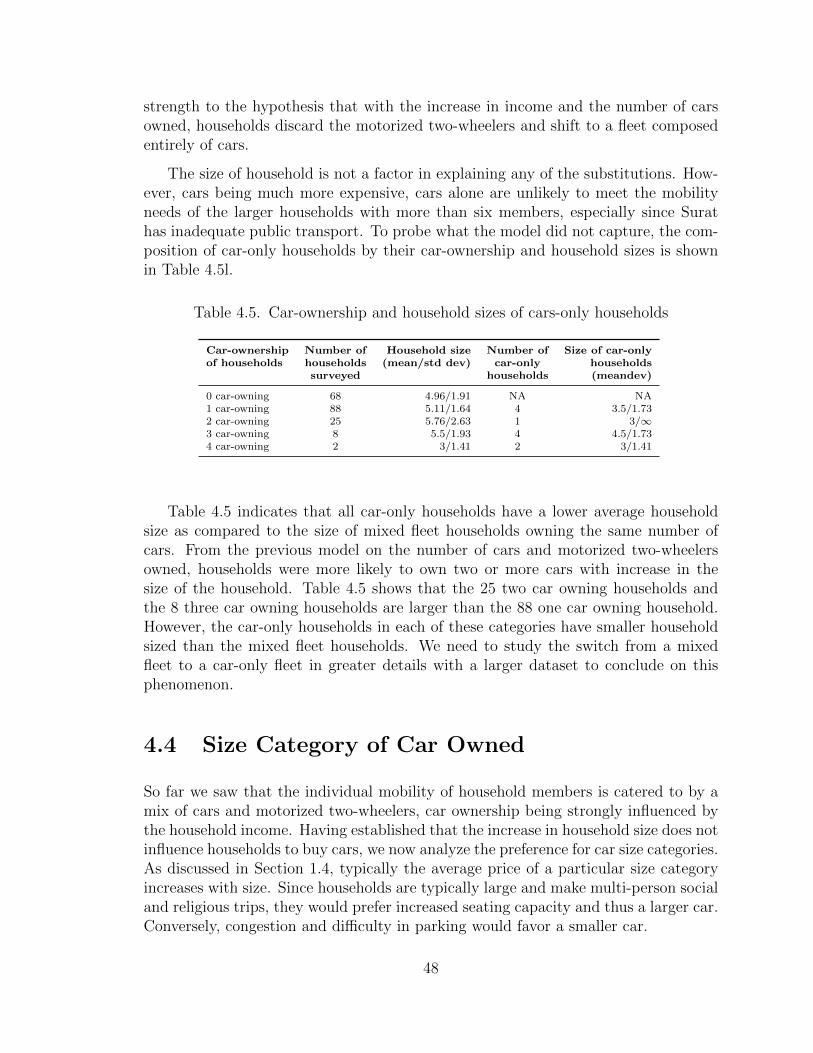
strength to the hypothesis that with the increase in income and the number of carsowned, households discard the motorized two-wheelers and shift to a fleet composedentirely of cars.
The size of household is not a factor in explaining any of the substitutions. How-ever, cars being much more expensive, cars alone are unlikely to meet the mobilityneeds of the larger households with more than six members, especially since Surathas inadequate public transport. To probe what the model did not capture, the com-position of car-only households by their car-ownership and household sizes is shownin Table 4.5l.
Table 4.5. Car-ownership and household sizes of cars-only households
Car-ownership Number of Household size Number of Size of car-onlyof households households (mean/std dev) car-only households
surveyed households (meandev)
0 car-owning 68 4.96/1.91 NA NA1 car-owning 88 5.11/1.64 4 3.5/1.732 car-owning 25 5.76/2.63 1 3/∞3 car-owning 8 5.5/1.93 4 4.5/1.734 car-owning 2 3/1.41 2 3/1.41
Table 4.5 indicates that all car-only households have a lower average householdsize as compared to the size of mixed fleet households owning the same number ofcars. From the previous model on the number of cars and motorized two-wheelersowned, households were more likely to own two or more cars with increase in thesize of the household. Table 4.5 shows that the 25 two car owning households andthe 8 three car owning households are larger than the 88 one car owning household.However, the car-only households in each of these categories have smaller householdsized than the mixed fleet households. We need to study the switch from a mixedfleet to a car-only fleet in greater details with a larger dataset to conclude on thisphenomenon.
4.4 Size Category of Car Owned
So far we saw that the individual mobility of household members is catered to by amix of cars and motorized two-wheelers, car ownership being strongly influenced bythe household income. Having established that the increase in household size does notinfluence households to buy cars, we now analyze the preference for car size categories.As discussed in Section 1.4, typically the average price of a particular size categoryincreases with size. Since households are typically large and make multi-person socialand religious trips, they would prefer increased seating capacity and thus a larger car.Conversely, congestion and difficulty in parking would favor a smaller car.
48

Compact cars are the most popular with 65 percent of the 128 car-owning house-holds owning one or more Compact cars. The category holds the highest share, 61percent and 77 percent, among households owning cars from a single category, andthose owning cars from more than one category respectively. The Mid-size categoryforms a low second in terms of popularity, with 22 percent of all car owning house-holds owning a Mid-size car in their fleet. SUV s are the next most popular followedby Minivans and Mini cars. The more expensive Executive and Premium cars arealways owned along with one or more cars from other categories and never as theonly car. Only 6 percent of households owning a single car type own a SUV, and 11percent own a Minivan. However, 35 percent of households that own more than onecar type own a SUV whereas only 10 percent owns a Minivan, indicating that themore expensive SUV is more popular as a second car.
In the analysis of car sizes preferred by households, we categorize households onthe basis of the largest car owned, which is for the most part the only car owned. Table4.6 shows the categorization of the sample for the analysis of the largest car ownedby a household. Note that the Mid-size car belongs to two different categories. Thecategory labelled ‘Mid-size’ consists primarily of households that own only Mid-sizesand motorized two-wheelers. The other category Mid-size, Executive, and Premium,consists of a majority of households that own Midsize cars along with cars fromother categories, and a minority of households that own Executive and Premium carsalong with cars from other categories including Mid-size. The households owning thecomposite car categories are expected to be weathier than those owning the Mid-sizesonly.
We compare the means of socio-demographic and built environment factors acrosshouseholds owning different car sizes as classified in Table 4.6. The factors we considerare:
• size of the household
• presence of children
• zonal density
• typology of residence: ‘gala type’
• accessibility to transit and informal transit
There is no significant difference to explain the choice across the various car sizecategories. However, on comparing income across households owning different carcategories we find that households that own either a Mid-size, Executive, or Premiumcar have significantly higher income than households that own any other cars. Next,we calibrate a multinomial logit model to explain the choice of size category of carowned. The choice set consists of the folowing:
49
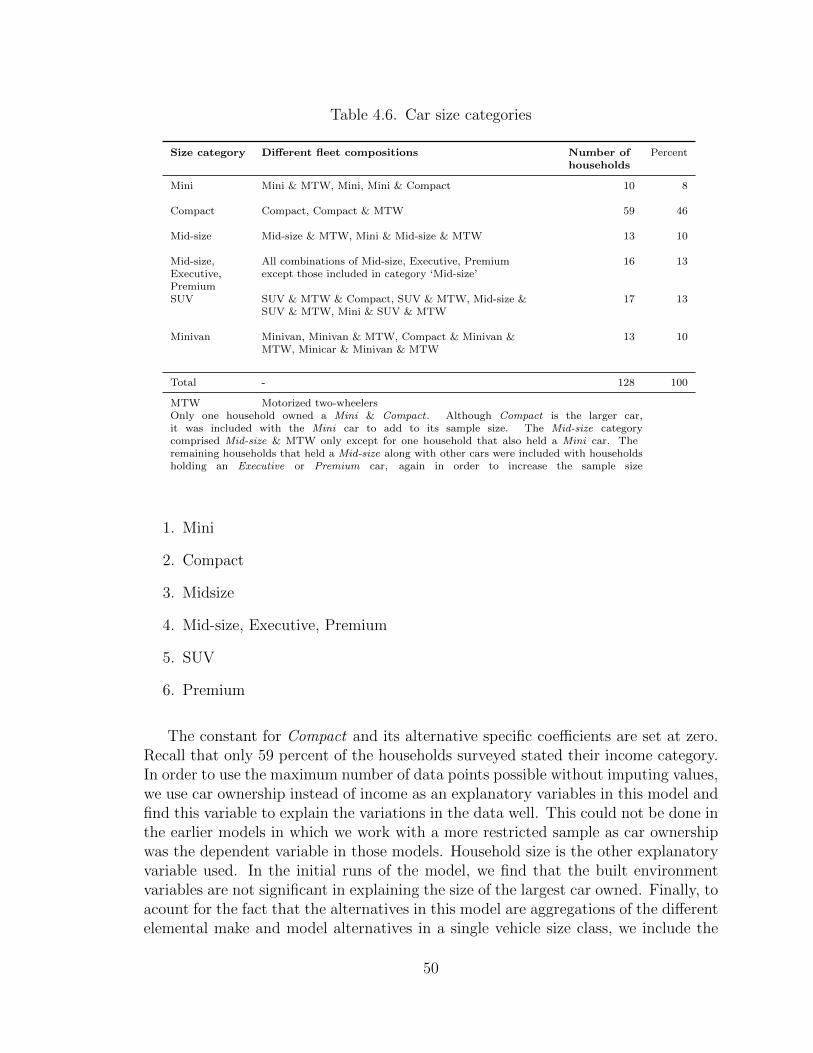
Table 4.6. Car size categories
Size category Different fleet compositions Number ofhouseholds
Percent
Mini Mini & MTW, Mini, Mini & Compact 10 8
Compact Compact, Compact & MTW 59 46
Mid-size Mid-size & MTW, Mini & Mid-size & MTW 13 10
Mid-size,Executive,Premium
All combinations of Mid-size, Executive, Premiumexcept those included in category ‘Mid-size’
16 13
SUV SUV & MTW & Compact, SUV & MTW, Mid-size &SUV & MTW, Mini & SUV & MTW
17 13
Minivan Minivan, Minivan & MTW, Compact & Minivan &MTW, Minicar & Minivan & MTW
13 10
Total - 128 100
MTW Motorized two-wheelersOnly one household owned a Mini & Compact . Although Compact is the larger car,it was included with the Mini car to add to its sample size. The Mid-size categorycomprised Mid-size & MTW only except for one household that also held a Mini car. Theremaining households that held a Mid-size along with other cars were included with householdsholding an Executive or Premium car, again in order to increase the sample size
1. Mini
2. Compact
3. Midsize
4. Mid-size, Executive, Premium
5. SUV
6. Premium
The constant for Compact and its alternative specific coefficients are set at zero.Recall that only 59 percent of the households surveyed stated their income category.In order to use the maximum number of data points possible without imputing values,we use car ownership instead of income as an explanatory variables in this model andfind this variable to explain the variations in the data well. This could not be done inthe earlier models in which we work with a more restricted sample as car ownershipwas the dependent variable in those models. Household size is the other explanatoryvariable used. In the initial runs of the model, we find that the built environmentvariables are not significant in explaining the size of the largest car owned. Finally, toacount for the fact that the alternatives in this model are aggregations of the differentelemental make and model alternatives in a single vehicle size class, we include the
50

natural log of the number of makes and models in each size category (Ben-Akiva &Lerman, 1985), (Train, 1986).
Table 4.7. Logit model on the size category of a household’s largest car
Name Value t-test
ConstMINI−COMPACT 0.000 BaseConstMINIV AN -0.156 -0.11ConstSUV -5.400 -4.79ConstMID−EXEC−PREMI -3.690 -4.13BetaMINI−COMPACT CAROWN 0.000 BaseBetaMINIV AN CAROWN -0.824 -0.78BetaSUV CAROWN 1.470 3.20BetaMID−EXEC−PREMI CAROWN 1.500 3.79BetaMINI−COMPACT HHSIZE 0.000 BaseBetaMINIV AN HHSIZE 0.164 0.96BetaSUV HHSIZE 0.192 1.34BetaMID−EXEC−PREMI HHSIZE -0.040 -0.30LNCATSIZE 0.791 5.31
Number of observations 123Initial log-likelihood -220.386Final log-likelihood -172.934Rho bar 0.17
The model results indicate that households are more likely to own an SUV, Mid-size, Executive, or Premium, relative to a Mini car, Compact, or a Minivan withincrease in car ownership, or income. The results further indicate that household sizedoes not affect the size of the car owned. This finding is corroborated by Figure 4.7in which, regardless of the household size, the share of households owning Mini andCompact cars as their largest car remains constant. The higher cost of a larger car,of enforcement of rear seat belt laws allowing overcrowding of vehicles, and the needfor increased manueverability in congestion and for parking, all favor smaller cars.
The built environment variables were not significant in explaining any of the choiceprocesses discussed, probably because they were fairly uniform across the city. Whilethere were differences in the zonal densities, they were due to the expansion of thecity limits in 2006, due to which the outer zones included areas of undeveloped land.The developed land was mostly uniformly dense, with fairly uniform mixed land-use. As discussed before, the ‘gala-type’ of residence was not significant in explainingownership or otherwise of any particular type of vehicle. Since street parking isabundant, the relative disutility of parking was not sufficient to explain vehicle choicein addition to the effects of income and household size. The same reasoning appliesfor the transit accessibility variable as the stops for the privately hired three-wheelersor buses are equally accessible to all neighborhoods. As such, this variable also didnot explain any of the differences in choices. We expect these factors to be significantin a city with a more diverse set of built environment factors, or in a study conductedacross various cities.
51

Figure 4.7. Household size and size of largest car owned
4.5 Vehicle Purchase
The study of vehicle purchase is an important contribution of this research. Sincethe Mini car Nano by Tata Motors had just been introduced in the market at thetime of the study, the data represents the choices that the consumers made with anaffordable Mini car available in the choice set.
In this analysis, we study the choice across new and used motorized two-wheelersand seven size categories of cars in a single model. Of all the motorized vehiclesales in the nation in September 2009, 83 percent were motorized two-wheelers and17 percent were cars. In contrast, 68 percent of the respondents in our survey wascar buyers and 32 percent were motorized two-wheeler buyers. The ratio of vehiclebuyers surveyed who bought new vehicles to those who bought used vehicles was 4:1.There were no data on that ratio among the whole population of Surat as the vehicledealers only had access to the official sales numbers of their respective makes, and theregistration records for used cars were not consolidated as well as those for the newcars. A couple of months after completion of the survey, several sources includingSurat automobile dealers estimated the ratio to be 1:2.5. The sample collected is thusa choice-based sample in both the ratio of cars and motorized two-wheelers and thatof new and used vehicles. The distribution over various car size segments of the carbuyer respondents, however, closely approximates the sales at the national level inthose car size segments.
Figure 4.8 shows the different car size categories that were bought by the house-
52

holds surveyed and the placement of the newly-bought car in their existing fleet.Compact cars and SUV s range from being a first car to being the fourth car in thefleet. The small sample of Mini car buyers includes many buyers of third and fourthcars, similar to that in the more expensive Mid-size segment. The sample of Mini carbuyers included four households that had obtained their Nano. Of them, two ownedtwo motorized two-wheelers each, one owned a car as well as three motorized two-wheelers, and one owned two cars besides the newly bought Nano. Only one of thehouseholds had bought the car for use in everyday work trips, the rest having boughtit for their family trips. Even from our small sample we can infer that, low price andimage of a poor person’s first car notwithstanding, affluent car buyers buy the Nanoas their second or third cars. The sample obtained for buyers of cars of the Executiveand Premium size categories are very small and there is no representative buyer ofthe Luxury size category of cars. This is indicative of the low affordability, and hencelow volume of sales of vehicles in these classes. The few Executive and Premium carbuyers sampled were all buying their second cars. In contrast, the Minivan buyerswere all either buying their first motorized vehicle or their first car.
Figure 4.8. Car size categories purchased by car ownership
Observations and interviews revealed that the Surat consumer is sensitive to fuelcost. Besides gasoline, three major fuel types are used by the vehicles. The nationalgovernment subsidizes diesel to aid low-income taxicab and three-wheeler operators.Some automobile manufacturers have capitalized on the resulting low price of dieseland manufactured popular diesel-powered cars and SUVs. Vehicles powered with
53

compact natural gas (CNG), and liquefied petroleum gas (LPG), are also available,and households sometimes buy gasoline-powered vehicles and have them fitted witha CNG kit. Electric bikes have also been introduced in the market. We interviewedsome users of these bikes in our surveys.
Since our analysis is at the more aggregate level of size categories, we can assessif size categories with low average fuel costs are preferred. This is a function of boththe fuel efficiency and the price of fuel used by most vehicles in that category. Wewill also assess in this analysis if size of household affects that of the recent vehiclepurchase.
Besides these considerations of cost and utility, some underlying attitudes andperceptions influence the preferences of the consumers. The households in Surat speakof their preference for comfort, utility, and reliability in the goods they purchased,rather than the brand name and the associated status. There was also a tendencyto understate purchasing power. This may explain the reason that there are fewerhouseholds owning luxury or premium cars in our sample as compared to what maybe obtained in other equally prosperous Indian cities. To assess some of the dominantattitudes and perceptions of the Surat residents and their effect on the vehicle choice,a set of Likert scale questions was posed to the survey respondents. We usuallysuggested that the head or other responsible member of the household answer these,with the assumption that they made the vehicle choice decision for the household.
4.5.1 Likert Scale Questions for Attitude Analysis
A set of 26 statements were designed to test the respondents perceptions in thefollowing categories: perception of status, perceptions about the personal vehicle andother modes, responses to monetary considerations, peer influence, and miscellaneous.The statements are in Section B of the survey questionnaire in Appendix C.
Perception of Status
These statements assess the extent to which the respondents agree that a personalvehicle or a car is a status symbol.
Perceptions about the Personal Vehicle and Other Modes
A set of statements pertains to whether the personal vehicle or car improves one’scareer opportunity and personal life. A second set deals with the issues of expensesin owning a personal vehicle, and the hassle of driving or parking in congestion.A third set of statements deal with whether walk, bike, private and shared three-wheeler services, and buses, are inconvenient. The fourth set of statements test the
54

respondent’s level of comfort in being seen in any of the modes mentioned. Finally,one statement assesses whether inclement weather inspires ownership of cars.
Responses to Cost Considerations
Different cost-related statements assess the respondents priorities in buying a vehicle,for instance whether the operating cost of a vehicle is an important consideration invehicle purchase. Some statements assess whether saving is considered a virtue.
Peer Influence
These statements assess whether the respondent liked to be the first among peers todo something new, and whether the respondent felt the need to buy an item thathis peer possessed. A choice phenomenon that both dealers and consumers reportedabout vehicle purchase in Surat was the ‘bandwagon effect’. Residents reported thatconsumers made their purchase choices based on the choices made by their peers, anddid not do individual research for themselves. Since that effect is more applicableto makes and models, we do not attempt to capture that effect at the level of thesize categories. Besides, incorporating such an effect in the model would also needcorrections for endogeneity.
Miscellaneous
Some miscellaneous statements assessed the presence or absence of strong nationalfeelings and tendency to buy the national brand. Others assessed willingness to drawattention to oneself, being a compulsive shopper, and the need for some time tooneself.
The survey respondents could select one of five responses for a set of 26 statements,the responses being definitely agree, somewhat agree, neither agree nor disagree,somewhat disagree, and definitely disagree.
4.5.2 Factor Analysis on the Likert Scale Responses
Each Likert scale response obtained from the survey is an indicator of underlyingattitude or attitudes, that are a mix of one or more of the perceptions discussed.We conducted an exploratory factor analysis on these responses to extract the mostsignificant factors that influence the different perceptions on private vehicle ownershipand use in the city. The details of the exploratory factor analysis are in AppendixD. For the analysis, we used the statistical software SPSS. The method of factoranalysis used was principal axis factoring with orthogonal varimax rotation applied
55

to the loadings obtained. We retained five factors that cumulatively explained 43.62percent of the variance in the data. The Kaiser-Meyer-Olkin measure of sampleadequacy was 0.7, which is rated as middling’. The statements with highest loadingsfor each factor are shown in Table 4.8.
Table 4.8. Statements with the highest loadings and names of the factors
Statements with high loadings Factor names
The operating cost considerations are important in my vehicle purchase* Monetary & Utility ConsiderationsSaving is a virtue* Final Eigenvalue: 3.345Driving in congestion is a hassle Percent of variance: 12.865Finding parking is a hassleThe personal vehicle is important for my career opportunities*The loan is important for my vehicle purchase*Cars are expensive
It is inconvenient to be a bus rider Inconvenience of non-motorizedIt is inconvenient to be a pedestrian & public modesIt is inconvenient to ride a bicycle Final Eigenvalue: 2.149
Percent of variance: 8.265
A car is a status symbol Perception of statusA personal vehicle is a status symbol Final Eigenvalue: 2.027On hot or rainy days I wish I had my own car* Percent of variance: 7.795
I consider buying a vehicle for infrequent need* Negative image of non-motorizedI don’t want to be seen riding a bus or an auto & public modesI don’t want to be seen walking or cycling Final Eigenvalue: 1.935
Percent of variance:7.442
When there is something new in the market I have to buy it Peer influenceI have to be the first among my peers to get something new Final Eigenvalue: 1.886When my peers have a certain type of vehicle, I have to own it Percent of variance: 7.253
*(Ni, 2008)
The first factor is a composite of monetary and utility considerations. The state-ments on monetary considerations assess the consumer’s perception on the importanceof the operating cost and the loan in the vehicle choice decision, the fact that carsare expensive, and that saving money is a virtue. Those on utility assesses the con-sumer’s perception on whether the personal vehicle is useful for the owner’s career,and whether driving in congestion and finding parking are troublesome.
The perceptions of negative image and of inconvenience deal with two aspectsof using non-motorized and public modes. The inconvenience factor pertains to is-sues like discomfort and delay in using non-motorized and public modes while thenegative image factor pertains to their association with low societal status. Anotherstatement that obtained high loading for the negative image factor is the one aboutbuying a vehicle even for infrequent need. It expressed the extent of adversity of therespondents towards using all but private motorized modes.
The peer influence factor includes statements expressing both leader and followerbehavior. Some want to be the first among peers to buy a new vehicle while others buy
56

a vehicle when the rest of the peers have it. Additionally, it includes the sentimentthat anytime there is something new in the market, the respondent feels the need tobuy it.
Finally, the perception of status factor includes statements that the car and thepersonal vehicle is a status symbol. It also includes the wish of non-car owners toown a car during times of inclement weather.
Monetary and utility considerations explain the biggest proportion of the variancein the data partly because the factor is a composite of several factors. The rest ofthe factors explain smaller and roughly equal parts of the variance. This reflects thesocio-cultural make-up of the particular community surveyed. Table 4.9 shows thecorrelation among all of the factors.
Table 4.9. Correlation matrix of the latent factors
Monetary utility Inconvenience Status Negative image Peer influence
Monetary utility 1Inconvenience 0.025 1Status 0.109 0.077 1Negative Image -0.046 0.045 0.040 1Peer Influence -0.002 0.039 0.044 0.085 1
The correlations among all of the factors are low as seen from the correlationmatrix in Table 4.9. In other words, there are no pairs among the five latent attitudesthat are commonly held together.
Next we examine different socio-economic variables in order to study if these affecta person’s set of latent attitudes. The variables studied are:
• age, gender & occupation of the head of the household
• household income
• household car ownership
• household structure: nuclear or traditional, joint family
We do not find any of these variables to affect the latent attitudes at the 95 per-cent level of confidence. However, at lower levels of confidence we can make a set ofobservations on the effects of these variables on the attitudes. Compared to headsof households employed by the government, those who own a business are less likelyto get high scores on the factor ‘monetary and utility consciousness’, and those whoare privately employed are the least likely. With increasing age of the head of thehousehold, the respondent is more likely to get high scores on the factor ‘inconve-nience of non-motorized and public modes’. With increasing household income, the
57

respondent is more likely to have obtained a high score on the ‘perception of status’factor. Compared to heads of households who work for the government, respondentsin households in which the head owns a business are less likely to obtain high scores onthe ‘negative image of non-motorized and private modes’ factor, and those in house-holds in which the head is employed in a private company are the least likely. Noneof these factors affect the peer influence variable even at a lower level of significance.
4.5.3 Integrated Choice and Latent Variable Model
In some earlier studies, factor analysis was first conducted on the indicators andthen the fitted latent variables were used in the choice model (Ni, 2008). As thesefitted latent variables would contain measurement errors, the choice probability shouldinstead be integrated over the distribution of the latent variables as obtained fromthe factor analysis model to obtain consistent estimates. This combined estimation isdone using integrated multi-equation models. Several alternative models consisting ofthe discrete choice model and the latent variable model’s structural and measurementequations were estimated (Ben-Akiva et al., 2002), (Bollen, 1989). Figure 4.9 showsthe layout of the model structure used for estimating vehicle choice. The indicatorsin the figure are the responses to the Likert Scale questions and these are explainedby some of the explanatory variables. Factor analysis conducted on these indicatorsoutput the latent variables. These, in turn, are included along with other explanatoryvariables in the utility function of the choice model, with the choice probability beingintegrated over the distribution of the choice model.
Figure 4.9. Integrated choice and latent variable model
58

4.5.4 Vehicle Choice
The model estimated is used to reflect the respondents choice among 14 categoriesof vehicles. The choice set includes new and used vehicles including motorized two-wheelers and the seven size segments of cars namely: Mini, Compact, Mid-size, Exec-utive, Premium, SUV, and Minivan, of which the sample of buyers of Executive andthe Premium class surveyed bought new vehicles only. Through this model, we studythe effect of different attributes of the vehicle, the socio-demographic characteristicsof the households, and the respondents attitudes and perceptions on vehicle choice.
Among the vehicle attributes, we assess the effect of price, fuel cost, size of thevehicle, and engine size on vehicle choice. The vehicle prices used in model estimationare the ex-showroom prices in Surat of all vehicles. These prices exclude subsequentroad tax, municipal corporation tax etc. The fuel costs used for the different fuels,namely gasoline, diesel, liquefied petroleum gas (LPG), compact natural gas (CNG),and electricity, are the representative prices of these fuels in Surat in August 2009.The average price in INR over all makes, models and variants for each vehicle segmentis calculated for new vehicles. For used vehicles, besides makes, models and variants,the average is also calculated over all vintages starting from year 2000, and over broadranges of kilometers traveled, when available. The average fuel cost per kilometer iscalculated for each segment by dividing the cost per liter or kilogram of the fuel bythe fuel efficiency (kilometer per liter) of the vehicles. We use the average number ofseats of the vehicle class to represent size. The average engine sizes of each categoryis also used as an explanatory variable.
As in the previous analyses, we will explore the preferences of vehicle across the 14vehicle categories mentioned, with increasing income and decreasing household sizesof consumers, the two major changes affecting the Indian society.
The number of buyers surveyed varied across the 14 vehicle categories of the choiceset. We estimated cluster-specific coefficients for the groups of choice alternatives thatin isolation had inadequate sample for estimating coefficients. Similar size segmentsare clustered together to have at least 10 respondents in each cluster. For example,since the number of Mini car buyers in the sample were less than ten, the sampleof Mini car buyers were combined with the Compact car buyers in estimating thecoefficients.
The number of seats of the vehicle is divided by the number of members in thehousehold to explore the effect of varying household size on the preference for vehiclesize. Generic coefficients are estimated for the price of the vehicle, fuel cost perkilometer, size of the engine, and for the number of seats per person.
Cluster-specific coefficients are estimated for three of the factors obtained fromthe factor analysis. In the beta version of the python BIOGEME, the choice andlatent variable model was not estimable with more than three latent variables. Wetested different combinations of latent variables and used ‘monetary and utility con-
59

sciousness’, ‘inconvenience of other modes’, and ‘perception of status’ in the finalmodel. In the measurement equations, we specified the dummies for business own-ing head of household, and those employed in private companies as an explanatoryvariable for the factor ‘monetary and utility consciousness’; the age of the head ofhousehold as an explanatory variable for the factor ‘inconvenience of other modes’;and the household income for the ‘perception of status’ variable. Since some of theotherwise complete surveys did not have complete responses to the Likert scale ques-tions, instead of removing those observations for which the Likert scale responses wereabsent, the density of the missing responses were set to 1. This enabled use of allsocio-demographic data in our sample. Finally, since the sample was choice-based,we weighted the log-likelihood function in proportion with the sales at the nationallevel. Table 4.10 shows the model output.
Table 4.10. Choice and latent variable model on the recent vehicle purchase of ahousehold
Name Value Robust t-test
PRICE -2.59 -2.85FUELCOSTKM -3.49 -7.07SEATING CAPACITY / HHSIZE -0.865 -1.16ENGINESIZE 0.004 4.24BetaMID−SIZE,EXECUTIV E,PREMIUM INCONVENIENCE -0.337 -0.47BetaMID−SIZE,EXECUTIV E,PREMIUM STATUS 0.453 0.37BetaNEWTWO−WHEELER MONETARY-CONSC -0.750 -1.10BetaNEWTWO−WHEELER STATUS 1.32 1.41BetaCOMPACT MONETARY-CONSC 1.450 1.78BetaCOMPACT INCONVENIENCE 0.139 0.19BetaSUV STATUS 1.04 1.05
STRUCTURAL & MEASUREMENT VARIABLESbeta age 0.016 1.53beta costbusi -1.06 -2.58beta costpriv -0.755 -2.49beta income 0.001 5.05beta mean cost & utility 1.06 3.45beta inconvenience -0.628 -1.55beta mean status -0.03 -4.44other structural & measurement variables 0.019-2.590 significant
Dependent variable: Probability of a household having purchased a new or used
Number of observations 128Initial log-likelihood -24904.68Final log-likelihood -22480.76Rho bar 0.096
The coefficients estimated for the price and the fuel cost are significant and nega-tive, as expected. This is the first indicator that the model is specified adequately, andthat it includes attributes that account for vehicle quality. Otherwise it is commonto get a positive sign for these attributes, misleadingly indicating that it is the higherprice and operating cost that is preferred, rather than the desirable attributes of thevehicles with higher price and operating cost. The coefficient for the average seat-
60
ing capacity per person in the household has a negative sign, indicating that greaternumber of seats, a proxy for larger vehicle size, is not preferred. Larger vehicles arenot preferred due to lack of maneuverability and difficulty in parking in unmarkedparking locations, as in most locations in Surat and India. Additionally, since seatbelt laws for the rear seat are not enforced, more occupants than what is mandatedmay use the car. This again renders additional number of seats unnecessary. How-ever, the magnitude of this coefficient reduces with increase in household size. Thisindicates that while larger vehicles are not preferred, the disutility for buying largervehicles reduces for larger households. The coefficient of size of the engine is positiveand significant, indicating a preference for bigger and more powerful engines.
The factors on attitudes are not significant in explaining vehicle choice. This islikely the characteristic of the population the data represents for whom the observableattributes are much more significant than the underlying perceptions of status, incon-venience, and on money and utility. Based on our interviews and anecdotal evidence,we had hypothesized the factor ‘cost and utility consciousness’ to be significant, butdid not obtain expected results. Alternatively, it could be due to inadequate or noisydata for the Likert Scale responses, which was the only part of the survey that couldnot be validated.
The ratio of the coefficient of fuel cost per kilometer to that of vehicle price givesthe willingness-to-pay for reduction in fuel cost. The scale is model estimation for thevehicle price is 1/1,000,000. After adjusting the estimated values of the coefficients fortheir respective units and scale in model estimation, we obtain the willingness-to-pay(WTP) for 1 paise (0.01 INR) reduction in fuel cost per kilometer as INR 13,47,490.The equivalent value obtained in a study conducted in the United States is $522 percent fuel cost reduction per mile (Martin, 2009). After adjusting the respective units,the WTP for fuel cost reduction in Surat is found to be 42 times that obtained in theUnited States study. Without placing too much emphasis on the number 42, as thishas varied among the different models estimated from the same data possibly due tonoise in the data, we can conclude that the Indian consumer is far more sensitive tofuel cost as compared to the consumer in the United States. The ratio of the price ofgasoline in India to that in the United States in 2009, with the Indian price convertedto USD (2008 PPP), is 4.07. The Indian consumer is thus far more sensitive to fuelcost as compared to the United States consumer than can be accounted for by thedifference in fuel prices.
The present research being on car size cateogries does not address the role of vehi-cle attributes, such as brand name, reliability, resale value, and availability of spares,that affect choice of a particular make and model combination. It is worth empha-sizing that these factors repeatedly came up in discussions as respondents explainedtheir choices. Brand name came second to fuel efficiency with 36 percent of the 113respondents explaining their choice of recent vehicle purchased mentioning it as animportant factor. Similar to that at the national level, Maruti is the most popularbrand among the households surveyed. While some models are more popular than
61

others, the same household rarely owned two vehicles of the same make and model.Only two households among those surveyed bought a motorized two-wheeler of thesame make and model as one they owned already and none bought a car that was thesame. At the level of size categories, Compact cars being the most popular, house-holds were more likely to own multiple Compact cars but less likely to own multiplesof any other size categories. Next, the consumers preferred automotive makes thathave been found to be reliable in the past. They frequently cited unreliability as theirreason for not buying the recently launched Nano by Tata Motors. Others models bythe company have earlier been found to be defective which the company corrected insubsequent versions. The resale value is another factor that came up repeatedly. Itsimportance may be expected to increase with households holding their vehicles lessand the size of the pre-owned car market increasing. The resale value also dependson its reliability. Finally, availability of spare parts is an important criterion. Due toavailability of cheap labor, broken down cars and motorized two-wheelers are repairedand used longer than in more industrialized countries where they are salvaged andreplaced. Authorized and unauthorized repair shops are widely available. However,India is following the trend of the more industrialized nations. The option of repair-ing and replacing defective parts with spare ones are becoming more expensive withspares becoming increasingly specific to the model, and with mechanics needing moreproprietory knowledge of the specific make of the car.
4.5.5 Discussion
In this chapter we discuss the consumer preference among vehicle types. We first studythe well-known phenomenon of the shift with increasing income from a motorizedtwo-wheeler-owning to a car-owning household. We observe the effect of changinghousehold size and built environment characteristics. We observe that an increase inincome leads to an increase in car ownership. An increase in size of the householdonly explains ownership of two or more cars, or three or more motorized two-wheelers.Some of the inferences obtained are worth validating with a larger dataset. Withincrease in car ownership beyond a threshold, household are observed to own less ofmotorized two-wheelers; typically at this stage, smaller households shift to a car-onlyfleet. Thus three stages in the motorization process can be demarcated, beginningwith owning motorized two-wheelers, moving to owning a mixed fleet of motorizedtwo-wheelers and cars, and finally owning only cars. The role of motorized two-wheelers in the motorization process is similar to that of public transport, as it retardsthe growth in car ownership by meeting some of the mobility needs of a household.
Analyzing the different car sizes owned by the different households, we find thathousehold size does not affect the size of the largest car owned. We also find thatwith the increase in car ownership representing an increase in income, households aremore likely to own their largest car from the more expensive size categories, such as aMid-size, Executive, Premium, or SUV, rather than from the less expensive Mini car,
62

Compact or a Minivan categories. Income again is found to explain car ownership,both number and type, more than anything else.
In vehicle purchase behavior, households preferred smaller cars, although the pref-erence diminished for larger households. They also preferred vehicles with largerengines. Analyses revealed that the Indian consumer is very sensitive to fuel cost.Comparing the findings of the present study with a recent vehicle purchase study con-ducted in the United States, the willingness-to-pay for reducing fuel cost of the Indianconsumer was found to be orders of magnitudes higher than that of the consumer inthe United States. Observed vehicle attributes were found to be much more significantthan latent attitudes and perceptions supported by socio-demographic attributes, inexplaining the type of vehicle purchased.
63

Chapter 5
Conclusions
This dissertation analyzes the results of a survey of the motorized vehicle owningresidents of Surat, a prosperous, rapidly-motorizing city of five million inhabitants. Byinterviewing new vehicle buyers, this study assesses their choices of newly purchasedvehicles. Factors that affect choices between used and new motorized two-wheelersand of cars of different sizes are analyzed. The study also assesses the trends invehicle ownership, and the perceptions and aspirations that influence the vehiclechoice process.
Preliminary data analysis shows that Compact cars are bought by householdsof all income ranges but Minivans are only bought by households who are buyingtheir first car, or even their first motorized vehicle. The SUV is typically boughtby the more affluent households, and is usually not the first motorized vehicle to bepurchased. Likewise, the more expensive Mid-size, Executive or Premium cars areusually bought as second cars. Such findings lead to the inference that consumersprefer the luxury, power, and status, associated with larger cars rather than theincreased seating capacity. If that is true then there is a niche market for luxurysmall cars.
The models reveal that household size does not affect either the number of carsor the size of the largest car owned by the household. Overcrowding of vehicles iscommon because the enforcement of rear seat belt laws is lax. Larger households arethus as likely as smaller ones to own a Mini or a Compact car as their largest cars,since larger cars are typically more expensive. With increase in income or number ofcars owned, households prefer larger cars with higher average prices.
It is found that observable vehicle attributes and socio-demographic character-istics have a greater influence on vehicle purchase behavior than latent attitudesand perceptions. This finding needs to be validated with a larger dataset, but issignificant in its implications for the motorized vehicle owning population of Surat.Further analysis reveals that the population surveyed is extremely sensitive to fuelcost. Comparison with findings from a recent study on Chicago and the state of Cal-
64

ifornia shows the extent to which the Surat consumer is more fuel sensitive than theUnited States consumer. Similar studies conducted over a greater number of citieswill help generalize the findings for the two countries being compared.
Initial data analysis reveals that the more the number of cars a household owns,the more they succumb to a car-based lifestyle. We observe that with increase in thenumber of cars owned by the households, the ownership of motorized two-wheelerfalls.Car owners also appear to prefer their cars over hired or shared means, given theconvenience it offers for the cost of operation. The phenomenon of considering thecar as the default option for all trips, including a large number of drive-alone orchauffeur-driven single rider trips, is particularly marked in households that ownmore than two cars, or in those that do not own any motorized two-wheelers.
5.1 Possible Use of Current Research and its Ex-
tensions
There are many policy issues facing a country that is motorizing rapidly. Thereare many ways to address the issues which will have different bearings on use ofinfrastructure, congestion, fuel efficiency, emissions, as well as on safety and equity.The results of this research provides useful information on the equity aspect of policies.As households that own motorized two-wheelers and no cars are the least wealthyamong owners of motorized vehicles, any policy increasing the cost of ownership anduse of motorized two-wheelers is likely to adversely affect their mobility. The researchshows that motorized two-wheeler ownership retards car ownership by acting as anintermediate. Because of their use of less road space and potential energy efficiency,policies could be used to encourage their ownership over that of cars, in tandem withimproving their emissions and safety aspects. It is also worth considering that, pricingmeans to reduce car ownership and use will affect lower income car owners moreadversely than the higher income households that own multiple cars. That would nothelp achieve the goal of reducing indiscriminate car use but instead impair mobilityand safety. A discussion on the hazards of motorized two-wheelers overloading theirvehicles due to lack of purchasing power to own a car follows in a later section.
From the analysis of the attitude factors, we obtain that with increase in age,motorized vehicle owners become sensitive to convenience and comfort. A comfortableand reliable means of transport, that ply on lanes free of the congested mixed trafficmight be attractive to those who drive their own cars, as it would also relieve them ofmaneuvering and parking in the congested city. As such, the bus rapid transit beingcurrently implemented in the city, if well-planned and administered, might succeedin reducing car-dependence.
The fact that SUV s are owned by households that are wealthier than those thatown Minivans is also relevant to equity considerations. The way pricing policies
65

are framed determines the target population of the policy. Pricing policies aimed toreduce the purchase and use of larger cars would also affect the lower income Minivanowners. One approach that has less adverse effect on the mobility of lower incomehouseholds could be to have a favorable policy based on engine sizes rather thanlength of the vehicle. It would affect SUV owners to a much greater extent thanMinivan owners.
In an extension of this study, it would be useful to address the classical problem ofallocating costs to users. A study across vehicle ownership types and vehicle use, withknowledge of fuel type used can be used to refine the tax structure for vehicle use.Depending on fuel efficiency, possible emissions, size, and extent of use of each vehicletype, a policy can be framed that would most efficiently curb emissions, congestionand fuel use. It can be determined whether pricing should be based on the extentof travel, assuming that was possible to gauge, or on the extent of fuel consumption,and whether the rate should vary across different vehicle types.
Future work involves validation of the findings with a larger dataset. After as-certaining the travel times and costs by alternative modes, a mode choice modelcalibrated with the present data or a bigger dataset would be informative. Further-more, a similar study conducted across multiple cities, Indian or international, willcapture the effect of the different built forms and varying access to transit, as well asdifferent attitudes given the variations in the cultural make up across the country.
Analyzing trip making behavior and mode choice remains to be addressed in futurework. However, since the present research and extensions thereof are intended to beuseful for policy making, the next discussion in based on common observations ontravel characteristics and on land use. These observations underscore that the cultureof the city surveyed is very relevant to the issues in question and suggest the need forinnovative policy making.
5.2 Need for Innovative Policy Framework
Cars being relatively expensive and Surat lacking good public transport, there is achasm between motorized two-wheeler and car ownership, due to the lack of interme-diate choices. While the city has an excellent network of informal public transport,hiring motorized three-wheelers without ride sharing is equally or more expensivecompared to the fuel cost of taking one’s own car for the same trip. Cost-consciousconsumers would rather take their children on a motorized two-wheeler or overloadit with goods and save money, than spend on expensive informal transport. In acommunity in which ninety three percent of the households live in residences theyown, the importance of owning their means of transport cannot be over stressed.Any intermediate shared or hired option has to be of sufficiently low cost so as to notmatter.
66

Policies could be aimed at reducing indiscriminate car trips, for which alternativemodes exist. Usually bulk purchase trips, discretionary trips, and trips for the elderlyare best catered to by cars, given the mode options available. Policy initiatives couldsupport those trips and others for which a car offers significantly more conveniencecompared to available alternative modes. It should also work towards increasing theviability of alternatives available for such trips.
Even with more affordable cars in the market, there will still be a sizable popula-tion of such road users. Besides inexpensive and safer means of transportation, theseroad users also need interventions to improve their safety. Small business owners aretypically the violators that transport their goods on their motorized two-wheelers.Regulating them in the name of safety would be to drive them out of their business.Given these considerations, improvement of road infrastructure, vehicle design, anddesign of inexpensive and climate-appropriate safety gear for vulnerable road usersare necessities for Indian cities.
Surat and most Indian cities have high densities and mixed land use generating alot of walk trips for convenience shopping, social, religious, and even work purposes.But one-stop grocery chains, carrying a range of different brands and alternativeshave been introduced. As more people own cars, they can access those stores locatedfurther from home, and transport large quantities of grocery at lower prices. Overtime these stores could adversely affect the business of the neighborhood stores, driv-ing their owners out of business, and creating further dependence on car ownership.Policies promoting high-densities and supporting small businesses need to be adopted.
5.3 Contributions
Ironically, the lack of affordability to own motorized vehicles had made the transportsystem of the country reliant on non-motorized and public modes, and hence sustain-able by default. Improvement of the economy, otherwise a necessity, can be a threatto the inherently sustainable culture of the country. Our research findings can beuseful to policymakers looking for means of continued sustainability, while improvingthe quality of life of its citizen perceptively. This dissertation is the only study to theauthor’s knowledge, that makes a comprehensive assessment of the choices betweenmotorized two-wheelers and different size categories of cars, along with new and usedvehicles. Its contribution also lies in studying the vehicle purchase in developingcountries and in quantifying the extent to which a consumer is more sensitive to fuelcost than to the purchase price of a vehicle. It makes a timely comparison of prefer-ences across car size categories in a country in which car ownership is poised to growrapidly. The findings about the future composition of motorized two-wheelers andvarious size categories of cars are useful as inputs to infrastructure building, fuel use,and emission studies. Along with the findings on the willingness to pay for saving fuel
67

cost, the research provides important inputs to policy for encouraging non-motorizedand public modes, as well as for encouraging clean motorized two-wheelers over cars.
Automobility of a country is a vast topic that needs extensive research. Thepresent dissertation, while answering some key relevant questions, finds several morethat needs further study. We hope the present dissertation is the beginning of manystudies aimed at directing car growth in India in an environmentally-friendly manner.With availability of improved data, there is a promising future for policy relatedstudies and policy making for India.
68
Bibliography
Arasan, V.T., Rengaraju, V.R., & Krishna Rao, K.V. 1998. Mode choice for workjourneys of urban travellers owning motorized vehicles in India. TransportationPlanning and Technology, 22(1), 27–45.
Associates, Wilbur Smith. 1998. Traffic and Transportation Policies and Strategiesin Urban Area in India. Tech. rept. Ministry of Urban Development, Governmentof India, New Delhi.
Associates, Wilbur Smith. 2008. Traffic and Transportation Policies and Strategiesin Urban Area in India. Tech. rept. Ministry of Urban Development, Governmentof India, New Delhi.
Automobileindia.com. 2009. The two wheeler history of India. http://www.wikio.
com/article/55740783.
BBC. 2007. Timeline: India’s Automotive Industry. BBC News, April 3.
Ben-Akiva, M., & Lerman, S. 1985. Discrete Choice Analysis Theory and Applicationto Travel Demand. Massachusetts: MIT Press.
Ben-Akiva, M., Walker, J., Bernardino, A.T., Gopinath, D.A., Morikawa, T., & Poly-doropoulou, A. 2002. Integration of Choice and Latent Variable Models. In: Mah-massani, H.S. (ed), In Perpetual Motion: Travel Behavior Research Opportunitiesand Application Challenges. Elsevier Science Ltd.
Ben-Akiva, M.E., Jessiman, W.A., & Nestle, R. 1976 (March). A behavioral Analysisof Automobile Ownership and Mode of Travel. Technical Summary DOT-OS-30056-4. USDOT. Volume 4.
Berkovec, J. 1985. Forecasting automobile demand using disaggregate choice models.Transportation Research Part B, 19(4).
Berkovec, J., & Rust, J. 1985. A Nested Logit Model of Automobile Holdings for OneVehicle Households. Transportation Research Part B, 19(4), 275–285.
Bhat, C.R., & Pulugurta, V. 1998. A Comparison of Two Alternative BehavioralChoice Mechanisms for Household Auto Ownership Decisions. Transportation Re-search Part B, 32(1), 61–75.
69

Bierlaire, Michel. 2003 (January). BIOGEME: A free package for the estimationof discrete choice models. Proceedings of the 3rd Swiss Transportation ResearchConference, Ascona, Switzerland.
Bierlaire, Michel. 2008. An introduction to BIOGEME Version 1.6. biogeme.epfl.ch.
Bollen, K.A. 1989. Structural Equations with Latent Variables. Wiley-Interscience.
Bunch, D.S. 2008. Automobile demand and type choice. In: Handbook of TransportModeling, second edn. Elsevier.
Button, K., Ngoe, N., & Hine, J. 1993. Modelling Vehicle Ownership and Use in LowIncome Countries. Journal of Transport Economics and Policy, January.
Center for Science and Environment. 2008. Avert the Great Guzzle, Fuel EconomyRegulations: Setting the Principles Right. Tech. rept. Center for Science and Envi-ronment, Delhi.
CEPT and Urban Initiatives, Surat. 2004. Vision Surat 2020.
Chari, S.R., & Khanna, S.K.
Cherry, C.R. 2007. Electric two-wheelers in China: analysis of environmnetal, safety,and mobility impacts. Ph.D. thesis, University of California, Berkeley.
Choo, S., & Mokhtarian, P.L. 2004. What type of vheicle do people drive? The roleof attitude and lifestyle in influencing vehicle type choice. Transportation ResearchPart A, 38, 201–222.
Dargay, J., Gately, D., & Sommer, M. 2007. Vehicle ownership and inocme growth,worldwide: 1960-2030. The Energy Journal, October.
De Jong, G., Fox, J., Daly, A., Pieters, M., & Smit, R. 2004. Comparison of carownership models. Transport Reviews, 24(4), 379–408.
Dissanayake, D., & Morikawa, T. 2002. Household Travel Behavior in Develop-ing Countries, Nested Logit Model of Vehicle Ownership, Mode Choice, and TripChaining. Transportation Research Record: Journal of the Transportation ResearchBoard, TRB, National Research Council, Washington D.C., 1805(02-2688).
Dissanayake, D., & Morikawa, T. 2003. A Combined RP/SP Nested Logit Modelof Vehicle Ownership, Mode Choice and Trip Chaining to Investigate HouseholdTravel Behavior in Developing Countries. In: TRB annual meeting CD-ROM.
Gakenheimer, R. 1999. Urban Mobility in the Developing World. TransportationResearch Part A, January(33), 671–689.
70

Gorham, R., Kanchi, S., Cowart, B., Chari, R., Goel, V., & Sachdeva, Y. 2004. Trade-offs between Time, Cost, and Uncertainty by Commuters in Hyderabad, India,Stated Preference Survey Assessment. Transportation Research Record: Journal ofthe Transportation Research Board, TRB, National Research Council, WashingtonD.C., 1878.
Government of India. 2001a. Census of India 2001. http://www.censusindia.gov.in/Census_Data_2001.pdf.
Government of India. 2001b. Census of India Data Highlights. http:
//censusindia.gov.in/Data_Products/Data_Highlights/Data_Highlights_
link/data_highlights_hh1_2_3.pdf.
Government of India. 2001c. Table H-5 India:Census of India 2001.http://www.censusindia.gov.in/Census_Data_2001/States_at_glance/
State_Links/24_guj.pdf.
Government of India. 2006. Draft Automotive Mission Plan, 2006-2016, Documenta-tion of Inputs for Ten Year Mission Plan for Development of the Indian AutomotiveIndustry into a Global Hub. Tech. rept. Ministry of Heavy Industries and PublicEnterprises, Government of India, New Delhi.
Joewono, T.B., & Susilo, Y.O., Mohamad J. 2008. Preference of Vehicle Holdingsand Use in Malaysia. In: TRB annual meeting CD-ROM.
Kitamura, R., Golob, T.F., Yamamoto, T., & Wu, G. 2000. Accessibility and auto usein a motorized metropolis. In: Paper presented at the 79th Transportation ResearchBoard Annual Meeting, Washington, DC.
Kutzback, M. 2010. Megacities and Megatraffic. Access, Fall 2010(37), 31–35.
Lave, C.A., & Train, K. 1977. A Disaggregate Model of Auto-Type Choice. Tech. rept.UCI-ITS-WP-77-1. Institute of Transport Studies, University of California, Irvine.
Lerman, S.R., & Ben-Akiva, M.E. 1976 (March). A behavioral Analysis of AutomobileOwnership and Mode of Travel. Technical Summary DOT-OS-30056-2. USDOT.Volume 2.
Mannering, F., & Mahmassani, H. 1985. Consumer valuation of foreign and domesticvehicle attributes: Econometric analysis and implications for auto demand. Trans-portation Research A, 19.
Mannering, F., & Winston, C. 1985. A Dynamic Empirical Analysis of HouseholdVehicle Ownership and Utilization. Rand Journal of Economics, 16(2).
Manski, C.F., & Sherman, L. 1980. An empirical analysis of household choices amongmotor vehicles. Transportation Research A, 14(5/6).
71

Martin, E.W. 2009. New Vehicle Choice, Fuel Economy and Vehicle Incentives:AnAnalysis of Hybrid Tax Credits and the Gasoline Tax. Ph.D. thesis, University ofCalifornia, Berkeley.
Muralidhar, B., Mathew, T.V., & Dhingra, S.L. 2006. Prototype Time-Space DiaryDesign and Administration for a Developing Country.
Nagaraj, R. 2008. India’s recent Economic Growth: A Closer Look. Economic andPolitical Weekly, April.
Nations, United. 2011 (May). Millenium Development Goal Indicators. http://
unstats.un.org/unsd/mdg/SeriesDetail.aspx?srid=699.
Ni, Meng-Cheng (Jason). 2008. Motorization, Vehicle Purchase and Use Behavior inChina: A Shanghai Survey. Ph.D. thesis, University of California, Davis.
Padam, S., & Singh, S.K. Urbanization and Urban Transport in India: The Sketch fora Policy. http://www.deas.harvard.edu/TransportAsia/workshop papers/Padam-Singh.pdf.
Pai, Madhav. Transport in Cities: India Indicators. Published by EMBARQ, TheWRI Center for Sustainable Transport, and Center for Sustainable Transport, In-dia.
Parida, M., Gupta, A.K., & Khanna, S.K. 1993. Determinants of mode choice ofcommuters in Delhi. In: Confrence sur les transports urbains dans les pays endveloppement, Urban transport in developing countries. CODATU, Tunisia.
Parimal, Jayant. 2001. Census of India 2001, District Census Handbook. 25, vol.Surat Part I, Gujarat.
Rajagopalan, B.S., & Srinivasan, K.K. 2008. Integrating Household-Level ModeChoice and Modal Expenditure Decisions in a Developing Country, Multiple Dis-creteContinuous Extreme Value Model. Transportation Research Record, Journal ofthe Transportation Research Board, Transportation Research Board of the NationalAcademies, Washington D.C.
Rayle, Lisa.
Rayle, Lisa, & Pai, Madhav. 2010. Urban Mobility Forecasts: Emissions Scenariosfor Three Indian Cities. In: Transportation Research Board.
Regional Transport Office, Surat. 2009. Five Year Vehicles Population.
Roychowdhury, A. 2007. Wheels of Misfortune. Down To Earth, October(15), 32.
Saleh, A.A., & Sikdar, P.K. 1996. Log-Linear Mode Choice Modeling for Journeyto Work. In: The Institution of Engineers (India), Maharashtra State Centre, AllIndia Seminar on Metropolitan Transportation Strategies.
72

Sarna, A.C., & Sarin, S.M. 1985. Transportation Planners Dilemma-Modal Split andits Manipulation. Indian Highways, January.
SIAM. 2009 (March). Society of Indian Automobile Manufacturers. http://www.
siamindia.com/.
Sibal, V., & Sachdeva, Y. 2001. Urban Transport Scenario in India and Its Linkageswith Energy and Environment. Urban Transport Journal, 2(1), 34–55.
Singh, S.K. 2006. Future Mobility in India, Implications for Energy Demand andCO2 emission. Transport Policy, 398–412.
Srinivasan, K.K., Pradhan, G.N., & Naidu, G. M. 2007a. Commute Mode Choice ina Developing Country, Role of Subjective Factors and Variations in Responsivenessacross Captive, Semicaptive and Choice Segments. Transportation Research Record,Journal of the Transportation Research Board, Transportation Research Board ofthe National Academies, Washington D.C., 53–61.
Srinivasan, K.K., Lakshmi Bhargavi, P.V., Ramadurai, G., Muthuram, V., & Srini-vasan, S. 2007b. Determinants of Changes in Mobility and Travel Patterns in De-veloping Countries, Case Study of Chennai, India. Transportation Research Record,Journal of the Transportation Research Board, Transportation Research Board ofthe National Academies, Washington D.C., 42–52.
Train, K. 1980. A Structured Logit Model of Auto Ownership and Mode Choice.Review of Economic Studies, 357–370.
Train, K.E. 1986. Qualitative Choice Analysis: Theory, Econometrics, and an Appli-cation to Automobile Demand. MIT Press.
Train, K.E. 2003. Discrete Choice Models with Simulation. Cambridge UniversityPress.
73

Appendix A
Car Size Categories
Segment/Subsegment Basis Models/Manufacturer
I Passenger Vehicles (PV)A Number of
seatsincludingdriver notexceeding 6
A1 Mini Upto 3400 mmMaruti Suzuki India Limited Maruti 800Tata Motors Limited Nano
A2 Compact 3401-4000mmFiat India AutomobilesPrivate Limited
Palio, Fiat 500,Grande Punto
Ford India Private Limited FusionGeneral Motors IndiaPrivate Limited
Spark, U-VA
Honda Siel Cars Limited JazzHyundai Motor India Limited Santro, Getz, i10, i20Maruti Suzuki India Limited Alto, Wagon R, Zen,
Swift, A Star
SkodaAuto India PrivateLimited
Fabia
Tata Motors Limited Indica
74

Segment/Subsegment Basis Models/Manufacturer
I Passenger Vehicles (PV)A3 Mid-size 4001-4500mm
Ford India Private Limited FusionGeneral Motors IndiaPrivate Limited
Chevrolet Aveo (NB)
Hindustan Motors Limited Ambassador, Lancer,Cedia
Honda Siel Cars India Limited CityHyundai Motors India Limited Accent, VernaMahindra Renault PrivateLimited
Logan
Maruti Suzuki India Limited SX4, DzireTata Motors Limited Indigo, Indigo Marina
A4 Executive 4501-4700mmBMW India Private Limited 3 seriesFiat India AutomobilesPrivate Limited
Linea
General Motors IndiaPrivate Limited
Chevrolet Optra (NB)
Honda Siel Cars PrivateLimited
Civic
Hyundai Motor India Limited ElantraMercedes-Benz India PrivateLimited
C-Class
SkodaAuto India PrivateLimited
Octavia, Laura
Toyota Kirloskar MotorPrivate Limited
Corolla
A5 Premium 4701-5000mmBMW India Private Limited 5 & 6 seriesHonda Siel Cars India Limited AccordHyundai Motor India Limited SonataMercedes-Benz India PrivateLimited
E-Class
A5 Premium 4701-5000mmNissan Motor India PrivateLimited
Teana
SkodaAuto India PrivateLimited
Superb
Toyota Kirloskar MotorPrivate Limited
Camry
75

Segment/Subsegment Basis Models/Manufacturer
I Passenger Vehicles (PV)A5 Premium 4701-5000mm
Volkswagen - Audi A4, A6Volkswagen India PrivateLimited
Passat
A6 Luxury 5001mm upBMW India Private Limited 7 seriesMercedes-Benz India PrivateLimited
S-class
Volkswagen - Audi Q7, A8B Utility Vehicles (UV)B1 Max Mass
upto 3.5tonnes
M1(B1)Number ofseatsincludingdriver notexceeding 7
BMW India Private Limited X3, X5Force Motors Limited Trax, TravellerFord India Private Limited EndeavourGeneral Motors IndiaPrivate Limited
Tavera, Captiva
Hindustan Motors Limited PajeroHonda Siel Cars Limited CR-VHyundai Motors India Limited Tucson, TerracanMahindra & Mahindra Limited Scorpio, Bolero,
Invader, Commander650, CL 500/550,Maxx, Marshal,Ambulance, Xylo
Maruti Suzuki India Limited VitaraMercedes-Benz India PrivateLimited
Nissan Motor India PrivateLimited
X-Trail
Tata Motors Limited SafariToyota Kirloskar MotorPrivate Limited
Fortuner, Innova,Prado
76

Segment/Subsegment Basis Models/Manufacturer
I Passenger Vehicles (PV)M1(B2)Number ofseatsincludingdriverexceeding 7but notexceeding 9(7+1 & 8+1)
Force Motors Limited TraxGeneral Motors IndiaPrivate Limited
Tavera
International Cars & MotorsLimited
Rhino
Mahindra & Mahindra Limited Scorpio, Bolero,Invader, Maxx,Marshal, Xylo
Maruti Suzuki India Limited GypsyTata Motors Limited Sumo, Safari, WingerToyota Kirloskar MotorPrivate Limited
Innova
B2 Max Massupto 5tonnes
M2(A1)Number ofseatsincludingdriver notexceeding 13
Force Motors Limited Trax, TravellerGeneral Motors IndiaPrivate Limited
Travera
Mahindra & Mahindra Limited Bolero, Commander650, Maxx, Marshal,Rakshak, Savari
Tata Motors Limited Sumo, WingerTotal Utility Vehicles (UV)
C Multi Purpose vehicles(MPV)
M1(C) VanType vehiclesand MaxMass notexceeding 3.5tonnes
Maruti Suzuki India Ltd Omni, VersaTata Motors Ltd ACE Magic
77
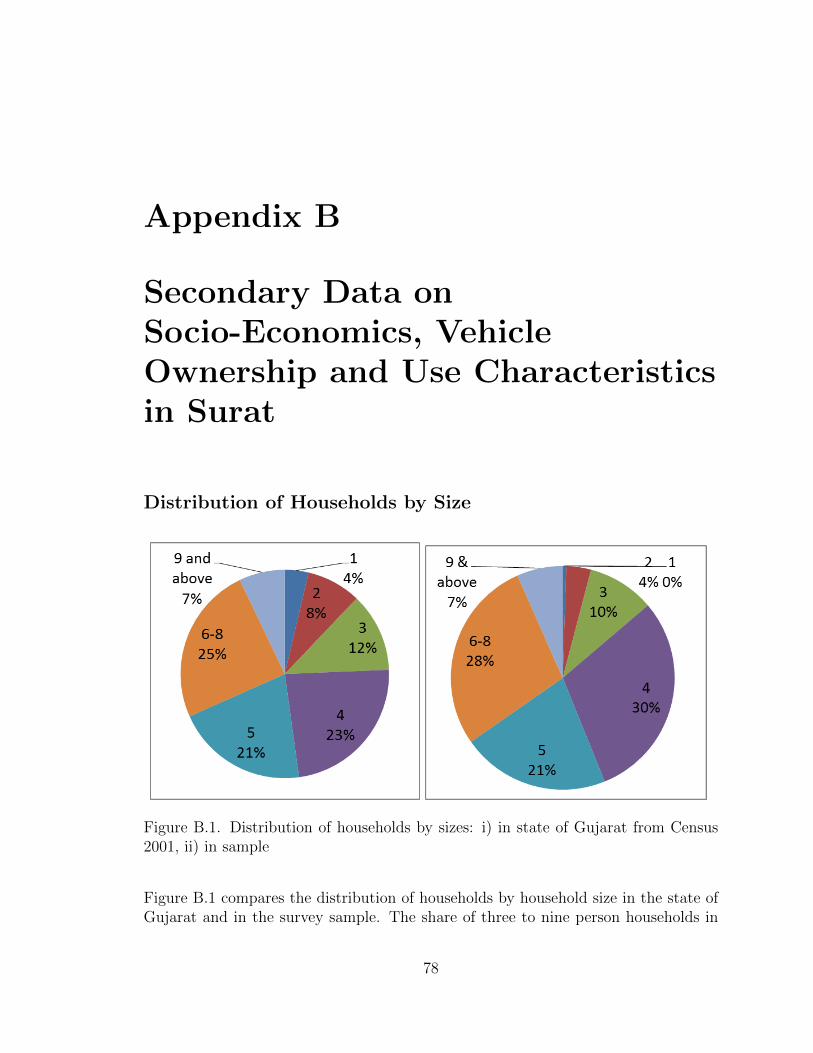
Appendix B
Secondary Data onSocio-Economics, VehicleOwnership and Use Characteristicsin Surat
Distribution of Households by Size
Figure B.1. Distribution of households by sizes: i) in state of Gujarat from Census2001, ii) in sample
Figure B.1 compares the distribution of households by household size in the state ofGujarat and in the survey sample. The share of three to nine person households in
78
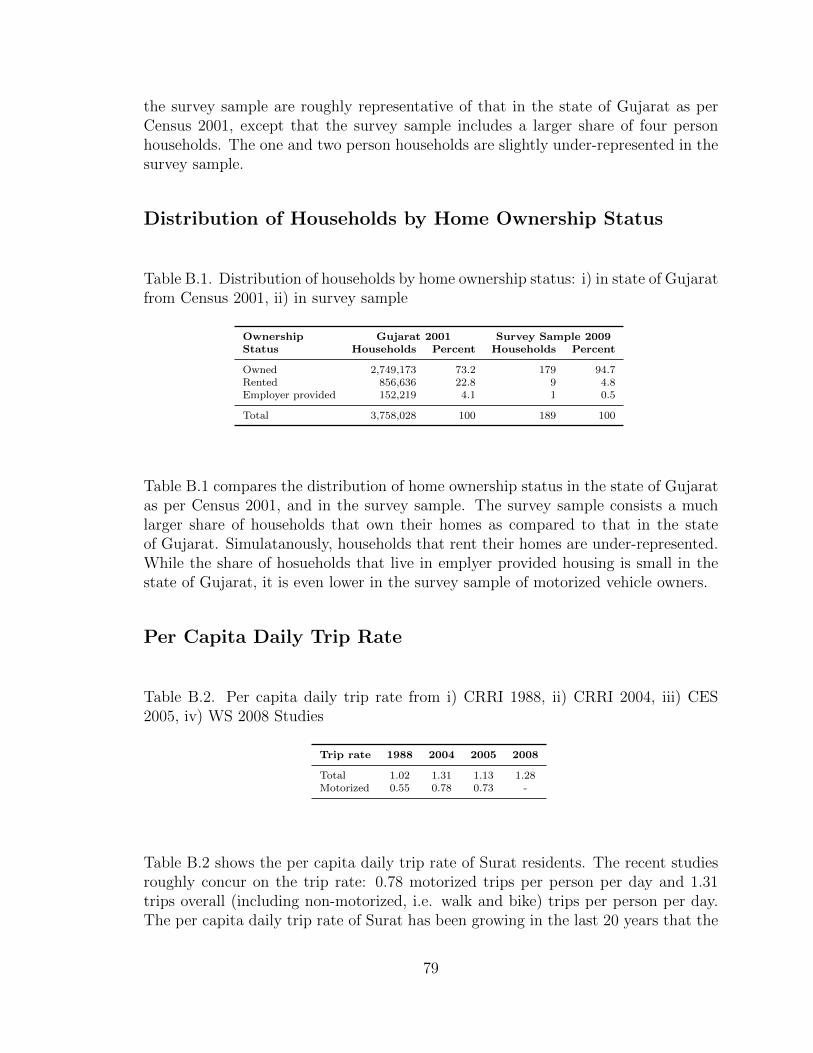
the survey sample are roughly representative of that in the state of Gujarat as perCensus 2001, except that the survey sample includes a larger share of four personhouseholds. The one and two person households are slightly under-represented in thesurvey sample.
Distribution of Households by Home Ownership Status
Table B.1. Distribution of households by home ownership status: i) in state of Gujaratfrom Census 2001, ii) in survey sample
Ownership Gujarat 2001 Survey Sample 2009Status Households Percent Households Percent
Owned 2,749,173 73.2 179 94.7Rented 856,636 22.8 9 4.8Employer provided 152,219 4.1 1 0.5
Total 3,758,028 100 189 100
Table B.1 compares the distribution of home ownership status in the state of Gujaratas per Census 2001, and in the survey sample. The survey sample consists a muchlarger share of households that own their homes as compared to that in the stateof Gujarat. Simulatanously, households that rent their homes are under-represented.While the share of hosueholds that live in emplyer provided housing is small in thestate of Gujarat, it is even lower in the survey sample of motorized vehicle owners.
Per Capita Daily Trip Rate
Table B.2. Per capita daily trip rate from i) CRRI 1988, ii) CRRI 2004, iii) CES2005, iv) WS 2008 Studies
Trip rate 1988 2004 2005 2008
Total 1.02 1.31 1.13 1.28Motorized 0.55 0.78 0.73 -
Table B.2 shows the per capita daily trip rate of Surat residents. The recent studiesroughly concur on the trip rate: 0.78 motorized trips per person per day and 1.31trips overall (including non-motorized, i.e. walk and bike) trips per person per day.The per capita daily trip rate of Surat has been growing in the last 20 years that the
79

studies span. There is a discrepancy in the 2004 and 2005 numbers obtained by twodifferent consultants, possibly due to the different methodologies and assumptionsfollowed by them. The trip rate by motorized modes have also been growing.
Mode Split in Surat
Figure B.2. Average trip length by modes in Surat based on i) CRRI 1988 ii) CRRI2004 iii) CES 2005 iv) WS 2008
Figure B.2 shows the mode split in Surat as studied by different consultants over thespan of 20 years. Once more, while the details of assumptions and methodologies areunknown to us for more accurate comparisons, the figure gives an overall view of theshare of different modes. Walk trips occupied the largest share in 1988, but its sharehas reduced significantly. While the share of bus trips was minimal, its share has nowreduced to be negligible. The share of motorized two-wheeler trips is growing andsimilarly for car trips. The mode shares indicate an increase in the use of personalmotorized vehicles possibly owing to the inadequacy in public transport and facilitiesfor non-motorized modes.
80

Average Trip Length by Modes in Surat
Figure B.3. Average trip length by modes in Surat based on i) CRRI 1988 ii) CRRI2004 Studies
Figure B.3 shows the average trip length by all modes based on two different studiesby the same consultant in 1988 and 2004. It is evident that trip lengths by all modeshad increased, especially those by bus, train, and private car.
Average Vehicle Occupancy
Table B.3. Average vehicle occupancy in Surat: CRRI 2004 Study
Mode Number of passengers
Car 1.25Motorized two-wheeler 1.11Bicycle 1.05Auto-rickshaw 2.65Auto-rickshaw (pooled) 3.42
Figure B.3 shows the occupancy of different modes in Surat as per the CRRI 2004study. The auto-rickshaws or motorized three-wheelers have the highest occupancies,especially the ‘shuttle’ or pooled auto-rickshaws. The occupancy value of cars indicatethe presence of a large share of drive-alone auto trips similar to more industrializedcountries.
81

Appendix C
Survey Proforma
82

83

84

85

86

87

88

89

Appendix D
Exploratory Factor Analysis
The responses to the Likert scale questions represented attitudes to be used asexplanatory variables in the vehicle purchase model. Each of these responses areindicators of underlying attitudes. The responses are often indicators of a mix ofunderlying attitudes. An exploratory factor analysis is conducted on the five pointresponses to obtain the the underlying orthogonal factors or attitudes from the corre-lated responses. This is a method of dimension reduction aimed to reduce the numberof explanatory variables that are used in the vehicle choice model. The method usedis principal axis factor analysis using the package SPSS 17. The output tables fromthe factor analysis process are displayed in this Appendix.
Table D.1. KMO Measure of Sampling Adequacy & Barlett’s Test of Sphericity
Table D.1 represents the outputs of the Kaiser-Meyer-Olkin measure of samplingadequacy and the Barlett’s Test of Sphericity. The KMO measure of sampling ade-quacy was 0.707 which is rated as ’middling’. The significance of the Barlett’s Test ofSphericity is 0.00, which means that there are underlying factors in the Likert Scaleresponses.
90

Table D.2. Communalities
Table D.2 shows the initial communalities for the variables. The initial commu-nalities are high for all of the variables. As such, all variables were retained for thefactor analysis.
Table D.3 shows the initial eigenvalues and the rotation sums of squared loadingsof the factors. The rotated factors are preferred since they are easier to interpretwith a greater difference in value between the high and the low loadings. 26 factorswere extracted through Principal Axis Factoring and Orthogonal Varimax Rotationwas applied. The initial eigenvalues were greater than 1 for the first 8 factors. Aspreliminary runs of the factor analysis had shown the five topmost factors to be the
91

most meaningful conceptually, we specified 5 factors to be extracted which took 11iterations. The eigenvalues of the 5 extracted factors are shown under the rotationsums of squared loadings and they cumulatively explain 43.62 percent of the variancein the data.
Table D.3. Total Variance Explained
All loadings with a value greater than 0.5 are considered in identifying each factor
92

from the rotated factor matrix, Table D.4. High loadings are obtained for the followingstatements:
Table D.4. Rotated Factor Matrix
Factor 1:The operating cost considerations are important in my vehicle purchase*
93

Saving is a virtue*Driving in congestion is a hassleFinding parking is a hassleThe personal vehicle is important for my career opportunities*The loan is important for my vehicle purchase*Cars are expensive
Factor 2:It is inconvenient to be a bus riderIt is inconvenient to be a pedestrianIt is inconvenient to ride a bicycle
Factor 3:A car is a status symbolA personal vehicle is a status symbolOn hot or rainy days I wish I had my own car*
Factor 4:I consider buying a vehicle for infrequent need*I don’t want to be seen riding a bus or an autoI don’t want to be seen walking or cycling
Factor 5:When there is something new in the market I have to buy itI have to be the first among my peers to get something newWhen my peers have a certain type of vehicle, I have to own it*(Ni, 2008)
Accordingly, the factors are names as follows:
1. Monetary and utility considerations
2. Inconvenience of non-motorized and public modes
3. Perception of status
4. Negative image of non-motorized and public modes
5. Peer influence
These factors are used for the confirmatory factor analysis in the choice and latentvariable model.
94

Figure D.1. Scree plot
Figure D.1 shows that the largest drop in eigenvalue are between the first and thesecond, and the second and the third factor. This is also evident from the eigenvaluesin Table D.3.
95