autonomous aerial water sampling - university of …cse.unl.edu/~carrick/papers/orebed2015.pdf ·...
TRANSCRIPT
Autonomous Aerial Water Sampling
John-Paul OreComputer Science and Engineering
University of NebraskaLincoln, NE 68588
Sebastian ElbaumComputer Science and Engineering
University of NebraskaLincoln, NE 68588
Amy BurginSchool of Natural Resources
University of NebraskaLincoln, NE 68588
Carrick DetweilerComputer Science and Engineering
University of NebraskaLincoln, NE 68588
Abstract
Obtaining spatially separated, high frequency water samples from rivers and lakes iscritical to enhance our understanding and effective management of fresh water resources.In this work we present an aerial water sampler and assess the system through fieldexperiments. The aerial water sampler has the potential to vastly increase the speedand range at which scientists obtain water samples while reducing cost and effort. Thewater sampling system includes: 1) a mechanism to capture three 20 ml samples permission, 2) sensors and algorithms for altitude approximation over water, and 3) softwarecomponents that integrate and analyze sensor data, control the vehicle, drive the samplingmechanism, and manage risk. We validate the system in the lab, characterize key sensors,develop a framework for quantifying risk, and present results of outdoor experimentsthat characterize the performance of the system under windy conditions. In addition, wecompare water samples from local lakes obtained by our system to samples obtained bytraditional sampling techniques. We find that even winds of 5.8 m/s have little impact onthe water sampling system and that the samples collected are consistent with traditionaltechniques for most properties. These experiments show that despite the challengesassociated with flying precisely over water, it is possible to quickly obtain scientificallyuseful water samples with an Unmanned Aerial Vehicle (UAV).
1 Introduction
Clean water is essential to our livelihoods, yet controlling water quality is an ongoing challenge. Waterborne diseases cause the death of 1.5 million under-five children every year worldwide (The United NationsChildren’s Fund (UNICEF)/World Health Organization (WHO) and Wardlaw, 2009). The human-induceddegradation of fresh water sources in the US annually costs over $2.2 billion, but the full extent of thecost is poorly known due to insufficient data (Dodds et al., 2009). Part of the challenge is our lack ofunderstanding of how water quality varies due to the spatial distribution of water transport pathwaysand contaminant source areas. Characterizing this large-scale variability remains a critical bottleneckthat inhibits understanding of transport processes and the development of effective management plans toaddress water quality issues.

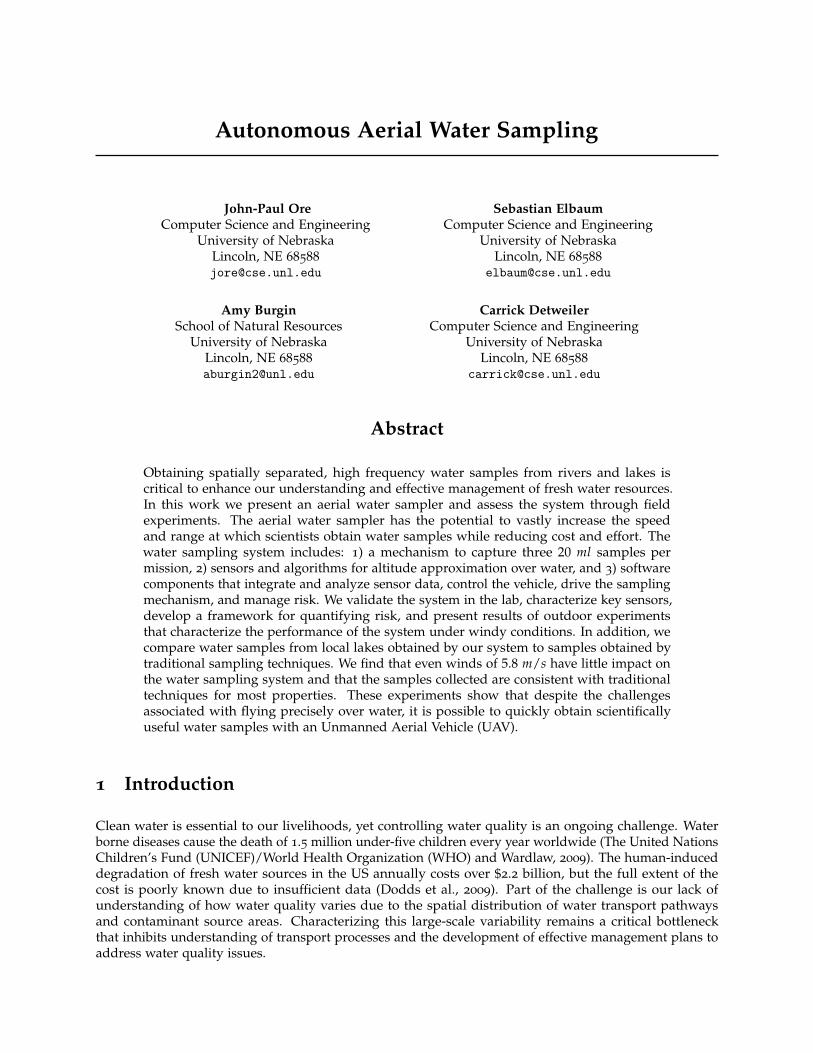
Figure 1: UAV-Based Water Sampling.
Our contribution to enrich our understanding of bodies of wateris the development and assessment of an autonomous aerialwater sampler, shown in Fig. 1. This vehicle dramatically in-creases the ease, temporal resolution, and spatial scale of watersampling, a critical, pervasive, and expensive activity requiredto properly manage water resources.
The current state of the art practice by limnologists and hydro-chemists is to collect small water samples for lab analysis, sincemany of the properties they are interested in cannot be easilyor cost effectively measured in situ. With these water samplesin the lab they can measure the chemical properties includingphosphate, total phosphorus, nitrate/nitrite, nitrogen, and am-monia, as well as biological properties, such as the presenceof toxic microcystins. Some properties can be measured in thefield, but require a literal boatload of equipment. These includetemperature, conductivity, pH, dissolved oxygen, light, turbidity,and Secchi transparency. All of these field measurements, alongwith lab analysis, together present much of the canonical datathrough which surface water phenomena are understood (Eatonand Franson, 2005).
For example, our collaborators study the Fremont Sandpit lakes (see Fig. 2). Each numbered lake isgroundwater connected, surface water disconnected, chemically distinct, and must be sampled separately.Currently, a team of three scientists tow a boat to the lake, launch the boat, navigate to the sample location,collect samples and take measurements, dock the boat, get the truck, put the boat back on the trailer, anddrive to the next lake. Each of 10-15 lakes is sampled in this manner over a long 10-15 hour day. But injust two hours, one scientist with our UAV-system could sample all these lakes, enabling the possibility ofcapturing data with unprecedented spatio-temporal resolution.
Figure 2: Sandpit Lakes - Fremont, Nebraska, USA.
Current water sampling techniques are often basedon grab sampling (e.g. dipping a bottle off the sideof a kayak) (Wilde et al., 1998), statically deployedcollection systems (Erickson et al., 2013), or using mo-bile sensors affixed to Autonomous Surface Vehicles(ASVs) (Dunbabin et al., 2009) or Autonomous Un-derwater Vehicles (AUVs) (Bird et al., 2007; Cruz andMatos, 2008). Most autonomous systems are used onlarge, open water features such as seas, large lakes andrivers, and sample for long duration, in deep or distantplaces, with high quality. All of these methods arerelatively slow, spatially restricted, costly, or difficultto deploy; none sample quickly at multiple locationswhile overcoming barriers, such as dams or land.
Our approach is to come at the problem from the air. As shown in Fig. 3, a scientist with a ground stationcomputer specifies three GPS coordinates for water sampling and then the UAV flies to each location andsamples water. As the vehicle navigates between sample locations, it can surmount obstacles such as dams,bridges, or land. To avoid cross contamination, the system pumps water and jettisons it overboard, flushingwater from the current location through the pump and tube, as shown at steps five and seven. While flyingit continuously monitors internal and external factors to determine the current risk level to avoid accidents.Once the mission is complete, the system returns to the ground station where the scientist can swap vialsand start another mission.

Figure 3: Overview of Proposed Method.
In our approach we use a micro-UAV that can be easily transported by the scientist in a car or backpack tothe study site. These flying robots are computer-controlled, lightweight, commercially available, and cancarry small payloads (< 750 g) for up to 20 minutes. Fortunately, a UAV’s limited payload is not a criticalshortcoming because water samples do not have to be very large (20 ml = 20 g) to be scientifically useful,as shown by the wide range of applications identified in Table 1. Also, the UAV’s battery-limited flightsallow it to travel nearly a kilometer and back, which is close enough for many water-sampling applications.
Obtaining water samples from a UAV, however, poses challenges that must be addressed before thesesystems can be deployed in the wild. In our previous work we delineated those challenges and presentedthe overall concept of UAV-based water sampling (Ore et al., 2013). This article extends that work byproviding a more detailed and precise account of the system, performing more extensive studies (over threetimes the number of flights) including an analysis of the impact of wind, developing a logical frameworkfor quantifying risk, and updating and extending most results based on the experiments performed overthe past year. More specifically, the contributions of this work include: 1) developing a UAV-based systemthat autonomously obtains three 20 ml water samples per flight, 2) integrating and characterizing sensorson the UAV to enable reliable, low-altitude flight (1.0 m) over water, 3) developing a framework to quantifyrisk, 4) testing the system both indoors in a motion-capture room as well as in over 90 flights the fieldat lakes and waterways, 5) characterizing the system outdoors in wind, and 6) validating that key waterchemical properties are not biased by using a UAV-based mechanism. We also discuss lessons learnedand identify a number of outstanding challenges to be addressed in future work, such as determining theimpact of waves and flowing water on altitude control.
Table 1: Water sampling applications summary
TASK SAMPLE SIZE FREQUENCY SPATIAL DOMAIN
Limnology 15 ml-1 L(Eaton and Franson, 2005) variable local, regional, and globalEnvironmental Monitoring 15 ml − 5 L (Wilde et al., 1998) variable surface and ground waterOil Spills 30− 50 ml (ITOPF, 2012) month-years surface waterDisease Tracking 10− 100 ml (WHO, 2004) once open wells, rainwater systemseDNA 15 ml-10 L (Pilliod et al., 2012) once, few Lagoons, rivers, streams, lakes
2 Related Work
Our work is part of a larger class of aerial manipulation tasks, all of which interact with the environmentby touch. Such applications have become an area of intense study, including efforts to grasp whileflying (Jimenez-Cano et al., 2013; Thomas et al., 2013), carry collectively (Michael et al., 2011; Ritz andD’Andrea, 2013), and turn valves (Orsag et al., 2014). Unlike these efforts, we do not account for thedynamics of our interaction with the environment, since the dangling tube in water exerts negligible force,instead our focus is on system robustness, safety, and ensuring scientific validity of readings. Other efforts

relate to this work in one of two ways: either an autonomous vehicle is used to take samples in aquaticenvironments or a UAV is controlled at low-altitude. We treat first the former and then the latter.
Autonomous vehicles used in water sampling are typically either Autonomous Surface Vehicles (ASVs) orAutonomous Underwater Vehicles (AUVs), both deployed in water features such as oceans or large lakes.For example, The Lake Wivenhoe ASV (Dunbabin et al., 2009; Dunbabin and Grinham, 2010) is capableof navigating throughout complex inland waterways and measuring a range of water quality propertiesand greenhouse gas emissions. Underwater, the MARES AUV (Cruz and Matos, 2008; Melo and Matos,2012) dives up to 100 m deep to monitor pollution, collect data, capture video, or follow the seabed. Otherefforts such as the NIMS system (Rahimi et al., 2004) explore semi-mobile sensor networks providingadaptive sampling. Another approach is to combine sensor networks with autonomous vehicles (Zhang andSukhatme, 2007). These vehicles and systems are good for long-duration sampling in deep or distant places.However, it is time-consuming and expensive to frequently re-deploy these systems. In contrast, our systemcan be carried in a backpack and quickly deployed to sample multiple disconnected water features from asingle launch site. Further, in situ sampling cannot yet measure all desired water properties (Erickson et al.,2013), such as the presence of suspended solids, pathogens, and heavy metals.
Other UAV control systems related to our effort (Merz and Kendoul, 2013) fly at low-altitude in ruralareas. Their system, like ours, utilizes extended state machines (Merz et al., 2006; Harel, 1987) and likewisecontain events indicating an unsafe circumstance, and transition to a state seeking safe recovery.
Our system does not incorporate obstacle avoidance, we neither build nor update a map. However, this isan area of intense study, both outdoors (Scherer et al., 2007; Scherer et al., 2012; Ross et al., 2013; Schmidet al., 2014) and indoors (Bachrach et al., 2009; Bills et al., 2011; Shen et al., 2011). Further, recent advancesin occupancy grids like OctoMaps (Wurm et al., 2010) provide a more efficient representation of obstaclesat various scales. Most of these systems devote significant payload to sensors and processing, but ascomponents become smaller and lighter, we intend to utilize advances from these efforts in future versionsof our system.
Other recent efforts for UAV height estimate include miniature radar altimeters, optical flow, and laseraltitude estimation (Kendoul, 2012). The lightest commercially available radar altimeters are still 160 g,(350 g with enclosure–heavy for a micro UAV) and are accurate to only ± 0.5 m, below the requirements ofour system. Using an off-axis rotating laser flying low over a river (Jain et al., 2013) yields ≈ 1 cm altitudeaccuracy by looking for specular returns to estimate the plane of the water. This method simultaneouslybuilds an occupancy grid for obstacle avoidance. However, sensors consume much of the payload.Traditional laser altimeters, which direct a single beam toward the ground, are easily perturbed by poorreflections and ambient light over water, so instead we chose ultrasonic rangers.
Our system flies with a small dangling pump. The flight dynamics of cable-suspended loads with UAVscan be stable (Sreenath et al., 2013; Faust et al., 2013), but our system avoids this by hanging a sufficientlysmall mass (10 g), which incurs small forces relative to those generated by our UAV.
Some multirotor UAVs take off from and land in calm water (Aquacopters, 2012; QuadH2O, 2014). We donot adopt these platforms or attempt to harden our system to be waterproof because: 1) fast-moving wateror waves might make it impossible to take off, 2) the sampling mechanism and battery enclosure would becomplete sealed, making removal difficult and decreasing the efficiency of swapping vials or batteries, and3) radio strength attenuates near the water’s surface and we want the UAV and base station in constantcontact so that users can monitor the system and comply with UAV regulations.
Another low-altitude UAV akin to ours (Goktogan et al., 2010) surveils and sprays aquatic weeds at lowaltitude using a RUAV (“rotary UAV” i.e. a scale helicopter) with a laser altimeter. Our work similarly doesnot address global planning and requires a human expert to decide where to perform tasks (weed expertsin Goktogan’s case and lake experts in ours). Our work differs from this in that we use ultrasonic withpressure for altitude, since laser altimeters work poorly at short range over clear water, and we retrieve a

liquid rather than depositing it. In addition, we focus on validating the system’s utility for water scientists.
Our earlier publication on aerial water sampling (Ore et al., 2013) is the first description of using UAVsfor water sampling, to our knowledge. Subsequent to our effort, another group (Schwarzbach et al., 2014)explored aerial water sampling using UAVs. Using a small-scale helicopter (1.8 m rotor), they arrive atan overall similar design, with a dangling pump and a water payload as close to the center of gravity aspossible. Their work explores the control architecture and does not directly address measuring altitude overwater, field testing, or wind resilience. Their larger vehicle can carry 500 ml of water but is less portableand deployable by field scientists.
Flying over water is inherently risky. Several efforts in the automated systems and robotics domain havedeveloped strategies to manage and mitigate risk. At the highest level, we note the system engineeringframeworks developed by institutions like NASA (Dezfuli et al., 2011; Dorofee et al., 1996) which focus on“identify-analyze-plan-track-control” loops to relate and decompose individual risks as they affect performancerisks. More specifically to the robotics domain, we note efforts tailored for particular contexts. For example,risk management has been implemented for robot arms as a “risk field” (Lacevic and Rocco, 2010) or“danger criterion” (Kulic and Croft, 2005) as they get close to a person, or more commonly as a “riskfunction” (Montemerlo et al., 2002; Sattar and Dudek, 2014) that is meant to minimize risk by estimatingthe cost of acting on poorly understood human input and, when a certain threshold is exceeded, requiringthe human to reiterate the input. We build on these concepts of risk factor decomposition and identification,risk assessment, and mitigation actions. More specifically for Unmanned Aerial Systems (UAS), tabulationsof failures and their frequencies (Clothier and Walker, 2012) seek to characterize incidents and their severity.This is still difficult as few failures are disclosed and documented, and because UASs encompass a myriadof emerging systems. Like this approach, we tabulate our experience in the field in the form of positivetests to identify previously seen operational space and use our experience to help us identify potential riskfactors. Unlike this approach, we do not assume that our system will behave like other UASs in general,due to the particularities of our system in a rare application domain with limited prior-data.
3 Technical Approach
Through discussions with our hydrologist partners we derived a set of four key high level requirements forthe aerial water sampler: 1) Carried and operated by a single scientist, 2) Autonomously capture at leastthree 20 ml water samples at predefined locations within a 1 km range, 3) Does not bias water propertieswhen compared with current practices, and 4) Cost-effective enough to prompt the shift of current practices.
Through this work we start addressing these requirements. The prototype we have developed can beoperated by a single scientist, collect the required samples without biasing water properties, and increasethe temporal and spatial scale of collection to make it more cost effective than current practices. Still, as weshall describe in future work, this aerial water sampler does not completely cover all the requirements as,for example, it still lacks the front end to facilitate its operation by scientists, it is not resilient to all typesof weather, and it cannot gather deep water samples. Our current system requires constant contact witha ground station to accelerate rapid prototyping, but could move processing onboard at the expense ofmission duration since we have 150 g of available payload. We find a ground station acceptable at thisstage of development since flying beyond line-of-sight is currently prohibited by US aviation authorities.
While keeping these limitations in mind, we now describe how we address these requirements through: 1)Mechanical design of the sampling mechanism in Section 3.1, 2) Sensor configuration and characterizationfor near-water flight in Section 3.2, 3) Altitude estimation over water in Section 3.3, 4) Framework for riskmanagement in Section 3.4, and 5) Software systems, including logic used to ensure the vehicle stays out ofthe water in Section 3.5.

(a) Sampling mechanism.
(b) Rigid plastic tube to direct water flow: the‘Needle’.
(c) ’Flushing’ water to clean system.(d) Subsystem details including mounting points.
Figure 4: Mechanical Design: Key Elements.
3.1 Design of UAV Water Sampling Mechanism
The water sampler is built onto an AscTec Firefly (Achtelik et al., 2012), a hexrotor with a maximum payloadof 600 g. Total flight time is 15-20 minutes. The Firefly comes equipped with GPS, 3-axis accelerometersand gyroscopes, compass and an air pressure altimeter. This UAV communicates with a human backuppilot using a radio link, and has two 2.4 GHz 802.15.4 radios for remote autonomous control and sensorfeedback.
The water sampling mechanism is held together by a ‘chassis’ shown in a 3-D rendering in Fig. 4a. Thechassis holds three 20 ml screw-top glass vials, spring-hinged lids, a servo to direct the water, and hasmount points for the dangling tube, embedded controller, and ultrasonic range sensors. The ‘chassis’ ismade of 3-D printed ABS plastic and integrates with the airframe at four mount points, as shown in Fig. 4d.
Water flow is directed to the vials through a servo-controlled plastic tube called the ’needle’. Fig. 4b showshow the servo confines the rotation of the needle in a plane and can rotate 160◦ total, 80◦ from center ineither direction. We constructed the vial chambers so that the servo-rotated needle lifts the lid, and once theneedle rotates away from the vial, a spring holds the lid closed. As shown in Fig. 4c, the servo rotates theneedle into one of five pre-defined positions: three vial-filling positions and two water-jettisoning positionswhich flush water through the system, cleaning it between samples. Flushing is shown in Fig. 4c. We havetwo gaps for flushing: between vials one and two, and between vials two and three. By having two gaps,we reduce the risk of cross-contamination by never moving the needle past a lid that seals a filled vial. Theduration of the flushing phase is configurable, defaulting to 20 s, three times the duration required to fill a20 ml vial 1.
1Initial experiments show that 20 s flushing avoids cross-contamination. We plan to rigorously characterize this in future work.

The needle is connected to a 1.05 m plastic tube hanging below the UAV with a micro submersible waterpump (TCSMicropumps, 2014) attached at the end of the tube. We chose the length of the 1.05 m tube asthis was a good balance between length of tube and the flow rate (7.5 ml/s at 1.05 m) when supplied withvoltage ranges recommended by the manufacturer. We selected a flexible tube that could bend enoughto curl under the UAV during landing, while rigid enough to dampen motion-induced oscillations. Thetube is mounted below the center of mass of the unloaded vehicle, to minimize changes in flight dynamicswhile pumping.
A breakaway mechanism, shown in Fig. 4d, allows the pump and tube mechanism to release if subjectedto greater than 15.1 N of force. This is somewhat less than the maximum UAV lifting thrust of ≈ 17.7 N.This prevents the UAV from getting stuck if the pump becomes entangled in the environment. So far, allentanglements have worked themselves free before the breakaway released.
To protect the pump from becoming clogged by small rocks or aquatic plants we enclose it in a sewn meshfilter to form a bag around the pump. This is especially useful when pumping in shallow water where thepump frequently hits the bottom. We tried different grains of mesh, and found that finer grained meshes(< 500 microns) inhibit flow by capturing air bubbles when submerged. Larger-grained meshes (≥ 2 mm)allow particles or pebbles that can block and perhaps damage the pump. We chose a 1 mm-grained meshto protect the pump while allowing flow.
3.2 Sensors for Near Water Flight
Flying near water is dangerous to the UAV because it can damage the electrical and mechanical systems,yet flying near water is absolutely necessary to sample water. It is difficult because the UAV does notcome equipped with sensors to detect its surroundings, especially anything below it. More specifically, tofly close to water, we need a more accurate altitude estimate than the UAV’s built-in pressure altimeter.The built-in pressure altimeter readings drift multiple meters over the time of a flight and are thereforeinsufficiently accurate to fly near water. We considered various altitude sensors (as discussed in Sec. 2),and chose ultrasonic rangers and water conductivity sensors to improve our height estimation. We usetwo Maxbotix MB1240-EZ4 ultrasonic rangers (Maxbotix, 2014) pointing straight down and flanking thesampling mechanism 10 cm from the center to increase the likelihood of an unobstructed path to thewater’s surface, which might otherwise be blocked by the swinging tube and pump. The ultrasonic pulsepropagates in the shape of a cone, and this particular model has the smallest cone available. The shape ofthe cone is important because we want the sensor to detect only what is immediately below it, and not thetube, which is below it at a small angle.
Figure 5: Water conductivity sensors.
A problem with narrow cone ultrasonic sensors is that they stopsensing reliably when not pointing straight down. At large pitchor role angles, > 20◦ at an altitude of 1.0 m, the ultrasonic wave re-flects away from the vehicle and the sensor reports MAX RANGE.We address this large angle problem by rejecting large measure-ments. In practice, such extreme angles are rare while hovering,and we plan missions to approach the water from above ratherthan flying close to the water at a steep attack angle.
Each ultrasonic ranger samples at 10 hz and we offset their sampletime by 50 ms to prevent interference. This also increases the ratethat altitude information is acquired to 20 hz. This rangefinderis well suited to rotorcraft because of its resilience to motor noise,±1 cm accuracy, and reliability within 2 m.
In addition to keeping the vehicle dry, another reason why it is important to have accurate altitude is thatthe pump must be submerged and primed prior to operation. To know that the system is actually touching

water and not just approaching dry ground, and as an additional safety system, we augmented the systemwith water conductivity sensors, as shown in Fig. 5. We place water conductivity sensors every 10 cm fromthe bottom of the sample tube, up to 50 cm, to ensure that the system knows when its too close to the water.The conductivity sensors also govern the pump. An onboard controller turns on the pump only after beingwet for more than 400 ms that allows it, as experimentally determined, to prime.
By using ultrasonic sensors and conductivity sensors together, we have an accurate, affordable, redundantsensor configuration for near-water altitude estimation. The full characterization of these sensors overwater is provided in the next section.
3.3 Altitude Estimation Over Water
Figure 6: Indoor Testbed for Water Sampling.
Even after we add sensors to sense below the UAV, thesensors might read incorrectly because we have added atube that can swing in front of the sensor during flight, anda pump that can generate other dynamics. We could en-counter wind gusts, low battery, weak radio signals, sensornoise, or the pump could become entangled with the envi-ronment. These problems might appear individually or inany combination. We knew from the beginning that if weadopted a method such that we do not land in the water in-tentionally, then altitude estimation to sample water wouldbe critical so we do not land in the water unintentionally.This is why the physical design emphasizes redundantrange sensors with additional conductivity sensors so thatmultiple measurements confirm our altitude estimate andincrease the likelihood of a successful sampling result.
To form an altitude estimation over water, we started bycharacterizing the ultrasonic sensors during flight overwater without the dangling tube and pump. To simulate being over a river or lake, we purchased a fish tankand filled it with 10 cm of water. Our indoor testbed is shown in Fig. 6 inside our Vicon motion captureroom. We placed acoustic foam over the edge of the fish tank to absorb the ultrasound waves and ensurethe tank is not detected. Then we created a program to fly the UAV over the fish tank so we could comparethe ultrasonic to Vicon altitudes. The results are shown in Fig. 7, during which the UAV was over water,and the ultrasonic readings are shown offset by 15 cm, the height of the water in the fishtank. The data wasgathered during autonomous flight, flying the UAV to 2 m above the fish tank, then descending to 1.5 mand then 1.25 m.
Figure 7: Altitude over fishtank.
As seen in Fig. 7, the ultrasonics closely follow Vicon groundtruth, although they lag ≈ 180 ms behind as the UAV de-scends. The lag is caused by the latency of the ultrasonics,but the lag is less important for our system since we aremost concerned with accurate readings when the UAV ishovering and we limit the descent velocity so that the systemhas more time to detect the water’s surface. In some cases,as shown near 5 s, the ultrasonics exhibit spikes. This isrelatively rare, sometimes caused by the dangling tube, andtypically occurs at longer ranges (+1.85 m), and becomesmore pronounced above 2.5 m. We have found that it rarelyeffects both sensors simultaneously, but having more thanone sensor is important to filter sporadic noisy readings.

Figure 8: Altitude Estimation Information Flow.
Based on these findings, we form an altitude estimate in two ways. First, at low altitude we utilize aKalman Filter of ultrasonic ranger and pressure sensor readings. Second, at high altitudes, we use thepressure sensor plus an offset from the low-altitude Kalman estimate. Fig. 8 shows an overview of thealtitude formation process.
We employ a scoring heuristic to pre-filter the ultrasonic readings, because of non-gaussian noise andincorrect readings when the flexible tube swings in front of an ultrasonic sensor or at higher altitudes.We observe three types of errors: first, as mentioned above, we observed spikes above 1.85 m; second,when flying, especially in wind when the vehicle has higher pitch or roll, one of the ultrasonics can becontinuously blocked by the tube, causing readings far away from our prior estimates; third, periodicviews of the tube cause a burst of low readings and high variance. Rather than model the non-gaussiannoise, we assume that at any time only one of the two sensors will be occluded by the dangling pump. Wealso assume the two sensors yield nearly identical values when not occluded, because of their physicalplacement.
To choose between the sensor readings, we use a scoring heuristic. Our heuristic is shown as pseudocodein Alg. 1. Starting in line 11 we give strongest preference to values within the maximum range (< 1.85 m),then in line 15 we score based on proximity to the current estimate (within 0.075 m), then in line 18 wegive weak preference based on tolerable variance during the last one second (< 0.08 m2). If more than onesensor has the same score, we average the readings.
The datasheets for the Maxbotix MB1240-EZ4 ultrasonic rangers indicate a maximum range of 8 m, but inpractice when mounted near UAV propellers we empirically determined a maximum range of 1.85 m. Wedetermined the proximity threshold by examining the maximum observed difference between continuousreadings of the two sensors when flying over typical terrain and especially when changing altitude. Forthe variance, we performed flights with aggressive maneuvers and observed the variance induced duringpartial occlusions of the ground by the swinging tube. These thresholds together help select the sensorreading that satisfies the linear and gaussian-noise assumptions of a basic Kalman filter.
The final altitude estimate uses the Kalman estimate at low altitude and the pressure sensor with an offsetat high altitude as shown in Fig. 8. At low altitudes, the Kalman estimate is accurate enough to assurevehicle safety, while at high altitude, the pressure sensor is sufficient and if sensor drift forces the systembelow two meters, the low-altitude controller will take over. Anytime the vehicle transitions from lowto high altitude, the pressure sensor is offset with the last best estimate from the Kalman Filter. Whendescending, we limit velocity so that the UAV can stop before coming within one meter of the water.
We enforce additional safety checks with the water sensors on the tube. If the water sensors indicate that

the tube is too deep, then the UAV ascends to a safer altitude. The water sensor data is not directly addedto the Kalman Filter both because they are slow (0.5 s) and also because occasional water droplets from thepump cause false readings. In Section 4 we validate this approach with indoor and field experiments.
Algorithm 1 Prefilter sensor readings to avoid non-gaussian noise and spurious readings. Although ourcurrent system uses only two ultrasonics, this prodecure supports multiple sensors.
1: procedure PrefilterUltrasonicReadings(ultrasonicReadings, currentKalmanEstimate)2: maxRange = 1.85 . meters3: proximityThreshold = 0.075 . meters, empirical4: varianceThreshold = 0.08 . meters2, empirical5: numUltra← 26: bestScore← −17: sumO f BestReadings← 08: countO f BestReadings← 09: for i← 1, i ≤ numUltra, i← i + 1 do . iterate over all ultrasonics
10: ultrasonicScore[i]← 0 . Initialize11: if ultrasonicReadings[i] < maxRange then . ensure range12: ultrasonicScore[i]← 4 . highest priority13: end if14: if abs(currentKalmanEstimate− ultrasonicReadings[i]) < proximityThreshold then . proximity15: ultrasonicScore[i]← ultrasonicScore[i] + 2 . medium priority16: end if17: if abs(getVariance(ultrasonicReadings[i], 1 sec) < varianceThreshold then . variance18: ultrasonicScore[i]← ultrasonicScore[i] + 1 . least priority19: end if20: if ultrasonicScore[i] > bestScore then21: bestScore← ultrasonicScore[i] . track best score so far22: end if23: end for24: for i← 1, i ≤ numUltra, i← i + 1 do . iterate to find all best scores25: if ultrasonicScore[i] = bestScore then26: sumO f BestReadings← sumO f BestReadings + ultrasonicReading[i]27: countO f BestReadings← countO f BestReadings + 128: end if29: end for30: bestValue← sumO f BestReadings/countO f BestReadings . average
return min(bestValue, maxRange) . input to Kalman Filter31: end procedure
3.4 Risk Management
We approach risk and risk management as a technical challenge of the same order as mechanical design,sensors characterization, and software architecture. Our approach is to adopt a level of risk managementthat matches the scale of our endeavor and leverages our experience building and operating the system.Our aerial water sampler is meant to operate over water and can resist some light water splashes, but itwas not designed to be water resistant. As a result, falling into the water is one of the system’s largestrisks, one that we have designed against by incorporating a variety of sensors (described in Section 3.2) tosupply data about the distance to the water, and by adopting a conservative approach to fuse and use thatinformation. Still, we are concerned that factors such as the wind, the distance to the safety operator, thepresence of obstacles in the vicinity of the operating area, the water load on the system, sensor variability,and other elements that we could not anticipate or cost-effectively design for could significantly affect thesystem operating risk.

Table 2: Examples of water sampling variables
VARIABLE DESCRIPTION DATA TYPEAltitude (z) floatVelocity in z floatConductivity Sensors (Water Sensors) int (5)Ultrasonic readings {float, float}position x, y {float, float}Battery level floatIs overwater booleanWind speed mean 2-sec floatWind speed mean 5-sec floatPrevailing wind speed (2-min mean) floatPrevailing wind direction floatGust factor floatSatellite count intAbsolute distance UAV-User floatManhattan distance UAV-Base floatx, y distance to obstacle floatRadio strength - radio n float[int]Mass of UAV system including water (grams) int
To assess and mitigate risk, we build on (Sattar and Dudek, 2014) notion of assessors, functions that canmap variables’ values to quantified risks. We extend that approach taking into consideration that 1) thelikelihood that particular inputs resulting in Loss of Vehicle or Loss of Mission are as yet poorly understood,2) positive test cases can help delineate the boundaries of known and less risky operational space, 3) wewant the system to take precautionary actions without necessarily requiring human intervention, and 4) wewant to account for specific foreseen risks and general unforeseen risks within one logical framework.
Given a system S, let V denote the set of variables that can be known or measured by S. These variablesand their values constitute the basis on which a system developer can assess risk through the use ofassessor functions. Using an assessor κ, the system developer can determine the quantity of individualrisk, ρ, a non-negative real number, contributed by certain variables values as determined by κ. That is,κ : V′ ⊆ V → ρ. An assessor κ could be as simple as a function that identifies the maximum value fora variable or could be more complex, like a polynomial over the derivative of multiple variables. Theweighted sum of all individual risks, the total risk, is denoted by τ. The total risk is then τ = ∑
|K|i=1 contiρi
where conti determines how much each individual risk contributes to τ. The system developer can then usethe individual risks ρ or the total risk τ to determine how and when to respond with actions to mitigaterisk. More specifically, given a list of available mitigating actions A = (α1, α2, . . . αj), the developer definesrisk response functions that map risk to specific action sequences to be triggered when thresholds for ρ orτ are reached. The functions take the form of f : (ρ, τ)→ B, where B = [α : α ∈ A].
In the context of our aerial water sampling system, Table 2 captures the set of variables we considered.Our assessors operate on some of these variables, and come in two forms: expert and learned. Expertassessors address risky circumstances we expect to encounter, like the distance from the UAV tothe water, which we assume is riskier with increasing proximity. Learned assessors stem from ourprevious work (Jiang et al., 2013), wherein we use positive test cases to learn invariants in systemvariables, and automatically generate monitors. These boundaries are then automatically detectedand encoded into an assessor. Furthermore, learned assessors can be formulated to describe moreintricate relationships like derivatives, temporal properties, or the shape of publisher-subscriber graphs.As a matter of illustration, here are four of the key assessors we implemented that provided individual risks:
Expert : κWater−proximity : (Altitude(z), ConductivitySensors, WindSpeed)→ [0, 1]

Table 3: Examples of water sampling actions
TYPE ACTIONSpecific Reset target sampling altitudeSpecific, General Limit velocity downSpecific, General Increase altitudeSpecific, General Slow xySpecific, General Return to baseSpecific Extra flushingSpecific Reboot embedded systemSpecific Move upwind from obstacle
Expert : κObservability(DistanceUAV −User, Altitude(z), WindSpeed)→ [0, 1]
Learned : κUAV−velocity(UAV − pitchVelocity, UAV − rollVelocity, UAV − zVelocity)→ {0, 1}
Learned : κState−transitions(FiniteStateMachineO f SystemOperatingStates)→ {0, 1}
The first two assessors were defined by us, the last two were automatically inferred based on the tracescollected during system testing. The risk values returned by the expert assessors are real numbers between0 and 1, and binary values for the learned assessors (they generate a value of ’1’ when an invariantis violated). Surprisingly and as it will be shown in the experimental section, the wind did not turnout to be as significant a factor in system operation and success rate as we suspected. Distance to thesafety operator, on the other hand, was an obvious risk-increasing factor as judging distance from thesystem to the water when observing from longer distances became more challenging, making the operatorjittery or too slow to react. We explore this further in Section 4.3. Table 3 contains some of the actionswe mapped to risk values, where each action is classified as being targeted by individual or generalrisks. For example, if κObservability < minAcceptableObservability, then ReSetTargetSamplingAltitude =BaseAltitude + (1− κObservability) ∗ coe f f icient, that is, if observability is below a threshold, then the targetsampling altitude is increased in proportion to the decreased visibility.
3.5 Software Architecture
The high-level software architecture is shown in Fig. 9a. The software system can be thought of as havingtwo parts: 1) code on a ground station using the Robot Operating System (ROS) which handles low-levelcommunication with the UAV, mission control, risk management, navigation, state machines, and altitudeestimate; 2) code on an embedded controller attached to the UAV that receives instructions from the groundstation, controls the water-sampling subsystem, reads ultrasonic and water sensor data, and broadcasts thewater-sampling sub-systems state. These two parts communicate with one another via XBee radio links.Both sub-systems incorporate assessors to detect high risk water sampling or navigating conditions basedon the sensor readings, and restart a mission. In total, the system includes about 7K lines of C, C++, andPython code.
At a high level, the software system implements a Finite State Automata (FSA) as shown in Fig. 9b. Thesestates together are an abstraction of the behavior of the whole system. Each oval in the figure represents alogical state, which is encoded in the software as a configuration of ground control and embedded systemsoftware. The arrows in the figure represent state transitions, labeled with high-level descriptions of theevent that triggers a transition from one state to another. The flow of activities is clockwise starting fromthe OFF state in the upper-left corner.
From OFF, the system starts when the UAV and ground station are ready, and then the control flows toMISSION CONTROL. If a mission is available, the system transitions to the NAVIGATING state, where the

(a) High-level organization of software architecture. (b) Whole system finite state automata with samplingstates. Dotted Box surrounds the water-sampling
portion of the state machine.
Figure 9: Software and state machine overview.
UAV takes off and goes to a GPS location. Once the UAV arrives at the sample location (waypointAchieved),the system moves to the DESCENDING state. When the target height has been reached, the system tries todetect water (WAIT FOR H2O - FLUSH), and once water is detected, water is flushed through the tubeto clean it. After flushing completes, the systems starts PUMPING, where it captures water in a vial, andstarts or stops the pump based on whether the conductivity sensors report H2O or noH2O. After pumping,or if the system takes too long to pump, or if the altitude ever goes to low (highRisk), then the systemtransitions to the ASCENDING state. This moves the vehicle up away from the waters surface and thepossible danger of getting wet. After ascending, the system returns to MISSION CONTROL and eitherstarts a new mission or returns to base and ends the program.
The software coordinates these activities through: 1) waypoints, which are compared to the measuredlocation of the UAV, so that the UAV arrives at the desired sample location and descends to the targetheight, 2) timers, which track how long the pump has actually been pumping and infer that the tube hasbeen sufficiently flushed or that the vial is full, and 3) assessors on sensor values to measure risk andensure the sampling altitude is safe.
4 Empirical Assessment
In this section we assess four different aspects of the aerial water sampler. We start by evaluating the systemcapabilities to stay at the target altitude while sampling in Section 4.1. In Section 4.2 we start to assess thesystem effectiveness in collecting samples. Next, we analyze the system performance while manipulatingthe target sampling altitude under various wind speeds ranging from 0 to over 5 m/s in Section 4.3. Last,we compare the water samples properties when collected by hand versus with the aerial water sampler inSection 4.4.
4.1 Maintaining Altitude While Sampling
The outdoor altitude control assessment was conducted on a human-made waterway along Antelope Creekin Lincoln, Nebraska, USA. The water at this location is 1− 2 m deep. For these outdoor tests we chose acalm day with wind speeds measured at less than 0.27 m/s with a hand-held anemometer.

Figure 10: Vehicle altitude and pump depth while sampling outdoors.
We recorded the ultrasonic, pressure sensor, and Kalman-filtered height estimate, as shown in Fig.10.During this study the UAV always flew at low altitude. This figure shows the UAV while it ‘approaches’the sample destination and the critical ‘sample’ stage when the UAV descends and maintains altitudeto pump water. Compared with altitude tests indoors, the ultrasonic sensor readings had more spikes,indicating additional noise2, but the dual ultrasonics still allowed for successful altitude control. The figurealso shows the depth of the pump, as detected by the water sensors on the tube. Both the first and secondwater sensor are activated during sampling, but never the ones above. We noticed that the water sensorskimmed the surface as the UAV approached the sample location, which is reflected in Fig. 10. During theoutdoor altitude tests, we observed a larger variation in x and y during sampling due to GPS inaccuracy,which impacts height as the UAV tilts as it tries to adjust its location. These tests confirm that our filteredaltitude estimate works well at near proximity to water in calm conditions.
4.2 Water Sampler Effectiveness
We tested the water sampling system effectiveness both indoors and outdoors. Indoors, we performautonomous missions that launch the UAV to 2.0 m, fly over the fish tank (Fig. 6), descend to the samplingheight where the pump is submerged, take a sample, and then ascend back to 2.0 m. Each test consisted ofthree samples, and afterward the water sample vials were checked. Any amount less than the top of the‘neck’ of the sample vial was recorded as less than full. We completed a total of 30 trials. Each trial took 4-5minutes flying, with an additional 5-10 minutes to set up the system, empty the vials, and periodicallychange batteries.
Table 4 summarizes the results. Overall, from the 90 consecutive collected samples indoors (30 trials with 3
samples each), 81 were full (90% success). To better understand the relation between the success rate andthe use of our ultrasound and pressure altitude controller, half of the samples were collected using thealtitude reported by the Vicon motion capture system. The second and third rows of Table 4 show thatthe success rate is nearly the same for both Vicon and ultrasonic altitude, which indicates that ultrasonicrangers are suitable for height estimation over water. Of the indoor sample failures, six of nine were over
2The noise from Ultrasonic 1 in Fig. 10 is an extreme example, as there was faulty cabling. However, the altitude estimate tracks inspite of this noise.

Table 4: Sampling Success Rate
Altitude Trials Samples Full > 12 < 1
2 % Full
Indoor 30 90 81 6 3 90.0Vicon 15 45 41 3 1 91.1Ultrasonic 15 45 40 3 2 88.9
Outdoor 28 84 70 11 3 83.3
Grand Total 58 174 151 17 6 86.8
half-full. Failures were caused by the pump landing outside the fishtank or the pump failing to self-prime.
We performed similar outdoor experiments to test the effectiveness of the sampling system when controlledautonomously over water. The test site is shown in Fig. 11 where we have permission from the UnitedStates Federal Aviation Administration (FAA) to perform UAV test flights, in the form of a ”Certificate ofWaiver or Authorization” (COA). We programmed the system to collect three samples. Since our outdoortest facility has a water feature that is long but only 3 m wide, the computer controlled the yaw and z whilea human pilot controlled the system in x and y. The results of this test are shown in Table 4. We repeatedthe outdoor sample mission 28 times, for a total of 84 samples, during winds from 1.5 to 5.8 m/s. Thesuccess rate for fully filled vials was 83.3%, with 11 of the remaining 14 over half full. Failures to pumpoutside were caused by variations in altitude, the pump not priming, and occasionally the mechanismwould run slowly because of silt. Overall, within the wind and environmental constraints, the systemdemonstrated the ability to maintain altitude and retrieve samples.
4.3 Environmental Factors
Figure 11: Sampling in wind at our outdoortest facilities.
Wind is a key environmental factor in any aerial field deploy-ment. The FireFly is specified to operate by the manufacturerin winds up to 10 m/s with a payload while in GPS mode,and in our experience it can maintain an approximate po-sition in an open area in winds as high as 15 m/s. However,when close to the water, even winds less than 10 m/s disruptthe system’s ability to sample water successfully in severalways: 1) wind changes the air pressure around the vehicle,causing the pressure altimeter to register large and rapidchanges in altitude, 2) wind blows the dangling tube awayat an angle (+30◦), reducing the effective tube length, 3)wind disrupts water flow at the needle, causing less waterto enter the capture vial, and 4) stronger winds appear tochange ‘ground effect’ behavior near the water by displacingthe column of pressurized air under the vehicle to a positiondownwind, as observed by ripples in the water. We knowfrom experience that wind perturbs altitude control andcan bring the vehicle alarmingly close to a swim. Yet ourmission requires that we fly close to achieve a high samplingsuccess rate. During sampling, we set a ‘target altitude’ thatthe vehicle attempts to maintain while pumping water intothe vial. We want to find a target altitude that balances theincreased risk of total failure while close to the water, with the increased sampling performance closer tothe water. Therefore we designed an experiment to test the effectiveness of the sampler at various targetaltitudes across a range of windspeeds.

Table 5: Sampling Success Rate by Wind Speed and Target Altitude
SUCCESS RATE (% Full)TARGET ALTITUDE (m) WIND SPEED (m/s) TOTAL
0− 2.7 2.7− 3.5 3.5− 4.5 4.5− 5.3 5.3+
0.72 100 95 92 76 87 920.82 90 79 86 65 80 820.92 85 89 89 71 70 831.02 88 64 49 50 47 601.12 10 37 42 30 43 34
TOTAL 81 73 69 56 66 71
Table 6: Minimum Altitude (avg) by Wind Speed and Target Altitude
AVERAGE MINIMUM ALTITUDE (m)TARGET ALTITUDE (m) WIND SPEED (m/s) TOTAL
0− 2.7 2.7− 3.5 3.5− 4.5 4.5− 5.3 5.3+
0.72 0.48 0.49 0.43 0.43 0.35 0.430.82 0.56 0.60 0.52 0.45 0.43 0.510.92 0.69 0.71 0.54 0.61 0.51 0.611.02 0.75 0.76 0.77 0.55 0.65 0.701.12 0.88 0.88 0.86 0.78 0.77 0.83
TOTAL 0.67 0.69 0.62 0.56 0.54
We programmed the UAV to fly over the small water feature at our outdoor test facility (Fig. 11) and samplethree times, ascending between samples to four meters. During this experiment and as we did before,the computer controlled altitude and yaw, while a human backup pilot controlled x and y because of thenarrow profile of the water feature at our outdoor test facility (< 3 m, about the same width as GPS error).We measured windspeed using a portable weather station affixed to a tripod situated five to six metersfrom the sample location at two meters above the ground. The wind station records speed and directionat 4 Hz directly into the system’s trace file. We average the windspeed during each sample event, andverified the readings compared to measurement from a hand anemometer. We tested five target altitudesfrom 0.72 m to 1.12 m in 0.10 m increments. We chose heights in this range because at a target altitudeof 0.72 m in stronger winds the vehicle can get very close to the water and at 1.12 m the pump barelytouches the water. During this experiment, we overrode the risk management mechanisms triggered bythe conductivity sensors, ultrasonic sensors, and altitude so we could continue to sample even though thealtitude over water transgressed the safe operating boundaries specified by the risk management system.During the experiment, we changed the target altitude after each trial so that as the wind changed duringthe day we could collect data at each target altitude across a range of windspeeds. We conducted 75 trialsof three samples each in three days for a total of 225 samples and binned the results by windspeed. Wechose the bin sizes so that each bin would have at least four samples.
The results for the sampling success rate is shown in Table 5. The highest success rates occur at the lowesttarget altitude (0.72 m), and the highest altitude was the least successful at all windspeeds. This is becausethe pump remains completely submerged in spite of altitude perturbations. Even in the strongest windsmeasured during this test, the sampling success rate remains ≥ 70% successful with a target altitude at orbelow and 0.92 m. Between target altitudes 0.92 m and 1.02 m there is a significant reduction in samplingsuccess, indicating that in the proximity of 0.92 m we may find the sweet spot that lowers risk but can stillresult in a large number of success samples. Surprisingly, at the highest target altitude 1.12 m, the successrate increases with some winds than with nearly no wind. It appears that as the windspeed increases, theincreased variation in altitude allowed the pump to be in the water long enough for the system to pumpmore water than at low windspeeds, when the pump was just barely submerged. Clearly, pumping longer

Table 7: Minimum Altitude (avg) by Wind Speed and Target Altitude
AVERAGE MAX CONDUCTIVITY READING (0− 5, 5 is deepest)TARGET ALTITUDE (m) WIND SPEED (m/s) AVERAGE
0− 2.7 2.7− 3.5 3.5− 4.5 4.5− 5.3 5.3+
0.72 3.83 4.12 4.50 4.60 4.75 4.360.82 3.50 3.60 3.88 4.29 4.00 3.850.92 3.00 3.00 3.73 3.67 4.00 3.581.02 3.50 2.56 2.50 3.50 2.88 2.851.12 4.00 2.80 2.10 2.38 2.80 2.53
AVERAGE 3.57 3.21 3.26 3.60 3.73
will improve the success rate, and the main consequence of overfilling is wasted time and energy. Theseexperiments help us find a baseline performance expectation from which we can seek a balance betweentime, energy, and success rate.
Although setting a lower target altitude increases the success rate, there is a lower limit. Table 6 shows theminimum altitude over water during the sampling mission, averaged by bin. As windspeed increases, wetend to get closer to the water at some point during sampling. At 0.72 m target altitude in the strongestwinds we get within 0.35 cm of the water on average. This is probably too close even if the vehicle didnot get wet, since we might get too close for the human backup pilot to recover the vehicle in case of anemergency.
Another way to measure how the proximity to the water changes with windspeed is to look at the waterconductivity sensors. Table 7 shows the maximal water conductivity sensor to touch the water duringsampling, where a ’1’ means the first conductivity sensor located at the pump, ’2’ means the conductivitysensor 10 cm up the sampling tube from the pump, and ‘5’ is the maximum depth. 3 In general, the vehiclegets closer to the water as windspeed increases.
We also investigated the potential impact of battery level on vehicle altitude. The normal battery levelsrange from 12.5 V to 10.5 V, below which the Firefly alerts the user with an audible siren. During theseexperiment we always changed battery before the siren engaged, using each battery in four or five trials.Within this normal range of battery operation we did not detect a significant correlation between the batterylevel and the minimal altitude or conductivity.
4.4 Sampling Technique: Hand vs. UAV-Mechanism
Figure 12: Holmes Lake sample locations
We conducted an experiment to check whether water samplescollected by the UAV-mechanism exhibit similar water chem-ical properties as samples obtained through traditional handsampling methods. Potential differences include those causedby pumping, transit through the tube, agitation during flight,and changes in water properties during the delay betweensample acquisition and sample measurement on land. TheUAV was not flown, but rather held by a human operator ina kayak to ensure that both the hand and UAV samples weretaken at the same time and place.
In order to verify the consistency between manual and UAV-based sampling, we sampled at five locations3Note that at the lowest windspeed, the conductivity sensors failed to read correctly due to a wiring problem during a series of
samples which resulted in higher in normal values.

(a) Dissolved Oxygen (b) Sulfate
(c) Chloride (d) Temperature
Figure 13: Water Chemistry measurements from Hand Sampling and UAV-mechanism. Points representthe average of three replicate measurements, and error bars indicate ±1 standard error of the mean.
on Holmes Lake, Lincoln, NE, USA. We collected two samples near shore and three closer to the middleof the lake, as shown in Fig. 12. At each location, we took three samples by hand and three with theUAV-mechanism for a total of fifteen samples by each method. Overall it took approximately 2 hours tocollect this data due to the time to kayak, collect manual and UAV-mechanism samples, and to performsome on-site analysis and filtering. We estimate that collecting the samples with the UAV flying wouldtake 20 minutes.
At each location we measured temperature, dissolved oxygen (DO)4, sulfate, and chloride. By samplingboth a dissolved gas and representative ions we can assess the suitability of the UAV-mechanism forscientific water sampling. Temperature and DO are measured at the sample location for the manualmeasurements and at shore once the UAV returns, since these properties change rapidly. Chloride andsulfate ions are measured in the lab using equipment5 that is not easily portable and these properties donot change rapidly after sampling and filtering. We measured DO as it is a key indicator of biologicalactivity and because we suspected the UAV-mechanism might bias the measurement through degassingduring pumping or continued photosynthesis during transit. Sulfate and chloride ions occur naturally inmost water and their ratio in freshwater can indicate proximity to a saltwater source. But inland, chloridecomes from many sources including lawn fertilizers and road salt. High concentrations of chloride inorganisms can induce osmotic stress, reduced fitness, or mortality.
We are primarily interested in verifying that the UAV-mechanism does not induce a bias in the measure-ments. Fig. 13a shows the DO as measured by hand at the location and with the UAV-mechanism. Thevalues at the five sample locations are close and show the same general trend in all five locations, implying
4For DO and temperature a single reading was obtained with the hand sensor at the location, but for the UAV-mechanism it wastested on each of the three samples.
5Lab measurements use a Dionex Ion Chromatograph AS14A, made by ThermoFisher.

that the UAV-mechanism and delay (longer by kayak than by flying) has little impact on the DO. Alsovisible in this figure is the general upward trend between the sample locations. This was probably causedby increased photosynthesis over the two hours of data collection, although sample location may also playa role in this variation. For instance, location 4 is probably higher than the general trend because it is closerto an enclosed bay and therefore likely to have more plants near the surface. Obtaining samples quickly byUAV could help to disambiguate these factors.
Sulfate and chloride concentrations shown in Fig. 13b-13c revealed some differences between hand methodsand the UAV-mechanism. These differences, however, can likely be attributed to typical sampling variationand neither indicates a strong bias induced by the UAV-mechanism. Further, the typical range for sulfatein lakes is between 10− 60 mg/L (Orem, 2004) and for chloride varies seasonally but usually is between10− 100 mg/L (Dodds, 2002), so the observed variation is minimal. We plan to perform additional fieldand lab tests to verify that these measurements are unbiased.
In contrast to the other measurements, Fig. 13d, shows that the temperature measured by hand at thesample location is nearly constant, while the temperature measured in samples from the UAV-mechanismchanged during transit, especially at locations two and three. Future versions of system should measurewater temperature at the sample location by mounting a temperature probe at the end of the pumping tube.
These experiments show the UAV-mechanism can collect samples that resemble to those collected be hand.The UAV system, however, greatly reduces the effort and time to collect samples. This permits waterscientists to obtain more samples within a single lake or river to develop a high-resolution map, for instance,after a rainstorm to identify the source of the influx of chemical or biological contaminates. In addition,reducing the collection time is critical since many water properties, such as DO, fluctuate within hours andusing our UAV system would reduce collection time by nearly an order of magnitude.
5 Lessons Learned
In this work we have successfully developed an aerial water sampler that can obtain water samples fromlocations even in moderate winds. During development we experienced numerous instructive failures. Inthis section, we discuss these lessons and what we learned from them.
Our first prototype explored vials suspended from a cord, but early flight tests showed that adding 60 gwater plus the mass of the vials induced unpredictable and hazardous flight dynamics because of pendulumeffects. We considered a mechanism to ‘reel-in’ samples but found it too complicated to have retractablesensor and communication cabling, or waterproof short-range wireless communication. We looked atdrawing water up through the tube using suction, but found that only massive pumps (for a UAV) coulddraw water up one meter. These options might be worth exploring with heavier-lift UAVs.
We also explored water hardening the UAV, sample chambers, and sampling mechanism, but our previouswork in underwater sensor nodes convinced us that making any part waterproof adds unacceptable massand undermines the speed and ease of swapping vials and batteries. In spite of not being waterproof, wehave had only one completely debilitating interaction with water as well as some near misses where thelanding gear and sampling mechanism touched the water but not the electronics. Fortunately, even afterbeing fully submerged in fresh water the AscTec Firefly survived after careful drying.
It surprised us somewhat that the lowest sampling target altitude 0.72 m was the most effective, becausewe had previously seen that the variability in the altitude during wind gusts would bring the systemclose enough to water to experience “ground effect”, causing rebound and oscillations in altitude thatwould degrade performance. However, we observed that in stronger winds, the UAV’s downdraft is blowndownwind, as we could see by the water ripples displaced almost the width of the UAV, and thereforeground effect seemed negligible.

The risk management mechanisms react faster than our human backup pilots, and err on the side of caution.We found this worked well in most field trials although at times it could have easily continued pumpingsafely. This is actually similar to how novice human safety pilots act. In our experience, pilots frequentlytake over too soon until they grow more comfortable with the system limits. Likewise, over time we tunedthe risk management system to accept a wider range of behavior in the field.
6 Conclusions and Future Work
Water sampling has become a key activity in effectively managing our fresh water resources and maintainingpublic health. Developing approaches and systems for efficient and effective water monitoring will increasein importance over the coming decades. In this paper, we have demonstrated a novel mechanism forsampling water autonomously from a UAV that requires significantly less effort than existing techniquesand is nearly an order of magnitude faster. The system can safely fly close to water and collect three 20 mlsamples per flight. We verified that the water properties of the samples collected by the UAV match thosecollected through traditional manual sampling techniques. This shows that this system can be used bywater scientists to improve the spatial scale and temporal resolution of water sampling. We introduced ourrisk management framework used to assess and respond to hazardous circumstances. Lastly, we conducted75 outdoor trials of three samples over a range of wind speeds up to 5.8 m/s.
Our future efforts include further operation and evolution of the system outdoors, especially how thisplatform might be used with adaptive sampling, sampling at greater depths, and in combination withother sensing and sampling mechanisms deployed in bodies of water. We plan to characterize our riskmanagement framework as part of a longer term analysis of failure modes and system reliability. Weare pursuing methods for measuring the quantity of water in the vials. We intend to explore how thesystem performs on a more diverse set of bodies of water including those with continuous flows and waves.We are working on implementing an onboard wind vector estimate following the methods from recentwork (Neumann et al., 2012) which utilizes onboard sensors. This will enable the system to estimate thewind and adjust the target altitude accordingly. We are also in the process of implementing and evaluatingthe usability of a user interface for the limnologists and non-expert operators that balances manual controlwith autonomous behavior with the goal of maintaining system and operator safety. We plan to examinethe duration of the ‘flushing’ phase with our collaborators to ensure clean samples. Further, we wouldlike to push some water analysis onto the platform to avoid collecting samples that do not meet requiredcriteria. In addition, we will explore a line of inquiry pertaining to operational safety, as these systems areintended to be reliable tools in the hands of field scientists.
Acknowledgments
We would like to thank our limnologist and environmental engineering partners, at U.C. Berkeley, Dr.Michael Hamilton and Dr. Sally Thompson for their continuous support of these efforts. Deep thanks tomechanical engineer Baoliang Zhao for his clever chassis design. This work was also greatly assisted byHengle Jiang, Dave Anthony, Adam Taylor, Jacob Greenwood, Christa Webber, Emily Waring, Seth McNeil,Jared Ostdiek, Najeeb W. Najeeb, Daniel Rogge and the NIMBUS Lab.
This work was partially supported by USDA #2013-67021-20947, AFOSR #FA9550-10-1-0406, NSF IIS-1116221, NSF CSR-1217400, NDEQ grant #56-1131 and a development grant from ORED-UNL. Anyopinions, findings, and conclusions or recommendations expressed in this material are those of the authorsand do not necessarily reflect the views of these agencies.

References
Achtelik, M. C., Doth, K.-M., Gurdan, D., and Stumpf, J. (2012). Design of a multi rotor MAV with regard toefficiency, dynamics and redundancy. In AIAA Guidance, Navigation, and Control Conference, pages 1–17.
Aquacopters (2012). Aquacopters. http://www.aquacopters.com/. [Online; accessed 15-June-2014].
Bachrach, A., He, R., and Roy, N. (2009). Autonomous flight in unknown indoor environments. InternationalJournal of Micro Air Vehicles, 1(4):217–228.
Bills, C., Chen, J., and Saxena, A. (2011). Autonomous mav flight in indoor environments using singleimage perspective cues. In Robotics and automation (ICRA), 2011 IEEE international conference on, pages5776–5783. IEEE.
Bird, L. E., Sherman, A., and Ryany, J. (2007). Development of an active, large volume, discrete seawatersampler for autonomous underwater vehicles. In OCEANS 2007, pages 1–5. IEEE.
Clothier, R. A. and Walker, R. A. (2012). The safety risk management of unmanned aircraft systems.Handbook of Unmanned Aerial Vehicles.
Cruz, N. A. and Matos, A. C. (2008). The MARES AUV, a modular autonomous robot for environmentsampling. In OCEANS 2008, pages 1–6. IEEE.
Dezfuli, H., Benjamin, A., Everett, C., Maggio, G., Stamatelatos, M., Youngblood, R., Guarro, S., et al. (2011).Nasa risk management handbook. Technical report, NASA.
Dodds, W. K. (2002). Freshwater ecology: concepts and environmental applications. Academic Press: San Diego,California.
Dodds, W. K., Bouska, W. W., Eitzmann, J. L., Pilger, T. J., Pitts, K. L., Riley, A. J., Schloesser, J. T., andThornbrugh, D. J. (2009). Eutrophication of U.S. freshwaters: Analysis of potential economic damages.Environmental Science & Technology, 43(1):12–19.
Dorofee, A. J., Walker, J. A., Alberts, C. J., Higuera, R. P., and Murphy, R. L. (1996). Continuous riskmanagement guidebook. Technical report, DTIC Document.
Dunbabin, M. and Grinham, A. (2010). Experimental evaluation of an autonomous surface vehicle forwater quality and greenhouse gas emission monitoring. In Robotics and Automation (ICRA), 2010 IEEEInternational Conference on, pages 5268–5274. IEEE.
Dunbabin, M., Grinham, A., and Udy, J. (2009). An autonomous surface vehicle for water quality monitoring.In Proc. Australasian Conference on Robotics and Automation (ACRA), volume 13.
Eaton, A. D. and Franson, M. A. H. (2005). Standard methods for the examination of water & wastewater.American Public Health Association.
Erickson, A. J., Weiss, P. T., and Gulliver, J. S. (2013). Water sampling methods. In Optimizing StormwaterTreatment Practices, pages 163–192. Springer New York.
Faust, A., Palunko, I., Cruz, P., Fierro, R., and Tapia, L. (2013). Learning swing-free trajectories for uavswith a suspended load. In Robotics and Automation (ICRA), 2013 IEEE International Conference on, pages4902–4909. IEEE.
Goktogan, A. H., Sukkarieh, S., Bryson, M., Randle, J., Lupton, T., and Hung, C. (2010). A rotary-wingunmanned air vehicle for aquatic weed surveillance and management. Journal of Intelligent and RoboticSystems, 57:467–484.
Harel, D. (1987). Statecharts: A visual formalism for complex systems. Science of computer programming,8(3):231–274.

ITOPF, I. (2012). Sampling and Monitoring of Marine Oil Spills.http://www.itopf.com/information-services/publications/documents/
TIP14SamplingandMonitoringofMarineOilSpills.pdf. [Online; accessed 1-July-2014].
Jain, S., Nuske, S., Chambers, A., Yoder, L., Cover, H., Chamberlain, L., Scherer, S., and Singh, S. (2013).Autonomous river exploration. In Proc. of The 9th Intl. Conf. on Field and Service Robots (FSR). Brisbane,Australia, volume 5.
Jiang, H., Elbaum, S., and Detweiler, C. (2013). Reducing failure rates of robotic systems though inferredinvariants monitoring. In Intelligent Robots and Systems (IROS), 2013 IEEE/RSJ International Conferenceon, pages 1899–1906. IEEE.
Jimenez-Cano, A., Martin, J., Heredia, G., Ollero, A., and Cano, R. (2013). Control of an aerial robot withmulti-link arm for assembly tasks. In Robotics and Automation (ICRA), 2013 IEEE International Conferenceon, pages 4916–4921. IEEE.
Kendoul, F. (2012). Survey of advances in guidance, navigation, and control of unmanned rotorcraft systems.Journal of Field Robotics, 29(2):315–378.
Kulic, D. and Croft, E. A. (2005). Safe planning for human-robot interaction. Journal of Robotic Systems,22(7):383–396.
Lacevic, B. and Rocco, P. (2010). Kinetostatic danger field-a novel safety assessment for human-robotinteraction. In Intelligent Robots and Systems (IROS), 2010 IEEE/RSJ International Conference on, pages2169–2174. IEEE.
Maxbotix (2014). MaxBotix Ultrasonic Sensors. http://www.maxbotix.com. [Online; accessed 15-June-2014].
Melo, J. and Matos, A. (2012). Bottom estimation and following with the MARES AUV. In Oceans, 2012,pages 1–8. IEEE.
Merz, T. and Kendoul, F. (2013). Dependable low-altitude obstacle avoidance for robotic helicoptersoperating in rural areas. Journal of Field Robotics, 30(3):439–471.
Merz, T., Rudol, P., and Wzorek, M. (2006). Control system framework for autonomous robots basedon extended state machines. In Autonomic and Autonomous Systems, 2006. ICAS’06. 2006 InternationalConference on, pages 14–14. IEEE.
Michael, N., Fink, J., and Kumar, V. (2011). Cooperative manipulation and transportation with aerial robots.Autonomous Robots, 30(1):73–86.
Montemerlo, M., Pineau, J., Roy, N., Thrun, S., and Verma, V. (2002). Experiences with a mobile roboticguide for the elderly. In AAAI/IAAI, pages 587–592.
Neumann, P. P., Asadi, S., Lilienthal, A. J., Bartholmai, M., and Schiller, J. H. (2012). Autonomous gas-sensitive microdrone: wind vector estimation and gas distribution mapping. Robotics & AutomationMagazine, IEEE, 19(1):50–61.
Ore, J. P., Elbaum, S., Burgin, A., Zhao, B., and Detweiler, C. (2013). Autonomous aerial water sampling. InProc. of The 9th Intl. Conf. on Field and Service Robots (FSR). Brisbane, Australia, volume 5, page TBA.
Orem, W. H. (2004). Impacts of sulfate contamination on the Florida Everglades ecosystem. Fact Sheet FS 109-03.Reston, Virginia, U.S. Geological Survey.
Orsag, M., Korpela, C., Bogdan, S., and Oh, P. (2014). Valve turning using a dual-arm aerial manipulator.In Unmanned Aircraft Systems (ICUAS), 2014 International Conference on, pages 836–841. IEEE.
Pilliod, D. S., Goldberg, C. S., Laramie, M. B., and Waits, L. P. (2012). Application of Environmental DNA forInventory and Monitoring of Aquatic Species. Fact Sheet FS 2012-3146 Corvallis, Oregon, U.S. GeologicalSurvey.

QuadH2O (2014). Water Resistant Multirotor. http://www.quadh2o.com/. [Online; accessed 30-June-2014].
Rahimi, M., Pon, R., Kaiser, W., Sukhatme, G., Estrin, D., and Srivastava, M. (2004). Adaptive sampling forenvironmental robotics. In Proc. IEEE Int. Conf. on Robotics and Automation, volume 4, pages 3537–3544.
Ritz, R. and D’Andrea, R. (2013). Carrying a flexible payload with multiple flying vehicles. In IntelligentRobots and Systems (IROS), 2013 IEEE/RSJ International Conference on, pages 3465–3471. IEEE.
Ross, S., Melik-Barkhudarov, N., Shankar, K. S., Wendel, A., Dey, D., Bagnell, J. A., and Hebert, M. (2013).Learning monocular reactive uav control in cluttered natural environments. In Robotics and Automation(ICRA), 2013 IEEE International Conference on, pages 1765–1772. IEEE.
Sattar, J. and Dudek, G. (2014). Reducing uncertainty in human-robot interaction: A cost analysis approach.In Experimental Robotics, pages 81–95. Springer.
Scherer, S., Rehder, J., Achar, S., Cover, H., Chambers, A., Nuske, S., and Singh, S. (2012). River mappingfrom a flying robot: state estimation, river detection, and obstacle mapping. Autonomous Robots,33(1-2):189–214.
Scherer, S., Singh, S., Chamberlain, L., and Saripalli, S. (2007). Flying fast and low among obstacles. InRobotics and Automation, 2007 IEEE International Conference on, pages 2023–2029. IEEE.
Schmid, K., Lutz, P., Tomic, T., Mair, E., and Hirschmuller, H. (2014). Autonomous vision-based micro airvehicle for indoor and outdoor navigation. Journal of Field Robotics.
Schwarzbach, M., Laiacker, M., Mulero-Pazmany, M., and Kondak, K. (2014). Remote water sampling usingflying robots. In unmanned aircraft systems (ICUAS), 2014 International Conference on. IEEE.
Shen, S., Michael, N., and Kumar, V. (2011). Autonomous multi-floor indoor navigation with a computa-tionally constrained mav. In Robotics and automation (ICRA), 2011 IEEE international conference on, pages20–25. IEEE.
Sreenath, K., Michael, N., and Kumar, V. (2013). Trajectory generation and control of a quadrotor witha cable-suspended load a differentially-flat hybrid system. In Proc. IEEE Int. Conf. on Robotics andAutomation, pages 4888–4895.
TCSMicropumps (2014). TCS Micropumps, UK. Model M200S-SUB. http://micropumps.co.uk/
{TCSM}200range.htm. [Online; accessed 15-June-2014].
The United Nations Children’s Fund (UNICEF)/World Health Organization (WHO), Johansson, E. andWardlaw, T. (2009). Diarrhoea: Why children are still dying and what can be done. In WHO LibraryCataloging-in-Publication Data.
Thomas, J., Polin, J., Sreenath, K., and Kumar, V. (2013). Avian-inspired grasping for quadrotor micro uavs.In ASME 2013 International Design Engineering Technical Conferences and Computers and Information inEngineering Conference, pages V06AT07A014–V06AT07A014. American Society of Mechanical Engineers.
WHO, W. H. O. (2004). Guidelines for drinking-water quality: recommendations, volume 1. World HealthOrganization.
Wilde, F. D., Radtke, D. B., and (US), G. S. (1998). National Field Manual for the Collection of Water-qualityData: Field Measurements. US Department of the Interior, US Geological Survey.
Wurm, K. M., Hornung, A., Bennewitz, M., Stachniss, C., and Burgard, W. (2010). Octomap: A probabilistic,flexible, and compact 3d map representation for robotic systems. In Proc. of the ICRA 2010 workshop onbest practice in 3D perception and modeling for mobile manipulation, volume 2.
Zhang, B. and Sukhatme, G. (2007). Adaptive sampling for estimating a scalar field using a robotic boat anda sensor network. In Robotics and Automation, 2007 IEEE International Conference on, pages 3673–3680.IEEE.