autumn quarter 2013 statistical report - … · autumn quarter 2013 statistical report ......
TRANSCRIPT

AUTUMN QUARTER 2013
STATISTICAL REPORT
________________________________________________________________________________
1427 E. 60th Street Chicago, Illinois 60637
http://registrar.uchicago.edu/statistics
________________________________________________________________________________

THE UNIVERSITY OF CHICAGO
Quarterly Enrollment Statistical Report
For the Autumn Quarter 2013 ENROLLMENT FACTS AT A GLANCE
NUMBER
1. Enrollment (See Table I)
College Degree Students 5,692 On Campus 5,449
In Study Abroad Programs 243
Graduate Degree Students 8,905
Total Degree Students 14,597
Non-Degree Students 597
Total University Enrollment 15,194
2. New University Matriculants (See Table III)
Total College Entering Class of 2012 1,426 College First-Year Students-New to University 1,375
College First-Year Students-Prior Non-Degree 51
College Transfers 18
Graduate Degree Students 2,353
Non-Degree Students 298
Total New Students to the University 4,044
3. Degrees Awarded (See Table V)
Bachelor of Arts 45
Bachelor of Science 5
Master of Arts 68
Master of Business Administration 135
Master of Liberal Arts 1
Master of Public Policy 2
Master of Science 64
Doctor of Philosophy 75
Total Degrees Awarded 395
College Undergraduates
Masters or Professional
DoctoralTOTAL AUT 13
TOTAL AUT 12
% CHANGE
Students at-Large
Lab School
Visitors or Exchange
Other Non-
DegreeTOTAL
TOTAL AUT 13
TOTAL AUT 12
% CHANGE
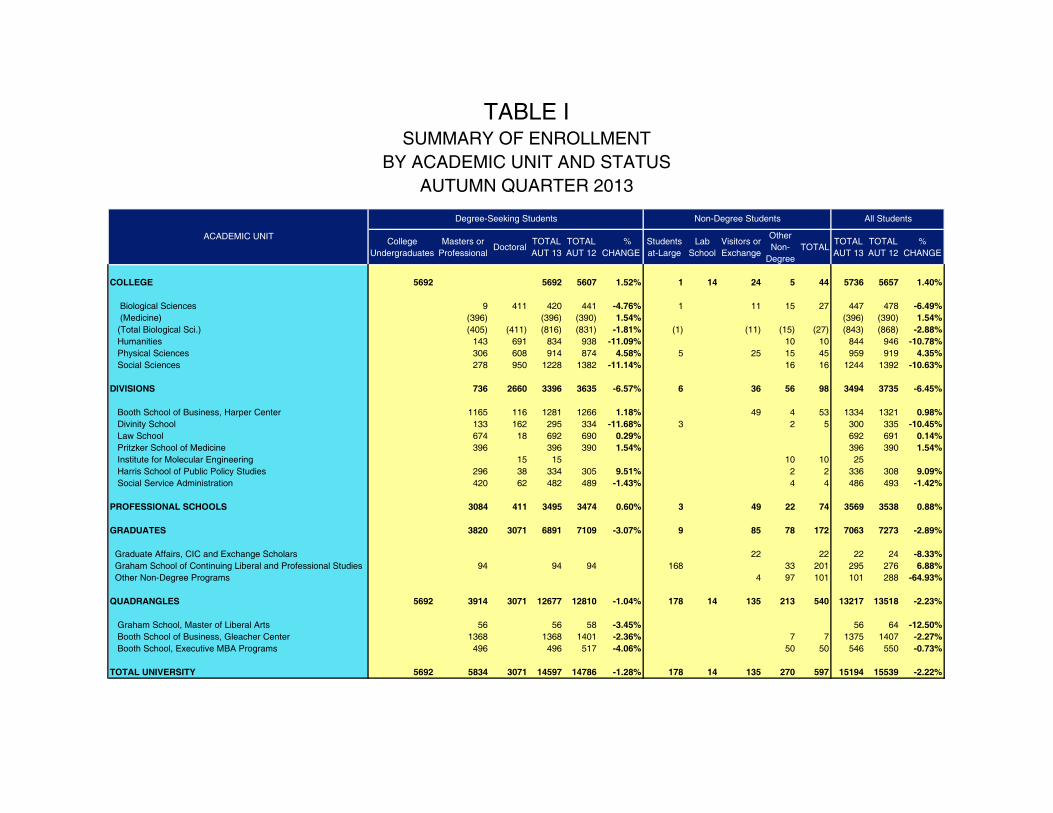
COLLEGE 5692 5692 5607 1.52% 1 14 24 5 44 5736 5657 1.40%
Biological Sciences 9 411 420 441 -4.76% 1 11 15 27 447 478 -6.49% (Medicine) (396) (396) (390) 1.54% (396) (390) 1.54% (Total Biological Sci.) (405) (411) (816) (831) -1.81% (1) (11) (15) (27) (843) (868) -2.88% Humanities 143 691 834 938 -11.09% 10 10 844 946 -10.78% Physical Sciences 306 608 914 874 4.58% 5 25 15 45 959 919 4.35% Social Sciences 278 950 1228 1382 -11.14% 16 16 1244 1392 -10.63%
DIVISIONS 736 2660 3396 3635 -6.57% 6 36 56 98 3494 3735 -6.45%
Booth School of Business, Harper Center 1165 116 1281 1266 1.18% 49 4 53 1334 1321 0.98% Divinity School 133 162 295 334 -11.68% 3 2 5 300 335 -10.45% Law School 674 18 692 690 0.29% 692 691 0.14% Pritzker School of Medicine 396 396 390 1.54% 396 390 1.54% Institute for Molecular Engineering 15 15 10 10 25 Harris School of Public Policy Studies 296 38 334 305 9.51% 2 2 336 308 9.09% Social Service Administration 420 62 482 489 -1.43% 4 4 486 493 -1.42%
PROFESSIONAL SCHOOLS 3084 411 3495 3474 0.60% 3 49 22 74 3569 3538 0.88%
GRADUATES 3820 3071 6891 7109 -3.07% 9 85 78 172 7063 7273 -2.89%
Graduate Affairs, CIC and Exchange Scholars 22 22 22 24 -8.33% Graham School of Continuing Liberal and Professional Studies 94 94 94 168 33 201 295 276 6.88% Other Non-Degree Programs 4 97 101 101 288 -64.93%
QUADRANGLES 5692 3914 3071 12677 12810 -1.04% 178 14 135 213 540 13217 13518 -2.23%
Graham School, Master of Liberal Arts 56 56 58 -3.45% 56 64 -12.50% Booth School of Business, Gleacher Center 1368 1368 1401 -2.36% 7 7 1375 1407 -2.27% Booth School, Executive MBA Programs 496 496 517 -4.06% 50 50 546 550 -0.73%
TOTAL UNIVERSITY 5692 5834 3071 14597 14786 -1.28% 178 14 135 270 597 15194 15539 -2.22%
All Students
TABLE ISUMMARY OF ENROLLMENT
AUTUMN QUARTER 2013BY ACADEMIC UNIT AND STATUS
Non-Degree StudentsDegree-Seeking Students
ACADEMIC UNIT
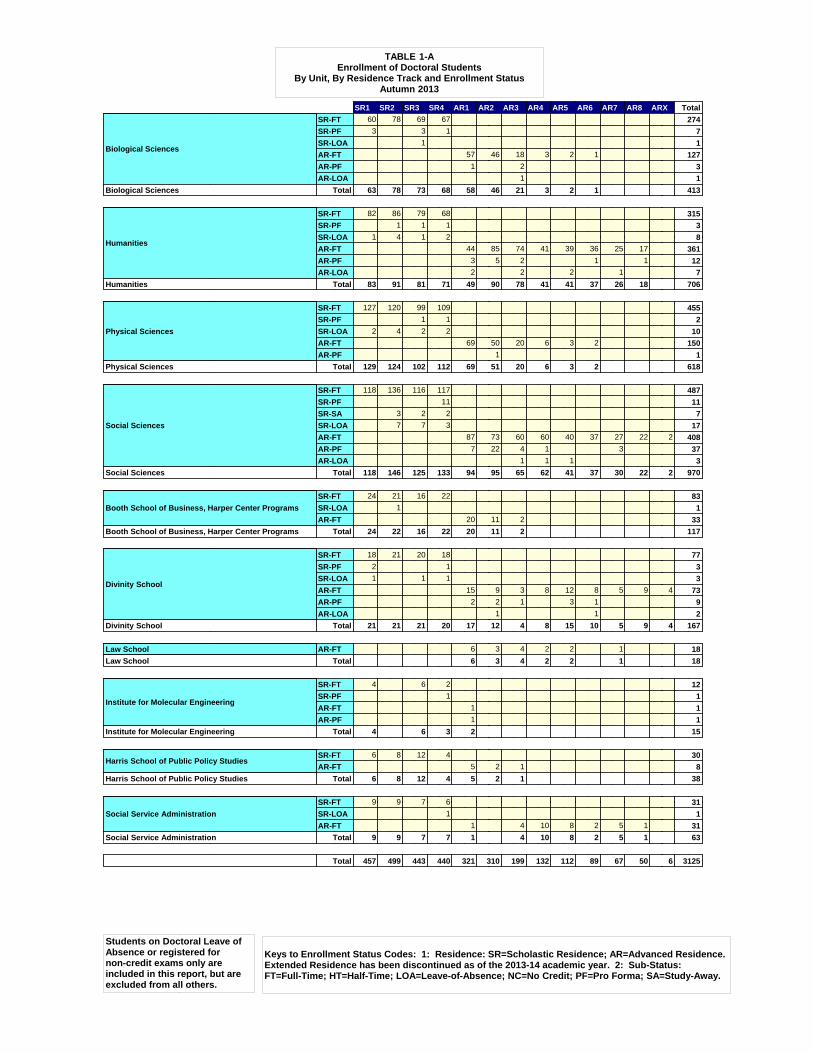
TABLE 1-AEnrollment of Doctoral Students
By Unit, By Residence Track and Enrollment StatusAutumn 2013
SR1 SR2 SR3 SR4 AR1 AR2 AR3 AR4 AR5 AR6 AR7 AR8 ARX Total
Biological Sciences
SR-FT 60 78 69 67 274
SR-PF 3 3 1 7
SR-LOA 1 1
AR-FT 57 46 18 3 2 1 127
AR-PF 1 2 3
AR-LOA 1 1
Biological Sciences Total 63 78 73 68 58 46 21 3 2 1 413
Humanities
SR-FT 82 86 79 68 315
SR-PF 1 1 1 3
SR-LOA 1 4 1 2 8
AR-FT 44 85 74 41 39 36 25 17 361
AR-PF 3 5 2 1 1 12
AR-LOA 2 2 2 1 7
Humanities Total 83 91 81 71 49 90 78 41 41 37 26 18 706
Physical Sciences
SR-FT 127 120 99 109 455
SR-PF 1 1 2
SR-LOA 2 4 2 2 10
AR-FT 69 50 20 6 3 2 150
AR-PF 1 1
Physical Sciences Total 129 124 102 112 69 51 20 6 3 2 618
Social Sciences
SR-FT 118 136 116 117 487
SR-PF 11 11
SR-SA 3 2 2 7
SR-LOA 7 7 3 17
AR-FT 87 73 60 60 40 37 27 22 2 408
AR-PF 7 22 4 1 3 37
AR-LOA 1 1 1 3
Social Sciences Total 118 146 125 133 94 95 65 62 41 37 30 22 2 970
Booth School of Business, Harper Center Programs
SR-FT 24 21 16 22 83
SR-LOA 1 1
AR-FT 20 11 2 33
Booth School of Business, Harper Center Programs Total 24 22 16 22 20 11 2 117
Divinity School
SR-FT 18 21 20 18 77
SR-PF 2 1 3
SR-LOA 1 1 1 3
AR-FT 15 9 3 8 12 8 5 9 4 73
AR-PF 2 2 1 3 1 9
AR-LOA 1 1 2
Divinity School Total 21 21 21 20 17 12 4 8 15 10 5 9 4 167
Law School AR-FT 6 3 4 2 2 1 18
Law School Total 6 3 4 2 2 1 18
Institute for Molecular Engineering
SR-FT 4 6 2 12
SR-PF 1 1
AR-FT 1 1
AR-PF 1 1
Institute for Molecular Engineering Total 4 6 3 2 15
Harris School of Public Policy StudiesSR-FT 6 8 12 4 30
AR-FT 5 2 1 8
Harris School of Public Policy Studies Total 6 8 12 4 5 2 1 38
Social Service Administration
SR-FT 9 9 7 6 31
SR-LOA 1 1
AR-FT 1 4 10 8 2 5 1 31
Social Service Administration Total 9 9 7 7 1 4 10 8 2 5 1 63
Total 457 499 443 440 321 310 199 132 112 89 67 50 6 3125
Students on Doctoral Leave ofAbsence or registered fornon-credit exams only areincluded in this report, but areexcluded from all others.
Keys to Enrollment Status Codes: 1: Residence: SR=Scholastic Residence; AR=Advanced Residence.Extended Residence has been discontinued as of the 2013-14 academic year. 2: Sub-Status:FT=Full-Time; HT=Half-Time; LOA=Leave-of-Absence; NC=No Credit; PF=Pro Forma; SA=Study-Away.

Table II-ADeclared Majors of College Students
Autumn 2013(Students may declare multiple majors)
Major First Second Third TotalAnthropology 53 8 0 61Applied Math 4 4 0 8Art History 28 8 0 36Biological Chemistry 43 12 1 56Biological Sciences 354 29 6 389Chemistry 85 50 11 146Cinema/Media Studies 18 4 0 22Classical Studies 21 2 0 23Common Year 2405 0 0 2405Comparative Human Development 53 11 0 64Comparative Race and Ethnic Studies 7 9 0 16Comp Lit 11 5 0 16Comp Sci 73 39 0 112E. Asian Lang/Civ 20 25 1 46Economics 652 99 5 756English Lang/Lit 154 39 1 194Environmental Science 6 2 0 8Environmental Studies 16 13 0 29Fundamentals: Issues/Texts 22 2 0 24Gender and Sexuality Studies 5 8 0 13Gender Studies 7 3 0 10Geographical Studies 21 8 0 29Geophysical Sciences 26 9 0 35Germanic Studies 2 2 0 4HIPSS 16 1 0 17History 125 19 0 144International Relations 0 2 0 2International Studies 72 16 0 88IS HUM 8 2 0 10Jewish Studies 0 2 0 2Joint M.S. in Chemistry 0 2 0 2Latin American Studies 3 6 0 9Law, Letters, Society 42 7 0 49Linguistics 43 5 0 48M.A. Program Humanities 0 3 0 3Mathematics 225 75 6 306Medieval Studies 3 2 0 5Music 11 11 0 22Near Eastern Lang/Civ 19 9 0 28Philosophy 79 48 0 127Philosophy/Allied Fields 1 1 0 2Physics 136 14 1 151Political Science 234 81 2 317Professional Option: Public Policy 2 0 0 2Psychology 128 40 0 168Public Policy Studies 150 48 0 198Religious Studies 11 3 0 14Romance Lang/Lit 19 28 1 48Russian Studies 2 2 0 4Slavic Lang/Lit 7 8 0 15Social Service Administration 0 5 0 5Sociology 55 8 0 63South Asian Lang/Civ 0 8 0 8South Asian Studies 1 2 0 3Statistics 23 43 6 72Theater & Performance Studies 16 12 0 28Tutorial Studies 1 0 0 1Undeclared 144 0 0 144Visual Arts 30 12 0 42
5692 916 41 6649

TOTAL
Biological Sciences
Biochemistry & Molecular Biology Ph.D. 28Biochemistry & Molecular Biology/Medicine M.D./Ph.D. 1Biology Ph.D. 5Cancer Biology Ph.D. 28Cancer Biology/Medicine M.D./Ph.D. 2Computational Neuroscience Ph.D. 22Computational Neuroscience/Medicine M.D./Ph.D. 2Developmental Biology Ph.D. 22Ecology & Evolution Ph.D. 28Evolutionary Biology Ph.D. 30Genetics Ph.D. 21Genetics/Medicine M.D./Ph.D. 2Health Studies M.S. 9Health Studies Ph.D. 11Human Genetics Ph.D. 20Human Genetics/Medicine M.D./Ph.D. 1IIT-BSD EXCHANGE Non-Degree 4Immunology Ph.D. 27Immunology/Medicine M.D./Ph.D. 2Jagiellonian University in Krakow Student Research Trainee Prog Non-Degree 1Medical Physics Ph.D. 20Microbiology Ph.D. 20Microbiology/Medicine M.D./Ph.D. 1Molecular Genetics & Cell Biology Ph.D. 29Molecular Metabolism & Nutrition Ph.D. 16Molecular Metabolism & Nutrition/Medicine M.D./Ph.D. 1Neurobiology Ph.D. 32Neurobiology/Medicine M.D./Ph.D. 1Non-Deg Visit BSD Non-Degree 15Organismal Biology & Anatomy Ph.D. 19Organismal Biology & Anatomy/Medicine M.D./Ph.D. 1Pathology Ph.D. 15Pathology/Medicine M.D./Ph.D. 4SAL BSD Non-Degree 1University of Gdansk Student Research Trainee Program Non-Degree 1University of Warsaw Student Research Trainee Program Non-Degree 4University of Wroclaw in Wroclaw Student Research Trainee Progr Non-Degree 1
Biological Sciences TOTAL 447
Humanities
Art History Ph.D. 57Cinema and Media Studies/East Asian Lang & Civ Ph.D. 3Cinema and Media Studies/Germanic Studies Ph.D. 1Cinema & Media Studies Ph.D. 33Classical Lang/Lit & Social Thought Ph.D. 1Classics Ph.D. 32Comparative Literature Ph.D. 26Conceptual & Historical Studies of Science Ph.D. 1East Asian Languages & Civilizations Ph.D. 39English Language & Literature Ph.D. 84Germanic Studies Ph.D. 22History of Culture Ph.D. 2Jewish Studies Ph.D. 4Linguistics Ph.D. 42Linguistics and Anthropology Ph.D. 1M.A. Program Humanities M.A. 101Middle Eastern Studies - HUM M.A. 27Music Ph.D. 76Near Eastern Languages & Civilizations Ph.D. 130New Testament & Early Christian Literature Ph.D. 5Non-Deg Visit HUM Non-Degree 10Philosophy Ph.D. 47Romance Languages & Literatures Ph.D. 47Slavic Lang/Lit & Cinema/Media Studies Ph.D. 1Slavic Languages & Literatures Ph.D. 12South Asian Lang/Civ & History Ph.D. 1South Asian Languages & Civilizations Ph.D. 24Visual Arts M.F.A. 15
Humanities TOTAL 844
TABLE II-BEnrollment in Graduate, Professional, and Special Programs
By Academic Unit, Program, and Degree StatusAutumn 2013
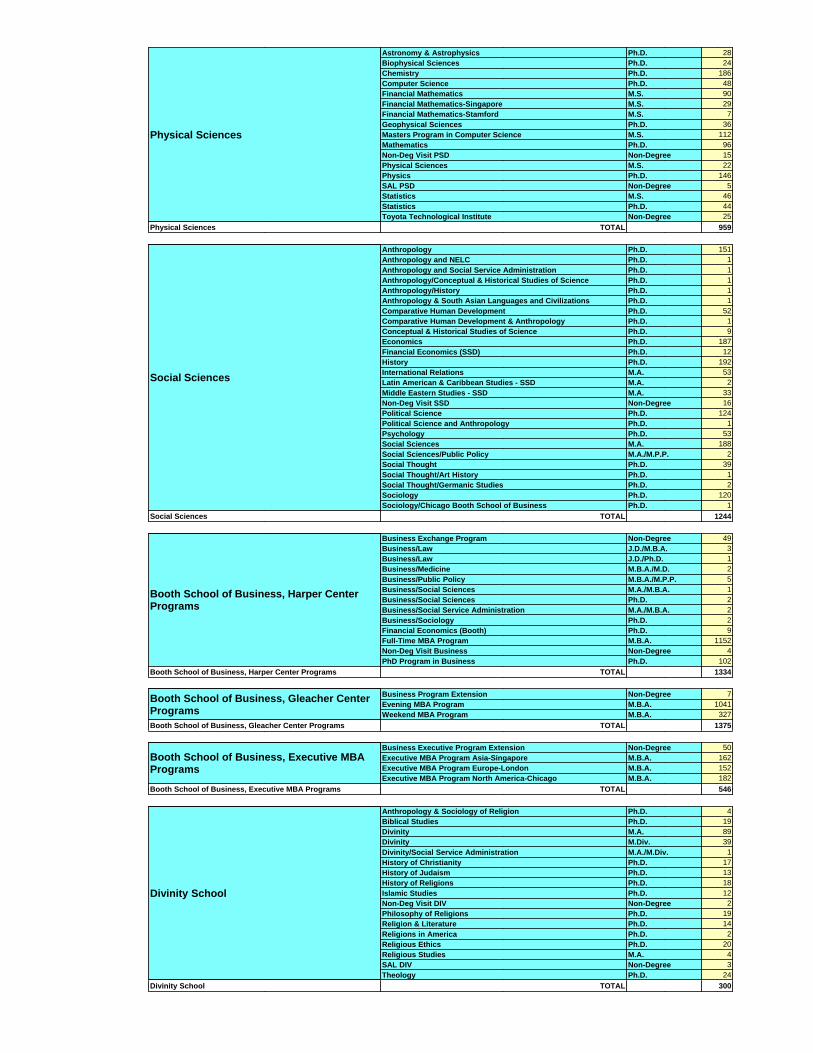
Physical Sciences
Astronomy & Astrophysics Ph.D. 28Biophysical Sciences Ph.D. 24Chemistry Ph.D. 186Computer Science Ph.D. 48Financial Mathematics M.S. 90Financial Mathematics-Singapore M.S. 29Financial Mathematics-Stamford M.S. 7Geophysical Sciences Ph.D. 36Masters Program in Computer Science M.S. 112Mathematics Ph.D. 96Non-Deg Visit PSD Non-Degree 15Physical Sciences M.S. 22Physics Ph.D. 146SAL PSD Non-Degree 5Statistics M.S. 46Statistics Ph.D. 44Toyota Technological Institute Non-Degree 25
Physical Sciences TOTAL 959
Social Sciences
Anthropology Ph.D. 151Anthropology and NELC Ph.D. 1Anthropology and Social Service Administration Ph.D. 1Anthropology/Conceptual & Historical Studies of Science Ph.D. 1Anthropology/History Ph.D. 1Anthropology & South Asian Languages and Civilizations Ph.D. 1Comparative Human Development Ph.D. 52Comparative Human Development & Anthropology Ph.D. 1Conceptual & Historical Studies of Science Ph.D. 9Economics Ph.D. 187Financial Economics (SSD) Ph.D. 12History Ph.D. 192International Relations M.A. 53Latin American & Caribbean Studies - SSD M.A. 2Middle Eastern Studies - SSD M.A. 33Non-Deg Visit SSD Non-Degree 16Political Science Ph.D. 124Political Science and Anthropology Ph.D. 1Psychology Ph.D. 53Social Sciences M.A. 188Social Sciences/Public Policy M.A./M.P.P. 2Social Thought Ph.D. 39Social Thought/Art History Ph.D. 1Social Thought/Germanic Studies Ph.D. 2Sociology Ph.D. 120Sociology/Chicago Booth School of Business Ph.D. 1
Social Sciences TOTAL 1244
Booth School of Business, Harper CenterPrograms
Business Exchange Program Non-Degree 49Business/Law J.D./M.B.A. 3Business/Law J.D./Ph.D. 1Business/Medicine M.B.A./M.D. 2Business/Public Policy M.B.A./M.P.P. 5Business/Social Sciences M.A./M.B.A. 1Business/Social Sciences Ph.D. 2Business/Social Service Administration M.A./M.B.A. 2Business/Sociology Ph.D. 2Financial Economics (Booth) Ph.D. 9Full-Time MBA Program M.B.A. 1152Non-Deg Visit Business Non-Degree 4PhD Program in Business Ph.D. 102
Booth School of Business, Harper Center Programs TOTAL 1334
Booth School of Business, Gleacher CenterPrograms
Business Program Extension Non-Degree 7Evening MBA Program M.B.A. 1041Weekend MBA Program M.B.A. 327
Booth School of Business, Gleacher Center Programs TOTAL 1375
Booth School of Business, Executive MBAPrograms
Business Executive Program Extension Non-Degree 50Executive MBA Program Asia-Singapore M.B.A. 162Executive MBA Program Europe-London M.B.A. 152Executive MBA Program North America-Chicago M.B.A. 182
Booth School of Business, Executive MBA Programs TOTAL 546
Divinity School
Anthropology & Sociology of Religion Ph.D. 4Biblical Studies Ph.D. 19Divinity M.A. 89Divinity M.Div. 39Divinity/Social Service Administration M.A./M.Div. 1History of Christianity Ph.D. 17History of Judaism Ph.D. 13History of Religions Ph.D. 18Islamic Studies Ph.D. 12Non-Deg Visit DIV Non-Degree 2Philosophy of Religions Ph.D. 19Religion & Literature Ph.D. 14Religions in America Ph.D. 2Religious Ethics Ph.D. 20Religious Studies M.A. 4SAL DIV Non-Degree 3Theology Ph.D. 24
Divinity School TOTAL 300

Law School
Law J.D. 597Law J.S.D. 18Law LL.M. 70Law/Business J.D./M.B.A. 4Law/Divinity J.D./M.Div. 1Law/Public Policy J.D./M.P.P. 2
Law School TOTAL 692
Pritzker School of Medicine
Interdisciplinary Scientist Training Program (ISTP/MSTP) M.D./Ph.D. 31Medicine M.D. 337Medicine/Biochemistry & Molecular Biology M.D./Ph.D. 1Medicine/Business M.B.A./M.D. 2Medicine/Cancer biology M.D./Ph.D. 2Medicine/Computational Neuroscience M.D./Ph.D. 4Medicine/Developmental Biology M.D./Ph.D. 1Medicine/Genetics M.D./Ph.D. 1Medicine/Health Studies M.D./M.S. 1Medicine/Health Studies M.D./Ph.D. 1Medicine/Immunology M.D./Ph.D. 3Medicine/Medial Physics M.D./Ph.D. 1Medicine/Microbiology M.D./Ph.D. 3Medicine/Neurobiology M.D./Ph.D. 2Medicine/Pathology M.D./Ph.D. 4Medicine/Public Policy Studies M.D./Ph.D. 2
Pritzker School of Medicine TOTAL 396
Institute for Molecular EngineeringMolecular Engineering Ph.D. 15Non-Degree Visitor Molecular Engineering Non-Degree 10
Institute for Molecular Engineering TOTAL 25
Harris School of Public Policy Studies
Environmental Science & Policy M.S. 5Non-Deg Visit PUBPOL Non-Degree 2Public Policy/Business M.B.A./M.P.P. 1Public Policy/Divinity M.Div./M.P.P. 1Public Policy/Law J.D./M.P.P. 1Public Policy/Social Service Administration M.A./M.P.P. 3Public Policy Studies M.A. 10Public Policy Studies M.P.P. 275Public Policy Studies Ph.D. 38
Harris School of Public Policy Studies TOTAL 336
Social Service Administration
Non-Deg Visit SSA Non-Degree 4Social Service Administration M.A. 341Social Service Administration Ph.D. 60Social Service Administration (Accelerated Program) M.A. 10Social Service Administration/Divinity M.A./M.Div. 6Social Service Administration (Evening) M.A. 59Social Service Administration/Health Studies (Second Masters) M.S./Ph.D. 2Social Service Administration/Public Policy M.A./M.P.P. 4
Social Service Administration TOTAL 486
Graduate Affairs
CIC BIOSCI Non-Degree 1CIC Booth Non-Degree 2CIC DIV Non-Degree 1CIC HUM Non-Degree 6CIC PUBPOL Non-Degree 2CIC SOCSCI Non-Degree 6Exchange Booth Non-Degree 1EXCH HUM Non-Degree 3
Graduate Affairs TOTAL 22
Special Programs
Chicago Theol Sem Non-Degree 1CPS Bridge Program (Academic Year) Non-Degree 15CPS-Math Teachers Program Non-Degree 4Elementary Teachers Seminar Non-Degree 78Lutheran School Theo Non-Degree 2McCormick Theol Sem Non-Degree 1
Special Programs TOTAL 101
Graham School of Continuing Liberal andProfessional Studies
GSAL Non-Degree 106GSAL in Business Courses Non-Degree 62GSAL Postgraduate Certificate in Quantitative Methods Non-Degree 11Liberal Arts M.L.A. 56Master of Science in Threat and Response Management M.S. 29Post-Graduate Certificate Program in Medical Physics Non-Degree 2Returning Scholar Non-Degree 20Urban Teaching Program M.A.T. 65
Graham School of Continuing Liberal and Professional Studies TOTAL 351
GRAND TOTAL 9458

TABLE IIINew Students to the University Autumn 2013
(This report counts the number of students registered for the first time in any program or statusat the University of Chicago. The entering College Undergraduate cohort for 2013 of 1426Freshmen and 18 Transfers includes 51 students previously enrolled at the University as
non-degree students in Summers or while in High School).
College
College International Exchange Non-Degree 23
College International Visiting Student Program Non-Degree 5
Lab School Non-Degree 8
SAL COL Non-Degree 1
Undergraduate Bachelor's 1393
Total 1430
Biological Sciences
Biochemistry & Molecular Biology Ph.D. 5
Biology Ph.D. 1
Cancer Biology Ph.D. 5
Computational Neuroscience Ph.D. 3
Developmental Biology Ph.D. 3
Ecology & Evolution Ph.D. 4
Evolutionary Biology Ph.D. 4
Genetics Ph.D. 1
Health Studies Ph.D. 3
Immunology Ph.D. 4
Medical Physics Ph.D. 3
Microbiology Ph.D. 1
Molecular Genetics & Cell Biology Ph.D. 5
Molecular Metabolism & Nutrition Ph.D. 2
Neurobiology Ph.D. 3
Non-Deg Visit BSD Non-Degree 6
Organismal Biology & Anatomy Ph.D. 2
Pathology Ph.D. 2
SAL BSD Non-Degree 1
Total 58
Humanities
Art History Ph.D. 2
Cinema & Media Studies Ph.D. 6
Classics Ph.D. 3
Comparative Literature Ph.D. 4
East Asian Languages & Civilizations Ph.D. 5
English Language & Literature Ph.D. 7
Germanic Studies Ph.D. 4
Linguistics Ph.D. 8
M.A. Program Humanities M.A. 86
Middle Eastern Studies - HUM M.A. 17
Music Ph.D. 3
Near Eastern Languages & Civilizations Ph.D. 10
Non-Deg Visit HUM Non-Degree 10
Philosophy Ph.D. 2
Romance Languages & Literatures Ph.D. 8
Slavic Languages & Literatures Ph.D. 1
South Asian Languages & Civilizations Ph.D. 4
Visual Arts M.F.A. 8
Total 188
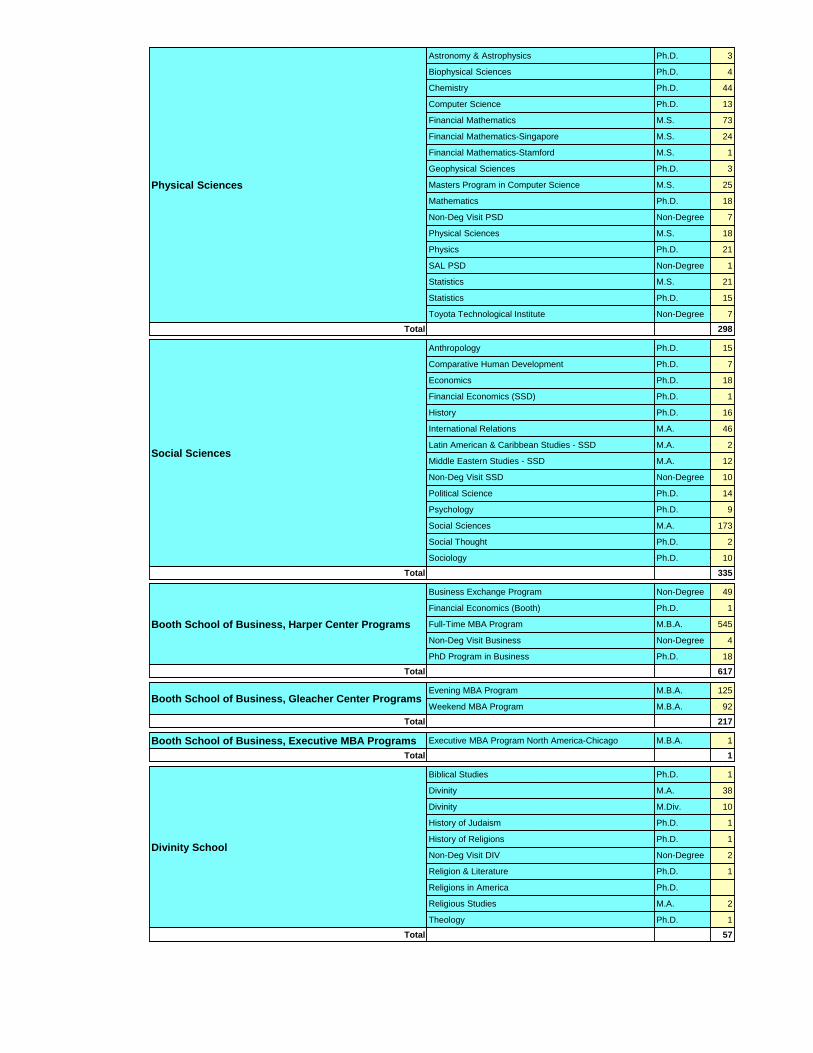
Physical Sciences
Astronomy & Astrophysics Ph.D. 3
Biophysical Sciences Ph.D. 4
Chemistry Ph.D. 44
Computer Science Ph.D. 13
Financial Mathematics M.S. 73
Financial Mathematics-Singapore M.S. 24
Financial Mathematics-Stamford M.S. 1
Geophysical Sciences Ph.D. 3
Masters Program in Computer Science M.S. 25
Mathematics Ph.D. 18
Non-Deg Visit PSD Non-Degree 7
Physical Sciences M.S. 18
Physics Ph.D. 21
SAL PSD Non-Degree 1
Statistics M.S. 21
Statistics Ph.D. 15
Toyota Technological Institute Non-Degree 7
Total 298
Social Sciences
Anthropology Ph.D. 15
Comparative Human Development Ph.D. 7
Economics Ph.D. 18
Financial Economics (SSD) Ph.D. 1
History Ph.D. 16
International Relations M.A. 46
Latin American & Caribbean Studies - SSD M.A. 2
Middle Eastern Studies - SSD M.A. 12
Non-Deg Visit SSD Non-Degree 10
Political Science Ph.D. 14
Psychology Ph.D. 9
Social Sciences M.A. 173
Social Thought Ph.D. 2
Sociology Ph.D. 10
Total 335
Booth School of Business, Harper Center Programs
Business Exchange Program Non-Degree 49
Financial Economics (Booth) Ph.D. 1
Full-Time MBA Program M.B.A. 545
Non-Deg Visit Business Non-Degree 4
PhD Program in Business Ph.D. 18
Total 617
Booth School of Business, Gleacher Center ProgramsEvening MBA Program M.B.A. 125
Weekend MBA Program M.B.A. 92
Total 217
Booth School of Business, Executive MBA Programs Executive MBA Program North America-Chicago M.B.A. 1
Total 1
Divinity School
Biblical Studies Ph.D. 1
Divinity M.A. 38
Divinity M.Div. 10
History of Judaism Ph.D. 1
History of Religions Ph.D. 1
Non-Deg Visit DIV Non-Degree 2
Religion & Literature Ph.D. 1
Religions in America Ph.D.
Religious Studies M.A. 2
Theology Ph.D. 1
Total 57

Law School
Law J.D. 196
Law J.S.D. 2
Law LL.M. 70
Total 268
Institute for Molecular EngineeringMolecular Engineering Ph.D. 5
Non-Degree Visitor Molecular Engineering Non-Degree 7
Total 12
Harris School of Public Policy Studies
Environmental Science & Policy M.S. 3
Non-Deg Visit PUBPOL Non-Degree 1
Public Policy Studies M.A. 7
Public Policy Studies M.P.P. 147
Public Policy Studies Ph.D. 3
Total 161
Social Service Administration
Non-Deg Visit SSA Non-Degree 4
Social Service Administration M.A. 171
Social Service Administration Ph.D. 6
Social Service Administration (Evening) M.A. 18
Social Service Administration/Public Policy M.A./M.P.P. 1
Total 200
Graduate Affairs
CIC BIOSCI Non-Degree 1
CIC Booth Non-Degree 2
CIC DIV Non-Degree 1
CIC HUM Non-Degree 5
CIC PUBPOL Non-Degree 2
CIC SOCSCI Non-Degree 3
Exchange Booth Non-Degree 1
Total 15
Special Programs
Chicago Theol Sem Non-Degree 1
CPS Bridge Program (Academic Year) Non-Degree 6
Elementary Teachers Seminar Non-Degree 21
Lutheran School Theo Non-Degree 1
Total 29
Graham School of Continuing Liberal andProfessional Studies
GSAL Non-Degree 63
GSAL in Business Courses Non-Degree 39
Liberal Arts M.L.A. 14
Master of Science in Threat and Response Management M.S. 15
Post-Graduate Certificate Program in Medical Physics Non-Degree 2
Returning Scholar Non-Degree 4
Urban Teaching Program M.A.T. 21
Total 158
Total New University Students 4044

College
Barcelona Program (Academic Year) 2
Beijing Program 26
BEIJING PROGRAM (PEKING) 2
BOLOGNA PROGRAM 1
BRISTOL UNIVERSITY 1
CAMBRIDGE PROGRAM 2
EDINBURGH UNIV 2
KYOTO PROGRAM 3
LONDON KING'S COLL 1
LONDON PROGRAM 21
LONDON SCH OF ECON 4
LONDON UNIV COLL 4
Milan (Bocconi) Program 2
PARIS ANNUAL PROGRAM 6
PARIS AUTUMN CIV PROGRAM (ENGLISH) 22
PARIS AUTUMN CIV PROGRAM (FRENCH) 17
Paris Autumn Colonizations Program 24
PARIS AUTUMN PROGRAM (HUM EVOL) 10
PUNE PROGRAM 18
ROME PROGRAM 26
Santiago Program 4
Seoul (Yonsei) Program 1
ST. CATHERINE'S COLLEGE-OXFORD PROGRAM 4
ST. PETERSBURG PROGRAM 3
TANZANIA PROGRAM 2
TOLEDO PROGRAM 9
TRINITY DUBLIN 1
VIENNA PROGRAM 25
College Total 243
Social Sciences
At Columbia University 1
At Harvard University 3
At Stanford University 1
At University of California-Berkeley 1
At University of Wisconsin-Madison 1
Social Sciences Total 7
Graduate Affairs
From Brown University 1
From Northwestern University 7
From Stanford University 1
From University of California-Berkeley 1
From University of Illinois-Chicago 8
From University of Illinois-Urbana/Champaign 4
Graduate Affairs Total 22
TABLE IVEnrollments in College Study Abroad Programs,
Exchange Scholars and CIC Programs,and other graduate-level study away programs

TABLE VDegrees Awarded
A: College Degrees by Collegiate Division and FieldTotal College Graduates = 45 Bachelor of Arts, 5 Bachelor of Science
(College students may graduate with multiple fields)
B.A.
Male
B.A.
Female
B.S.
Male
B.S.
Female
TOTAL
Biological Sciences Collegiate Division BIOLOGICAL SCIENCES 1 3 4
Biological Sciences Collegiate Division Total 1 3 4
Humanities Collegiate Division
EAST ASIAN LANGUAGES AND CIVILIZATIONS 1 1
ENGLISH LANGUAGE AND LITERATURE 3 3
INTERDISCIPLINARY STUDIES IN HUMANITIES 1 1
LINGUISTICS 1 1
NEAR EASTERN LANGUAGES & CIVILIZATIONS 1 1
PHILOSOPHY 4 2 6
Humanities Collegiate Division Total 7 6 13
Physical Sciences Collegiate Division
BIOLOGICAL CHEMISTRY 1 1 2
CHEMISTRY 1 1 1 3
GEOPHYSICAL SCIENCES 1 1
MATHEMATICS 2 1 1 1 5
PHYSICS 1 2 3
Physical Sciences Collegiate Division Total 4 5 3 2 14
Social Sciences Collegiate Division
COMPARATIVE HUMAN DEVELOPMENT 1 1 2
COMPARATIVE RACE AND ETHNIC STUDIES 1 1
ECONOMICS 11 2 13
INTERNATIONAL STUDIES 1 1
POLITICAL SCIENCE 3 3
PSYCHOLOGY 1 2 3
PUBLIC POLICY STUDIES 2 2
Social Sciences Collegiate Division Total 17 8 25
TOTAL COLLEGE Total 29 22 3 2 56

Table VDegrees Conferred
B: The Graduate Divisions
M.A.
Male
M.A.
Female
M.S.
Male
M.S.
Female
Ph.D.
Male
Ph.D.
Female
TOTAL
Biological Sciences
BIOCHEMISTRY AND MOLECULAR BIOLOGY 1 1 1 3
CANCER BIOLOGY 1 1
COMMITTEE ON NEUROBIOLOGY 2 2
DEVELOPMENTAL BIOLOGY 1 1
EVOLUTIONARY BIOLOGY 1 1 2
HEALTH STUDIES 1 1
HUMAN GENETICS 1 1 2
Interdisciplinary Scientist Training Program 1 1
MOLECULAR GENETICS AND CELL BIOLOGY 1 1
Molecular Pathogenesis and Molecular Medicine 1 1
PATHOLOGY 1 1 2
Biological Sciences Total 4 3 5 5 17
Humanities
COMPARATIVE LITERATURE 1 2 3
EAST ASIAN LANGUAGES AND CIVILIZATIONS 2 1 3
ENGLISH LANGUAGE AND LITERATURE 1 1 2
LINGUISTICS 1 1 2
MA PROGRAM IN HUMANITIES 3 3 6
MUSIC 3 3
NEAR EASTERN LANGUAGES AND CIVILIZATIONS 1 1 2
PHILOSOPHY 3 3
ROMANCE LANGUAGES & LITERATURES 1 2 3
SOUTH ASIAN LANGUAGES AND CIVILIZATIONS 1 1
THE DEPARTMENT OF CLASSICS: ANCIENT MEDITERRANEAN WORLD 2 1 3
THE DEPARTMENT OF CLASSICS: CLASSICAL LANGUAGES & LITERATURES 2 2
Humanities Total 12 8 9 4 33
Physical Sciences
ASTRONOMY & ASTROPHYSICS 1 2 3
Biophysical Sciences 1 1
CHEMISTRY 22 3 6 1 32
COMPUTER SCIENCE 1 1
FINANCIAL MATHEMATICS 1 1
GEOPHYSICAL SCIENCES 1 1
Masters Program in Computer Science 10 2 12
MATHEMATICS 1 1 2
PHYSICAL SCIENCES:DIVISIONAL MASTERS PRG 1 1
PHYSICS 9 1 6 2 18
STATISTICS MS 2 5 7
Physical Sciences Total 45 12 16 6 79
Social Sciences
ANTHROPOLOGY 1 1 2
ECONOMICS 5 1 6
HISTORY 3 4 2 9
INTERNATIONAL RELATIONS 1 1
LATIN AMER & CARIB STUDIES-SOC SCI 3 3
MASTER OF ARTS IN THE SOCIAL SCIENCES 13 9 22
POLITICAL SCIENCE 2 1 1 1 5
PSYCHOLOGY 1 1
SOCIOLOGY 1 4 5
Social Sciences Total 24 15 7 8 54
TOTAL DIVISIONS Total 36 23 49 15 37 23 183

Table VDegrees Conferred
C: The Professional Schools & The Graham School of General Studies
Male Female TOTAL
Booth School of Business M.B.A. 112 23 135
Ph.D. 2 1 3
Booth School of Business Total 114 24 138
Divinity School M.A. 3 2 5
Ph.D. 1 3 4
Divinity School Total 4 5 9
Harris School of Public Policy Studies M.P.P. 1 1 2
Ph.D. 1 1 2
Harris School of Public Policy Studies Total 2 2 4
Social Service Administration M.A. 4 4
Ph.D. 2 4 6
Social Service Administration Total 2 8 10
Graham School of Continuing Liberal and Professional Studies M.L.A. 1 1
Graham School of Continuing Liberal and Professional Studies Total 1 1
TOTAL ALL DEGREES Total 122 40 162

Degree
Full-Time
Degree
Half-Time
Degree
Less-than-Half-Time
Non-Degree
Full-Time
Non-Degree
Half-Time
Non-Degree
Less-than-Half-Time
Total
College 5621 47 24 30 4 10 5736
Biological Sciences 411 6 3 27 447
Humanities 820 9 5 10 844
Physical Sciences 799 32 83 41 4 959
Social Sciences 1217 8 2 16 1243
Booth School of Business, Harper Center Programs 1266 7 8 53 1334
Booth School of Business, Gleacher Center Programs 109 972 284 7 1372
Booth School of Business, Executive MBA Programs 236 253 7 50 546
Divinity School 285 8 1 2 1 2 299
Law School 692 692
Pritzker School of Medicine 396 396
Institute for Molecular Engineering 15 10 25
Harris School of Public Policy Studies 322 8 3 2 335
Social Service Administration 465 16 1 4 486
Graduate Affairs 22 22
Special Programs 1 100 101
Graham School of Continuing Liberal and Professional Studies 46 69 35 43 28 130 351
Total 12700 1435 456 260 34 303 15188
Full-Time Equivalent (FTE) (Numbers rounded):College Degree = 5660College Non-Degree = 36College Total FTE = 5696
Graduate Degree = 8148Graduate Non-Degree = 348Graduate Total FTE = 8496
Total University Degree = 13808Total University non-Degree = 384Total University FTE = 14192
Table 6Full and Part-Time Enrollment
(Students enrolled in credit courses or credit-equivalent statuses)Autumn 2013
Legend:
Full-Time = Student enrolled for 300 or more units of credit or equivalentHalf-Time = Student enrolled for 200-299 units of credit or equivalentLess-than-Half-Time = Student enrolled for 001-199 units of credit or equivalent
Degree
Male Male
Degree
Female Female
Non-Degree
Male Male
Non-Degree
Female Female Total
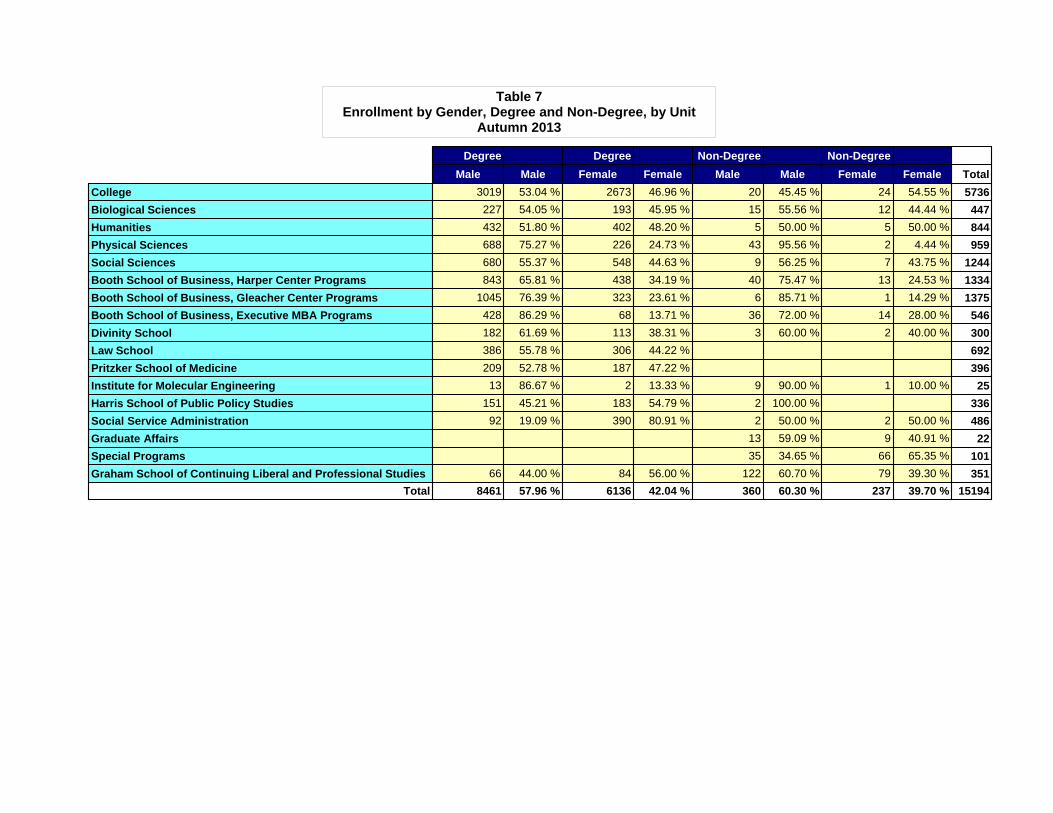
College 3019 53.04 % 2673 46.96 % 20 45.45 % 24 54.55 % 5736
Biological Sciences 227 54.05 % 193 45.95 % 15 55.56 % 12 44.44 % 447
Humanities 432 51.80 % 402 48.20 % 5 50.00 % 5 50.00 % 844
Physical Sciences 688 75.27 % 226 24.73 % 43 95.56 % 2 4.44 % 959
Social Sciences 680 55.37 % 548 44.63 % 9 56.25 % 7 43.75 % 1244
Booth School of Business, Harper Center Programs 843 65.81 % 438 34.19 % 40 75.47 % 13 24.53 % 1334
Booth School of Business, Gleacher Center Programs 1045 76.39 % 323 23.61 % 6 85.71 % 1 14.29 % 1375
Booth School of Business, Executive MBA Programs 428 86.29 % 68 13.71 % 36 72.00 % 14 28.00 % 546
Divinity School 182 61.69 % 113 38.31 % 3 60.00 % 2 40.00 % 300
Law School 386 55.78 % 306 44.22 % 692
Pritzker School of Medicine 209 52.78 % 187 47.22 % 396
Institute for Molecular Engineering 13 86.67 % 2 13.33 % 9 90.00 % 1 10.00 % 25
Harris School of Public Policy Studies 151 45.21 % 183 54.79 % 2 100.00 % 336
Social Service Administration 92 19.09 % 390 80.91 % 2 50.00 % 2 50.00 % 486
Graduate Affairs 13 59.09 % 9 40.91 % 22
Special Programs 35 34.65 % 66 65.35 % 101
Graham School of Continuing Liberal and Professional Studies 66 44.00 % 84 56.00 % 122 60.70 % 79 39.30 % 351
Total 8461 57.96 % 6136 42.04 % 360 60.30 % 237 39.70 % 15194
Table 7Enrollment by Gender, Degree and Non-Degree, by Unit
Autumn 2013

AmericanIndian/Native
American
Arab/MiddleEastern/North
AfricanAsian
Black or AfricanAmerican
Hispanic/Latino International Multi-Racial Pacific Islander Unspecified White TOTAL
College 8
0.14 %
15
0.26 %
1030
18.10 %
254
4.46 %
505
8.87 %
534
9.38 %
228
4.01 %
2
0.04 %
567
9.96 %
2549
44.78 %
5692
Biological Sciences 2
0.48 %
7
1.67 %
38
9.05 %
9
2.14 %
19
4.52 %
63
15.00 %
9
2.14 %
50
11.90 %
223
53.10 %
420
Humanities 3
0.36 %
8
0.96 %
31
3.72 %
19
2.28 %
44
5.28 %
185
22.18 %
16
1.92 %
136
16.31 %
392
47.00 %
834
Physical Sciences 3
0.33 %
53
5.80 %
7
0.77 %
17
1.86 %
473
51.75 %
3
0.33 %
79
8.64 %
279
30.53 %
914
Social Sciences 8
0.65 %
4
0.33 %
45
3.66 %
62
5.05 %
73
5.94 %
375
30.54 %
46
3.75 %
158
12.87 %
457
37.21 %
1228
Booth School of Business, Harper Center Programs 176
13.74 %
45
3.51 %
33
2.58 %
448
34.97 %
94
7.34 %
485
37.86 %
1281
Booth School of Business, Gleacher Center Programs 270
19.74 %
31
2.27 %
31
2.27 %
200
14.62 %
1
0.07 %
73
5.34 %
762
55.70 %
1368
Booth School of Business, Executive MBA Programs 61
12.30 %
11
2.22 %
6
1.21 %
306
61.69 %
24
4.84 %
88
17.74 %
496
Divinity School 1
0.34 %
16
5.42 %
16
5.42 %
2
0.68 %
32
10.85 %
3
1.02 %
35
11.86 %
190
64.41 %
295
Law School 3
0.43 %
56
8.09 %
37
5.35 %
51
7.37 %
111
16.04 %
14
2.02 %
62
8.96 %
358
51.73 %
692
Pritzker School of Medicine 1
0.25 %
2
0.51 %
84
21.21 %
32
8.08 %
29
7.32 %
2
0.51 %
10
2.53 %
49
12.37 %
187
47.22 %
396
Institute for Molecular Engineering 6
40.00 %
3
20.00 %
6
40.00 %
15
Harris School of Public Policy Studies 1
0.30 %
2
0.60 %
22
6.59 %
12
3.59 %
10
2.99 %
159
47.60 %
3
0.90 %
26
7.78 %
99
29.64 %
334
Social Service Administration 5
1.04 %
2
0.41 %
27
5.60 %
48
9.96 %
28
5.81 %
28
5.81 %
10
2.07 %
1
0.21 %
52
10.79 %
281
58.30 %
482
Graham School of Continuing Liberal and Professional Studies 1
0.67 %
10
6.67 %
22
14.67 %
12
8.00 %
3
2.00 %
1
0.67 %
35
23.33 %
66
44.00 %
150
TOTAL
Percent:
28
0.19 %
48
0.33 %
1919
13.15 %
605
4.14 %
860
5.89 %
2925
20.04 %
343
2.35 %
4
0.03 %
1443
9.89 %
6422
44.00 %
14597
TABLE 8Enrollment by Ethnicity/Race
Degree-Seeking StudentsAutumn 2013
Effective Autumn 2010, U.S. Citizens and Permanent Residents who declare themselves to be Hispanic/Latino along with any other race or ethnicity will bereported only as Hispanic/Latino. U.S. Citizens and Permanent Residents who declare multiple races or ethnicities other than Hispanic/Latino will bereported as Multi-Racial. This is in accord with reporting rules specified by the U.S. Dept. of Education for the standardized IPEDS reports.

Extended Ineligible to Enroll Leave of AbsenceDoctoral Leave of
Absence
College 19 2 227
Biological Sciences 2
Humanities 10 1 2 15
Physical Sciences 2 15 4 10
Social Sciences 90 2 20
Booth School of Business, Harper Center Programs 1 9 1
Booth School of Business, Gleacher Center Programs 1 140
Booth School of Business, Executive MBA Programs 34
Divinity School 11 3 5
Law School 1 16
Pritzker School of Medicine 2
Harris School of Public Policy Studies 3
Social Service Administration 5 1
Graduate Affairs 7
Special Programs 16
Graham School of Continuing Liberal and Professional Studies 47 1
TABLE 9Non-Enrolled Students
(Not included in TABLE I)Autumn 2013
Legend:Extended = College, Master's, and Professional students who have completed all course enrollment requirements but have not been graduated.Ineligible to Enroll = Students whose enrollment for the quarter was denied due to outstanding financial or administrative reasons from prior quarters.Leave of Absence = College, Master's, and Professional students on an approved leave from their program.Doctoral Leave of Absence = Ph.D. students on leave from their programs per residence system policies.Doctoral Registration not Required = Ph.D. students using this quarter as the one quarter per academic year of non-enrollment as allowed by residence system policies