availability of phosphorus and - scholarspace - university
TRANSCRIPT

This dissertation has been 64-2651microfilmed exactly as received
DE DATTA, Surajit Kumar, 1933AVAILABILITY OF PHOSPHORUS ANDUTILIZATION OF PHOSPHATE FERTILIZERSIN SOME GREAT SOIL GROUPS OF HAWAII.
University of Hawaii, Ph.D., 1963Agriculture, general
University Microfilms, Inc., Ann Arbor, Michigan


AVAILABILITY OF PHOSPHORUS AND UTILIZATION
OF PHOSPHATE FERTILIZERS IN SOME
GREAT SOIL GROUPS OF HAWAII
A THESIS SUBMITTED TO THE GRADUATE SCHOOL OF THE
UNIVERSITY OF HAWAII IN PARTIAL FULFILLMENT
OF THE REQUIREMENTS FOR THE DEGREE OF
DOCTOR OF PHILOSOPHY
IN SOIL SCIENCE
JANUARY 1963
By
Surajit Kumar De Datta
Thesis Committee:
G. Donald Sherman, ChairmanHarry F. ClementsOtto R. YoungeEdward J. BrittenRobert L. FoxEdison W. Putman

ACKNOWLEDGMENTS
I wish to express my gratitude to Dr. G. Donald Sherman
for giving me the opportunity of studying at the University
of Hawaii. His interest and advice are greatly appreciated.
My grateful thanks are due to the Rockefeller Foundation and
officials of the College of Tropical Agriculture, University
of Hawaii, for providing the fellowship during the period
1959 to 1962. My cordial thanks are also due to
Dr. J. C. Moomaw and Dr. Robert L. Fox for their encourage
ment and guidance during the course of this investigation.
Financial support received for this project from the National
Science Foundation is appreciated. Finally my thanks are due
to Messrs. Y. Kanehiro, K. H. Houng, G. G. Beckmann, and other
members of the staff in the Department of Agronomy and Soil
Science for their help from time to time; also, to
Mrs. Betty Someda for typing the manuscript.
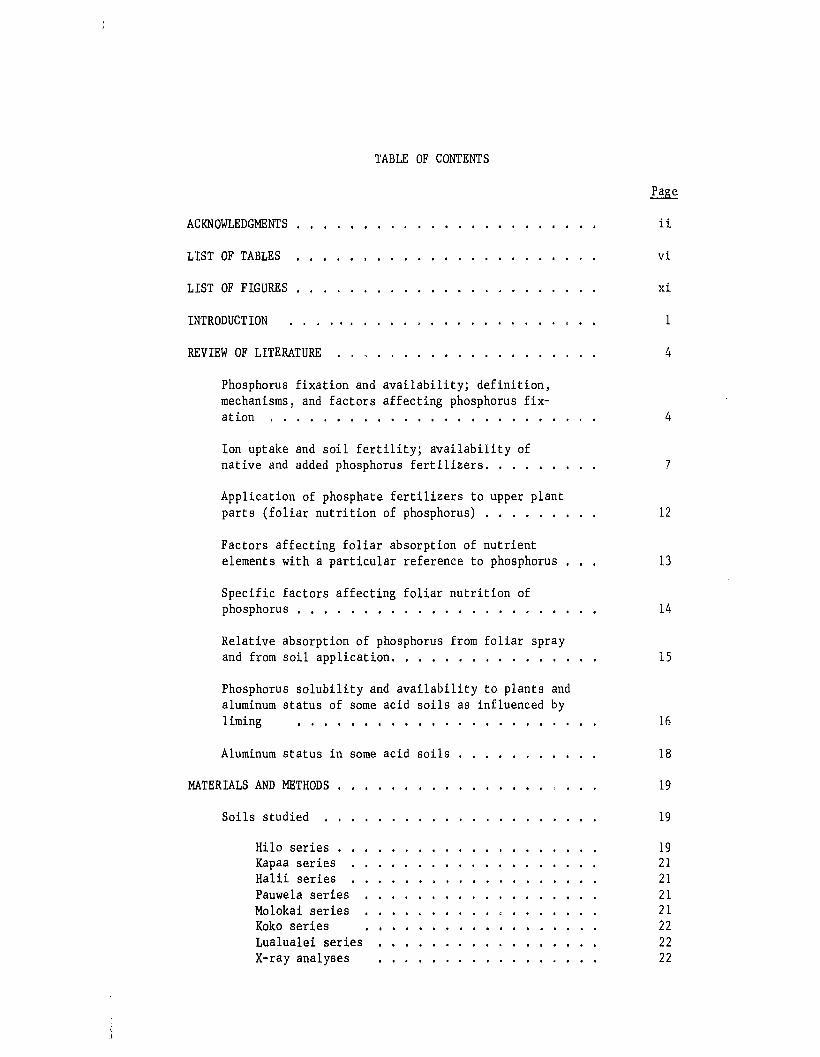
TABLE OF CONTENTS
ACKNOWLEDGMENTS
LIST OF TABLES
LIST OF FIGURES
INTRODUCTION
REVIEW OF LITERATURE
Phosphorus fixation and availability; definition,mechanisms, and factors affecting phosphorus fix-ation . . . . . . . . . . . . . . . • . . . .
Ion uptake and soil fertility; availability ofnative and added phosphorus fertilizers ....
Application of phosphate fertilizers to upper plantparts (foliar nutrition of phosphorus) . • . . .
Factors affecting foliar absorption of nutrientelements with a particular reference to phosphorus
Specific factors affecting foliar nutrition ofphosphorus . . . . . • • • . . . . ,
Relative absorption of phosphorus from foliar sprayand from soil application.••••...•.•.
Phosphorus solubility and availability to plants andaluminum status of some acid soils as influenced byliming .......••
Aluminum status in some acid soils
MATERIALS AND METHODS
Soils studied
Hilo series •Kapaa seriesHalii seriesPauwela seriesMolokai seriesKoko seriesLualualei seriesX-ray analyses
ii
vi
xi
1
4
4
7
12
13
14
15
16
18
19
19
1921212121222222

iv
TABLE OF CONTENTS (Continued) Page
Experiment I. The availability of fertilizer phosphorusin relation to various rates and isotopes (p3l and p32)of phosphorus in three Latosols of Hawaii 23
Greenhouse study . . . . . . . . . . 23Che~ccal and radio-chemical analyses 24
Experiment II. The availability of phosphorus, and utilization of phosphate fertilizers added to four great soilgroups of Hawaii as influenced by sources and methods ofphosphorus application. . 24
Design of experiment 24Test crop . . . . 24Potting soils 24Phosphorus sources . 25Rates and methods of phosphorus application 25Seed treatments and plantings .... 25Nutrient elements and moisture supply 26Foliar spray . . . . • • . 26Harvesting •..•.•. 27Chemical and radiochemical analyses 27
Experiment III. Phosphorus solubility and availabilityto plants and aluminum status of plants and soils as in-fluenced by liming 27
Greenhouse study 28Plant ashing 29CalOllation 29
Analytical procedures for soil analyses 30
Water soluble aluminum . . . 30Extractable aluminum 31Phosphorus fixation studies 31Statistical analyses 31
RESULTS AND DISCUSSION . . . . 33
Experiment I. (Results). Availability of fertilizer phosphorus in relation to various rates and isotopes ofphosphorus . . ~ • . • 33
Discussion (Experiment I). 36
Experiment II. (Results). Phosphorus availability to sugarcane as influenced by various phosphate fertilizers andmethods of application 38
Discussion (Experiment II) • 54

TABLE OF CONTENTS (Continued)
Experiment III. Soil phosphorus and aluminum solubilityand uptake by plants as influenced by liming . . .
Experimental results (short-term extraction).Phosphorus extraction studies
Experiment III. (Discussion) .
Short-term extractionLong-term extrac~ion.
Laboratory experiments (Results) •
Phosphorus fixation studiesAluminum status in soils
Laboratory experiment (Discussion)
SUMMARY.
APPENDIX
BIBLIOGRAPHY
v
60
6066
89
8991
104
104105
106a
108
113-126
127-138

20TABLE I.
TABLE II.
LIST OF TABLES
CHEMICAL CHARACTERISTICS OF SEVEN HAWAIIAN SOILSBELONGING TO SIX GREAT SOIL GROUPS . . . . . . .
THE INFLUENCE OF TWO ISOTOPES OF PHOSPHORUS (p31
AND p32) AND RATES OF PHOSPHORUS APPLICATION ONSUDAN GRASS YIELD AND PHOSPHORUS UPTAKE, AND THEPHOSPHORUS STATUS AND pH OF THE SOILS AFTERHARVEST . . . . . . . . . . . . . . . . . . . . 34
TABLE III. YIELD OF SUGAR CANE AS INFLUENCED BY VARIOUSPHOSPHATE FERTILIZERS AND METHODS OF PHOSPHORUSAPPLICATION EXPRESSED AS MULTIPLES OF THE CHECK(NO P). PLANTS WERE GROWN IN POTS FOR 3 MONTHS 40
TABLE IV. INFLUENCE OF VARIOUS PHOSPHATE FERTILIZERS ANDMETHODS OF PHOSPHORUS APPLICATION ON RELATIVEPHOSPHORUS CONCENTRATION IN SUGAR CANE TOPS.DATA ARE EXPRESSED AS MULTIPLES OF THE CHECK(NO P). PLANTS WERE GROWN IN pars FOR 3 MONTHSAND IN FOUR DIFFERENT SOILS . . . . . . . . . . 43
TABLE V. INFLUENCE OF VARIOUS PHOSPHATE FERTILIZERS ANDMETHODS OF PHOSPHORUS APPLICATION ON PHOSPHORUSYIELDS (P CONCENTRATION X DRY MATTER YIELD).DATA ARE EXPRESSED AS MULTIPLES OF THE CHECK(NO P). SUGAR CANE GROWN IN pars FOR 3 MONTHSAND IN FOUR DIFFERENT SOILS . . . . . , . . . 45
TABLE VI. INFLUENCE OF VARIOUS PHOSPHATE FERTILIZERS ANDMETHODS OF PHOSPHORUS APPLICATION ON THEALUMINUM CONCENTRATION (PPM.) IN DRY MATTERDURING 3 MONTHS OF SUGAR CANE GROWTH IN pars INFOUR DIFFERENT SOILS 50
TABLE VII. INFLUENCE OF VARmOUS PHOSPHATE FERTILIZERS ANDMETHODS OF PHOSPHORUS APPLICATION ON THE ALUMINUMYIELD (ALUMINUM CONCENTRATION X DRY MATTER YIELD)IN SUGAR CANE TOPS. PLANTS WERE GROWN IN parsFOR 3 MONTHS IN FOUR DIFFERENT SOILS . . . . 51
TABLE VIII. EXTRACTABLE SOIL PHOSPHORUS (MODIFIED TRUOG)AND SOIL pH AFTER 3 MONTHS GROWTH OF SUGAR CANE 53
TABLE IX. INFLUENCE OF VARIOUS TIMES OF PHOSPHORUS AND LIMEAPPLICATION ON THE P YIELD (PHOSPHORUS CONCENTRATIONX YIELD OF DRY MATTER) DURING 4 DAYS Roar-SOILCONTACT. SUDAN GRASS GROWN FROM SEED IN SIX DIF-FERENT SOILS . . . . . . . . . . . . . . . . . . 62

vii
LIST OF TABLES (Continued)
TABLE X. INFLUENCE OF VARIOUS TIMES OF PHOSPHORUS ANDLIME APPLICATION ON THE PERCENTAGE OF PLANTPHOSPHORUS DERIVED FROM FERTILIZER DURING 4DAYS ROar SOIL CONTACT. SUDAN GRASS GROWNFROM SEED IN SIX DIFFERENT SOILS . . . . . . 64
TABLE XI. INFLUENCE OF VARIOUS TIMES OF PHOSPHORUS ANDLIME APPLICATION ON THE PERCENTAGE OF PLANTPHOSPHORUS DERIVED FROM FERTILIZER DURING 4DAYS ROar-SOIL CONTACT. KOA HAOLE GROWN FROMSEED IN SIX DIFFERE~i SOILS. . . . . . . . . 65
TABLE XII. INFLUENCE OF VARIOUS TIMES OF PHOSPHORUS ANDLIME APPLICATION ON THE YIELD OF DRY MATTER(GRAMS/par) DURING 21 DAYS OF PLANT GROWTH.SUDAN GRASS GROWN IN pars FROM SEEDS IN SIXDIFFERENT SOILS . . . . . . . ..... , . 67
TABLE XIII. INFLUENCE OF VARIOUS TIMES OF PHOSPHORUS ANDLIME APPLICATION ON THE YIELD OF DRY MATTER(GRAMS/par) DURING 24 DAYS OF PLANT GROWTH.KOA HAOLE (1. GLAUCA) GROWN IN pars FROMSEEDS IN SIX DIFFERENT SOILS . . . . . . . . 69
TABLE XIV. INFLUENCE OF VARIOUS TIMES OF PHOSPHORUS ANDLIME APPLICATION ON THE PERCENTAGE UTILIZATION OF ADDED PHOSPHORUS DURING 21 DAYS OFPLANT GROWTH. .SUDAN GRASS GROWN IN pars INSIX DIFFERENT SOILS . . . . . . . . . . . . 81
TABLE XV. INFLUENCE OF VARIOUS TIMES OF PHOSPHORUS ANDLIME APPLICATION ON THE PERCENTAGE UTILIZATION OF ADDED PHOSPHORUS DURING 24 DAYS OFPLANT GROWTH. KOA HAOLE (1. GLAUCA) GROWNIN pars IN SIX DIFFERENT SOILS . . . . . . . 82
TABLE XVI. INFLUENCE OF VARIOUS TIMES OF PHOSPHORUS ANDLIME APPLICATION ON ALUMINUM CONCENTRATIONSDURING 21 DAYS OF PLANT GROWTH. SUDAN GRASSGROWN IN pars FROM SEEDS IN SIX DIFFERENTSOILS . . . . . . . . . . . . . . . . . . . 85
TABLE XVII. INFLUENCE OF VARIOUS TIMES OF PHOSPHORUS ANDLIME APPLICATION ON ALUMINUM CONCENTRATIONSDURING 24 DAYS OF PLANT GROWTH. KOA HAOLE(1,. GLAUCt:) GROWN IN pars FROM SEEDS IN SIXDIFFERENT SOILS . . . . . . . . . . . . . . 86
viii
LIST OF TABLES (Continued)
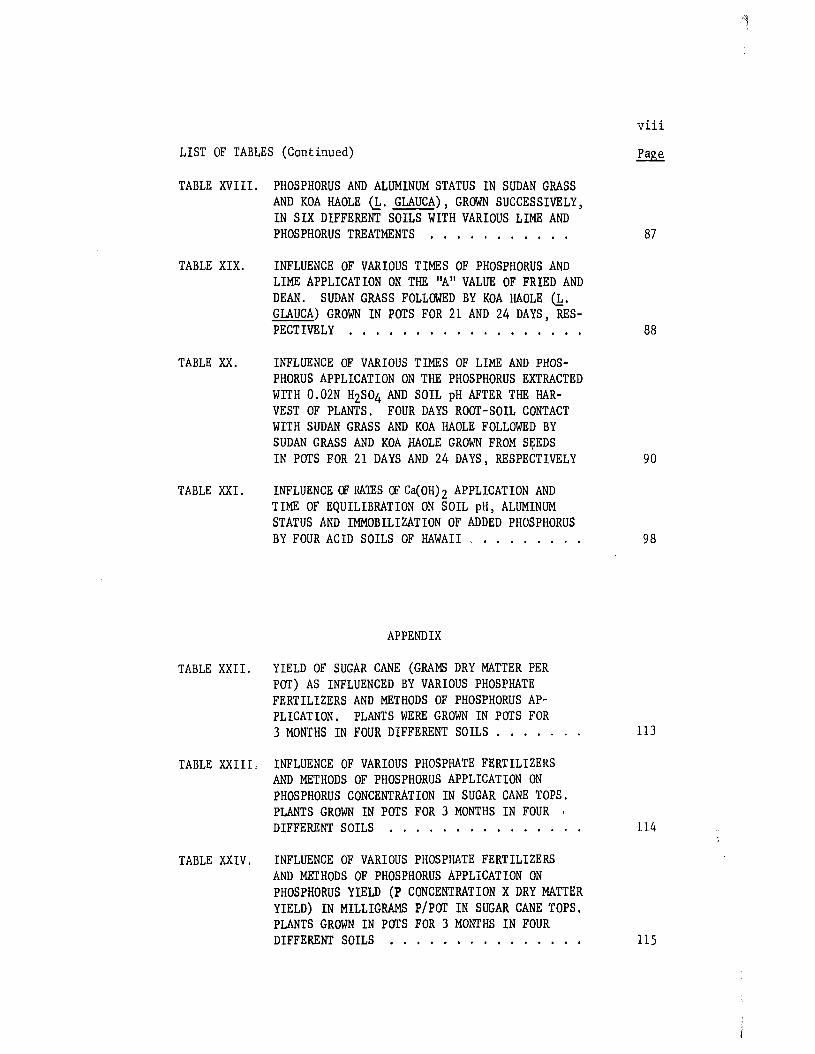
TABLE XVIII. PHOSPHORUS AND ALUMINUM STATUS IN SUDAN GRASSAND KOA HAOLE (b. GLAUCA), GROWN SUCCESSIVELY,IN SIX DIFFERENT SOILS WITH VARIOUS LIME ANDPHOSPHORUS TREATMENTS . . . . . . . . . . . 87
TABLE XIX. INFLUENCE OF VARIOUS TIMES OF PHOSPHORUS ANDLIME APPLICATION ON THE IIA II VALUE OF FRIED ANDDEAN. SUDAN GRASS FOLLOWED BY KOA HAOLE (L.GLAUCA) GROWN IN POTS FOR 21 AND 24 DAYS, RES-PECTIVELY . . . . . . . . . . . . . . . . . 88
TABLE XX. INFLUENCE OF VARIOUS TIMES OF LIME AND PHOSPHORUS APPLICATION ON THE PHOSPHORUS EXTRACTEDWITH O. 02N H2S04 AND SOIL pH AFTER THE HARVEST OF PLANTS. FOUR DAYS ROOT-SOIL CONTACTWITH SUDAN GRASS AND KOA HAOLE FOLLOWED BYSUDAN GRASS AND KOA MOLE GROWN FROM S~EDS
IN POTS FOR 21 DAYS AND 24 DAYS, RESPECTIVELY 90
TABLE XXI. INFLUENCE CF RAlES CF Ca(OH) 2 APPLICATION ANDTIME OF EQUILIBRATION ON SOIL pH, ALUMINUMSTATUS AND IMMOBILIZATION OF ADDED PHOSPHORUSBY FOUR ACID SOILS OF HAWAII . . . . . . . . . 98
APPENDIX
TABLE XXII. YIELD OF SUGAR CANE (GRAMS DRY MATTER PERPOT) AS INFLUENCED BY VARIOUS PHOSPHATEFERTILIZERS AND METHODS OF PHOSPHORUS APPLICATION. PLANTS WERE GROWN IN POTS FOR3 MONTHS IN FOUR DIFFERENT SOILS . . . . . 113
TABLE XXIII, INFLUENCE OF VARIOUS PHOSPHATE FERTILIZERSAND METHODS OF PHOSPHORUS APPLICATION ONPHOSPHORUS CONCENTRATION IN SUGAR CANE TOPS.PLANTS GROWN IN POTS FOR 3 MONTHS IN FOUR 'DIFFERENT SOILS . . . . . . . . . . . . . 114
TABLE XXIV. INFLUENCE OF VARIOUS PHOSPHATE FERTILIZERSAND METHODS OF PHOSPHORUS APPLICATION ONPHOSPHORUS YIELD (P CONCENTRATION X DRY MATTERYIELD) IN MILLIGRAMS P/POT IN SUGAR CANE TOPS.PLANTS GROWN IN POTS FOR 3 MONTHS IN FOURDIFFERENT SOILS . . . . . . . . . . . . . . . 115
;';~
··::i
ix
APPENDIX (Continued)
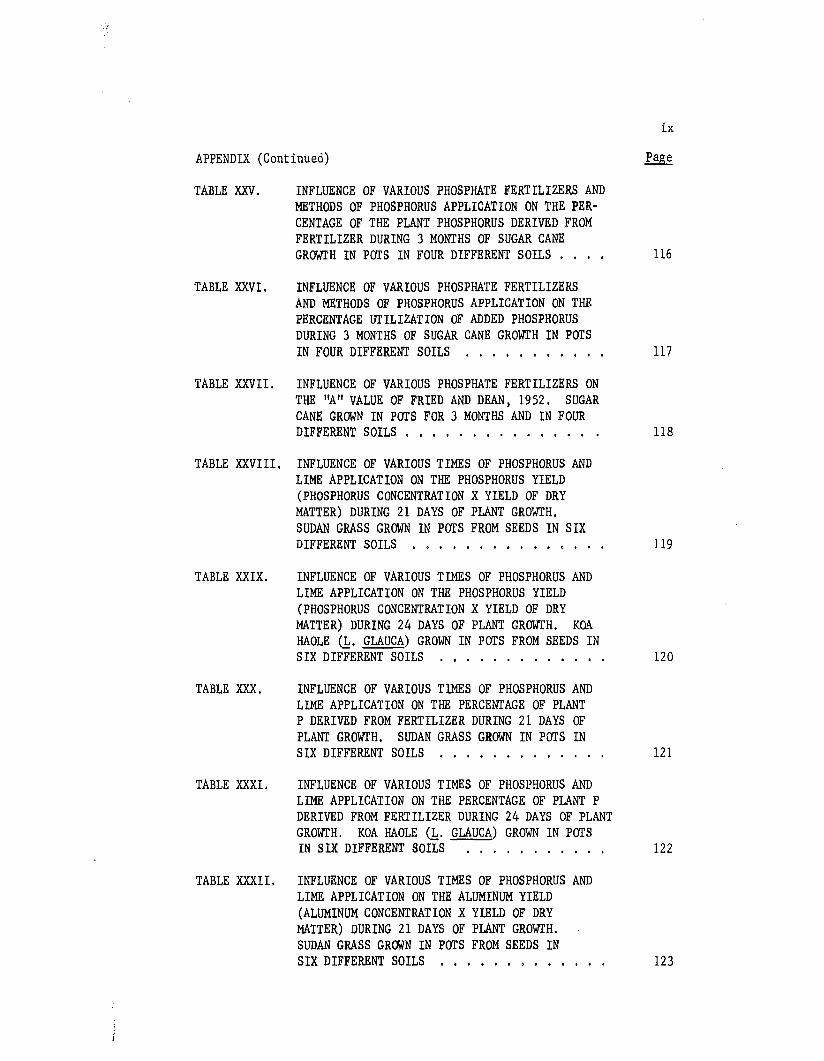
TABLE XXV. INFLUENCE OF VARIOUS PHOSPHATE FERTILIZERS ANDMETHODS OF PHOSPHORUS APPLICATION ON THE PERCENTAGE OF THE PLANT PHOSPHORUS DERIVED FROMFERTILIZER DURING 3 MONTHS OF SUGAR CANEGROWTH IN POTS IN FOUR DIFFERENT SOILS . . 116
TABLE XXVI. INFLUENCE OF VARIOUS PHOSPHATE FERTILIZERSAND METHODS OF PHOSPHORUS APPLICATION ON THEPERCENTAGE UTILIZATION OF ADDED PHOSPHORUSDURING 3 MONTHS OF SUGAR CANE GROWTH IN POTSIN FOUR DIFFERENT SOILS . . . . . . . . . . . 117
TABLE XXVII. INFLUENCE OF VARIOUS PHOSPHATE FERTILIZERS ONTHE "A" VALUE OF FRIED AND DEAN, 1952. SUGARCANE GROWN IN POTS FOR 3 MONTHS AND IN FOURDIFFERENT SOILS . . . . . . . . . . . . . . 118
TABLE XXVIII. INFLUENCE OF VARIOUS TIMES OF PHOSPHORUS ANDLIME APPLICATION ON THE PHOSPHORUS YIELD(PHOSPHORUS CONCENTRATION X YIELD OF DRYMATTER) DURING 21 DAYS OF PLANT GROWTH.SUDAN GRASS GROWN IN POTS FROM SEEDS IN SIXDIFFERENT SOILS . . . . . . . . . . . 0 • • 119
TABLE XXIX. INFLUENCE OF VARIOUS TIMES OF PHOSPHORUS ANDLIME APPLICATION ON THE PHOSPHORUS YIELD(PHOSPHORUS CONCENTRATION X YIELD OF DRYMATTER) DURING 24 DAYS OF PLANT GROWTH. KQ~
HAOLE (1. GLAUCA) GROWN IN POTS FROM SEEDS INSIX DIFFERENT SOILS ... . . . . . . . . . 120
TABLE XXX. INFLUENCE OF VARIOUS TIMES OF PHOSPHORUS ANDLIME APPLICATION ON THE PERCENTAGE OF PLANTP DERIVED FROM FERTILIZER DURING 21 DAYS OFPLANT GROWTH. SUDAN GRASS GROWN IN POTS INSIX DIFFERENT SOILS . . . . . . . . . . . . 121
TABLE XXXI. INFLUENCE OF VARIOUS TIMES OF PHOSPHORUS ANDLIME APPLICATION ON THE PERCENTAGE OF PLANT PDERIVED FROM FERTILIZER DURING 24 DAYS OF PLANTGROWTH. KGA HAOLE (1. GLAUCA) GROWN IN POTSIN SIX DIFFERENT SOILS 122
TABLE XXXII. INFLUENCE OF VARIOUS TIMES OF PHOSPHORUS ANDLIME APPLICATION ON THE ALUMINUM YIELD(ALUMINUM CONCENTRATION X YIELD OF DRYMATTER) DURING 21 DAYS OF PLANT GROWTH.SUDAN GRASS GR~N IN POTS FROM SEEDS INSIX DIFFERENT SOILS ... . . . 0 • • • 123

x
APPENDIX (Continued)
TABLE XXXIII. INFLUENCE OF VARIOUS TIMES OF PHOSPHORUS ANDLIME APPLICATION ON THE ALUMINUM YIELD (ALUMINUM CONCENTRATION X YIELD OF DRY MATTER)DURING 24 DAYS OF PLANT GROWTH. KOA HAOLE1. GLAUCA) GROWN IN POTS FROM SEEDS IN SIXDIFFERENT SOILS . . . . . . . . . . . . . 124
TABLE XXXIV. INFLUENCE OF REACTION TIME ON THE IMMOBILIZATION OF ADDED PHOSPHORUS BY SEVEN HAWAIIANSOILS. DATA ARE EXPRESSED AS PERCENTAGE OF PREMAINING IN SOIL SOLUTION. . . . . . . . . 125
TABLE XXXV. RELATIONSHIP BETWEEN ALUMINUM CONCENTRATIONIN SUDAN GRASS AND PHOSPHORUS TAKEN UP FROMFERTILIZER IN SIX DIFFERENT SOILS. SUDANGRASS GROWN IN POTS FOR 21 DAYS . . . . . . . 126

LIST OF FIGURES
FIGURE 1. INFLUENCE OF VARIOUS PHOSPHATE FERTILIZERS ANDMETHODS OF PHOSPHORUS APPLICATION ON PLANT YIELDS(GRAMS DRY MATTER/POT). SUGAR CANE GROWN IN POTSFOR 3 MONTHS IN FOUR DIFFERENT SOILS . . . . . 39
FIGURE 2. INFLUENCE OF VARIOUS PHOSPHATE FERTILIZERS ANDMETHODS OF PHOSPHORUS APPLICATION ON PHOSPHORUSCONCENTRATION IN SUGAR CANE TOPS.. PLANTS GROWNIN POTS FOR 3 MONTHS IN FOUR DIFFERENT SOILS . 42
FIGURE 3. INFLUENCE OF VARIOUS PHOSPHATE FERTILIZERS ANDMETHODS OF PHOSPHORUS APPLICATION ON PHOSPHORUSYIELD (P CONCENTRATION X DRY MATTER YIELD) INSUGAR CANE TOPS. PLANTS GROWN IN POTS FOR 3MONTHS IN FOUR DIFFERENT SOILS . . . . . . . . 44
FIGURE 4. INFLUENCE OF VARIOUS PHOSPHATE FERTILIZERS ANDMETHODS OF PHOSPHORUS APPLICATION ON THE PERCENTAGE OF THE PLANT PHOSPHORUS DERIVED FROMFERTILIZER DURING 3 MONTHS Of SUGAR CANE GROWTHIN POTS IN FOUR DIFFERENT SOILS. . . . . . . . 47
FIGURE 5. INFLUENCE OF VARIOUS PHOSPHATE FERTILIZERS ANDMETHODS OF PHOSPHORUS APPLICATION ON THE PERCENTAGE UTILIZATION OF ADDED PHOSPHORUS DURING3 MONTHS OF SUGAR CANE GROWTH IN POTS IN FOURDIFFERENT SOILS. . . . . . . . . . . . . . . . 49
FIGURE 6. INFLUENCE OF VARIOUS PHOSPHATE FERTILIZERS ONTHE "A" VALUE OF FRIED AND DEAN, 1952. SUGAR CANEGROWN IN POTS FOR 3 MONTHS AND IN FOUR DIFFERENTSOILS . . . . . . . . . . . . . . . . . 52
FIGURE 7. RELATIONSHIP (CORRELATION COEFFICIENT AND REGRESSION FACTOR) BETWEEN PERCENTAGE UTILIZATIONOF ADDED PHOSPHORUS (FOLIAR APPLICATION) ANDDRY MATTER YIELD DUE TO FOLIAR APPLIED PHOS-PHORUS IN SUGAR CANE . . . . . . . . . . . . . 56
FIGURE 8. RELATIONSHIP (CORRELATION COEFFICIENT AND REGRESSION FACTOR) BETWEEN PERCENTAGE UTILIZATIONOF ADDED PHOSPHORUS (SOIL APPLICATION) AND PHOS-PHORUS YIELD IN SUGAR CANE (SOIL APPLICATION). . 57

LIST OF FIGURES (Continued)
FIGURE 9. RELATIONSHIP (CORRELATION COEFFICIENT ANDREGRESSION FACTOR) BETWEEN PERCENTAGE UTILIZATION OF ADDED PHOSPHORUS (FOLIAR APPLICATIONAND PHOSPHORUS YIELD IN SUGAR CANE (FOLIARAPPLICATION) . . . . . . . . . . . . . . . . .
FIGURE 10. RELATIONSHIP (CORRELATION COEFFICIENT AND REGRESSION FACTOR) BETWEEN I~" VALUE AND PHOSPHORUS YIELD IN SUGAR CANE . . . . . . . . .
FIGURE 11. INFLUENCE OF VARIOUS TIMES OF PHOSPHORUS ANDLIME APPLICATION ON PHOSPH0RUS CONCENTRATION,PHOSPHORUS YIELD (PHOSPHORUS CONCENTRATION XPLANT YIELD), AND PERCENTAGE OF PLANT P DERIVED FROM FERTILIZER IN SUDAN GRASS GROWN INHILO SOIL FOR 21 DAYS . . . . . . . . . . .
FIGURE 12. INFLUENCE OF VARIOUS TIMES OF PHOSPHORUS ANDLIME APPLICATION ON PHOSPHORUS CONCENTRATION,PHOSPHORUS YIELD (PHOSPHORUS CONCENTRATION XPLANT YIELD), AND PERCENTAGE OF PLANT P DERIVED FROM FElITILIZER IN KOA HAOLE (1. GLAUCA)GROWN IN HILO SOIL FOR 24 DAYS . . . . . . .
FIGURE 13. INFLUENCE OF VARIOUS TIMES OF PHOSPHORUS ANDLIME APPLICATION ON PHOSPHORUS CONCENTRATION,PHOSPHORUS YIELD (PHOSPHORUS CONCENTRATION XPLANT YIELD), AND PERCENTAGE OF PLANT P DERIVED FROM FERTILIZER IN SUDAN GRASS GROWN INKAPAA SOIL FOR 21 DAYS . . . . . . . . . . .
FIGURE 14. INFLUENCE OF VARIOUS TIMES OF PHOSPHORUS ANDLIME APPLICATION ON PHOSPHORUS CONCENTRATION,PHOSPHORUS YIELD (PHOSPHORUS CONCENTRATION XPLANT YIELD), AND PERCENTAGE OF PLANT P DERIVED FROM FERTILIZER IN KOA HAOLE (k. GLAUCA)GROWN IN KAPAA SOIL FOR 24 DAYS . . . . . . .
FIGURE 15. INFLUENCE OF VARIOUS TIMES OF PHOSPHORUS ANDLIME APPLICATION ON PHOSPHORUS CONCENTRATION,PHOSPHORUS YIELD (PHOSPHORUS CONCENTRATION XPLANT YIELD), AND PERCENTAGE OF PLANT P DERIVED FROM FERTILIZER IN SUDAN GRASS GROWN INHALII SOIL FOR 21 DAYS . . . . . . . . . . . .
xii
58
61
71
72
73
74
75

xlii
LIST OF FIGURES (Continued)
FIGURE 16. INFLUENCE OF VARIOUS TIMES OF PHOSPHORUS ANDLIME APPLICATION ON PHOSPHORUS CONCENTRATION,PHOSPHORUS YIELD (PHOSPHORUS CONCENTRATION X PLANTYIELD), AND PERCENTAGE OF PLANT P DERIVED FROMFERTILIZER IN KOA HAOLE (1. GLAUCA) GROWN INHALII SOIL FOR 24"DAYS . . . . . . . . 76
FIGURE 17. INFLUENCE OF VARIOUS TIMES OF PHOSPHORUS ANDLIME APPLICATION ON PHOSPHORUS CONCENTRATION,PHOSPHORUS YIELD (PHOSPHORUS CONCENTRATION XPLANT YIELD), AND PERCENTAGE OF PLANT P DERIVED FROM FERTILIZER IN SUDAN GRASS GROWN INTHREE NEUTRAL OR SLIGHTLY ALKALINE SOILS FOR21 DAYS I 77
FIGURE 18. INFLUENCE OF VARIOUS TIMES OF PHOSPHORUS ANDLIME APPLICATION ON PHOSPHORUS CONCENTRATION,PHOSPHORUS YIELD (PHOSPHORUS CONCENTRATION XPLANT YIELD), AND PERCENTAGE OF PLANT B~DERlVED
FROM FERTILIZER IN KOA HAOLE (1. GLAUCA) GROWNIN THREE NEUTRAL OR SLIGHTLY ALKALINE SOILSFOR 24 DAYS. . . . . . . . . . . . . . . . . . . 78
FIGURE 19. RELATIONSHIP BETWEEN PERCENT UTILIZATION OF ADDEDPHOSPHORUS AND PLANT ALUMINUM IN SUDAN GRASSGROWN FROM SEED IN SOIL FOR 21 DAYS . . . . . 92
FIGURE 20. RELATIONSHIP BETWEEN PHOSPHORUS SOLUBILITY INSOIL WATER SYSTEMS AND PHOSPHORUS TAKEN UP BYPLANTS DURING 4 DAYS . . . . . . . . . . . . . 93
FIGURE 21. RELATIONSHIP (CORRELATION COEFFICIENT AND REGRESSION FACTOR) BETWEEN ALUMINUM CONCENTRATIONIN PLANTS AND PHOSPHORUS YIELD IN SUDAN GRASSGROWN IN THREE ACID SOILS FOR 21 DAYS. . . . . . 94
FIGUPJ: 22. RELATIONSHIP (COAAELATION COEFFICIENT AND REGRESSION FACTOR) BETWEEN ALUMINUM CONCENTRATIONIN PLANTS AND PHOSPHORUS YIELD IN KOA HAOLE(1. GLAUCA) GROWN IN THREE ACID SOILS FOR24 DAYS. . . . . . . . . . . . . . . . . . . . . 95
FIGURE 23. RELATIONSHIP (CORRELATION COEFFICIENT AND REGRESSION FACTOR) BETWEEN PHOSPHORUS YIELD INSUDAN GRASS AND KOA HAOLE (1. GLAUCA) GROWNSUCCESSIVELY IN SIX DIFFERENT SOILS. . . . . 99

LIST OF FIGURES (Continued)
FIGURE 24. RELATIONSHIP BETWEEN SOIL pH AND ALUMINUMEXTRACTED WITH IN BaC12 . . . . . . • . .
FIGURE 25. INFLUENCE OF VARIOUS RATES OF LIMING ON THERETENTION OF PHOSPHORUS BY FOUR ACID SOILSAFTER I-HOUR EQUILIBRATION . . . . . . . .
FIGURE 26. INFLUENCE OF VARIOUS RATES OF LIMING ON THERETENTION OF PHOSPHORUS BY FOUR ACID SOILSAFTER 48-HOUR EQUILIBRATION . . . . . . .
FIGURE 27. IMMOBILIZATION OF PHOSPHORUS BY SEVENHAWAIIAN SOILS DURING 4-DAY EQUILIBRATION OFSOILS WITH A PHOSPHORUS SOLUTION . . . . .
xiv
101
102
103
106

INTRODUCT ION
The soil is a supplier of phosphorus; and. i.n addition, it governs
phosphorus availability through complex reacd.ons between itself ar..d fer
tilizer phosphorus. Conservative phosphate fertilization of some soils
has not always effectively provided phosphorus for crop plants. Low ef
ficiency of phosphorus recovery has long been an important, practical
agricultural problem and has led many workers to study the problem of
phosphorus immobilization. It is this immobilization which is believed
largely responsible for low phosphate fertilizer recovery by plants and
for low crop yields. Low recovery of added phosphorus by agronomic crops
is a seri.ous problem il'. most Hawaiian soils.
Experiments conducted by Ayres (1934) and by Chu and Sherman (1952)
have shown that phosphorus fixation occurs very rapidly or even almost
immediately in many Hawaiian soils. Fixation of phosphorus and thus its
availability, can be regulated to some extent by certain management prac
tices of soils. Heavy phosphorus applications are sometimes advocated t.o
saturate the phosphorus fixation complex in soils with excess of phos
phorus for plant utilization (Younge, 1961; Younge and Moomaw: 1960).
Sometimes also the correct choice of a chemical compound to supply
phosphorus may improve fertilizer efficiency. When the factors responsible
for phosphorus fixation are understood more completely. a greater measure
of fertili.zer efficiency will be attained.
Direct application of phosphate fertilizer material to the plarrt
could be one solution to the soil fixation problem if a number of dif··
ficulties are overcome. Among these are: physiological burni~g of
leaves and stems, poor recovery of added phosphorus, and lack of uniform
distribution of the added nutrient within the plant. Some of these

2
difficu'cies may be overcome by using suitable fertilizer material,
controlled pH, proper concentration, and efficient means of application.
It is widely believed that the influence of lime on phosphorus
availability depends on the solubility and mobility of aluminum. The use
of soil amendments such as applications of lime to acid soils may be use-
ful in reducing the solubility and mobility of aluminum. It is commonly
believed that phosphorus availability to plants increases as soils are
limed close to pH 7.0; but this generalization may not apply in the
tropics. Greene (1954) has reported that results from liming in the
tropics have usually been unsatisfactory, and he concluded that the
question of liming tropical soils should be reconsidered.
In this study on phosphorus; one of the hypotheses proposed for
testing was: when lime is applied before phosphorus, phosphorus reacts
with the precipitated aluminum and forms a surface complex which rapidly
equilibrates with the soil solution. And further, when lime is applied
after the application of phosphorus, the phosphorus interacts with the
surfa .e and becomes covered by the precipitated aluminum.
The objectives of the various experiments performed and reported in
this thesis are summarized as follows:
1. 31 32to determine the influence of two isotopes; P and P ,phos-
phorus compounds, rates, and methods of phosphorus application
on the availability of native and applied phosphorus in diverse
soil systems.
2. to determine the availability of soil phosphorus ('rA" value of
Fried and Dean; 1952) as influenced by sources and various times
of lime and phosphorus application in several Hawaii.an soils.
3
3. to determine the influence of liming and phosphate fertilization
on the intensity of phosphorus fixation by soils with diverse
mineral systems, such as amorphous hydrated oxides, goethite
gibbsite; kaolin (1:1 clays), and montmorillonite (2:1 clays),
in various tropical soils.

REVIEW OF LITERATURE
Phosphorus fixation and availability; definition; mechanisms, and factors
affecting phosphorus fixation
Dean (1949) has defined "fixed" phosphorus " as the soil phos-
phorus which has become attached to the solid phase of soils ..... ".
Williams (1950) uses the term "phosphorus fixation" to denote the decrease
in solubility as distinct from availability which depends upon many other
factors. Kardos (1955) defined it as " .... ,the process whereby readily
soluble plant nutrients are changed to less soluble forms by reaction
with inorganic and organic components of soils with the result that the
nutrients become restricted in their mobility in the soil and suffer a
decrease in their availability to plants." Hemwall (1957) defined phos-
phorus fixation as " ..... phosphorus which has been rendered insoluble
that is defined as "fixed", ..... ".
The literature on phosphorus fixation is enormous. Reviews on this
subject have been written by Hidgley, 1940; Wild, 1949; Dean, 1949; and
Hemwall 1957. Therefore, only a very brief summary of pertinent liter-
ature on the mechanism involved and factors affecting phosphorus fixation
will be presented in the following few paragraphs.
Chemical fixation, adsorption or surface reaction. There is a ten-
den'y for phosphorus to concentrate at the solid liquid interface of the
soil system which may lead to fixation of phosphorus. The phosphorus thus
adsorbed and/or precipitated is relatively easily exchangeable. The
nature of the adsorption process is related to hydrated sesquioxides and
clay minerals especially of the 1:1 type (Mattson, 1931; Ravikovitch,
1934; Scarseth, 1935; Stout; 1939; and Coleman, 1944).
;j

,j
5
Anion exchange. The mechanism of phosphorus fixation is a reversible
reaction with the possibility of anion exchange as pointed out by Stout,
1939. Rubins and Dean (1947) considered that the major factor in fixation
is the replacement of one anion on the exchange complex by another, which
is present in a greater concentration, or by an anion which possesses a
stronger tendency to hold its position on the exchange complex, Phos-
phate ions exchange with the hydroxyl ions on the clay crystal surface
and with those of aluminum and ferric hydroxide which are present as
adventitious substances or as coating on the clay.
Chemical precipitation. Truog (1938) considered that the main
cause of phosphorus fixation is due to a precipitation of compounds
(minerals) in the soil and the phosphorus added as fertilizer. Further-
more, phosphorus present in soils as calcium phosphate is available to
plants and phosphorus present as iron and aluminum phosphates) is available
to plants only with difficulty. Iron and aluminum oxides and hydroxides
have been recognized by many investigators as active agents in phosphorus
fixation in acid soil systems. In a recent review Ginzburg (1960) dis-
cussed the importance of sesquioxides in phosphorus adsorption by solIs.
In acid soil systems the main products of phosphorus fixation are gen-
erally insoluble iron and aluminum phosphates. According to Wright
(1959), Lindsay et al. (1959), and Wright and Peech (1960), some crys-
tal line phosphorus minerals of the variscite - barrandite - strengite
isomorphous series govern the concentration of phosphorus in solution in
various acid soils. Terman and Stanford (1960) believe taranakite-like
forms may also exist in several soils.
In most instances soil fractionation procedures or other suitable
extracting procedures, have indic;ated an important role for iron and

aluminum in phosphorus fixation in acid soils (Catani and Pellegrino.
1957; Chai and Caldwell, 1959; Larsen et al., 1959; Coleman et~.) 1960;
Hsu and Jackson, 1960; Rathje: 1960; Saeki and Okamoto, 1960; Taylor,
1960; Yuan et ~." 1960; Chang and Chu, 1961; Lindsay and DeMent, 1961;
and Patel and Mehta, 1961).
Clay minerals also playa significant role in the process of phos
phorus fixation. Although these components are occasionally considered
separately as active agents in phosphorus fixation, it is becoming in
creasingly evident that both fix phosphorus by essentially the same
mechanisms. It is probable that the aluminum present in and on the clay
is responsible for the phosphorus·fixing propertie.s of clay minerals.
According to Haseman et~. (1950a), a process of phosphorus fixation by
clay minerals can be regarded as consisting of two distinct processes.
The initial rapid fixation is due to the chemical reaction of iron and
aluminum present in readily available forms and then later slow fixation
results from the reactions with iron and aluminum released frow the de
composition of the various minerals. This hypothesis was substantiated
by later works (Ellis and Truog, 1955). Results from various Hawaiian
soils showed that soils from which free oxides had been removed have a
lower amount of phosphorus fixed than soils with free oxides present
(Chu and Sherman, 1952). Hernwall (1957) measured the solubility of both
kaolinite and montmorillonite clays and of the resultant aluminum phos
phate. He concluded that highly insoluble compounds of aluminum phosphate
are formed with phosphorus and clay minerals by reacting with soluble
aluminum.
Fried and Dean (1955) determined the phosphorus-fixing characteristi.cs
of cation exchange resins saturated with iron and aluminum. They found

7
that these materials were capable of fixing phosphorus and concluded that
a similar phenomenon could occur in the soil via the clay minerals.
In alkaline and calcareous soils, phosphorus fixation is due to the
formation of insoluble calcium phosphates. According to Chu and Sherman
(1952), the fixation of phosphorus by chemical precipitation by calcium
ions does not seem to be a serious problem in most Hawaiian soils; it will
not be included in the present discussion.
Factors affecting phosphorus fixation. The course and extent of re
actions by which phosphorus fertilizers are fixed in soils are influenced
by a number of variables such as:
1. concentration of phosphate ions in soil solution (Ravikovitch,
1939) .
2. time' of reaction (Scarseth and Tidmore, 1934; Heck, 1934).
3. temperature (Low and Black, 1950).
4. reaction (pH) of the solution (Black, 1942; Coleman, 1944; and
Perkins and King, 1944).
5. types of mineral (Stout, 1939; Chatterjee and Datta, 1951; and
Chu and Sherman) 1952).
6. particle size (Coleman, 1944; Perkins and King, 1944).
7. exchangeable cations (Heck) 1934; Coleman and Mehlich, 1948; and
Pratt and Thorne, 1948).
8. effects of salts (Kurtz et~.; 1946; and Low and Black, 1950).
Iou uptake and soil fertility; availability of native and added phosphorus
fertilizers
The uptake of ions from soil by a growing plant depends on the capa
city of the plant to take up the element and the capacity of soil to
supply that element in requisite amounts. Independent investigations of
8
plant or soil systems may not give a complete measure of soil fertility
with reference to a particular nutrient element. It is possible to eval-
uate soil fertility with reasonable certainty by a study of interacting
soil-plant system.
The soil as a source of phosphorus. The availability of a nutrient
depends upon the integration of various factors and according to Overstreet
and Dean (1951) it may be considered " ..... as the state of being sufficient
for the use of plants.; ... ".
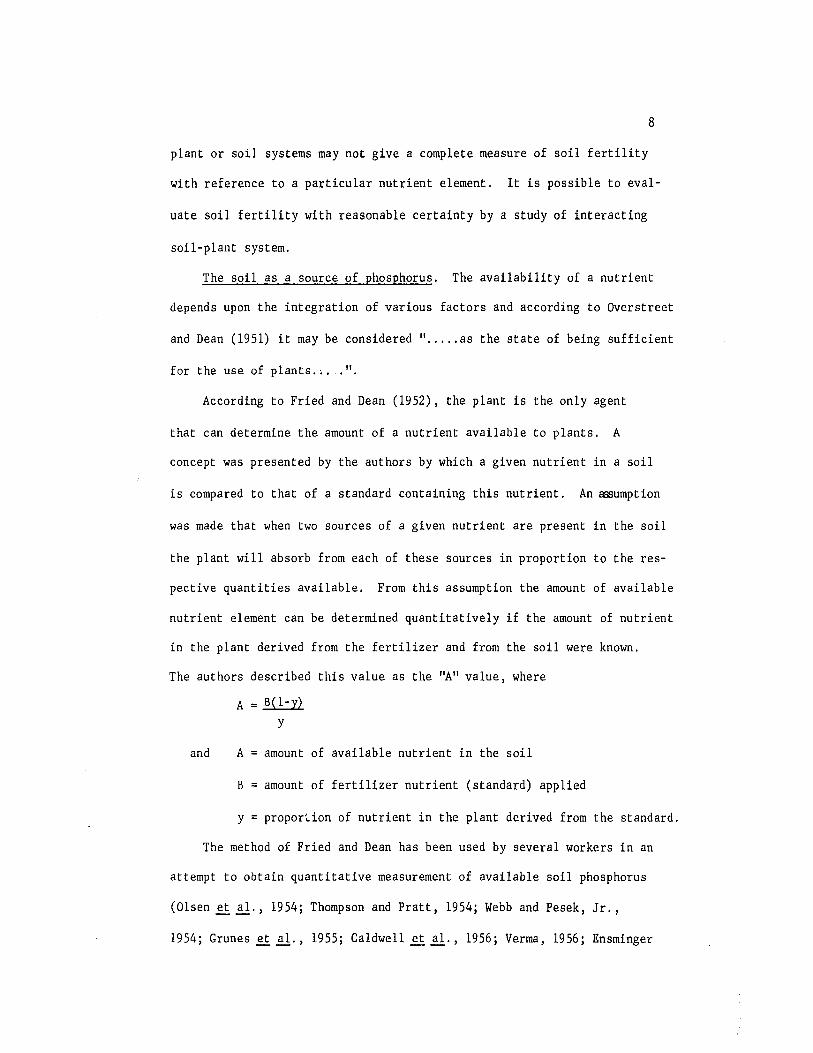
According to Fried and Dean (1952), the plant is the only agent
that can determine the amount of a nutrient available to plants. A
concept was presented by the authors by which a given nutrient in a soil
is compared to that of a standard containing this nutrient. An ~umption
was made that when two sources of a given nutrient are present in the soil
the plant will absorb from each of these sources in proportion to the res-
pective quantities available. From this assumption the amount of available
nutrient element can be determined quantitatively if the amount of nutrient
in the plant derived from the fertilizer and from the soil were known.
The authors described this value as the "A" value, where
A B(l-y)
Y
and A amount of available nutrient in the soil
B = amount of fertilizer nutrient (standard) applied
y = propor~ion of nutrient in the plant derived from the standard.
The method of Fried and Dean has been used by several workers in an
attempt to obtain quantitative measurement of available soil phosphorus
(Olsen et ~., 1954; Thompson and Pratt, 1954; Webb and Pesek, Jr.,
1954; Grunes et al., 1955; Caldwell et~., 1956; Verma, 1956; Ensminger

9
and Pearson, 1957; Golden, 1959; Franklin and Reisenauer, 1960; Maung,
1960; Schacht schabel , 1960; and Golden, 1961).
The amount of a nutrient that equilibrates with radioactive nutrient
in solution is also used in the laboratory to measure the available nu-
trient element. The amount of phosphorus on the surface of soil particles
is measured as surface phosphorus. McAuliffe et~. (1947), initiated
this procedure and indicated that an estimation of surface phosphorus
could be a reasonable method to evaluate nutrient availability; surface
or equilibration phosphorus is calculated as follows;
surface phosphorus (p32) X solution phosphorus (p31 )solution phosphorus (p32)
A relationship between "A" values and the amount of surface phosphorus
was established by Olsen (1953). A correlation coefficient of 0,952 was
found for a wide variety of soil types and conditions, The work of Olsen
(1953) indicated that the measurement of surface phosphorus may be useful
in the study of the reactions occurring when a fertilizer is applied to a
soil.
Fried (1957) has indicated the utility of surface phosphorus in
various soils and has discussed its application in evaluating avai.1able
soi.1 phosphorus. Phosphorus fixation ~as high in calcareous soil of'\1
Turkey and surface phosphorus was a podr indicator of phosphorus avail-
ability to plants (Fox et al.; 1961; and Fox et~., 1960).
Fertili?~r phosphorus uptake in relation to phosphorus isotopes (p31
and p32) in ~he fertilizer. Stable phosphorus, p3l, and radioactive
phosphorus, p32, are believed to be absorbed by the plant in the same
magnitude; these two isotopes perform the same chemical functions in the
plant. The difference between the two isotopes is in their atomic weights,

10
During decay the p32 atom releasesjS particles. The purpose of using
radioactive phosphate fertilizer is to determine the amount of plant
phosphorus derived from the soil as well as from the fertilizer source
and residual phosphorus remaining from previous fertilizer applications.,
McAuliffe et~. (1947) have shown that the p3204 ions added to the soils •
will undergo an isotopic exchange with some of the native soil phosphates.
If isotopic exchange is of appreciable magnitude, it would be necessary
to account for such losses by this mechanism. In later years, various
workers have reported their findings on isotopic exchanges occurring in
soil systems.
The validity of an assumption made by Hevsy (as quoted by Van den
Hende and De Loose 1958) to the effect that the roots do not differen-
tiate (H2P3204) and (H2P3l04) ions, was verified by fractionating the
amounts of p3l and p32 after maize had been grown on various substances
containing both isotopes. BaGed on the fact that the absorption of
labeled ?hosphorus from fertilizer is inversely proportional to the
amount of exchangeable phosphorus in the soil, a study was made of the
correlation between available phosphorus in soil as determined by using
labeled salts and as determined by standard chemical procedures. The
use of mono-calcium phosphate or di-calcium phosphate made no difference
in phosphorus uptake.
Yuan and Robertson (1958) reported that after 25 hours; p32 was
sorbed at the same rate as p3l. Provided a period is allowed for equi-
librium to be reached before available, labile, or exchangeable phosphorus
are measured, p32, with the ,Qarrier p3l, can be used as a measure of
available, labile or isotopically exchangeable phosphorus.
j
j
11
According to Bouldin and Black (1960); the main advantage of using
isotopes to evaluate different fertilizers is that of sensitivity. The
uptake of an isotope from a labeled fertilizer provides q means of de
tecting differences in the availability under conditions when yield of
plants or yield of nutrients are too low to be estimated by chemical
methods. Furthermore as long as no discrimination between isotopes
exists in the various reactions the nutrient undergoes before measure
ment, the validity of the estimates of uptake is not affected by changes
in availability that may result from reaction of the nutrient with the
soil, by isotopic exchange. A similar study was also reported by
Mattingly and Talibudeen (1961).
Comparative efficiency of various phosphate fertilizers. The ef
ficiency of various phosphorus sources as fertilizer materials has been
reviewed by Hendricks and Dean) 1952; Rogers et al.) 1953; and Fried,
1953a. Recently a comparison was made by Saunders (1958) of the degree
of phosphorus retention by soils frou different phosphate fertilizers
such as superphosphate) double superphosphate, potassium dihydrogen
phosphate and dicalcium phosphate. The soils used were of low; medium,
and high phosphorus status. Changes in soil pH would occur in the im
mediate vicinity of the phosphorus particle and affect the concentration
of phosphorus in the soil solution and the utilization of the applied
phosphorus. Laboratory and greenhouse studies with monocalcium, mono am
monium and diammonium phosphates were made by Bouldin and Sample, 1959.
It was found that dicalcium phosphate was superior to monocalcium phosphate
in Hartsells soil, while monocalcium phosphate was much superior to di
ammonium phosphate in Webster soil. Monoammonium phosphate was intermediate
in behavior between the two other sources in the Hartsells soil, but was

12
roughly equivalent to monocalcium phosphate in the Webster soil. The
Hartsells soil and the Webster soil had pH values of 5.2 and 8.3, res
pectively. Phosphate fertilizers produced by Tennessee Valley Authority
(TVA) have undergone extensive evaluation in various places of the United
States. The behavior of some of these water soluble phosphate ferti.lizers
differs in acid and in calcareous soils (Terman and Stanford, 1960).
Suehisa (1961), working with dicalcium phosphate and rock phosphate
reported that the yield of dry matter in the first and second cuttings
of Sudan grass was improved by these two phosphorus sources; monoammonium
phosphate showed improvement only in the first cutting, The least
soluble rock phosphate released more phosphorus than the highly soluble
ammonium phosphate when these two sources were compared with the check
(no phosphorus).
Application of phosphate fertilizers to upper plant parts (foliar nutri
tion of phosphorus)
The practice of foliar nutrition was reported early by Gris (1844);
and in later years by Biddulph (1941) and Colwell (1942).
In recent years great progress has been achieved in understanding
and in evaluating foliage sprays as a means of supplying essential nu
trient elements in crop production. The greater water solubilities and
higher analyses of nutrient elements in the commercial fertilizers make
fertilizers suitable for foliar application. The practice of foliar
application may be of value in supplying an adequate amount of phosphorus
to plants in soils having high phosphorus fixing capacities.
In recent years research on foliar application of nutrients has
been greatly fa~ilitated by the use of radioisotopes. The use of tagged
fertilizer makes it possible to distinguish the element absorbed from
/
/
13
the foliar spray and the same nutrient element absorbed simultaneously
from the soil. Therefore it is possible to follow the translocation of a
particular nutrient from two independent sources within the plant (~ittwer
and Lundahl, 1951; Silberstein and Wittwer, 1951; Lecat) 1~52; Burr et al.,
1956; Tukey et al., 1956; Wittwer, 1957; Aguiar, 1958).
Comprehensive reviews on foliar absorption of specific micro and
macro elements are available (Boynton, 1954; Wittwer and Teubner, 1959;
and Pandey, 1959). Numerous papers have appeared since 1940 describing
the rapidity of transport, pattern of distribution, and magnitude or the
contribution to nutrition of phosphorus (p32) applied as foliar spray
(Arnon et al., 1940; Biddulph, 1941; Colwell, 1942; Biddulph and Markle,
1944; Silberstein and Wittwer, 1951; ~!ittwer and Lundahl, 1951; Yatazawa
and Higashino, 1952; Asen et al., 1953; Eggert and Kardos, 1954; Fisher
and Walker, 1955; Biddulph, 1956; Suleimanov, 1956; Bukovac and Wittwer,
1960; and Yakushkina, 1960.
Factors affecting foliar absorption of nutrient elements with a particular
reference to phosphorus
The factors affecting foliar absorption can be classified into two
broad groups: external factors, such as temperature, light, pH of the
fertilizer solution, and carrier of the treating solution, various ad
ditive chemicals and internal factors such as morphological nature of the
absorbing organ and the nutritional status of the plant species. These
factors, affecting foliar nutrition, were studied by Long et al., 1955;
Teubner et al., 1957; Koontz and Biddulph, 1957; Thorne, 1958; Koontz,
1958; and Van den Hende et a1., 1960.

14
Specific factors affecting foliar nutrition of phosphorus
pH effect. pH of 2 to 3, as compared to a higher pH of the applied
phosphorus solution, facilitates more rapid uptake by leaves (Silberstein
and Wittwer, 1951; Swanson and Whitney, 1953; Eggert and Kardos, 1954;
Fisher and Walker, 1955; Mitsui, 1956; and Teubner et al., 1957).
Boroughs et al., 1961 studied the absorption of phosphorus between
pH values of 2 and 12 by cacao seedlings using NaHZP04 as a source of
phosphorus; they showed that a higher level of phosphorus uptake took
place between pH 2 and 6 with a peak at about pH 5 but a rapid decline
throughout the alkaline range.
A similar curve was obtained using KH2P04, but at a level much
higher than that was found with NaHZP04' According to Tukey ~~.,
1956, optimum pH for maximum phosphorus absorption depends upon the
nature of the phosphorus compounds applied.
Surfactants and wetting agents. Depending on the chemical nature
and the concentration of surfactant and wetting agent, anion uptake may
be increased by addition of surfactants and wetting agents (Fisher and
Walker, 1955; Teubner et ~~, 1957 and Boroughs ~~" 1961), may be
decreased (Swanson and Whitney 1953; Teubner ~~., 1957) or may not
be affected (Barrier and Loomis _ 1957; Teubner et ~., 1957; and Thorne,
1958). According to Tukey ~ &. (1956) the possibility of leaf burning
is reduced if a wetting agent is added to the spray formulation at suit
able concentration Wetting agents properly used promote more uniform
application of the spraying solution, Boroughs ~~. (1961) did not ob
serve great differences in the effects between cationic, anionic and
nonionic wetting agents. Certain detergents, however, will reduce the
rate with which phosphorus is absorbed.

15
The effects of air temperature, humidity, and light on phosphorus
uptake are not very clear and the results reported are inconsistent
(Barrier and Loomis, 1957; Thorne, 1958; and Maeda and Kojima, 1959)
Recently Sekioka (1961) reported that the p32 absorption by the leaf of
sweet potato increased with increasing air temperature when the plants
owere kept in darkness for 15 hours and at soil temperatures up to 40 C
According to Bukovac and Wittwer (1960) pretreatment of bean plants
with growth substances altered foliar absoprtion and transport of some
nutrients Maleic hydrazide reduced the uptake of p32 and gibberellin
A3 reduced the subsequent transport of p32 to the roots.
Other important factors affecting foliar absorption of phosphorus
have been studied by various workers These factors are leaf age (Tukey'
~&, 1956; Van den Rende et &., 1960, nutrient levels (Thorne and
Watson, 1953), and leaf surface (Oliver, 1952 and Indenko, 1960), etc,
Cations associated with the phosphate fertilizers are important be-
cause they influence the solubility and ionization of the phosphorus com-
pounds, This suggests an exchange mechanism in the entry of foliar applied
phosphorus (Tukey, ~&" 1956). Similar studies were also made by
Boroughs ~ &. (1961),
Relative absorption of phosphorus from foliar spray and from soil
application
A quantitative evaluation of phosphorus absorbed and trans, Jcated
from foliar spray as well as phosphorus obtained simultaneously from the
soil, is possible with the help of radioisotopes, Considering quantities
applied, foliar-applied phosphorus was utilized more efficiently than
phosphorus applied as broadcast to the soil (Silberstein and Wittwer,
1951), Similar results were reported for foliar spray as compared with

16
soil application by Eggert et~. (1952); Lecat (1952); Thorne and Watson
(1953); Wittwer et~. (1957); and Aguiar (1958). According to
Shereverya (1959) plant nutrition by foliar application is not only an
additional channel of nutrition, but also a means of regulating root up
take of phosphorus.
Uptake of phosphorus from foliar spray increased the yields of crops
(Wolfenbarger, 1949; Aufhammer and Hopfengart, 1952; and Thomas, 1960).
In pot experiments, spraying with NPK increased production of dry matter
in moist soil, but had an opposite effect in dry soil (Ivanov, 1959). In
other words moisture status of the soil played an important role in the
utilization of applied NPK.
Phosphorus solubility and availability to plants and aluminum status of
some acid soils as influenced by liming
The idea that lilliing acid soils promotes the availability of native
and added phosphorus, has been maintained by various authors for many
years, Comprehensive reviews on this subject have been written by Truog
(1953) and by Coleman et~. (1958). Since then several papers have ap
peared reporting that application of lime increases the availability of
phosphorus in the soil and decreases the fixation of added phosphorus
(Army and Miller, 1959; Goralski and Moskal, 1960; Maleina, 1960; Barnes
et~., 1960; Paton and Loneagan, 1960; Thomas, 1960; and Harper, 1962).
Liming tropical soils. It appears that one of the important re
actions of lime in acid soils is the replacement of exchangeable Al by
Ca with the formation of Al(OH)3' It is generally believed that liming
soils to about pH 7 increases the phosphorus supply to plants. Such an
assumption does not necessarily hold in many tropical soils. The

17
question of liming acid tropical soils should, therefore, be reconsidered
(Greene, 1954).
Richardson (1951) suggested that caution is often needed in liming
tropical soils since the practice of liming may lead to trace element
deficiencies in the soil. The lime requireffients of various soils in
Hawaii were studied by Matsusaka and Sherman (1950),
Cassidy (1954) reported that an application of 3 tons of coral stone
per acre to the soils in Fiji gave good responses in rice and sugar cane.
Younge (1959) found that an application of Z tons of lime to Humic
Ferruginous Latosols produced a substantial increase in yield of forage
and seed production for Kaimi clover (Desmodium~anum). Furthermore~
improved yields may result from addition of lime alone, and/or from a
mixture of Mo (PK Mg B).
Clements (1958) reported that responses could be expected over and
above those due to phosphorus and calcium as nutrients by using ground
coral rock (CaC03) and superphosphate. In an experiment at Pepeekeo
(Island of Hawaii), Clements (1959) found that on experimental plots re
ceiving 400 pounds PZ05/acre as raw rock phosphate-superphosphate mixture
and various rates of CaC03 (0-10,000 pounds limestone/acre) the sugar
cane tonnage as well as sucrose content were increased and he concluded
"..... that the calcium carbonate has stimulated cane growth, even though
presumably there was enough calcium available to the plant from the phos-
phate fertilizer. ".
Monteith (1961) reported that both calcium carbonate and calcium
silicate appeared to increase the yield of Sudan grass, growing in a
Hydrol Humic Latosol, provided the pH remained below 6.8. Above this
pH value, yield was depressed. Monteith concluded that the increased

18
yield was probably due to a reduction of 'toxic' aluminum brought about
by the action of calcium ions and increasing pH.
Liming of Hawaiian sugar cane soils has been reviewed by Ayres
(1961). The effects of heavy application of lime in the Hydrol Humic
Latosol were studied by Rixon (1962), There was a significant increase
in soluble phosphorus in the soils of the Hilo series receivillg lime
treatment, but only a very slight increase in soluble phosphorus with the
application of lime in soils of Akaka and Kaumoali series. In similar
soils of the Hydrol Humic Latosol, Clements (1960, 1962) reported that a
heavy application of lime as coral stone reduced aluminum concentration
in the nodes of sugar cane, increased the phosphorus concentration in the
plant; and greatly affected the amount of soluble aluminum in the soils
studied. The increase of phosphorus content was attributed to the greater
vigor of the root system.
Aluminum status in some acid soils
In acid soils, aluminum ions and hydrogen ions may be present to
gether in high concentrations and may limit the crop growth considerably.
According to Olson (1953) direct damage due to H-ions does not occur until
soil pH is about 3.5. According to McGeorge (1924) the presence of toxic
amounts of aluminum in many Hawaiian soils was indicated by chemical
analysis. Nondiffusible colloidal aluminum hydroxides was shown to be
harmful when in contact with plant roots (McLean and Gilbert, 1927; Trenel
and Alten, 1934).
Application of lime to acid soils increases the exchangeable calcium
and decreases the extractable aluminum in soils (Rixon, 1962; Rixon and
Sherman, 1961).

MATERIALS AND METHODS
Soils studied
Seven surface soils representing six gre3t soil groups, were used
in one or more of the studies reported here. The soils are described in
the following paragraphs and some pertinent data concerning their prop-
erties are given in Table I.
Hilo series. Soils from the Hilo, series belong to the Hydrol Humic
Latosol great soil group. The soil material representing this series
was collected from the Island of Hawaii. Soils of the Hilo series are
derived from volcanic ash and have low bulk density. The soil occurs
below an elevation of 1000 feet. In this zone, average annual precipi.-
tation ranges from 125 to 160 inches. Soils of the Hilo series often
contain 200-300% moisture in the field. The soil material consists of
clay sized minerals WhlCh are amorphous to X-ray and according to
Sherman (1952) is relatively rich in iron and aluminum oxides. A striking
characteristic of this soil material is that it dries irreversibly, and
this dehydration causes crystallization of the amorpho:ls portion (Sherman.'
1957). Dehydration, induced by extended sun-drying or by short periods
oin an oven at 105 C., reduces the cation ex~hange capacity of this soil
(Kanehiro and Sherman, 1956). The pH of the soil samples used in the ex-
periment was 3.8, a lower pH value chan normally expected from this soil
series. The soil material was collected from an uncultivated area. The
plant cover included staghorn ferns which may account for the unusually
low soil pH (Sherman and Kanehiro, 1946-48). The low soil pH value may
also be attributed to partial crystallization of the amorphous material
(Sherman, personal cornrnuni~ation), which may have taken place even though
soil material at all time retained considerable amounts of moisture.

TABLE 10 CHEMICAL CHARACTERISTICS OF SEVEN HAWAIIAN SOILS BELONGING TO SIX GREAT SOIL GROUPS
Hila (ovenProperty Measured Hila dry Soil Series
(moist) basis) Kapaa Halii Molokai Koko Lualualei Pauwela
pH (H2O) 3.8 - 4.8 5.3 7.0 7.0 7.8 5.0
pH (KCl) 3.9 - 4.4 4.2 6.2 6.4 6.9 4.2
Surface phosphorus (ppm)* 29.9 70.5 113.9 35.4 33.7 296.3 30.8 -13.6...!.1
Phosphorus in soil solution (ppm.) 0.004 - 0.02 0.09 0.05 2.36 3.82 0.08
H2S04 -extractable soil P (ppm.)* 2.5 5.9 3.7 4.4 10.4 201. 5 966.2 2.5
Extractable (BaC1?) ali~num
(me./lOO g. soil)* 4.76 11.23 3.28 2.99 0.38 0.12 0.10 1. 79
Extractable (N~OAc-BaC12) aluminum(me./lOO g. soil)* 6.25 14.75 10.40 3.91 0.09 0.09 0.07 1.95
Aluminum in soil solution (ppm.) 4.37 - 0.06 0.35 0.02 O.O~ 0009 0.36
Cation exchange capacity(me./lOO g. soil) 28 65 29 22 16 52 42 18
*All values are expressed on oven-dry soil basis.
1JMore fertilizer phosphorus was present (p32 counting) than was estimated as total by chemical means.It is suggested then that phosphorus may have precipitated from the soil extract after p32 counting~nd prior to chemical analysis.
No

2i
There is also a possibility that the soil series is Akaka; but, even so,
the pH is abnormally low.
Kapaa series. The Kapaa soil series is a very deep~ well drained
Aluminous Ferruginous Latosol developed in saprolitic ferruginous bauxite
on gently sloping uplands on the Island of Kauai. The soil occurs on
lower mountain slopes between elevations of about 200 and 1000 feet. Mean
annual rainfall ranges from 60 to 100 inches. Soils of this series have
high concentrations of gibbsite (X-ray analysis) ~ the trihydrate oxide of
aluminum.
Ha1ii series. Soils in the Ha1ii series~ a member of the Hono1ua
family of the Aluminous Ferruginous Latosol great soil group are described
by Sherman et~. (1962). Soils in this series are derived from a parent
material consisting of basalt. Soils collected were from the eastern side
of Kauai. Soils in this series occur at altitudes from 300 to 1000 feet.
Annual rainfall varies from 70 to 150 inches. Pea-sized nodules~ possibly
consisting of iron oxide or iron-oxide coated aggregates, were common
throughout the surface. X-ray analysis showed that these soils have
gibbsite and goethite and other iron or titanium oxides as important
minerals.
pauwela series. Soils from the Pauwela series were collected from
the wettest part of an area of Humic Ferruginous Latoso1s on the Island
of Maui. The parE!nt material of this soil series is a basalt. Soils of
the Pauwela series occur at elevations from sea level to 1500 feet. Mean
annual rainfall ranges from 80 to 150 inches. The dominant minerals in
this soil series are oxides of iron~ titanium~ and aluminum.
Mo10kai series. The soils belonging to the Mo10kai series are f.rom
the Low Humic Latosol great soil group. Soils of this series have devel-
22
oped on a basaltic material in a semiarid to subhumid climate of subtropical
regions having a pronounced dry period (Sherman and Alexander, 1959).
Soil material from this series was collected from the Island of Oahu. The
soil colloids are mainly Kaolinitic (1:1 clays). Iron oxides have become
concentrated throughout the solum mainly through the loss of silica and
bases.
Koko series. Soils from the Koko series belong to the Red Desert
great soil group. Soil material from this series was collected from the
vicinity of Koko Head on the Island of Oahu. The parent material of this
soil series is of alluvial material that has been washed from deposits of
volcanic ash and cinders. Soils are found from sea level to an elevation
of 200 feet in areas with a mean annual precipitation of 10 to 20 inches.
The dominant minerals in this soil series consist of 2:1 clays.
Lualualei series> Soils from the Lualualei series belong to the
Dark Magnesium Clay great soil group, and were collected from the
Lualualei Valley on the Island of Oahu. These soils resemble the "Regur"
or "Black cotton soils" of India and liB lack Earths" of Australia in their
physical and chemical characteristics. Soils in this series are derived
from alluvial parent material. These soils are found at elevations of
less than 250 feet and receive an annual rainfall of 15 to 25 inches.
X-ray analysis showed that the dominant minerals are of 2:1 type (mont
morillonite).
X-ray analyses. The dominant minerals present in the seven surface
soils used in various study were determined by X-ray diffraction on
powdered samples, using copper radiation and a nickel filter.

23
Experiment I. The availability of fertilizer phosphorus in relation to
various rates and isotopes (p3l and p32) of phosphorus in three Latosols
of Hawaii
Greenhouse study. Sudan grass (Sorghum vulgare var. sudanense),
Cali.fornia No. 23, was grown. from seeds, in a container consisting of two
waxed paper cartons, a bottomless one telescoped within the other. The
container was filled with vermiculite to within one-half inch of the top.
After 2 weeks, the plants were thinned to 15 per container. All of the
nutrient elements (macro and micro) other than phosphorus were supplied
uniformly to all treatments. Moisture was supplied uniformly to all pots.
At the end of 2 weeks, plants were beginning to show symptoms of phosphorus
deficiency. During this period, a thick pad of roots was formed underneath
the top carton.
Phosphorus was applied at three rates, viz. 0, 87.5, and 175 pounds
of P per acre, on a surface area basis, to the soil materials from the
Kapaa, Molokai, and Pauwela series. These rates are roughly equivalent to
0, 90, and 180 milligrams of P per 100 grams of air-dried soil (all three
soils had almost the same moisture content). Sodium pyrophosphate as
31 32Na4P2 07 and as Na4P2 07 was used as a source of phosphorus. Treatments
were replicated four times. At the end of 3 weeks) the Sudan grass seed-
lings growing in the vermiculite culture were transferred to cartons con-
taining soil with the various phosphorus treatments. Plants were kept in
contact with the soils and allowed to grow in them for 5 days. One set of
plants was grown in the vermiculite culture for the entire experimental
period (26 days), in order to ascertain the extent to which phosphorus
could be supplied by seeds and vermiculite. This short-term plant-growth

2~
extraction method was suggested by Stanford and DeMent (1957). This
extraction technique has the advantage of minimizing nutritional and
plant-growth side effects, When the plants were 26 days old they were
harvested close to the surface of the vermiculite, dried in an oven at
70P C., weighed, and ground in a Wiley Mill for chemical and radio-chemical
analyses.
Chemical and radio-chemical analyses. One gram of plant material was
digested in perchloric-nitric acid mixture, and total phosphorus determined
colorimetrically as molybdivanadophosphoric acid as described by Kitson
and Mellon (1944). The amount of plant phosphorus derived from the
fertilizer was determined by end window jB counting of aliquots (50;Ug. P)
of evaporated plant digest.
Experiment II. The availability of phosphorus, and utilization of phos
phate fertilizers added to four great soil groups of Hawaii as influenced
by sources and methods of phosphorus application
Design of experiment. The following variables were incorporated into
a factorial design. Four soils three sources of phosphate fertilizers:
and two methodr, of application. The treatments were replicated six times,
In addition to these variables four check pots (without phosphorus treat
ment) were included for each soil and for each source of phosphate fer
tilizer. The pots were arranged as randomized blocks.
Test crop. Sugar cane which is the principal crop in Hawaii and well
adapted in most of these soils was used as an indicator plant. The variety
50-7209 which is quite popular in the plantations in Hawaii, was used for
the experiment.
Potting soils. Twelve pound lots of air dried soil material (these
soils had similar moisture content) from the soil series of the Kapaa,

25
Lualualei, Molokai, and Pauwela, were weighed separately in plastic
wastebaskets. These baskets had a diameter of 8.25 inches and were about
11 inches deep. Two small outlets were drilled near the bottom at the
side of each pot.
Phosphorus sources. Phosphate fertilizers tagged with p32 as mono
ammonium dihydrogen phosphate, potassium pyrophosphate; and boneash
concentrated superphosphate with the same particle size and with the same
specific activity (0.20 mc/0.44 g. of P) were obtained from the Plant
Industry Station; Beltsville; Maryland. These three fertilizer materials
were received one week apart.
Rates and methods of phosphorus application. Phosphorus was supplied
at the rate of 175 pounds P/acre on a surface area basis to the experi
mental soils. This rate was approximately equivalent to 675 milligrams
of P/12 pounds of air-dried soil material (124 ppm. P on air-dry soil
basis).
Phosphorus was supplied by two different methods. In one series
phosphate fertilizer was mixed thoroughly with the soil material in an
electric blender and in another series test plants were grown for one
month in soils without phosphorus treatment, then the upper parts of the
plants were sprayed with phosphate fertilizer with a fine atomizer. Both
upper and lower surfaces of the leaves were sprayed as uniformly as pos
sible. Where phosphorus was supplied to soils, it was applied in one
installment (175 lbs. P/acre). The foliar application was divided into
four equal applications (44 lbs. P/acre in each spraying).
Seed treatments and plantings. Since the fertilizer materials were
received at one week interv81s, plantings were also made at one week
intervals. Sugar cane seed pieces were obtained from the Genetics Depart-

26
ment of the Hawaiian Sugar Planters' Association Experiment Station. These
seed pieces were cut into "one eye pieces" each consisting of one node
with 1 inch length on each side of the eye. Seed pieces were then treated
with dilute (1:1600) phenol mercuric acetate (PMA) solution at 500 C. in
order to control seed-borne diseases and to enhance germination. Two
one-eye seed ~ieces were then planted in the soils at about 2 inches deep
and 2 inches apart. The first planting was done in soils in the series of
ammonium phosphate treatments on February 24, 1961. A week later i.e. on
March 3, sugar cane was planted in the series of potassium pyrophosphate
treatments. The final planting was that in the series of concentrated
superphosphate treatments on March 10.
Nutrient elements and moisture supply. All the nutrient elements
(macro and micro) other than phosphorus were supplied to the soil after
the planting. Excess N or K in the NH4H2P3204 and K4P1207 were balanced
in other treatments to avoid effects due to nitrogen and potassium. One
gram of Nand 1 gram of P were supplied subsequently in each additional
month of plant growth. Moisture was maintained at uniform levels in soils
throughout the growing period.
Foliar spray. A month after the planting, the first series of plant
tops were sprayed with a solution NH4H2P3204' The spraying solution was
mixed with a minute quantity of commercial detergent IDreft'. The final
solution had a pH value of 3.8. Plant tops were sprayed at the rate of
44 pounds pi acre or 169 milligrams p/pot (2 plants). Three additional
foliar applications, identical with the first, were carried out at 3 week
intervals. Similarly, in two other series of plants, phosphorus was
sprayed with the same level of P and intervals with two other fertilizer
27
materials. Potassium pyrophosphate (K4P~207) solution had a pH value of
11.25 and concentrated superphosphate (p32) dissolved in 10% citric acid
had a pH value of 2.35. The plants treated with potassium pyrophosphateI
showed definite physiological burning effects over all the leaves and
stems. The subsequent sprayings with K4P~207 were carried out after the
pH was adjusted to 5.3 with IN RN03
. Plants? grown in this series, re
covered from the injury due to physiological burning within 2 weeks and
did not show any further symptoms of burning.
Harvesting. Plants were harvested close to the soil surface after 3
months of plant growth, cleaned with dilute detergent 'Dreft ' , and washed
thoroughly with water. These precautions were taken so that residual
phosphorus still adhering to the leaf and stem surface was removed.
Plant samples were dried in an oven at 700 C., weighed~ and ground in a
Wiley Mill for chemical and radiochemical analyses.
Chemical and radiochemical analyses. The procedures followed for
chemical and radiochemical analyses were the same as those described in
the previous experiment (experiment I); except that a 2 gram sample of
plant material was digested.
Aluminum in the plant digest was determined colorimetrically after
reaction with aluminon. Thioglycollic acid was added to prevent inter-
ference from iron (Chenery, 1948b). Optical density was measured with a
Coleman Junior Spectrophotometer at 525 ~ wavelength,
Experiment III. Phosphorus solubility and availability to plants and
aluminum status of plants and soils as influenced by liming
It is commonly believed that the influence of lime on phosphorus
availability depends largely on its effect on the solubility of aluminum

28
at the time of phosphorus application. An experiment was conducted to
determine the solubility of aluminum and availability of phosphorus to
crops as influenced by various times of lime and phosphorus application
in six Hawaiian soils.
Greenhouse study. Soil materials from Hila, Kapaa, Halii, Molokai,
Koko, and Lualualei soil series were used in this study. The first three
soils were acidic and the other three were neutral to basic in reaction
as previously described.
These soil materials were treated with lime and/or with phosphorus
fertilizer. Three lime treatments for the acid soils (Hila, Kapaa, and
Halii soil series) were as follows: "No lime ,II Illimed early" (42 days
before root-soil contact), and Illimed late" (just before root-soil con-
tact). The phosphorus treatments, superimposed upon the lime treatments
were as follows: "Earlyll (applied 36 days before root-soil contact),
"Intermediate ll (applied 14 days before root-soil contact), and IlLate ll
(applied immediately before root-soil contact). All lime treatments re-
ceived Ca(OH)2 to increase the pH value of the soil to about 6.0. Phos
phorus LP32 labeled Ca(H2P04)2-1 was applied in solution, at 44 ppm. P as
oven dry soil basis (except for Hila which was on moist soil basis), and
thoroughly mixed with the soil material.
The method of Stanford and DeMent (1957) was used to extract P from
the soils. In this series of studies, plants were initially grown in
sand culture instead of the vermiculite culture used in the former ex-
periment. Sudan grass of the variety California No. 23, and Koa haole
(Leucaena glaucal/ Benth.) were used as indicator plants. Root-soil
l/Originally described as Leucaena leucocephala.
29
contact was for 4 days. Following the 4 day extraction period, root pads
were removed from the soil and soil samples for each treatment were com-
posited to give two 600 gram samples of soil. These soils were repotted
and seeded to Sudan grass which grew for a period of 21 days. Following
the harvest of Sudan grass, Koa haole (1. glauca) seeds were SO'WTI in the
same soils and grown for 24 days, after which the plants were harvested
above the cotyledons. All of the plant samples were then dried in an oven
oat 70 C., weighed, and ground in a Wiley Mill for chemical and radio-
chemical analyses.
Plant ashing. Plant material (0.25 to 0.30 g. in each case) was
ignited with alcoholic magnesium nitrate in a silica crucible, and ashed
for 12 to 16 hours in a muffle furnace. These plant ash samples were
dissolved with either 10 mI. of IN HCl or 20 mI. of 0.5N HCl depending
upon the amount of plant material and estimated radioactivity.
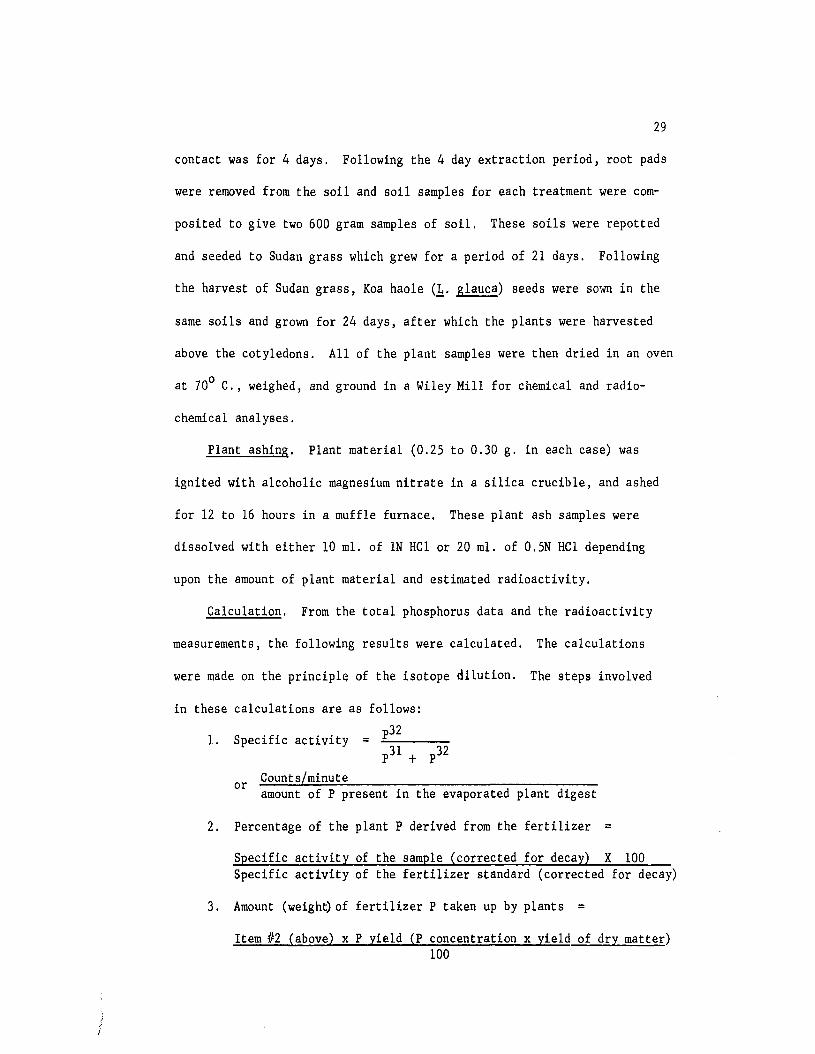
Calculation. From the total phosphorus data and the radioactivity
measurements, the following results were calculated. The calculations
were made on the principle of the isotope dilution. The steps involved
in these calculations are as follows:
1. Specific activity
Counts/minuteoramount of P present in the evaporated plant digest
2. Percentage of the plant P derived from the fertilizer =
Specific activity of the sample (corrected for decay) X 100Specific activity of the fertilizer standard (corrected for decay)
3. Amount (weigh~ of fertilizer P taken up by plants =
Item #2 (above) x P yield (P concentration x yield of dry matter)100

30
4. Percent utilization of added phosphorus =
Amount (wt.) of fertilizer P taken up by plants X 100Milligrams of P added as fertilizer
5. 'A' value (available soil P in relation of added phosphatefertilizer) =
(Fried and Dean 1952)B (1-y)
A = ------------y
Where A = the amount of soil phosphorus supply
B = the amount of fertilizer phosphorus supply
y = fraction of the phosphorus in the plant derived fromthe fertilizer
Analytical procedures for soil analyses
Samples of the original soil materials were analyzed for pH; cation
exchange capacity, extractable (H20) IN BaC12 and IN NH40 Ac -0.2N BaC1 2
mixture) aluminum phosphorus fixation capacities, surface phosphorus,
extractable (H20 and 0.02N H2S04) phosphorus. Samples of soil material
collected from the pots after harvest were composited to determine pH and
extractable (0.02N H2S04) soil phosphorus. The analytical procedures
mentioned above are described briefly in the following paragraphs.
Soil pH was determined in aLl, soil.:water mixture and in a I 2, IN
KCI mixture by using Beckman pH meter. Cation exchange capacity was
measured using normal ammonium acetate, adjusted to pH 7 O. as described
by Piper (1944). Aluminum was extracted with three extracti.ng solutions
i.e. with H20, IN BaC12 and N NH40 Ac -0.2N BaClZ mixture.
Water soluble aluminum. Weigh out 10 grams of air dried soil in a
150 mI. beaker; add 50 mI. of water. allow to stand overnight.
Filter with Whatman filter paper No. 42.
Pipette 10 mI. aliquot into a 150 mI. beaker for Al determination.
31
Extractable aluminum. Weigh out 10 grams of air dried soil in a
150 mI. beaker, add 50 mI. of extracting solution (IN BaC12 or N NH40 Ac
-0.2N BaC12 mixture buffered to pH 4.8), allow to stand overnight.
Filter it through Whatman filter paper No. 42 and wash the soil
with 10 mI. lot,of extracting solution.
Transfer the filtrate to a 100 mI. volumetric flask and make up to
the volume.
Pipette 1 mI. aliquot from the volumetric flask into a 150 mI. beaker
for aluminum determination.
Aluminum, extracted with three extractants (H20, BaC12 and NH40 Ac
BaC12 mixture), was determined calorimetrically using aluminon and adding
thioglycollic acid as an agent to prevent interference by iron as des
cribed by Chenery (1948b).
Phosphorus fixation studies. The fixation of phosphorus by the
experimental soils was measured by shaking soil samples in 4.4 ppm. P
(monocalcium phosphate) solutions labeled with p32 (soil: solution, 1;10).
followed by centrifuging for 45 minutes at about 20,000 X G, and then by
;d counting an evaporated aliquot of~the supernatent liquid. Determi
nations were made after equilibrating for various lengths of time.
Surface phosphorus of these soils was calculated, using the phosphorus
fixation data together with total phosphorus determined colorimetrically.
In addition to phosphorus material, different levels of lime were also
applied to the four acid soils (Hila, Kapaa, Halii, and Pauwela soil
series) for the purpose of studying the effect of liming on pH, aluminum
status, and immobilization of added phosphorus,
Statistical analyses. Experimental data, such as yield of dry matter,
phosphorus concentration, phosphorus yield, percent of the plant P derived

32
from fertilizer, percent utilization of added phosphorus; were analyzed
stat',istically by the method of "analysis of variance" with randomized
block design in factorial combinations. The IF' values, significant
statistically were subjected to Duncan's new (1955) multiple range test.
Correlations and regressions were computed wherever it was felt helpful
for presentation and discussion of the data.
,J

RESULTS AND DISCUSSION
Experiment I. (Results). Availability of fertilizer phosphorus in
relation to various rates and isotopes of phosphorus
A short-term plant growth method was used in order to ascertain the
availability of phosphorus to plants in relation to three rates and two
31 32 .isotopes (P and P ) of phosphorus. Sudan grass was grown as a test
crop.
Results from the plant yields from the five-day root-soil contact;.
showed that the application of phosphorus to the Kapaa soil increased dry
matter as compared to the treatment lacking phosphorus. However, these
differences were not significant. Yield of plants placed in contact with
Kapaa soil was apparently lower than yield of plants which was grown en-
tirely in the vermiculite culture. In general~plant yields from Sudan
grass did not vary signif:lcantly (statistically) with the two isotopes
used or with the three rates of P application (Table II).
Mean data from the plant yields are as follows:
SoilKapaa Pauwela Molokai
Sudan grass yields(g. dry matter/pot)
1.74 1.86 1.90
,j
Application of phosphorus to the three soils increased phosphorus concen-
tration and phosphorus yield in Sudan grass (Table II). The differences
between phosphorus yield due to rates and those due to soils were highly
significant.
Sodium pyrophosphate either applied as p3l or as p32 did not change
P yields significantly.

TABLE II. THE INFLUENCE OF TWO ISOTOPES OF PHOSPHORUS (p31 AND p 32 ) AND RATESOF PHOSPHORUS APPLICATION ON SUDAN GRASS YIELD AND PHOSPHORUS UPTAKE, AND
THE PHOSPHORUS STATUS AND pH OF THE SOILS AFTER HARVEST
Rates of P Plant P ExtractablePhosphorus application, Yield of Plant P P yield Utili- derived (0.02N H2SO4) pH inisotopes (surface area dry matter in the in plants zation of from the P in soils soils
basis) (g./pot) dry matter (mgs./pot) added P fertilizer after harvest after(los. P!acre) (%) (%) (%) (ppm. ) harvest
n~ne 0 1.20 0.030 0.48 - - 7 5.23p 1 87.5 1.84 0.053 0.99 - - 216 6.30p32 87.5 1.80 0.045 0.81 0.071 7.06 194 6.35p31 175 1.85 0.064 1.20 - - 355 6.38p32 175 1.82 0.074 1.33 0.200 27.41 277 6.59
n~ne 0 1.93 0.030 0.59 - - 21 6.58P 1 87.5 2.02 0.075 1. 55 - - 665 7.36p 32 87.5 1. 72 0.077 1. 31 0.493 34.02 647 7.28p31 175 2.00 0.062 1.23 - - 1239 7.43p32 175 1.86 0.078 1.46 0.641 79.29 1150 7.83
none 0 1. 79 0.036 0.64 - - 6 5.06p 31 87.5 1.82 0.048 0.86 - - 133 6.24p32 87.5 1.89 0.075 1.43 0.286 17.98 129 6.16p31 175 1.89 0.079 1.49 - - 374 6.74p32 175 1.94 0.098 1.89 0.214 17.76 344 6.86
enone 1.84 0.054 1.00
w~
35
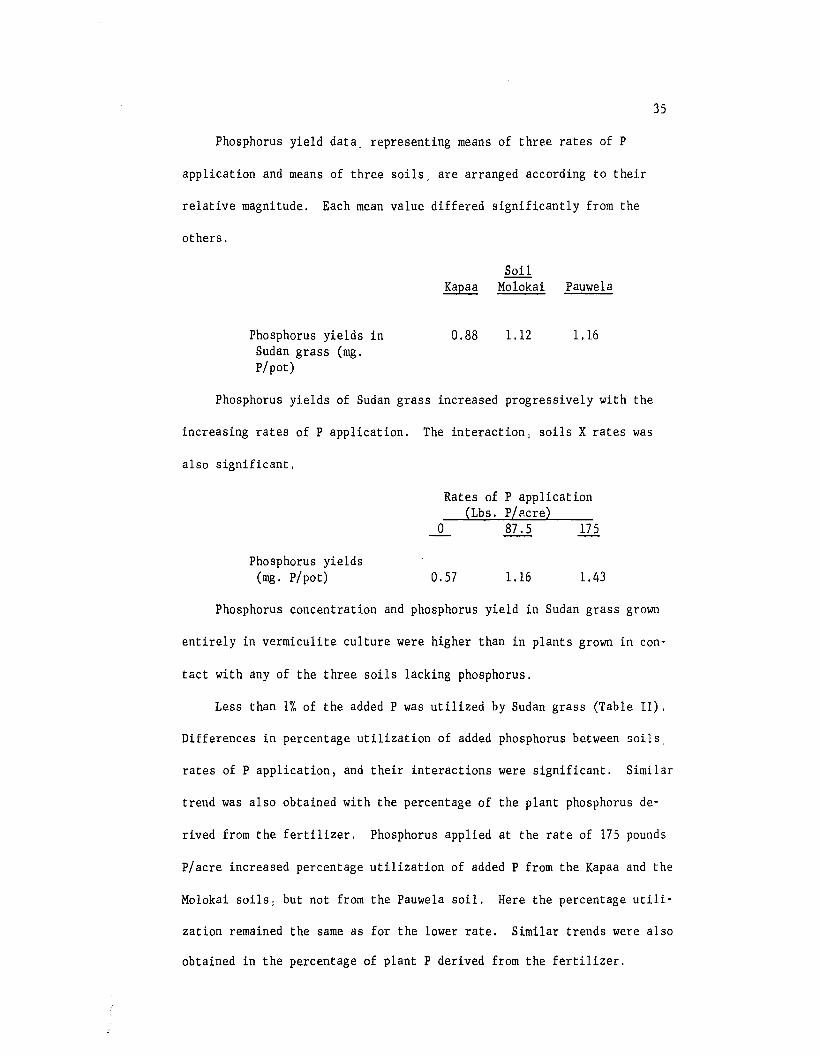
Phosphorus yield data. representing means of three rates of P
application and means of three soils, are arranged according to their
relative magnitude. Each mean value differed significantly from the
others.
SoilKapaa Molokai Pauwela
Phosphorus yields inSudan grass (mg.p/pot)
0.88 1.12 1.16
Phosphorus yields of Sudan grass increased progressively with the
increasing rates of P application. The interaction, soils X rates was
also significant.
Rates of P application(Lbs. pI?cre)
o 87.5 175
Phosphorus yields(rng. p/pot) 0.57 1.16 1.43
Phosphorus concentration and phosphorus yield in Sudan grass grown
entirely in vermiculite culture were higher than in plants grown in con-
tact with any of the three soils lacking phosphorus,
Less than 1% of the added P was utilized by Sudan grass (Table II).
Differences in percentage utilization of added phosphorus between soils
rates of P application, and their interactions were significant. Similar
trend was also obtained with the percentage of the plant phosphorus de-
rived from the fertilizer. Phosphorus applied at the rate of 175 pounds
pi acre increased percentage utilization of added P from the Kapaa and the
Molokai soils, but not from the Pauwela soil. Here the percentage utili-
zation remained the same as for the lower rate. Similar trends were also
obtained in the percentage of plant P derived from the fertilizer.
36
After harvest, the amount of extractable (0.02N H2S04) phosphorus
and pH values increased with increased rates of phosphorus application
(Table II).
Discussion (Experiment I). Application of phosphorus to Kapaa soil
increased Sudan grass yields. Increased plant yields from the Kapaa soil
were associated with increased phosphorus content in plants supplied by
fertilizer. In general, addition of phosphorus did not make any dif
ference to the plant yields. For a 5-day root-soil contact it seems
rather difficult to obtain any plant yield response due to the added
phosphorus. Furthermore, the phosphorus fixation process is very rapid
in some soils and rates higher than 175 pounds P/acre may be needed in
order to obtain response due to the added phosphorus. Responses due to
higher rates (more than 175 pounds P/acre) of phosphorus may be possible
since there is evidence which has shown that bauxitic soils responded to
phosphorus even at the rate of 1200 pounds P/acre (Younge, 1962). More
over, the amount of extractable soil phosphorus was very low in the Kapaa
soil (Table I) and higher rates of P application may be desirable because
percent recovery of fertilizer phosphorus is generally low in the Kapaa
soil.
Increases in phosphorus concentrations and phosphorus yields in
Sudan grass may be explained on the basis of phosphorus status in plants
before root-soil contact. Plants growing in vermiculite culture lacking
phosphorus treatments for 2 1/2 weeks showed definite symptoms of phos
phorus deficiency. Before root-soil contact, the root system of Sudan
grass was extensive. This enabled the plants to take up a considerable
amount of phosphorus within the 5-day root-soil contact. The higher the
37
rate of phosphorus application the higher were the phosphorus yields in
Sudan grass. It seems possible that even higher phosphorus yields may be
obtainable with higher rates than 175 pounds P/acre.
Phosphorus yields were least in plants grown in the Kapaa soil and
highest in plants grown in the Pauwela soil. The differences between
phosphorus yield in plants grown in Kapaa soil and plants grown in
Molokai and Pauwela soils were generally large. This may be on account
of higher rates of immobilization of added phosphorus in the Kapaa soil
as compared to the Molokai and the Pauwela soils (Figure 27).
Phosphorus concentration and phosphorus yield in Sudan grass grown
entirely in vermiculite culture were higher than in plants grown in
contact with soils lacking phosphorus. It is possible that the test
plants may have lost some of the seed and vermiculite phosphorus to the
soil; or the phosphorus may have moved from the upper plant parts into
the newly formed roots. These results were obtained for short-term ex
tractions of phosphorus; it is possible that results would be different
if obtained over a longer extraction time.
Less than 1% of the fertilizer P was utilized by plants. Low utili
zation of added phosphorus may be explained by the short period of root
soil contact and the extremely higher rates of phosphorus application (90
and 180 milligrams P per 100 grams of soil).
After harvest, the increase in extractable phosphorus in all three
soils lacking phosphorus treatment may be on account of the rise in pH
values (Kapaa and Pauwela soils) or the greater mobility of soil phosphorus
on account of the profuse root system,
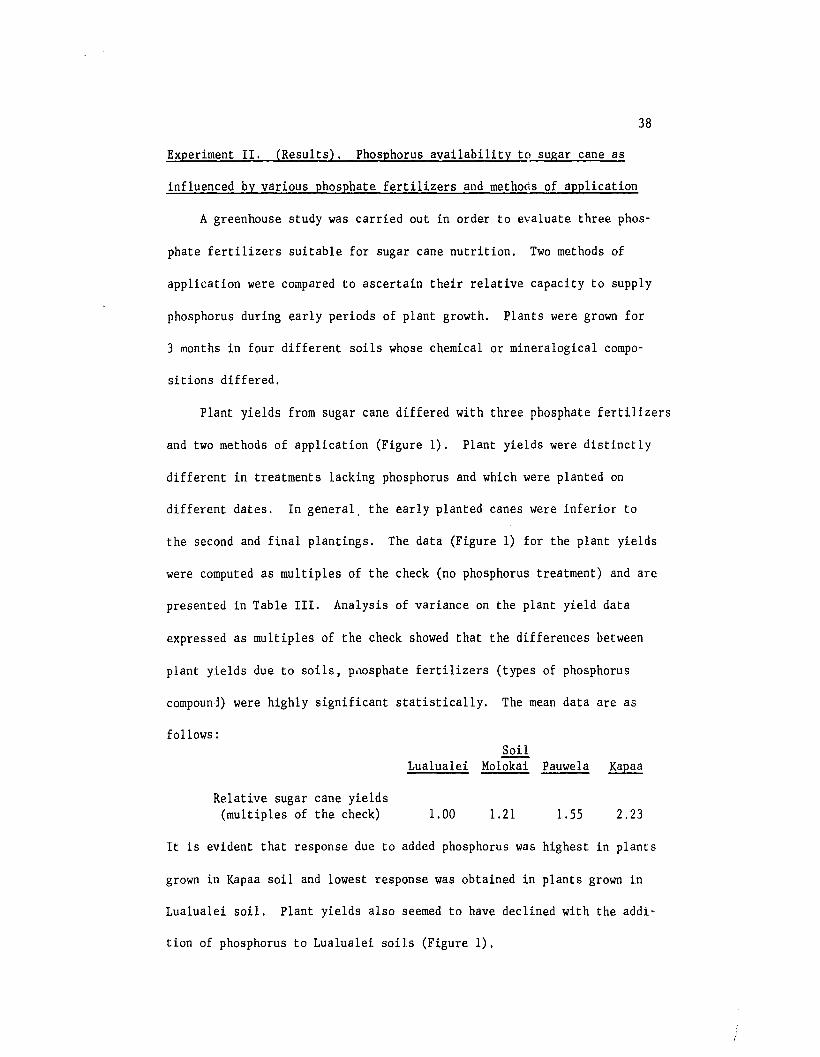
38
Experiment II. (Results), Phosphorus availability to sugar cane as
influenced by various phosphate fertilizers and methods of application
A greenhouse study was carried out in order to evaluate three phos-
phate fertilizers suitable for sugar cane nutrition. Two methods of
application were compared to ascertain their relative capacity to supply
phosphorus during early periods of plant growth. Plants were grown for
3 months in four different soils whose chemical or mineralogical compo-
sitions differed.
Plant yields from sugar cane differed with three phosphate fertilizers
and two methods of application (Figure 1). Plant yields were disti.nctly
different in treatments lacking phosphorus and which were planted on
different dates. In general, the early planted canes were inferior to
the second and final plantings. The data (Figure 1) for the plant yields
were computed as multiples of the check (no phosphorus treatment) and are
presented in Table III. Analysis of variance on the plant yield data
expressed as multiples of the check showed that the differences between
plant yields due to soils, pliosphate fertilizers (types of phosphorus
compounj) were highly significant statistically. The mean data are as
follows:Soil
Lualualei Molokai Pauwela Kapaa
Relative sugar cane yields(multiples of the check) 1.00 1. 21 1.55 2.23
It is evident that response due to added phosphorus was highest in plants
grown in Kapaa soil and lowest response was obtained in plants grown i.n
Lualualei soil. Plant yields also seemed to have declined with the addi·
tion of phosphorus to Lualualei soils (Figure 1).

lUlU CUE IIIIOW. '011I THllIU MONTHI
39
I•Q
~ ,,-
0 .....~1Ol.""'''''''1OlII• '(lUiII UfUtU,OII
. ~
FIGURE 1. INFLUENCE OF VARIOUS PHOSPHATE FERTILIZERS AND METHODS OFPHOSPHORUS APPLICATION ON PLANT YIELDS (GRAMS DRY MATTER/POT).
SUGAR CANE GROWN IN POTS FOR 3 MONTHS IN FOURDIFFERENT SOILS

40
TABLE III. YIELD OF SUGAR CANE AS INFLUENCED BY VARIOUS PHOSPHATEFERTILIZERS AND METHODS OF PHOSPHORUS APPLICATION EXPRESSED
AS MULTIPLES OF THE CHECK (NO P). PLANrS WERE GROWNIN POTS FOR 3 MONTHS
Phosphate fertilizers usedSoil Methods of P NH4H2P04 K4P207 Concentrated
application superphosphateMultiples Multiples Multiples
of the check of the check of the check
Kapaa SOlI application 2.19 2.44 1.97Foliar application 2.64 2.21 1.94
Lualualei Soil application 0.93 0.95 0.85Foliar application 1.22 1.00 1.07
Molokai Soil application 1.28 1.27 0.99Foliar application 1.28 1.37 1.06
Pauwela Soil application 2.31 1.50 1.12Foliar application 1.13 1.46 1.05
Sugar cane yields associated with three phosphate fertilizers are as
follows;Phosphate fertilizers usedCone.
superphosphate K4P207 NH4H2P04
Relative sugar cane yields(multiples of the check) 1.26 1.52 1.71
The mean data from each of the four soils and three phosphate fer-
tilizers significantly differed from those of the others.
In general; plants grown in all the four soils) fertilized with
NH4H2P04, appeared to be less healthy as compared to cane plants grown
in the same soils with the other two phosphate fertilizers. Poor growth
has also been noticed by Clements (personal communication) in some cane
fields treated with ammonium phosphate.

41
The interactions, sails X sources of phosphate fertilizers, soils X
methods of application) and soils X sources of fertilizers Xmethods of
application,were highly signifi~1nt.
Two methods of phosphorus application i.e. phosphorus applled to the
soil or sprayed to cane plants did not make any significant difference on
plant yields.
The treatments and their results on phosphorus concentration (percent
of the dry matter) in sugar cane are shown in Figure 2. Similar data
when computed as multiples of the che~k are shown in Table IV.
The differences between phosphorus concentrations (multiples of the
check) in sugar cane plants due to soils) sources of fertilizers, methods
of application and their first and second order interactions were highly
significant.
Means of P yield from the main effects are as follows:
SoilLualualei Molokai pauwe1a Kapaa
Relative phosphorusconcentration in sugarcane tops (multiplesof the check)
1.48 2.32 2.80 3.47
Mean values of the relative phosphorus ::oncentrations resulting from
the use of three phosphate fertilizers are as follows:
Phosphate fertilizers usedCone,
NH4H2P04 Superphosphate K4P207
Relative phosphorusconcentration in sugarcane tops (multiplesof the check)
1.94 2.24 3.36

42
·- .....PlIoIII ~,o
0"""~ lOll
I,..~
- .,• 'OLIAJt 1- CiOM, 'UfO hfOII1Ul(
'"
035 .
i
o JoLi!,
~0151-
; ~ ~
OI'f '" ~ ~~ ~ ~~ ~ ~ ~'" ~ ~
~~ ~~ ~ E'i
~~ l""~ V
I?,,' ~ 1'/ ~ B ~~ B ~ ~~ 1/ t/
~ 1/ B [;~
f7. ~ ~1'/
~ ~ ~
"U~ Ir~~ ~ ~ I....~ ~
~ ~I.... ~ B ~ ~ B 1/ ~ ~~ ~ ~ ~ B~ lL~ [I ~ ~ ~ t/ ~ ~r ~u...~ ~
~ ~ ~ ~ U-~, • I • , I • I
IKAPAA lUAlUALEI WOlOKAI PAUWElA
~
~z<...JQ.
Ul:::la:eJ:Q.UleJ:Q.
...J..leI-
FIGURE 2. INFLUENCE OF VARIOUS PHOSPHATE FERTILIZERS AND METHODSOF PHOSPHORUS APPLICATION ON PHOSPHORUS CONCENTRATION
IN SUGAR CANE TOPS. PLANTS GROWN IN POTSFOR 3 MONTHS IN FOUR DIFFERENT SOILS
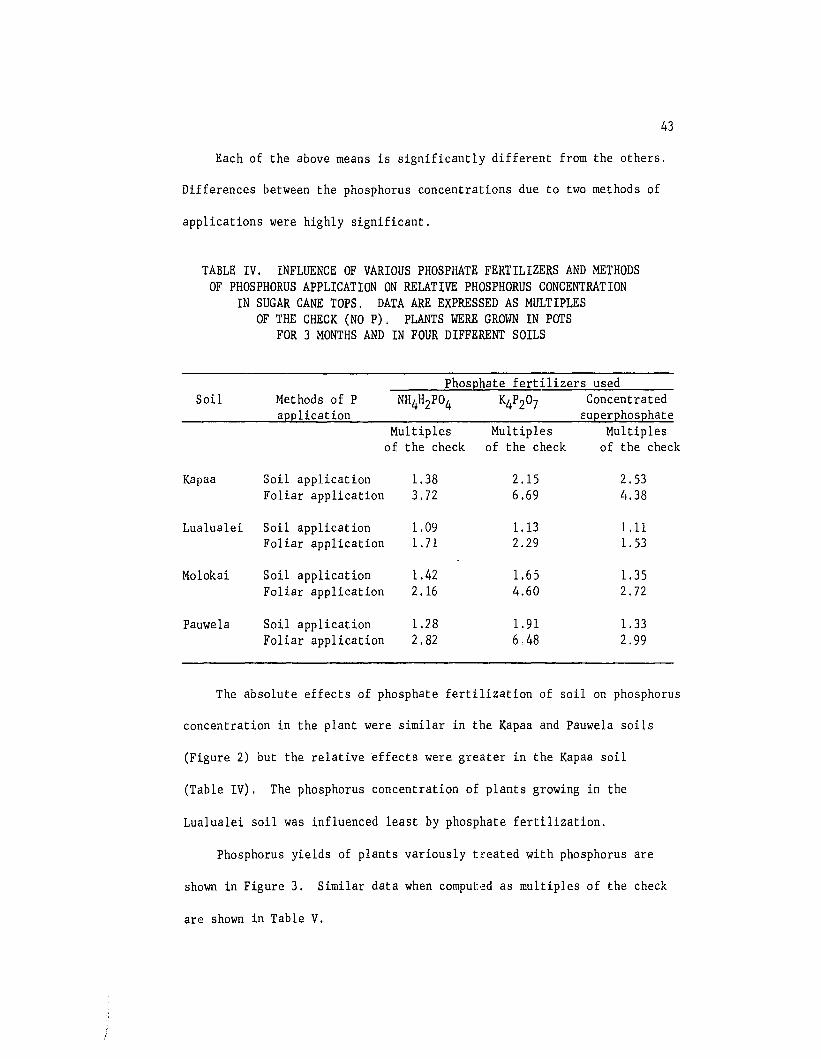
43
Each of the above means is significantly different from the others.
Differences between the phosphorus concentrations due to two methods of
applications were highly significant.
TABLE IV. INFLUENCE OF VARIOUS PHOSPHATE FERTILIZERS AND METHODSOF PHOSPHORUS APPLICATION ON RELATIVE PHOSPHORUS CONCENTRATION
IN SUGAR CANE TOPS. DATA ARE EXPRESSED AS MULTIPLESOF THE CHECK (NO P), PLANTS WERE GROWN IN POTS
FOR 3 MONTHS AND IN FOUR DIFFERENT SOILS
Phosphate fertilizers usedSoil Methods of P NH4H2P04 K4P207 Concentrated
application superphosphateMultiples Multiples Multiples
of the check of the check of the check
Kapaa Soil application 1.38 2.15 2.53Foliar application 3.72 6.69 Lf.38
Lualualei Soil application 1,09 1.13 1.11Foliar application 1.71 2.29 1. 53
Molokai Soil application 1.42 1.65 1. 35Foliar application 2.16 4.60 2.72
Pauwela Soil application 1.28 1. 91 1. 33Foliar application 2.82 6,48 2.99
The absolute effects of phosphate fertilization of soil on phosphorus
concentration in the plant were similar in the Kapaa and Pauwela soils
(Figure 2) but the relative effects were greater in the Kapaa soil
(Table IV). The phosphorus concentration of plants growing in the
Lualualei soil was influenced least by phosphate fertilization.
Phosphorus yields of plants variously treated with phosphorus are
shown in Figure 3. Similar data when computed as multiples of the check
are shown in Table V.
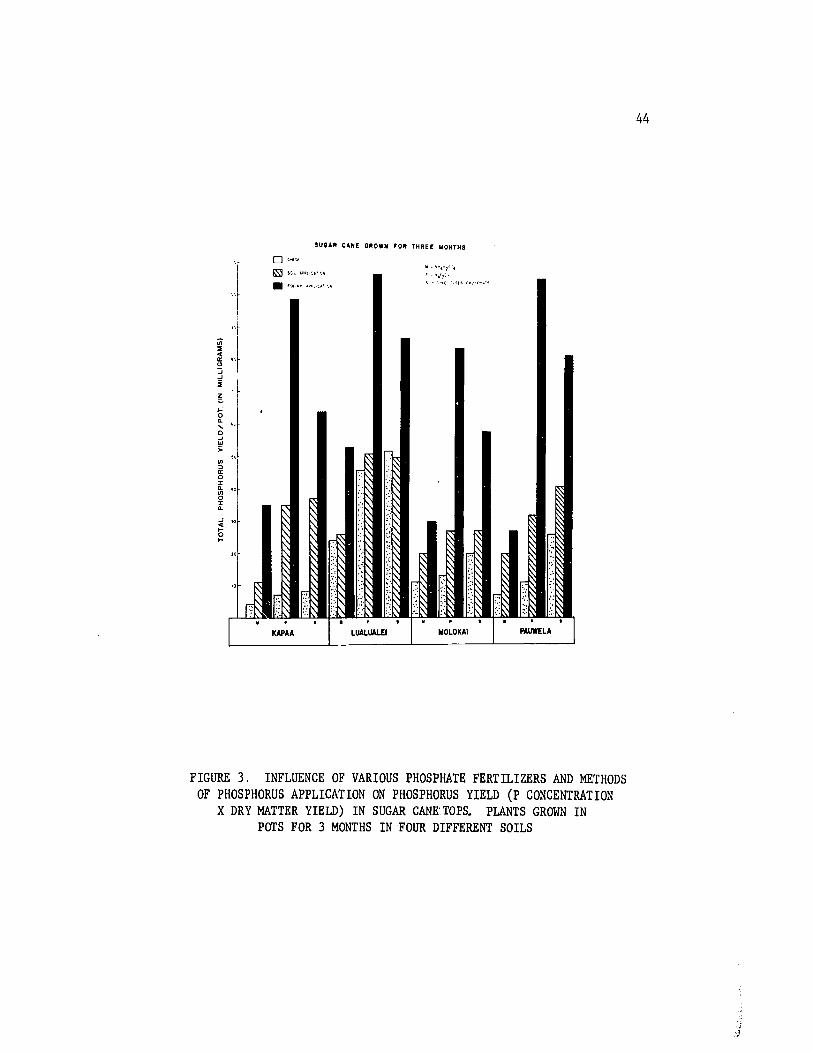
SUGAR CANE GROWN FOR THREE WONTHS
44
IoQ....o-'
'";:(/)
:la:orQ. .,(/)
orQ.
..J "gI-
• p ••- '~."".-
KAPAA LUALUAlEJ
1I _ "., _:'~.
= •••12~·s - ~~ .. c '.If" ...... <~=.,
FIGURE 3. INFLUENCE OF VARIOUS PHOSPHATE FERTILIZERS AND METHODSOF PHOSPHORUS APPLICATION ON PHOSPHORUS YIELD (P CONCENTRATION
X DRY MATTER YIELD) IN SUGAR CANE'TOPS. PLANTS GROWN INPOTS FOR 3 MONTHS IN FOUR DIFFERENT SOILS

45
TABLE V. INFLUENCE OF VARIOUS PHOSPHATE FERTILIZERS AND METHODSOF PHOSPHORUS APPLICATION ON PHOBEROaUS YIELDS (P CONCEN
TRATION X DRY MATTER YIELD). DATA ARE EXPRESSEDAS MULTIPLES OF THE CHECK (NO P). SUGAR CANE
GROWN IN POTS FOR 3 MONTHS AND INFOUR DIFFERENT SOILS
Phosphate fertilizers usedSoil Methods of NH4H2P04 K4P207 Concentrated
P application superphosphateMultiples Multiples Multiples
of the check of the check of the check
Kapaa Soil application 2.90 5.05 4.99Foliar application 8.74 14.21 8.53
Lua1ua1ei Soil application 1.05 1.10 0.97Foliar application 2.16 2.30 1.67
Molokai Soil application 1.82 2.08 1.36Foliar application 2.79 6.51 2.90
Pauwela Soil application 3.n 2.84 1. 54Foliar application 5.64 9.44 3.18
Phosphorus yields) compared to checks were highest in plants grown
in Kapaa soil and lowest in Lua1ua1ei soil. The main effects due to
soils, sources of fertilizers, methods of application and their inter-
actions were highly significant. Duncan's test showed that each mean
value was significantly different from the others. These mean values
are arranged as follows:
SoilLualualei Molokai Pauwela Kapaa
Relative P yields insugar cane (multiplesof the check)
1.54 2.91 4.30
Relative P yields were highest in cane plants grown in the Kapaa
soil and lowest in plants grown in the Lualualei soil.

Phosphate fertilizers usedCone.
Superphosphate NH4H2P04 K4PZOI
Relative P yields insugar cane (multiplesof the check)
3 15 3.52 5,44
The two mean values underscored did not vary significantly from
each other. The above data indicate that relative phosphorus yield of
sugar cane was highest in the plan~grown with K4P207 treatments as com-
pared with the yield from the other two phosphate fertilizers.
Of the three fertilizer materials compared, monoammonium phosphate
was least effective in increasing the phosphorus percentage of the plan~.
This was true for all soils and both methods of application (Figure 4).
However, phosphorus from NH4H2P04, applied as foliar spray, increased up
to fivefold the percentage of plant P derived from fertilizer as compared
to that obtained when the same fertilizer material was applied to the
Kapaa soil (Figure 4). Fertilizer phosphorus in ~ane plants did not vary
to any great extent between soil applications and foliar applications of
K4P207 or concentrated superphosphate. The differences between the pH"
cent age of plant P derived from fertilizer due to soils, sources (ft..r-
tilizer compounds). methods of application and their interactions were
highly significant. Mean values of main effects are as follows~
SoilLualualei Kapaa Pauwela Molokai
Percentage of plantP derived from fertilizer
36.48 42.13 44.57 49.55
The two means underscored indicate that they do not differ signif-
icantly from each other. The following mean data show that plant P

47
,.- ....'0.
D-,- ......,1- .... M'tII .......ft
f:?'J'lX.lAI
,
,~ ~
r/ r/ ~ ~0 1/
~~ V V
r/ V I ~" ~
r/~ ~ I (
~ r/~ ~ '~
" V v ~ /:8 ~/
~V
/~v I ~ ~" ~ ~
/
~~ / :% '/~ ~ ~ / / V '% >;!I / V" ~ ~ ~
/ % ' /
~ " ,'% "~ 1/
~~ /,, 1/
~ 1/ ~~ ~~r ~ ~ 1/ V
~ ~ ~ II~ I i ~1/. • . , I • , • • • •.
KAPAA LUALUALEI MOUlKAI PaUllELA
L- I
"
-'<IoI-
...ot'
~ .a:...o'"~a:
'"o..
FIGURE 4. INFLUENCE OF VARIOUS PHOSPHATE FERTILIZERS AND METHODSOF PHOSPHORUS APPLICATION ON THE PERCENTAGE OF THE PLANT PHOS
PHORUS DERIVED FROM FERTILIZER DURING 3 MONTHS OF SUGARCANE GROWTH IN POTS IN FOUR DIFFERENT SOILS

48
derived from fertilizer was least from the NH4H2P04 and highest from
the concentrated superphosphate:
Phosphate fertilizers usedCone.
NH4H2P04 K4P207 Superphosphate
Percentage of plantP derived fromfertilizer
19.96 52.15 57.44
Plants sprayed with phosphorus solutions contained 20 times more
fertilizer phosphorus than did plants which received the same amount of
fertilizer applied to the Kapaa soil (Figure 5). Percentage utilization
of added phosphorus was only 0.12 from Kapaa soil fertilized with mono-
ammonium phosphate and never exceeded 3.6% for any soil.
Differences between the percentage utilization of added phosphorus
resulting from different phosphate fertilizers, methods of application
and their interactions were highly significant. Uptake of fertilizer
phosphorus by plants from the four soils did not vary significantly.
However uptake of fertilizer phosphorus from the Kapaa soil was con-
sistently low. The mean data from the statistically significant main
effects are as follows:
Phosphate fertilizers usedCone.
NH4H2P04 Superphosphate K4P207
Percentage utilizationof added P by sugarcane
0,96 4.77 6.10
More than threefold increase in fertilizer P supply was obtained
from the phosphate fertilizers applied as foliar spray as compared with
the phosphorus applied to the soil.
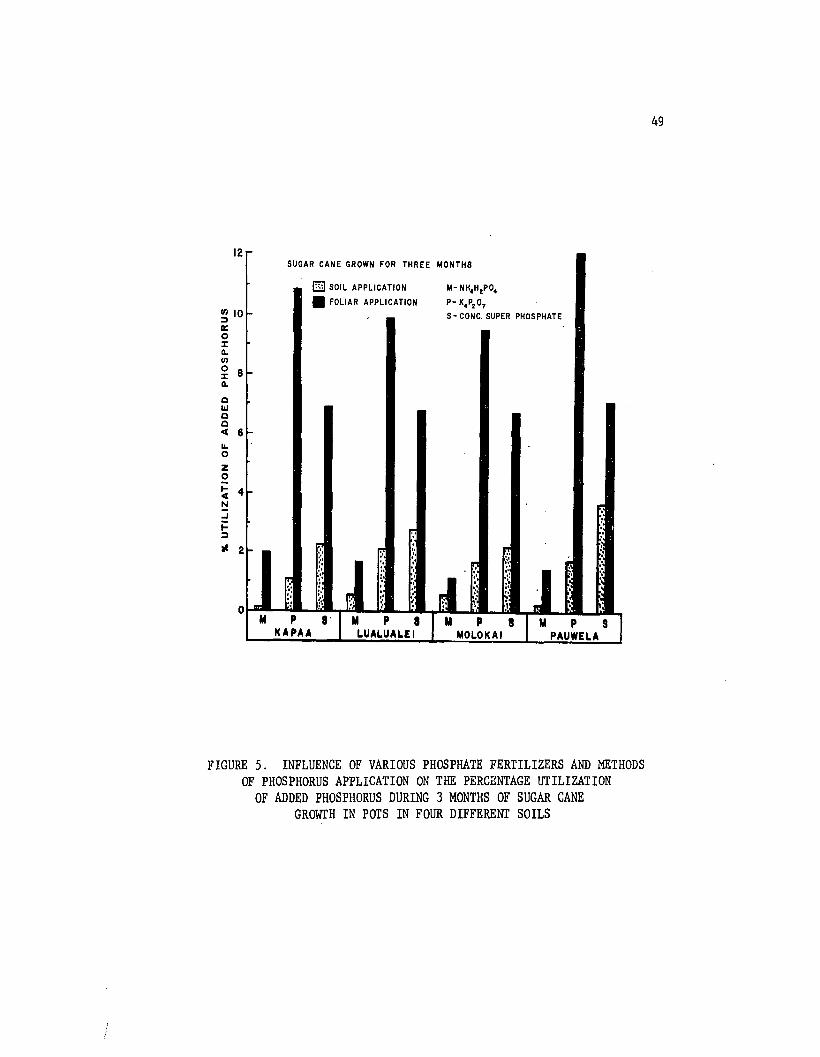
12SUGAR CANE GROWN FOR THREE MONTHS
EJ SOIL APPLICATION M- NH4H!P04
• FOLIAR APPLICATION P-K4P2 07
, S- CONC. SUPER PHOSPHATE
:'. r;: r:: :" :.:I' 0,
":'" ",
0' 0 I;: "r :.'
d" "
[ ,I~ "
:' , " .:; ~ " " ~:- fl. " " III :1 \ I .
M P 8' I M P 8 r M p 8 TM P S IKAPAA LUALUALEI MOLOKAI PAUWELA
~ 100:oJ:a.(/)
~ Ba.Q1&1QQ< 6ll.oZo~ 4NoJj:~
at 2
o
FIGURE 5. INFLUENCE OF VARIOUS PHOSPHATE FERTILIZERS AND METHODSOF PHOSPHORUS APPLICATION ON THE PERCENTAGE UTILIZATION
OF ADDED PHOSPHORUS DURING 3 MONTHS OF SUGAR CANEGROWTH IN POTS IN FOUR DIFFERENT SOILS
49

50
Methods usedSoil application Foliar application
Percentage of plantP derived fromfertilizer
1. 57 6.32
Differences between the aluminum concentration in sugar cane plants
resulting from various phosphorus tre~tments were not very great (Table
VI). Aluminum concentrations in sugar cane decreased on account of the
phosphorus applied to the Kapaa and Lualualei soils. Whereas with
similar phosphorus treatments aluminum concentrations usually increased
in plants grown in the Molokai and the Pauwela soils.
TABLE VI. INFLUENCE OF VARIOUS PHOSPHATE FERTILIZERS AND METHODSOF PHOSPHORUS APPLICATION ON THE ALUMINUM CONCENTRATION
(PPM.) IN DRY MATTER DURING 3 MONTHS OF SUGAR CANEGROWTH IN pars IN FOUR DIFFERENT SOILS
Phosphate fertilizers usedSoil Phosphorus NH4H2P04 Kl2°7 Concentrated
treatments superphosphateppm. ppm, ppm,
Kapaa None (check) 158 75 206Soil application 121 65 175Foliar application 179 158 218
Lua1ua1ei None (check) 111 106 200Soil application 72 102 160Foliar application 113 149 186
Mo1okai None (check) 68 130 256Soil application 141 144 220Foliar application 98 151 288
Pauwe1a None (check) 85 131 153Soil application 123 157 199Foliar application 145 154 221

51
Applications of concentrated superphosphate increased aluminum yield
in sugar cane grown in all the four soils as compared to aluminum yield
in plants grown in similar soils fertilized with NH4H2P04 and K4P207 as
phosphate fertilizers (Table VII), However, the checks (lacking phosphate
fertilizer) also contained much more AI, indicating some other factors
must be involved here.
TABLE VII. INFLUENCE OF VARIOUS PHOSPHATE FERTILIZERS AND METHODSOF PHOSPHORUS APPLICATION ON THE ALUMINUM YIELD (ALUMINUM
CONCENTRATION X DRY MATTER YIELD) IN SUGAR CANE TOPS.PLANTS WERE GROWN IN pars FOR 3 MONTHS
IN FOUR DIFFERENT SOILS
Phosphate fertilizers usedSoil Phosphorus NH4H2P04 K4P207 Concentrated
treatments superphosphatemgm. mgm. mgm.
Kapaa None (check) 1.10 0,98 3.30Soil application 1.82 2.08 5.60Foliar application 3,40 4.58 6.76
Lualualei None (check) 1.33 2.65 4.60Soil application 0.79 2.45 3.20Foliar application 1. 70 3.73 4.46
Molokai None (check) 0,61 1. 95 4,35Soil application 1.69 Z.74 3.96Foliar application 1,18 3.17 5.47
Pauwela None (check) 0.08 2.62 4.44Soil application 2,83 4.71 6.77Foliar application 2.76 4,47 6.85
"A" values (available soil P in relation to added phosphate fer-
tilizers), were extremely high in Kapaa, Lualualei, Molokai, and
Pauwela soils when NH4HZP04 was the standard fertilizer material
(Figure 6). The "A" value was highest in the Pauwela soil treated with

IUIAIl CAN[ nOWN fOft TH~[[ MONTHI
OM· ..V.'G"
~.-~~ ..••-(OIle.. .....U".O"Hl1[
""no
'"
52
:'. :
.-:.-::
..,..II:
, I" , 'I" . 'I"L..UAUIALII IIClU*AI•. 'I'AlJ'I1Ll'
FIGURE 6. INFLUENCE OF VARIOUS PHOSPHATE FERTILIZERS ON THE "A"VALUE OF FRIED AND DEAN, 1952. SUGAR CANE GROWN
IN POTS FOR 3 MONTHS AND IN FOUR DIFFERENT SOILS

53
NH4H2P04 and lowest in the same soil treated with concentrated
superphosphate.
Data on P yield in cane plants, expressed as multiples of the check,
were correlated with "A" values in four different soils, No such re-
lationships could be established except for the Kapaa soil (r = -0.851**).
Table VIII shows the relation between additions of phosphate fer-
tilizers and extractable (0,02N H2S04) phosphorus and pH values in soils
after plant harvest, A rather low but significant (r = 0.630**) relation-
ship was found between phosphorus yield in sugar cane tops and extractable
phosphorus in soils after the plant harvest. Occasionally, phosphorus
extracted after the harvest, seems to have increased even though no phos-
phorus was applied (Table VIII).
TABLE VIII, EXTRACTABLE SOIL PHOSPHORUS (MODIFIED TRUOG)AND SOIL pH AFTER 3 MONTHS GROWTH OF SUGAR CANE
Phosphate fertilizers usedSoil Phosphorus NH4H2P04 K4P207 Concentrated
treatments superphosphateppm. P pH ppm. P pH ppm. P pHin soil in soil in soil
Kapaa None (check) 11 4.5 4 4.7 4 4.7Soil application 69 4.7 25 4.8 51 4.7
Lualualei None (check) 1074 7,1 952 70 953 7.0Soil application 1155 7.0 1143 7.0 1064 7.0
Molokai None (check) 16 5.5 24 5.3 12 4,9Soil application 62 5.3 45 5,3 46 5.2
Pauwela None (check) 5 4.9 5 4.9 18 4.7Soil application 31 4.7 31 5.0 42 4.7
Soil pH values after harvest were lower than the original samples
irrespective of phosphate fertilizer treatment.

54
Discussion (Experiment II). Differences in plant and P yields of
sugar cane grown in four soils were associated with differences in
phosphorus status of soils. Kapaa soil, being extremely deficient in
available phosphorus, responded most to added phosphate fertilizers and
Lualualei, having abundant available phosphorus; responded least. De
crease in plant yields on account of added phosphate fert.ilizers to
Lualualei may be associated with the formation of insoluble phosphates
of zinc, manganese, or iron.
Plant yields, relative to check were sometimes greater when sugar
cane was grown in soils treated with NH4HZP04 as compared to soils
treated with concentrated superphosphate and K4PZ07. But, the lowest
phosphorus concentration was also obtained in plants grown in soils
treated with NH4HZP04' The higher the solubilities of phosphate fer
tilizers the greater would be the rate of immobilization uf added
phosphorus. Therefore, it seems possible that less soluble phosphate
fertilizers will effectively supply phosphorus to plants for a longer
time than the more soluble phosphate materials. Suehisa (1961) reported
that the less soluble phosphate fertilizers show a better effect than
the highly soluble ammonium phosphate in ·promoting yields of Sudan grass.
In the first series of plantings; the yields of the check plants were
lower than in the other two planting dates. For this reason, in the
first series of plantings, the higher yields associated with NH4HZP04
fertilizer may actually be more apparent than real.
Two methods of phosphorus application made significant differences
in phosphorus yields and phosphorus concentrations as well as in utiliza-
55
tion of fertilizer phosphorus but did not change the plant yields. Many
plants have especially high phosphorus requirements during early growth.
It appears that phosphorus can be moved into the cane plant, by foliar
sprays. It is further evident (Figure 7) that yields can be increased
by this method of phosphorus applications. The outstanding ability of
Hawaiian soils to fix added phosphorus have been demonstrated. Foliar
applications of phosphorus should give greater efficiency of fertilizer
use. This is evident from Figures 8 and 9 showing greater phosphorus
status in plants sprayed with phosphate fertilizer as compared to that
from similar fertilizer treatments applied to the soil.
All of the plants which received foliar phosphorus were high in
phosphorus, yet did not always yield as the phosphorus content tndicated
they should •. This may indicate that phosphorus taken up from the spray
may not be immediately translocated to the plant tissue where it can
enter into some of the metabolic processes in the plant. However, with
increase in time higher phosphorus status may result in higher plant
yields.
Higher amounts of fertilizer phosphorus present in sugar cane
plants grown in four soils when treated with K4PZ07 and concentrated
superphosphate than in those treated with NH4HZP04 may be explained in
terms of relative solubilities of the fertilizers. NH4HZP04 being
highly soluble was immobilized by the oxides; hydroxides and clay
minerals of soils almost immediately as compared to K4PZ07 and concen
trated superphosphate. Highest quantity of fertilizer P was obtained
in plants with concentrated superphosphate treatments which is least

SUGAR CANE GROWN FOR THREE MONTHS
C Kl2
07- pH 5.3 (DISSOLVED IN IN HN03) 0
• CONC. SUPER PHOSPHATE - pH Z.15 Q
(DISSOLVED IN 10% CITRIC ACID)
o NH4Hl04 -pH 3.8 0 0
(IN WATER)
z 14oI-ot(,)
-'0. IZ0.ot
a:ot
~ 10lL
II)
:::l
~ 8J:0.II)
oJ:0. 6cwccotlL 4oz2~ ZN
-'I:::l
o
oo
o
r·0.734··
y. -3.846 +0.44Z X
56
~ ZO 30
DRY MATTER YIELD IN GRAMS (FOLIAR APPLICATION)
FIGURE 7. RELATIONSHIP (CORRELATION COEFFICIENT AND REGRESSIONFACTOR) BETWEEN PERCENTAGE UTILIZATION OF ADDED PHOSPHORUS
(FOLIAR APPLICATION) AND DRY MATTER YIELD DUE TO FOLIARAPPLIED PHOSPHORUS IN SUGAR CANE

57
4.00
Z SUGAR CANE GROWN FOR THREE MONTHS0 0
...ocI:uJCLCL 3.00ocI:
.J 0
0SCIl:JII:0
0:z: 0CL 0CIl2.000
:z:CL
0 00
IIJ00ocI:
...0
0z 1.00 r' 0.782*40... .....ocI: y. -0.618 +0.0697 XNJ 0 0i=:J
I 0
0 10 20 30 40
PHOSPHORUS YIELD IN MILLIGRAMS (SOIL APPLICATION I
FIGURE 8. RELATIONSHIP (CORRELATION COEFFICIENT AND REGRESSIONFACTOR; BETWEEN PERCENTAGE· UTILIZATION OF ADDED PHOSPHORUS
(SOIL APPLICATION) AND PHOSPHORUS YIELDIN SUGAR CANE (SOIL APPLICATION)

r4~...J 120.0.<t
a:<t:::; 10o...III::J
~ 8:I:0.IIIo:I:0. 6aOJaa<t... 4azo
~ 2N
...J
IOJ
SUGAR CANE GROWN FOR THREE MONTHS
o NH4,\P04-pH 3.8 (IN WATER)
• ~P207-pH ~.3 (DISSOLVED IN IN HN03)
" CONC, SUPER PHOSPHATE - pH Z.I~
(DISSOLVED IN 10% CITRIC ACID)
r-O.938"AY-··Z.393 +0.126X
oo
o
30 ~O 70 90 noPHOSPHORUS YIELD IN MILLIGRAMS (FOLIAR APPLIi.ATION)
58
FIGURE 9. RELATIONSHIP (CORRELATION COEFFICIENT AND REGRESSIONFACTOR) BETWEEN PERCENTAGE UTILIZATION OF ADDED PHOSPHORUS
(FOLIAR APPLICATION) AND PHOSPHORUS YIELDIN SUGAR CANE (FOLIAR APPLIC~rION)
i
.i

i
j
59
soluble as compared to NH4H2P04 and K4P207. However~ Pauwe1a soil
responded (plant yield) very much better to soil applied monoammonium
phosphate than to the foliar application. The rate of immobilization
in the Pauwe1a soil is evidently low. This was demonstrated in subseque4t
studies (Figure 27). Evidently the availability of phosphorus from
NH4H2P04 is dependent upon the rapidity and capacity of soils to immo-
bi1ize added phosphorus.
It is known that aluminum is toxic to some plants, though the
question of critical concentrations for various plant species is only
partially understood, The critical aluminum concentrations will un~
doubted1y depend on a number of environmental factors as well as on plant
spe':ies. Aluminum toxicity seems to be associated with soil pH values
about 5.5 or less.
Three months of sugar cane growth did not change the pH of the Kapaa
soil. Therefore it may be assumed that aluminum concentration in the
soil remained the same. Nevertheless, application of phosphate fertilizer
reduced alunlinum concentration in the plants; this suggests that aluminum
uptake was-inhibited by interaction of phosphorus wlth aluminum either ir
the soil or in the roots. The question of aluminum toxicity does not
arise in soils like Lua1ua1ei (pH 7.0 after the harvest). Application
of phosphate fertilizers and/or plant growth was accompanied by acidi-
fication of Mo10kai soil. Soil from the Mo10kai series has low bufferi.rg
~apacity. According to McGeorge (1924), the concentration of aluminum in
the ionic form should be abundant below pH 5.5. Therefore; applications
of phosphorus to Mo10kai soil (pH values 4.9 to 5.3 after harvest) did

60
not reduce the aluminum concentration in cane plants growing in this soil..
No explanation is offered for the increase in aluminum ,~oncentration in
plants grown in Pauwela soil with phosphorus application.
Sin:e phosphorus was a limiting factor in three of these soils, high
"A" values in all the four soils treated with NH4HZP04 should have also
increased phosphorus status of cane plants. On the contrary phosphorus
content in plants treated with NH4HZP04 was lowest as compared to the
other two fertilizers. It seems that the increase in "A" values in soils
treated with NH4HZP04 is not on account of the increase in the avail-
ability of soil phosphorus but on account of the higher immobilizations
of added phosphorus. This may be further substantiated from Figure 10.
A close but inverse relationship was observed between the "A" values in
soils and phosphorus yields from cane plants. If the concept of "A"
value had been applicable in the four soils studied, the relationship
should have been positive. This indicates that the assumptions made for
the computation of "A" values do not apply when P immobilization by the
soil is extremely high, Thus the "A" values obtained are not valid; the
apparent increase in "A" values may be attributed to the high rate of
phosphorus fixation.
Experiment III, Soil phosphorus and aluminum solubility and uptake by
plants as influe~ced by liming
Experimental results (short-term extraction). The reversion or
I\
"fixation" of fertilizer phosphorus is so intense in mcny tropical soils
that tremendous rates of phosphate fertilization are required for optimum
plant growth (Younge and Moomaw, 1960). It appears that one of the im-

2000 rSUGAR CANE GROWN FOR 3 MONTHS
1600
61
r. -0.6!18 N
1-1794.146-36.629 X
- 1200II.
:III.II.
UJ:::l.JCl:> 800
~.
400
•• •
•
o 10 20 30 40 50
PHOSPHORUS YIELD IN MILLIGRAMS
60 70
FIGURE 10, RELATIONSHIP (CORRELATION COEFFICIENT AND REGRESSIONFACTOR) BETWEEN "A" VALUE AND PHOSPHORUS YIELD IN SUGAR CANE
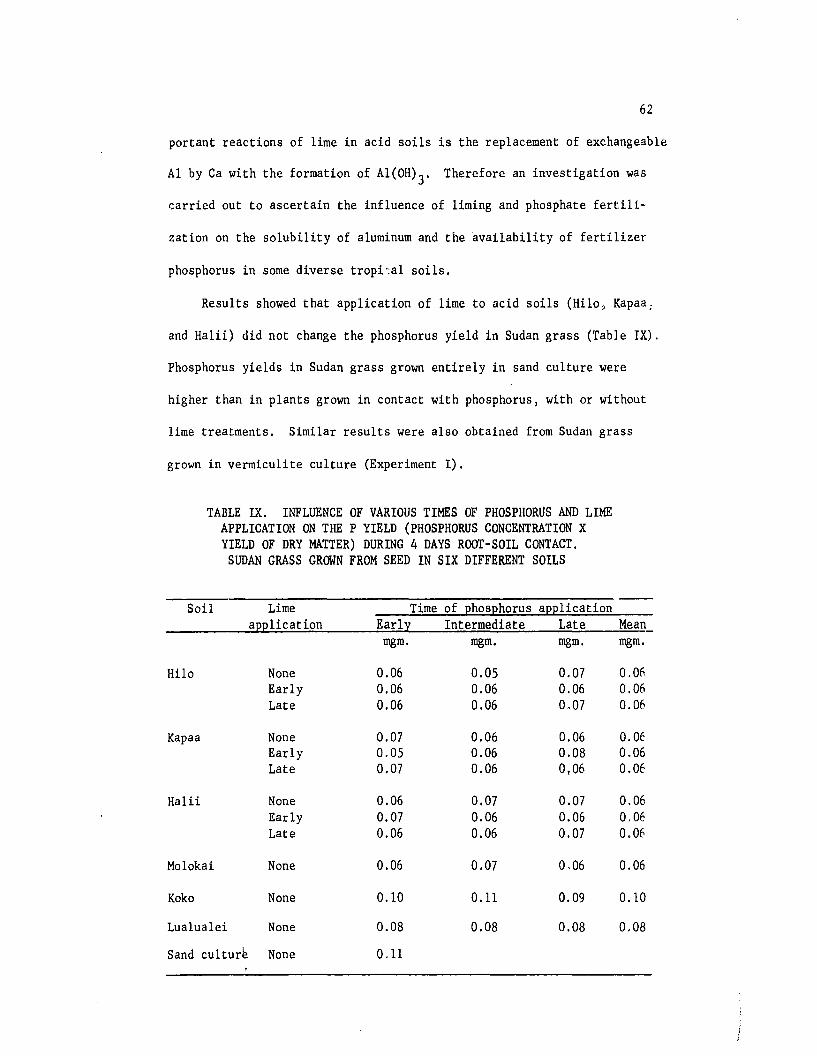
62
portant reactions of lime in acid soils is the replacement of exchangeable
Al by Ca with the formation of Al(OH)3' Therefore an investigation was
carried out to ascertain the influence of liming and phosphate fertili-
zation on the solubility of aluminum and the availability of fertilizer
phosphorus in some diverse tropi~al soils.
Results showed that application of lime to acid soils (Hilo, Kapaa;
and Halii) did not change the phosphorus yield in Sudan grass (Table IX).
Phosphorus yields in Sudan grass grown entirely in sand culture were
higher than in plants grown in contact with phosphorus, with or without
lime treatments. Similar results were also obtained from Sudan grass
grown in vermiculite culture (Experiment I).
TABLE IX. INFLUENCE OF VARIOUS TIMES OF PHOSPHORUS AND LIMEAPPLICATION ON THE P YIELD (PHOSPHORUS CONCENTRATION XYIELD OF DRY MATTER) DURING 4 DAYS ROOT-SOIL CONTACT.
SUDAN GRASS GROWN FROM SEED IN SIX DIFFERENT SOILS
Soil Lime Time of phosphorus applicationapplication Early Intermediate Late Mean
mgm. mgm. mgm. mgm.
Hilo None 0.06 0.05 0.07 0.06Early 0.06 0.06 0.06 0.06Late 0.06 0.06 0.07 0.06
Kapaa None 0.07 0.06 0.06 O.OEEarly 0.05 0.06 0.08 0,06Late 0.07 0.06 0,06 O.Of
Halii None 0.06 0.07 0.07 0.06Early 0.07 0.06 0.06 O.OELate 0.06 0.06 0.07 0.06
Molokai None 0.06 0.07 0.06 0.06
Koko None 0.10 0.11 0.09 0.10
Lualualei None 0.08 0.08 0.08 0.08
Sand cultur~ None 0.11

63
Short-term (4-day root-soil contact) P extra;tion by Sudan grass
(Table X) demonstrated that each of the three acid soils responded very
differently to liming. Phosphorus extraction from the Hilo soil was
generally increased by liming; and especially so when the lime was ap
plied late, shortly before root-soil contact was established. In
general; percentage of plant phosphorus derived from fertilizer from the
crystalline Kapaa and the Halii soils were similar and were very different
from the amorphous Hilo soil. In Halii soil especially~ lime applied
just before root-soil contact drastically reduced the percentage of the
plant P derived from fertilizer from both the intermediate and the late
application (Table X).
The percentage of plant P derived from fertilizer (Table X) for the
three neutral or alkaline soils was much higher than for the three acid
representatives.
Phosphorus be~ame progressively less available to plants with in
creasing time of reaction before root-soil contact; this trend was most
evident in Halii and least evident in Koko.
During harvesting, it was observed that root development was ex
tremely poor in Koa haole (Leucaena glauca) as compared to Sudan grass.
Less than 1% of the plant P was derived from the fertilizer in Koa haole
grown in soils with various lime and phosphorus treatments similar to
Sudan grass (Table XI). In certain instances~ so little fertilizer
phosphorus was taken up by Koa haole as to be undetectable. It was con
cluded that essentially all of the phosphorus in Koa haole plants were
derived from the sources other than the fertilizer applied--probably
from the seed.

TABLE X. INFLUENCE OF VARIOUS TIMES OF PHOSPHORUS AND LUiEAPPLICATION ON THE PERCENTAGE OF PLANT PHOSPHORUS DERIVED
FROM FERTILIZER DURING 4 DAYS ROOT SOIL CONTACT.SUDAN GRASS GROWN FROM SEED IN SIX DIFFERENT SOILS
Soil Lime Time of phosphorus applicationapplication Early Intermediate Late Mean
% % % %
Hila None 0.12 0.28 '0.23 0.21Early 0,14 0.22 0.62 0.33Late 0.27 0.61 0.92 0.60
Kapaa None 0.11 0.13 0.36 0.17Early 0.05 0.09 0.29 0.14Late 0.00 0.10 0.20 0,13
Halii None 0.07 0.42 1.11 0.53Early 0.05 0.19 0.95 0.40Late 0.07 0.08 0.29 0.18
Molokai None 1.33 2.36 2.37 2.02
Koko None 3.92 4.37 6.17 4.82
Lualualei None 6.33 9.31 10.28 8.74

TABLE XI. INFLUENCE OF VARIOUS TIMES OF PHOSPHORUS AND LIMEAPPLICATION ON THE PERCENTAGE OF PLANT PHOSPHORUS DERIVED
FROM FERTILIZER DURING 4 DAYS ROOT-SOIL CONTACT.KOA HAOLE GROWN FROM SEED IN SIX DIFFERENT SOILS
65
Soil Lime Time of phosphorus applicationapplicat ion Early Intermediate Late Mean
% % % %
Hilo None 0.00 0.03 0.03 0.02Early 0.01 0.01 0.01 0.01Late 0.00 0.01 0.01 0.01
Kapaa None 0.01 0.04 0.03 0.03Early 0.00 0.03 0.00 0.01Late 0.01 0.02 0.01 0.01
Halii None 0.00 0.04 0.00 0.01Early 0.03 0.02 0.01 0.02Late 0.01 0.00 0.02 0.01
Molokai None 0.02 0.03 0.05 0.03
Koko None 0.08 0.08 0.10 0.09
Lualua1ei None 0.04 0.06 0.22 0.11

66
Phosphorus extraction studies. After completion of the shortwterm
extraction using Sudan grass or Koa haole, Sudan grass was grown from
seed in soils composited from the short-term experiment. Then} after
the harvest of Sudan grass, Koa haole was planted in the same soils and
allowed to grow for 24 days.
Dry matter yields of Sudan grass were increased by phosphate fer-
tilization in the three acid soils and Molokai soil (Table XII). Sudan
grass yields of plants grown in Koko and Lualualei soils were higher
than those grown in the other four soils.
Plant yield of Sudan grass grown in the three acid soils with various
lime and phosphorus treatments were subjected to statistical analysis,
Differences in plant yields due to soils and lime treatments were highly
significant. The mean data from the main effects are as follows:
SoilHilo
Plant yields of Sudan grass(gms. /pot) 0.36 0.44 0.52
Duncan's multiple range test showed that each mean value obtained
from three soils was significantly different from the others.
Lime applicationsNone Early Late
Plant yields of Sudan grass(gms '/pot) 0.37 0.45 0.50
Plant yields did not vary significantly between early or late ap-
plication of lime but application of lime increased Sudan grass yields
significant ly.
Plant yield data from Sudan grass grown in all six soils with va-
rious times of phosphorus application were analyzed statistically.

TABLE XII. INFLUENCE OF VARIOUS TIMES OF PHOSPHORUS AND LIMEAPPLICATION ON THE YIELD OF DRY MATTER (GRAMS/POT) DURING
21 DAYS OF PLANT GROwrH. SUDAN GRASS GROWN IN POTSFROM SEEDS IN SIX DIFFERENT SOILS
67
Soil Lime Time of phosphorus applicationapplication Early Intermediate Late
g. g. g.
Hilo None 0.18 (P none)None 0.37 0.33 0.30Early 0.48 0.41 0.53Late 0.48 0.58 0.52
Kapaa None 0.20 (P none)None 0.29 0.30 0.40Early 0.41 0.34 0.40Late 0.37 0.28 0.44
Halii None 0.32 (P none)None 0.45 0.42 0.49Early 0,49 0.50 0.49Late 0.53 0.55 0.73
Molokai None 0.37 (P none)None 0.41 0.69 0.55
Koko None 1.35 (P none)None 1.61 0.77 1.60
Lualualei None 1.32 (P none)None 1.35 1,30 1.38

68
Differen-;es in plant yields due to soils; times of phosphorus application;
and their interactions were highly significant. Yield data from Sudan
grass grown in six soils are summarized as follows:
Soil.Kapaa Hilo Halii Molokai Koko Lualualei
Plant yields(gms '/pot) 0.33 0. 33 ..::;.O~.4..:::..5_....::.0.:..:.5~5 ..::.1.:.;;:.3~3_-=1~.3:...:.4
When phosphorus was allowed to react with the soil before planting
the yield of Sudan grass sometimes decreased but there were some out-
standing exceptions. The following data are means of Sudan grass yields
obtained from the various times of phosphorus application.
Times of phosphorus applicationIntermediate Early Late
Sudan grass yields(gms./pot) 0.63 0.75 0.78
Koa haole, grown after the harvest of Sudan grass, showed a general
response to the addition of phosphorus. Application of lime together
with phosphorus increased plant yield in the Hilo and Kapaa soil but did
not show any increase in the Halii soil where the results were not very
consistent (Table XIII). Koa haole yields were different on account of
various durations of phosphorus equilibration but the differences were
inconsistent in various soils (Table XIII). Differences between plant
yields associated with soils and lime treatments (three a~id soils) were
highly significant. Mean data from the main effects due to soils and
lime treatments are as follows:
Koa haole yields(gms./pot)
Hilo
0,67 0.70
HaUi
0.75
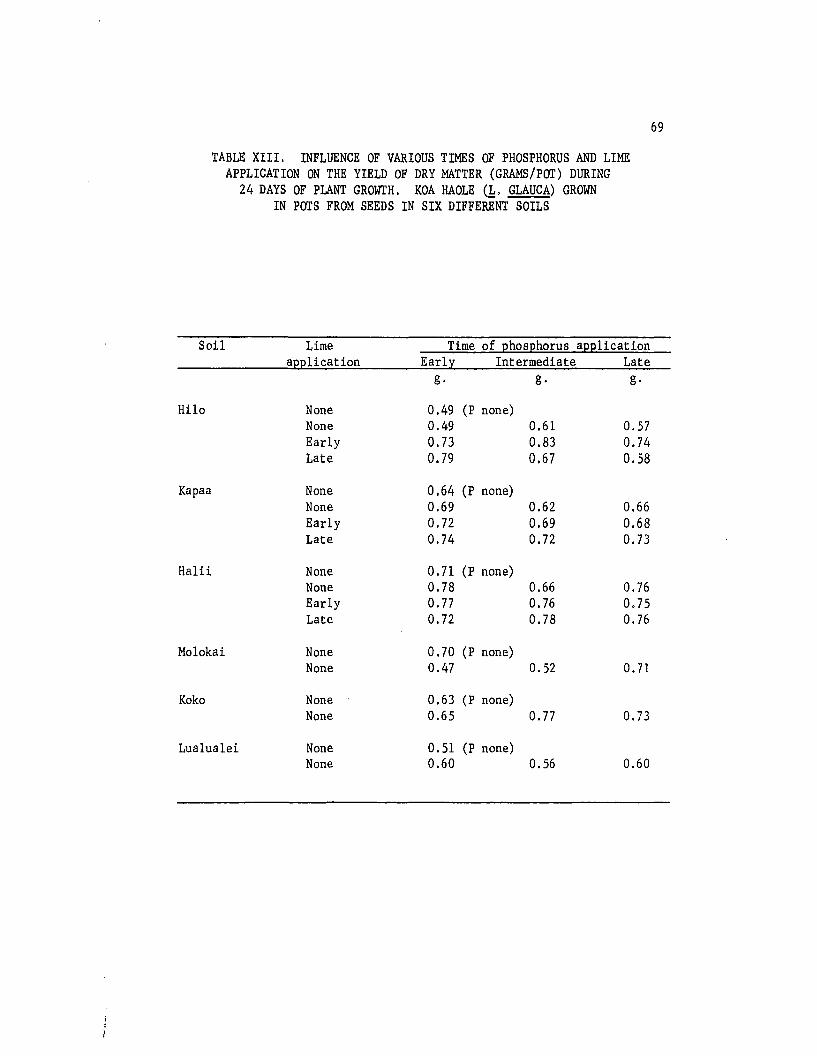
TABLE XIII. INFLUENCE OF VARIOUS TIMES OF PHOSPHORUS AND LIMEAPPLICATION ON THE YIELD OF DRY MATTER (GRAMS/POT) DURING
24 DAYS OF PLANT GROWI'H. KOA HAOLE (1, GLAUCA) GROWNIN POTS FROM SEEDS IN SIX DIFFERENT SOILS
69
Soil Lime Time of phosphorus applicationapplication Early Intermediate Late
g. g. g.
Hilo None 0.49 (P none)None 0.49 0.61 0.57Early 0.73 0.83 0.74Late 0.79 0.67 0.58
Kapaa None 0.64 (P none)None 0.69 0.62 0.66Early 0.72 0.69 0.68Late 0.74 0.72 0.73
Halii None 0.71 (P none)None 0.78 0.66 0.76Early 0.77 0.76 0,75Late 0.72 0.78 0,76
Molokai None 0.70 (P none)None 0.47 0.52 0.71
Koko None 0.63 (P none)None 0.65 0.77 0.73
Lualualei None 0.51 (P none)None 0.60 0.56 0.60
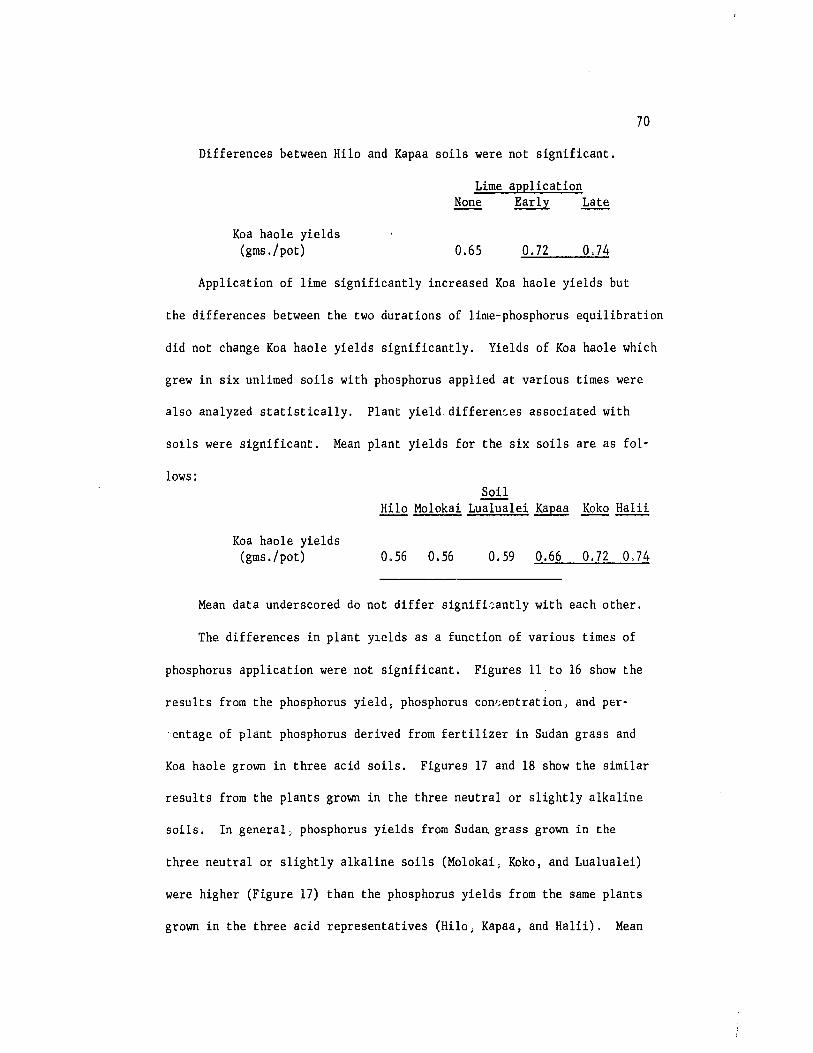
70
Differences between Hilo and Kapaa soils were not significant.
Lime applicationNone Early Late
Koa haole yields(gms,fpot) 0.65 0.72 0.74
Application of lime significantly increased Koa haole yields but
the differences between the two durations of lime-phosphorus equilibration
did not change Koa haole yields significantly. Yields of Koa haole which
grew in six unlimed soils with phosphorus applied at various times were
also analyzed statistically. Plant yield differen::.es associated with
soils were significant. Mean plant yields for the six soils are as fol-
lows:Soil
Hilo Molokai Lualualei Kapaa Koko Halii
Koa haole yields(gms,fpot) 0,56 0.56 0.59 0.66 0.72 0,74
Mean data underscored do not differ signifi~antly with each other.
The differences in plant yields as a function of various times of
phosphorus application were not significant. Figures 11 to 16 show the
results from the phosphorus yield; phosphorus con8entration) and per~
centage of plant phosphorus derived from fertilizer in Sudan grass and
Koa haole grown in three acid soils. Figures 17 and 18 show the similar
results from the plants grown in the three neutral or slightly alkaline
soils. In general, phosphorus yields from SudaR grass grown in the
three neutral or slightly alkaline soils (Molokai; Koko, and Lualualei)
were higher (Figure 17) than the phosphorus yields from the same plants
grown in the three acid representatives (Hilo) Kapaa, and Halii), Mean

71
II:W!::!oJ
i=II:WI&.
50 :IoII:...
40 e>i:IIIo
30 II;;)II:o:xL
20~:xL
~o ~
LII.o
o ~
o
SUDAN GRASS GROWN FOR 21 DAYS IN HILO SOIL
~ - PHOSPHORUS EARLY
~ - PHOSPHORUS INTERMEDIATE
'l. - PHOSPHORUS LATE
:
"" "
" "" :
"::
":" "
".." "
: I
Iv Iv~ I"
": :,
t... " VNO .. I Pr I " I ~ '- I '. I { '- I " I ~
NO LIME LIME EARLY LIME LATE
0,600
o
III 0;;) oJ
~!!!:z: )0
:; ~ 0,200011::z: 0lL :x... A.Z IIIC 0oJ %lL ..
Ir:::!
II:III...~;:I C)0 II:
~ j 0.400
II. =o :I.,. z- -
FIGURE 11. INFLUENCE OF VARIOUS TIMES OF PHOSPHORUS AND LIMEAPPLICATION ON PHOSPHORUS CONCENTRATION, PHOSPHORUS YIELD
(PHOSPHORUS CONCENTRATION X PLANT YIELD), AND PERCENTAGEOF PLANT P DERIVED FROM FERTILIZER IN SUDAN GRASS
GROWN IN HILO SOIL FOR 21 DAYS
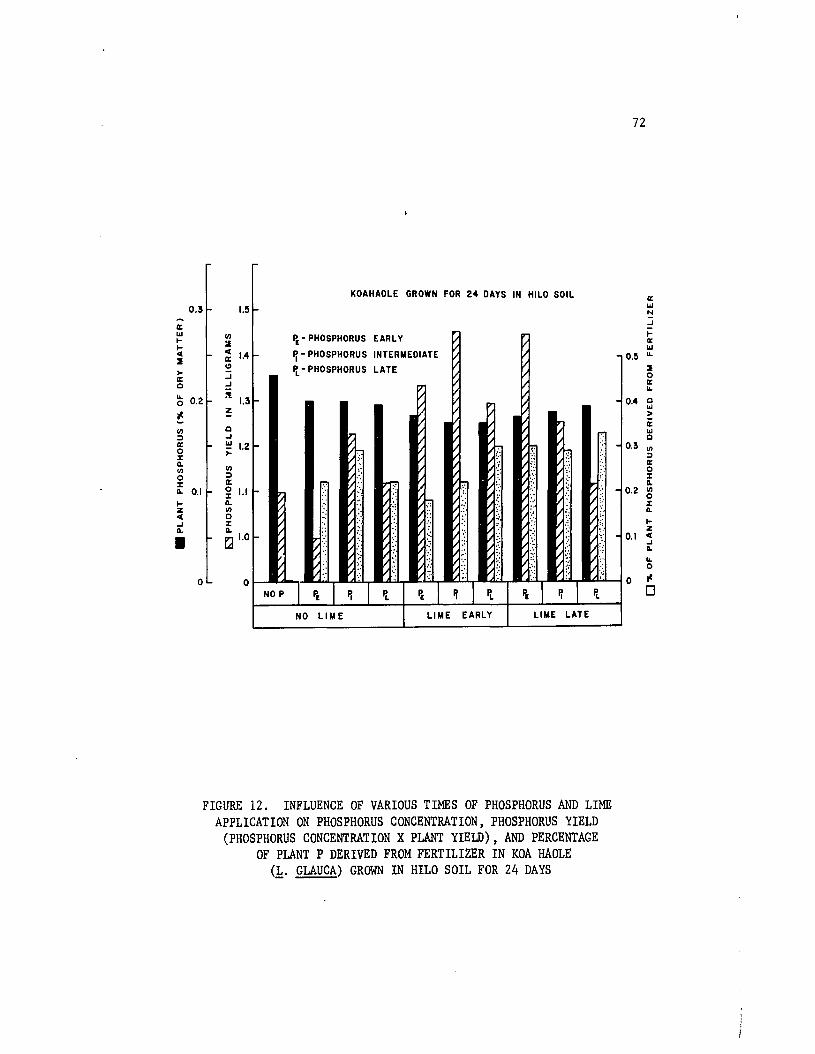
0.3-a:l&JlIe(
:I~
a:Q
:J 0.2
."VI::Ja:0:E:a.VI0:E:a. 0.1I-ze(oJa.•
o
VI:I
: 1.4
"oJoJ
:t 1.3
~
QoJ
l&J 1.2~
VI::Ja:~ 1.1a.VIo:E:a.~ 1.0
o
KOAHAOLE GROWN !'OR 24 DAYS IN HILO SOIL
~ - PHOSPHORUS EARLY
~ - PHOSPHORUS INTERMEDIATE
It. - PHOSPHORUS LATE
~::
Ir".:.:
/::
~...
. .,
~., '.: "::.
:~"" .:
/ :.", /
.:. "..' / /." :;
NO P I Pr I ~ I It Pr I ~ I It. Pr I ~ T It
NO LIM E LIME EARLY LIME LATE
72
a:l&JN
oJ
Ia:l&J
o.~ u.
:Ioa:l&.
0,4 :3>a:l&Jo
0.3 VI::Ja:o%a.
0.2 ~
%a.Iz
0.1 e(oJa.l&.o
o ."o
FIGURE 12. INFLUENCE OF VARIOUS TIMES OF PHOSPHORUS AND LIMEAPPLICATION ON PHOSPHORUS CONCENTRATION, PHOSPHORUS YIELD
(PHOSPHORUS CONCENTRATION X PLANT YIELD), AND PERCENTAGEOF PLANT P DERIVED FROM FERTILIZER IN KOA HAOLE
(1. GLAUCA) GROWN IN HILO SOIL FOR 24 DAYS

73
a:wN
oJ
Ia:w...~oa:...ow>a:w
15 01J)
:::>a:o:I:
o ::;o:I:Q.
I-
5 ~oJQ.
...o
o "I
o
20
SUDAN GRASS GROWN FOR 21 DAYS IN KAPAA SOIL
~- PHOSPHORUS EARLY
~ - PHOSPHORUS INTERMEDIATE
It - PHOSPHORUS LATE
'.17.'
.' 1/
~ I.. 1/.:.. LI".
1I:II·:
mI I~::
I I II ;] I " II·~
hII:II·
NO P I ~ I ~ I PL ~ I ~ I PL ~ I ~ I ItNO LIME LIME EARLY LIME LATE
o
0.400
0.600
0.200
lEI
FIGURE 13. INFLUENCE OF VARIOUS TIMES OF PHOSPHORUS AND LIMEAPPLICATION ON PHOSPHORUS CONCENTRATION, PHOSPHORUS YIELD
(PHOSPHORUS CONCENTRATION X PLANT YIELD), AND PERCENTAGEOF PLANT P DERIVED FROM FERTILIZER IN SUDAN GRASS
GROWN IN KAPAA SOIL FOR 21 DAYS

104 0.40
KOAHAOLE GROWN FOR 24 DAYS IN KAPAA SOIL
Po' PNOSPHORUS EARLY II:...N
~ 0.3 1.3P, - PHOSPHORUS INTERMEDIATE 0.30 ~
It- PHOSPHORUS LATE I-...II:I- ...I- ...e
:I:I... 0II:II: ...0... 00
1.2 I- 0.20 ~
i0.2
! II:....,0 0:> ..J .,0: ...
0 : :>:z: ~ II:o. 0., .,:z:
0 :> o.:z: II:0.10
.,o. 0 IJI- 00.1 :z: :z:I- o. o.z .,
l-e 0z..J :z:eo. o...J• rA ~;o....
lI.: 0II
0 t-O 0
NO P I P, I It I Po I P, I It I Po I p, 1 p. 0~
NO LIIIE I LIME EARLY I LIME LATE
FIGURE 14. INFLUENCE OF VARIOUS TIMES OF PHOSPHORUS AND LIMEAPPLICATION ON PHOSPHORUS CONCENTRATION, PHOSPHORUS YIELD
(PHOSPHORUS CONCENTRATION X PLANT YIELD), AND PERCENTAGEOF PLANT P DERIVED FROM FERTILIZER IN KOA HAOLE
(1· GLAUCA) GROWN IN KAPAA SOIL FOR 24 DAYS
74

0.800
0.800
a:...........cO)1I1i)0: 0.400a:Cl/oJ~::!
1I
~!0)~oa: .Jo!!!~ )0 0.200
o~f~... f
~fII?J 0
SUDAN GRASS GROWN FOR 21 DAYS IN HALII SOIL
~ ~ - PHOSPHORU8 EARLY
~ - PHOSPHORUS INTERMEDIATE
'l- PHOSPHORUS LATE
~
,. ,.
'.'.
~..
.'
..
I~':. I ..
~~i...' ..
HOP I .. I ~ I It .. .,~ I It .. I ~ I It
NO LIME LIME EARLY LIME LATE
a:...NJj:a:...
110 ...1Ioa:...
40 ~
:!:a:
'"°30 0)~
a:o:I:CL
20 ~:I:0..
...z10 c
.JCL
l!io ~
D
75
FIGURE 15. INFLUENCE OF VARIOUS TIMES OF PHOSPHORUS AND LIMEAPPLICATION ON PHOSPHORUS CONCENTRATION, PHOSPHORUS YIELD
(PHOSPHORUS CONCENTRATION X PLANT YIELD» AND PERCENTAGEOF PLANT P DERIVED FROM FERTILIZER IN SUDAN GRASS
GROWN IN HALII SOIL FOR 21 DAYS
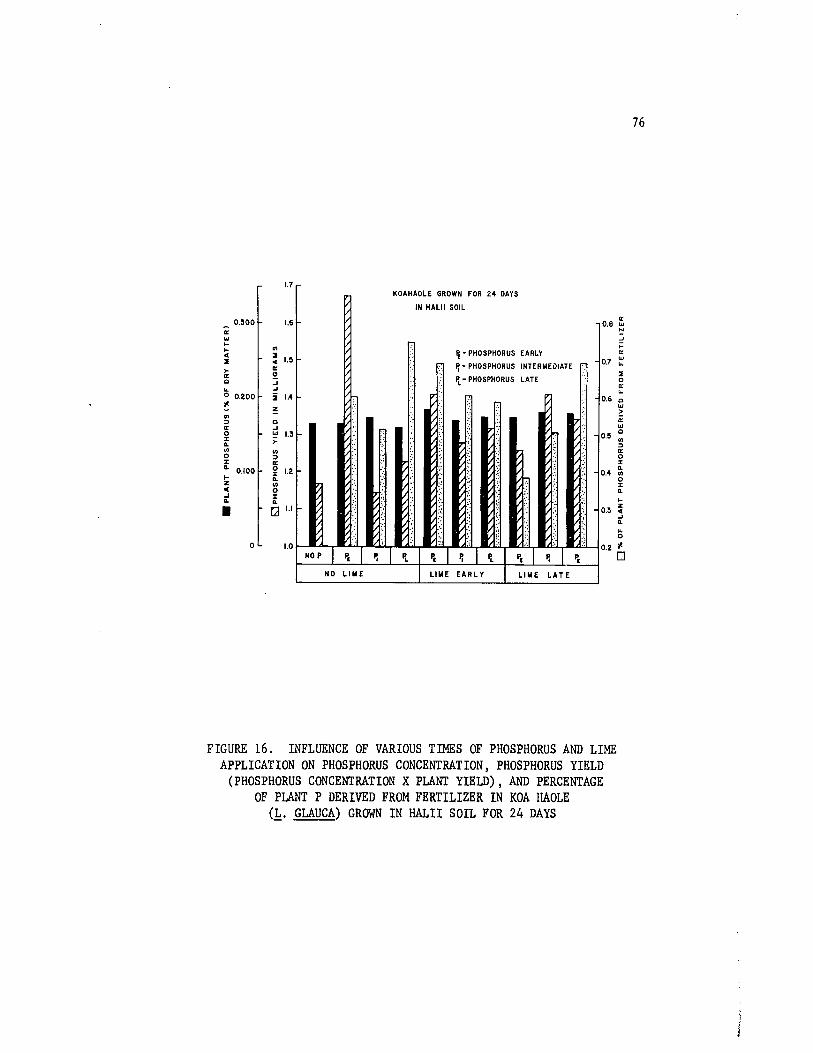
1.7KOAHAOLE GROWN FOR 24 OAYS
IN HALII SOIL
76
1.0 " ::'
NO p I ~ I P, I PL I ~ I P, I It I p. I P, I ~
0.300II:
'"....c:I,.II:Q..o 0.200#-.,::lII:o%...,o%
.. 0.100I-zC.J..•
o
1.6
.,~ 1.3II:
!:!...J...J
i 1.4
~Q
.J'" 1.3,..,::lII:
~ 1.2...,o%..rLjl.l
~ - PHOSPHORUS EAR~Y
Po - PHOSPHORUS INTERMEDIATE
It - PHOSPHORUS LATE
::.
:.:
II:0.8 '"
N
...J;::II:
0.7 ~
:IoII:"-
0.6 Q
'">II:
'"O.~ ~::lII:o%..
0.4 .,o%..I-
0.3 ~...J.."o
0.2 #o
NO LIME I LIME EARLY I LIME LATE
FIGURE 16. INFLUENCE OF VARIOUS TIMES OF PHOSPHORUS AND LIMEAPPLICATION ON PHOSPHORUS CONCENTRATION, PHOSPHORUS YIELD
(PHOSPHORUS CONCENTRATION X PLANT YIELD), AND PERCENTAGEOF PLANT P DERIVED FROM FERTILIZER IN KOA HAOLE
(1. GLAUCA) GROWN IN HALII SOIL FOR 24 DAYS
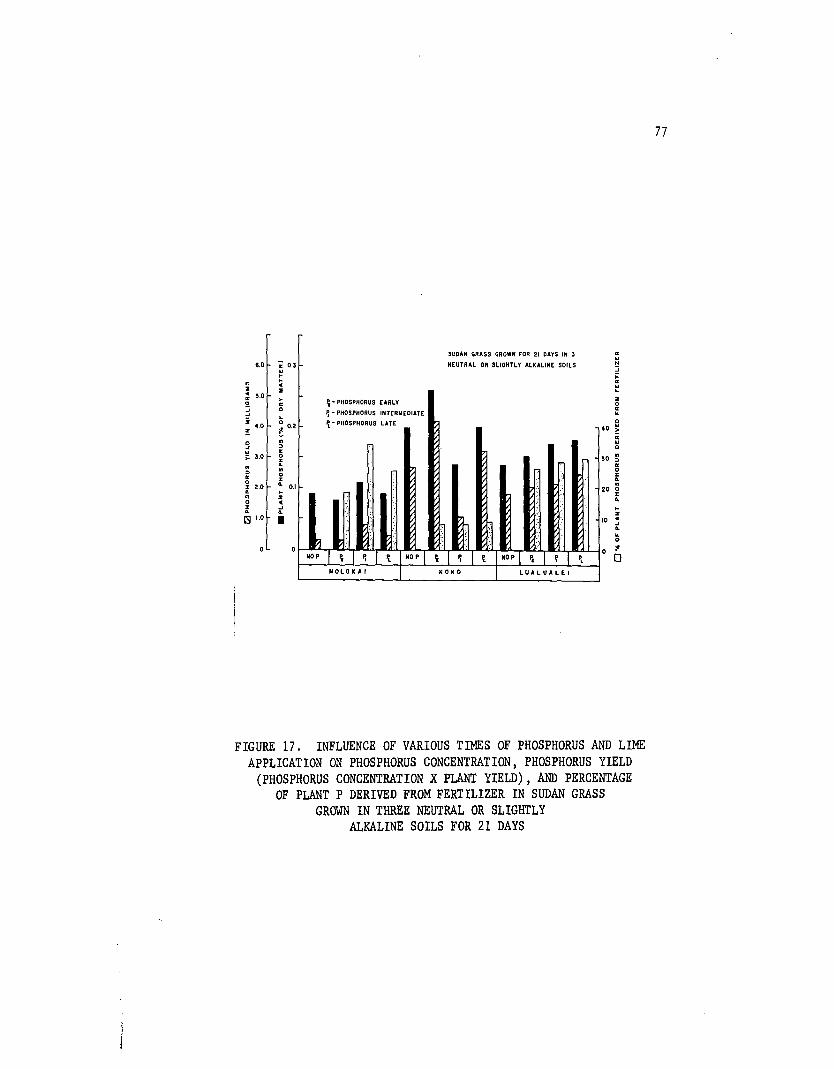
SUDAN GRASS GROWN FOR 21 DAYS IN 3 '";- O. "'6,0 3 NEUTRAL OR SLIGNTLY ALKALINE SOILS N
"' :iI- ;::l-n c ~2 2
: :1.0 > ~ - PHOSPHORUS EARLY 2.. '" 0:i Q
~ - PHOSPHORUS INTERMEDIATE '".J .. ..i 4.0 0 It - PHOSPHORUS LATE Q
!~ O,~ 40 ~
Q n '""'.: :> Q
'";: 3.0 0 30 ~:z:
".. '":> " 0
'"0 :z:
0 :z: ..: 2.0 .. 0, I .... I- :
20 0
" z :z:0 c ..:z: .J I-.. .. z~ 1.0 • "
J ~ ~,0 C
.J.. ..: ..
~0
" f.NO P I ~ I ., I 'I. I NO P I ~ I ., I 'I. I NOpT I
00II ., P,
WOLOKA, I KOICD I LUALUAL£I
FIGURE 17. INFLUENCE OF VARIOUS TIMES OF PHOSPHORUS AND LIMEAPPLICATION ON PHOSPHORUS CONCENTRATION, PHOSPHORUS YIELD
(PHOSPHORUS CONCENTRATION X PLANT YIELD), AND PERCENTAGEOF PLANT P DERIVED FROM FERTILIZER IN SUDAN GRASS
GROWN IN THREE NEUTRAL OR SLIGHTLYALKALINE SOILS FOR 21 DAYS
77
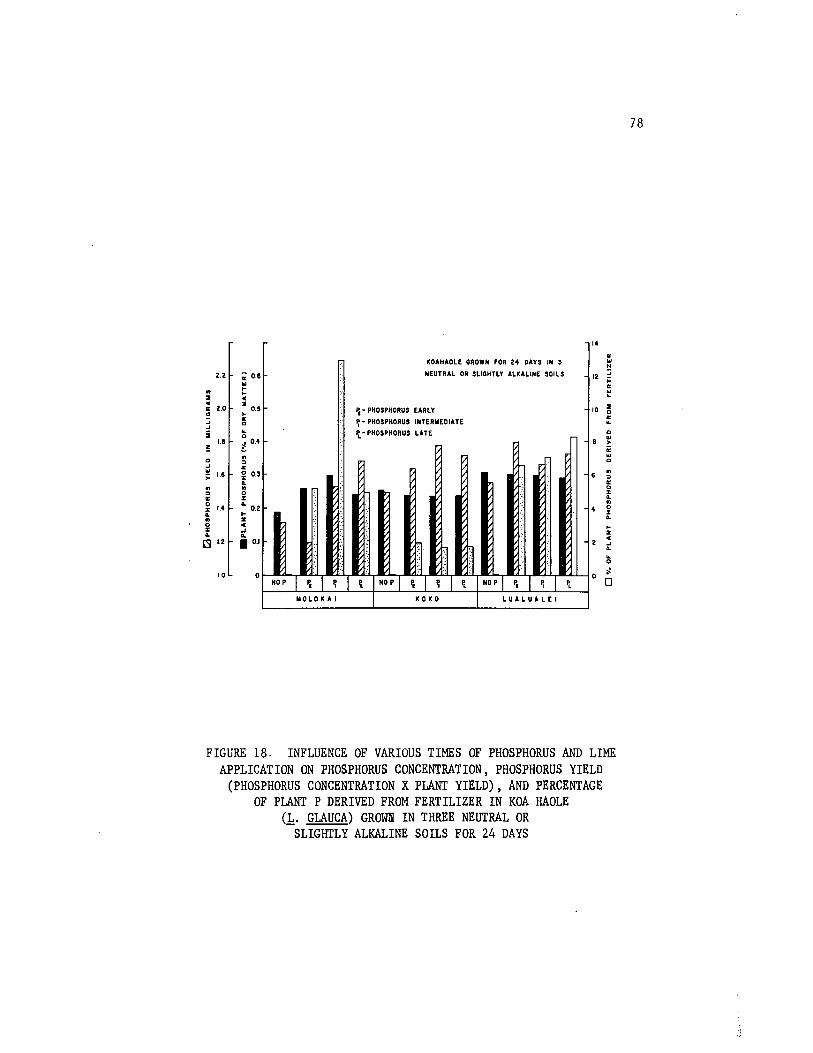
2.2
2.0
1.8
ooJ
~ 1.6
":>0:
~ 1.4.."o:z:..~ 1.2
1.0
; 0.1........:II
0.5..0:D..o~ 0.4
":>0:
~ 0.3.."o:z:.. 0.2..z..oJ...0.1
1l0LOKAI
KOAHAOLE GROWN FOR 24 OAYS IN 3
NEUTRAL OR SLIGHTLY ALKALINE SOILS
~- PHOSPHORUS EARLY
p,' PHOSPHORUS INTERIiEDIATE
p,,' PHOSPHORUS LATE
I KOKO I LUALUALEI
12
I ~0:..o
8 ~it..o
6 ~0:o:z:.."4 ~....z
2 ~....o
78
FIGURE 18, INFLUENCE OF VARIOUS TIMES OF PHOSPHORUS AND LIMEAPPLICATION ON PHOSPHORUS CONCENTRATION, PHOSPHORUS YIELD
(PHOSPHORUS CONCENTRATION X PLANT YIELD), AND PERCENTAGEOF PLANT P DERIVED FROM FERTILIZER IN KOA HAOLE
(1. GLAUCA) GROWN IN THREE NEUTRAL ORSLIGHTLY ALKALINE SOILS FOR 24 DAYS
79
data show that application of lime to acid soils increased phosphorus
yield in Sudan grass and the differences were highly significant
(Figures ll~ 13, and 15).
Lime applicationNone Early Late
Phosphorus yield in Sudangrass (mgs. p/pot) 0,31 0.42 0.44
Applications of lime at two different times did not change the
phosphorus yield in Sudan grass.
Duration of soil-phosphate fertilizer equilibration did not make
any significant differences in phosphorus yields in Sudan grass except
between the intermediate and late application.
Time of P applic;ationIntermediate Early Late
Phosphorus yields (Sudangrass) (mgs. p/pot) 0.37 0.40 0.44
Mean phosphorus yields in Sudan grass grown in six soils were as
follows:Soil
Kapaa Hilo Halii Molokai Lualualei Koko
Phosphorus yields(Sudan grass) 0.23 0.26 0.44(mgs. p/pot)
0.54 2.24 2,81
Differences between phosphorus yields in'Koa haole on account of the
addition of lime were highly significant. Here again duration of soi1-
phosphate fertilizer equilibration made no significant difference in P yields.
Lime applicationNone Early Late
Phosphorus yields (Koa haole)(mgs. p/pot) 1,18 1.29 1.31
80
Phosphorus yields from Koa haole grown in six soils are summarized
as follows:Lime application
Hilo Halii Kapaa Molokai Koko Lualualei
Phosphorus yields(Koa haole) 1.10 1.22 1.23(mgs. p/pot)
1.47 1. 71 1.73
Whereas short-term (4 days) extraction of phosphorus from Hilo soil
by Sudan grass gave about fourfold differences in the utilization of
fertilizer phosphorus due to late liming, long-term (21 days) extraction
of phosphorus was much more influenced by lime treatments (Table XIV).
Sudan grass utilized 63 times as mu(;h fertilizer P from the limed soil
as it utilized from the unlimed soil. There Here similar but over-all
relatively small effects of lime on fertilizer P utilization from the
Kapaa and the Halii soils (Table XIV). Less than 1% of the added P was
utilized by Koa haole grown in all soils as compared to a maximum utili-
zation of 2.8% by Sudan grass (Tables XV and XIV 1 respectively).
Application of lime increased the percentage of plant phosphorus
derived from fertilizer by Sudan grass and Koa haole, Mean data are as
follows:
Lime applicationNone Late Early
Percentage of plant P derivedfrom fertilizer (Sudan grass) 9.18 24.63 25.18
The difference between late and early application of lime was not
significant.Lime application
Late None Early
Percentage of plant P derivedfrom fertilizer (Koa haole) 0.23 0.29 0.31

81
TABLE XIV. INFLUENCE OF VARIOUS TIMES OF PHOSPHORUS AND LIMEAPPLICATION ON THE PERCENTAGE UTILIZATION OF ADDED PHOS-
PHORUS DURING 21 DAYS OF PLANT GROWTH. SUDAN GRASSGROWN IN POTS IN SIX DIFFERENT SOILS
Soil Lime Time of phcsphorus applicationapplication Early Intermediate Late Mean
% % % %
Hilo None 0,01 0.01 0.02 0.01Early 0,82 0.41 0.75 0.66Late 0.56 0.58 0.64 0.60
Kapaa None 0.01 0.01 0.02 0.12Early 0.23 0,11 0.16 0.17Late 0,09 0.07 0,22 0.12
Halii None 0.41 0.31 0.58 0.44Early 0.38 0.48 0.62 0.49Late 0.61 0.58 1.16 0.78
Mo1okai None 0.23 1.07 0.50 0.60
Koko None 1.34 0.33 1.09 0.92
Lua1ua1ei None 2.05 2.40 2.79 2,41
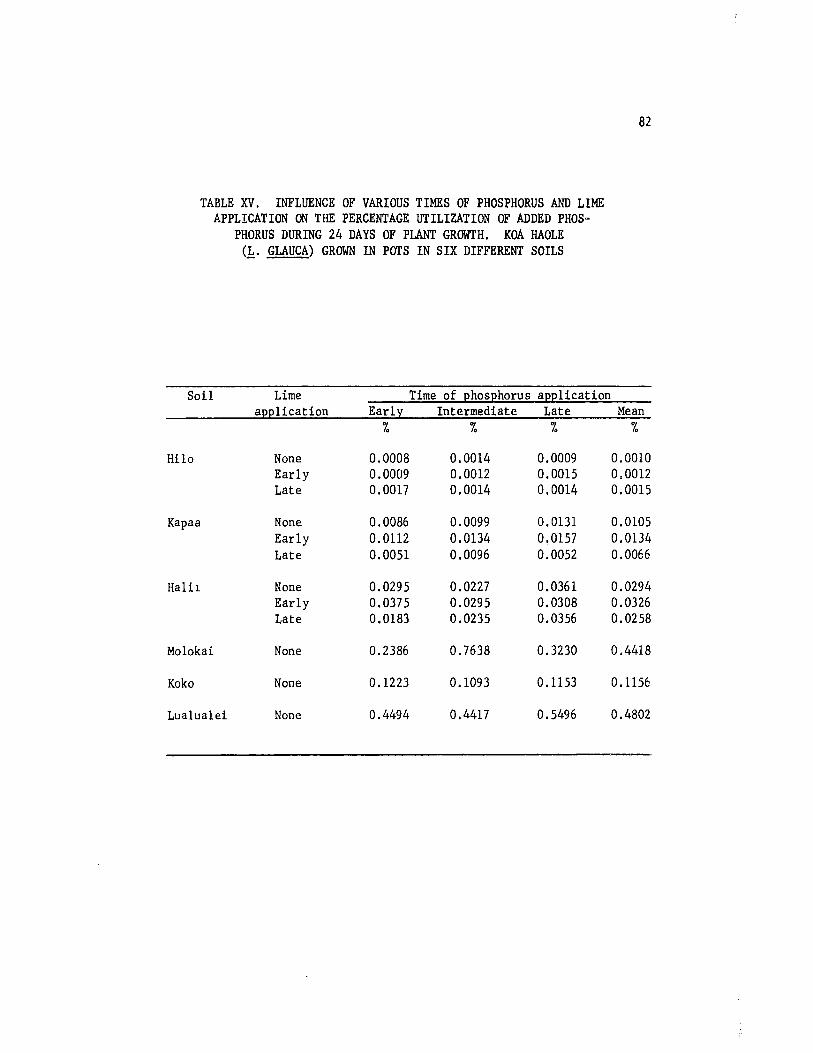
TABLE XV. INFLUENCE OF VARIOUS TIMES OF PHOSPHORUS AND LIMEAPPLICATION ON THE PERCENTAGE UTILIZATION OF ADDED PHOS
PHORUS DURING 24 DAYS OF PLANT GROWTH. KOA HAOLE(1. GLAUCA) GROWN IN POTS IN SIX DIFFERENT SOILS
82
Soil Lime Time of phosphorus applicationapplication Early Intermediate Late Mean
% % % %
Hilo None 0.0008 0.0014 0.0009 0.0010Early 0.0009 0.0012 0.0015 0,0012Late 0.0017 0.0014 0.0014 0.0015
Kapaa None 0.0086 0.0099 0.0131 0.0105Early 0.0112 0.0134 0.0157 0.0134Late 0.0051 0.0096 0.0052 0.0066
Ha1il None 0.0295 0.0227 0.0361 0.0294Early 0.0375 0.0295 0.0308 0.0326Late 0.0183 0.0235 0.0356 0.0258
Molokai None 0.2386 0.7638 0.3230 0,4418
Koko None 0.1223 0.1093 0.1153 0.1156
Lua1ualei None 0.4494 0.4417 0.5496 0.4802

83
Differences among the soils in percentage of plant P derived from
fertilizer in Sudan grass as well as in Koa haole were highly significarrt.
The mean data from the main effects are summarized here.
SoilHilo Kapaa Koko Halii Molokai Lualualei
Percentage of plantP derived from fer- 0.90 1.30 8.54 25.32 26.13tilizer (Sudangrass)
Data from the Koa haole are as follows:
28.10
Soil.!lila Kapaa Halii Koko Lualualei Molokai
Percentage of plantP derived from fer- 0.02 0.02 0.62 1.77tilizer (Koa haole)
7.28 7.66
The percentage of plant phosphorus derived from fertilizer was
greatest when the fertilizer was applied late to acid soils. Difference
between early and intermediate applied phosphorus was not significant.
Phosphorus appliedIntermediate Early Late
Percentage of plant Pderived from fertilizer (Sudan grass)
16.96 18.91 23.11
Different trends were obtained when the similar data were summarized
from the six different soils. However, the late applied P was superior
to either early or intermediate application in supplying fertilizer P to
Sudan grass.
Phosphorus appliedEarly Intermediate Late
Percentage of plant Pderived from fertilizer 1.30 1.59 1.62(Sudan grass)
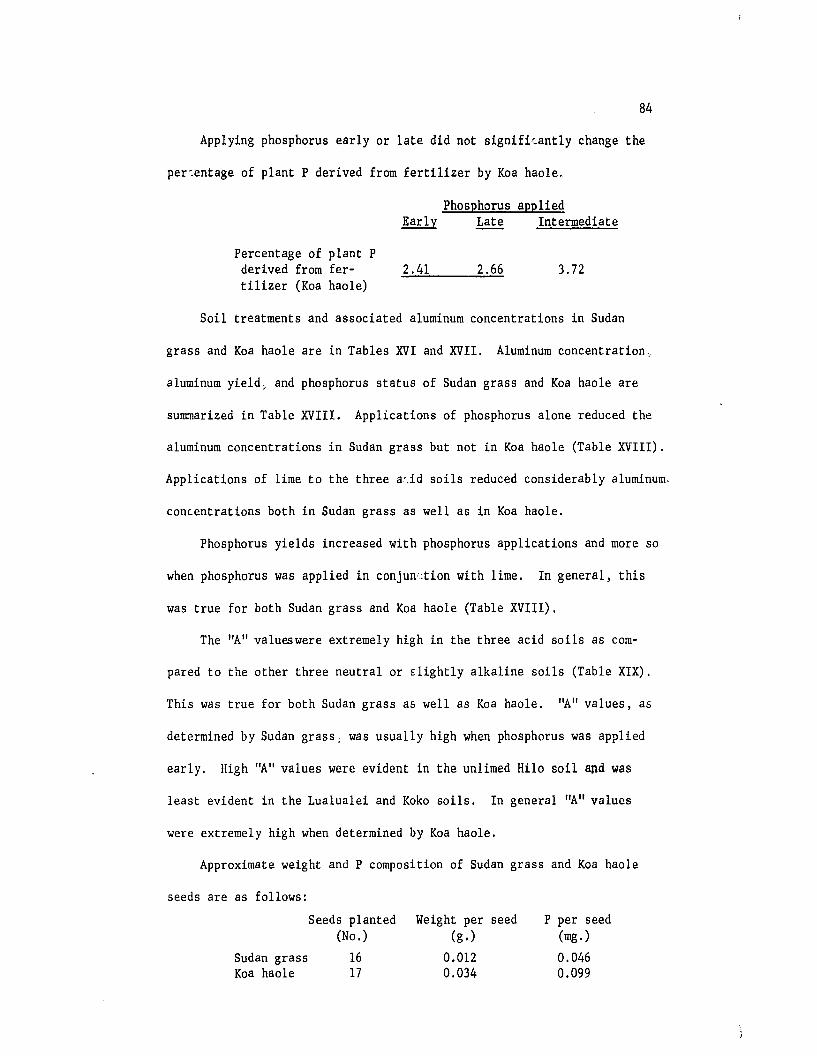
84
Applying phosphorus early or late did not signifi~antly change the
per:entage of plant P derived from fertilizer by Koa haole,
Phosphorus appliedEarly Late Intermediate
Percentage of plant Pderived from fertilizer (Koa haole)
2.41 2.66 3.72
Soil treatments and associated aluminum concentrations in Sudan
grass and Koa haole are in Tables XVI and XVII. Aluminum concentration,
aluminum yield; and phosphorus status of Sudan grass and Koa haole are
summarized in Table XVIII. Applications of phosphorus alone reduced the
aluminum concentrations in Sudan grass but not in Koa haole (Table XVIII).
Applications of lime to the three a~.id soils reduced considerably aluminum.
concentrations both in Sudan grass as well as in Koa haole.
Phosphorus yields increased with phosphorus applications and more so
when phosphorus was applied in conjun:tion with lime. In general, this
was true for both Sudan grass and Koa haole (Table XVIII).
The "A" valueswere extremely high in the three acid soils as com-
pared to the other three neutral or slightly alkaline soils (Table XIX).
This was true for both Sudan grass a5 well as Koa haole. "A" values, as
determined by Sudan grass, was usually high when phosphorus was applied
early. High "A" values were evident in the unlimed Hilo soil apd was
least evident in the Lualualei and Koko soils. In general "A" values
were extremely high when determined by Koa haole.
Approximate weight and P composition of Sudan grass and Koa haole
seeds are as follows:
Sudan grassKoa haole
Seeds planted(No.)
1617
Weight per(g. )
0.0120.034
seed P per seed(mg.)
0.0460.099

TABLE XVI. INFLUENCE OF VARIOUS TIMES OF PHOSPHORUS AND LIMEAPPLICATION ON ALUMINUM CONCENTRATIONS DURING 21 DAYS OF
PLANT GROWTH. SUDAN GRASS GRCMN IN parsFROM SEEDS IN SIX DIFFERENT SOILS
85
Soil Lime Time of phosphorus applicationapplication Early Intermediate Late Mean
ppm. ppm. ppm. ppm.
Hilo None 147 335 286 256Early 220 142 132 165Late 123 167 137 142
Kapaa None 317 329 294 313Early 158 220 165 181Late 382 243 220 282
Ha1ii None 223 179 223 208Early 124 131 110 122Late 102 106 92 100
Mo1okai None 123 115 92 110
Koko None 114 131 116 120
Lua1ua1ei None 90 92 100 94

TABLE XVII. INFLUENCE OF VARIOUS TIMES OF PHOSPHORUS AND LIMEAPPLICATION ON ALUMINUM CONCENTRATIONS DURING 24 DAYS
OF PLANT GROWTH. KOA HAOLE (1. GLAUCA) GROWNIN POTS FROM SEEDS IN SIX DIFFERENT SOILS
86
Soil Lime Time of phosphorus applicationapplication Early Intermediate Late Mean
ppm. ppm. ppm. ppm.
Hilo None 114 121 98 111Early 74 67 80 74Late 75 74 80 76
Kapaa None 91 105 92 I 96t
Early 76 69 75 73Late 74 82 88 81
Halii None 113 103 79 98Early 58 61 72 64Late 55 74 89 73
Molokai None 129 109 95 III
Koko None 84 68 77 76
Lualualei None 84 75 101 87

TABLE XVIII. PHOSPHORUS AND ALUMINUM STATUS IN SUDAN GRASS AND KOA HAOLE (l... GLAUCA), GROWNSUCCESSIVELY, IN SIX DIFFERENT SOILS WITH VARIOUS LIME AND PHOSPHORUS TREATMENTS
Sudan grass Koa haole% uti1i- Al concen- % uti1i- Al concen-
Lime zation tration zation trationSoil t:reat- P yield of added (ppm. Al Al yield P yield of added in plants Al yield
ment (mg. p/pot) phos- in (mg. A1/pot) (mg. pi phos- (ppm. Al (mg. Allphorus dry weight pot) phorus in dry pot)
matter
Hi10 Un 1imed 0.26 0.01 256 0.08 1.10 0.001 111 0.06Limed 0.49 0.63 154 0.08 1.15 0.001 75 0.05
Kapaa Un1imed 0.23 0.12 313 0.10 1.23 0.011 96 0.06Limed 0.32 0.15 232 0.09 1.25 0.010 77 0.06
Ha1ii Un1imed 0.44 0.44 208 0.09 1.35 0.029 98 0.07Limed 0.53 0.64 111 0.06 1.34 0.029 69 0.05
Mo10kai Un1imed 0.54 0.60 110 0.06 1.47 0.442 111 0.06
Koko Un1imed 2.81 0.92 120 0.16 1. 71 0.116 76 0.05
Lua1ua1ei Un1imed 2.24 2.41 94 0.13 1. 73 0.480 87 0.05
Plants grown in six soils without phosphorus or lime
Hi10 - 0.19 - 472 0.08 1.10 - 117 0,06
Kapaa - 0.18 - 358 0.07 1.10 - 103 0.07
Ha1ii - 0.26 - 400 0.13 1.16 - 94 0.07
Mo10kai - 0.34 - 163 0.06 1.32 - 66 0.05
Koko - 2.65 - 151 0.21 1.49 - 71 0.04
Lua1ua1ei - 1.81 - 246 0.32 1.55 - 70 0.04
(Xl-...J

88
TABLE XIX. INFLUENCE OF VARIOUS TIMES OF PHOSPHORUS AND LIMEAPPLICATION ON THE "A" VALUE OF FRIED AND DEAN. SUDAN
GRASS FOLLOWED BY KOA HAOLE (1,. GLAUCA) GROWN IN parsFOR 21 AND 24 DAYS, RESPECTIVELY
Soil Lime Time of P "A" value (ppm. P in soil*)series application application Sudan grass Koa haole
Hilo None E 7820 241000" T 6410 162000.1.
" L 561 204000Early E 66 263000
" I 119 284000" L 83 153000
Late E 100 148000" I 112 153000" L 89 135000
Kapaa None E 4140 25800" I 4350 21600" L 2690 20400
Early E 228 18600" I 405 16600" L 307 16400
Late E 578 58100" I 618 22400" L 249 65500
Halii None E 145 7220" I 157 8540" L 101 5990
Early E 157 6320" I 117 7300" L 86 7400
Late E 114 11400" I 111 8540" L 58 6240
Mo10kai None E 194 813
" I 84 305
" L 129 887
Koko None E 477 2300" I 486 2660II L 445 2460
Lualualei None E 123 640" I 111 595" L 103 494
E Early applicationI Intermediate applicationL Late application
* Values expressed as oven dry soil basis

89
The treatments and results from the extractable (O.02N H2S04)
phosphoru~ and pH values in soils after the harvest of Koa haole (long-,
term extraction) are shown in Table XX.
Experiment III. (Discussion)
Short-term extraction. Phosphorus yields in Sudan grass grown en-
tire1y in sand culture were higher than those in plants grown in contact
with soils with phosphorus treatments. Similar results were also obtained
using vermiculite culture in experiment I. The evidence suggested that
Sudan grass lost phosphorus when the root system was placed in contact
with soils having high fixation capacity.
The extreme unavailability of early applied phosphorus in the Halii
soil is probably related to abundance of the small nodules which con-
stitute a large fraction of the soil, These nodules react with relative
slowness at first because of the small surface area which they present.
Thus, in the Halii soil, late applied P was taken up by plants in
relative abundance compared with uptake from the amorphous Hi10 soil, or
with that from the less nodular Kapaa soil. However, as time progressed,
phosphorus evidently penetrated the nodules of the Halii soil and became
positionally unavailable so that utilization of fertilizer P declined
sharply in comparison with that from the other soils.
Less than 1% of the fertilizer P was utilized by Koa haole grown in
all six soils. In certain instances no fertilizer P was detected in the
Koa haole plants. During harvesting it was observed that the root system
in Koa haole was very poorly developed as compared with Sudan grass.
This poor root growth may be on account of toxic effects of aluminum.
Low uptake of fertilizer phosphorus in Koa haole tops may also result
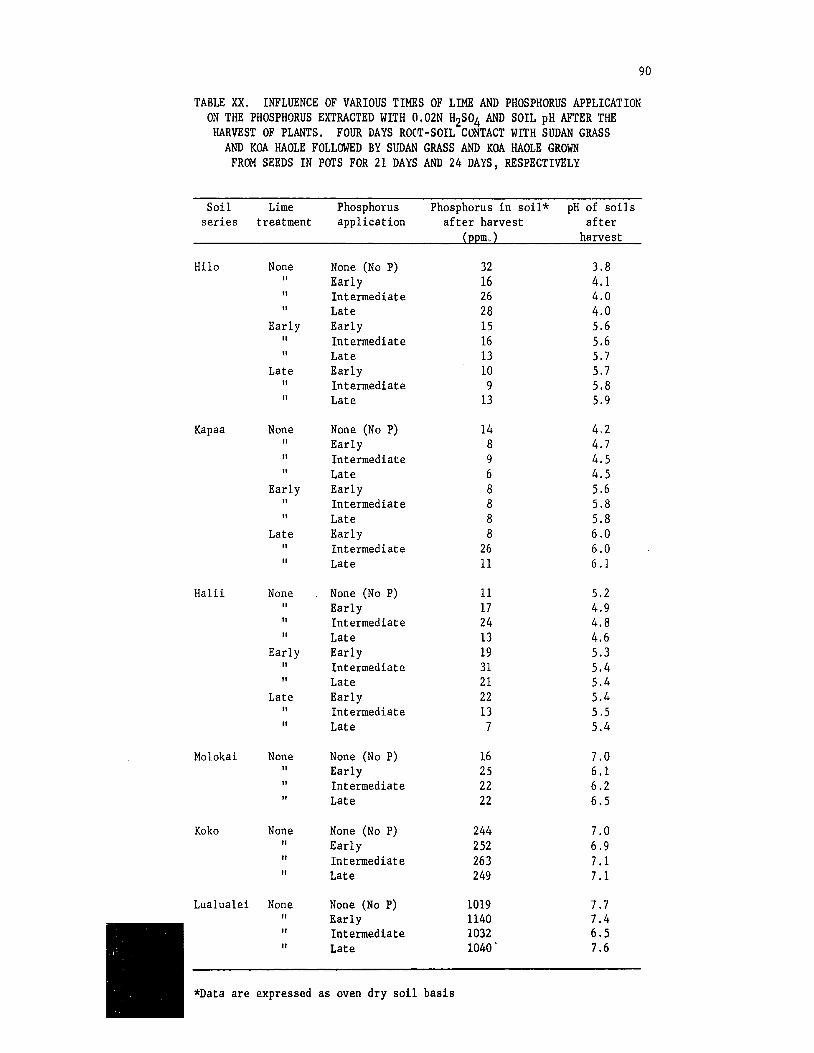
90
TABLE XX. INFLUENCE OF VARIOUS TIMES OF LIME AND PHOSPHORUS APPLICATIONON THE PHOSPHORUS EXTRACTED WITH O.02N H2S04 AND SOIL pH AFTER THE
HARVEST OF PLANTS. FOUR DAYS ROcrr-SOIL CONTACT WITH SUDAN GRASSAND KOA HAOLE FOLLOWED BY SUDAN GRASS AND KOA HAOLE GROWN
FROM SEEDS IN pars FOR 21 DAYS AND 24 DAYS, RESPECTIVELY
Soil Lime Phosphorus Phosphorus in soi1* pH of soilsseries treatment application after harvest after
(ppm, ) harvest
Hilo None None (No P) 32 3.8" Early 16 4.1" Intermediate 26 4.0" Late 28 4.0
Early Early 15 5.6" Intermediate 16 5.6" Late 13 5.7
Late Early 10 5.7" Intermediate 9 5.8" Late 13 5.9
Kapaa None None (No P) 14 4,2" Early 8 4.7" Intermediate 9 4.5" Late 6 4.5
Early Early 8 5.6" Intermediate 8 5,8" Late 8 5.8
Late Early 8 6.0" Intermediate 26 6.0" Late 11 6.1
Halii None None (No P) 11 5.2" Early 17 4.9" Intermediate 24 4.8" Late 13 4.6
Early Early 19 5.3" Intermediate 31 5.4" Late 21 5.4
Late Early 22 5.4" Intermediate 13 5,5" Late 7 5.4
Mo10kai None None (No P) 16 7.0" Early 25 6.1" Intermediate 22 6.2" Late 22 6.5
Koko None None (No P) 244 7.0" Early 252 6.9" Intermediate 263 7.1" Late 249 7.1
Lua1ua1ei None None (No P) 1019 7,7" Early 1140 7.4" Intermediate 1032 6.5" Late 1040' 7.6
*Data are expressed as oven dry soil basis

91
from the precipitation of phosphorus in or on the plant roots, Wright
(1937) noted that the gross appearance of roots grown in phosphorus
deficient and aluminum-toxic solution cultures was very similar to each
other. The roots were severely stunted, brittle, and reddish-purple in
color. He concluded that aluminum caused phosphorus deficiency by pre
cipitating phosphorus in the plant roots,
A plot of aluminum accumulation versus utilization of fertilizer P
by the Sudan grass indicates that aluminum accumulation above about 120
ppm. may depress phosphorus uptake (Figure 19). The close relationship
between fertilizer P remaining in solution after 2 days and fertilizer P
uptake by the plant indicated that factors such as aluminum accumulation
and differential root growth did not seriously influence the short-term
extraction of P by Sudan grass (Figure 20). It is easy to see from
Figures 25 and 26 why liming to pH 6,0 so dra,stically reduced short-term
P ~?take from the Halii soil by the Sudan grass; however, field results
indicate that time may change the nature of crop response to lime (Younge
and Moomaw, 1960).
Long-term extraction. The response as a result of phosphorus treat"
ments as expressed by plant yields was more pronounced in plants grown
in soils deficient in phosphorus. Higher yields were probably the result
of increased phosphorus concentration in the plants and high phosphorus
yield was certainly the result of high plant yield and phosphorus concen
tration. Increased yields of Sudan grass and Koa haole were also
associated with the decreased aluminum concentrations in plants. This
is substantiated from Figures 21 and 22 where it is shown that decreasing
aluminum concentration was associated with increasing phosphorus yields

2.6
.,2.2:>
0:0:z:....,0 1.8:z:...0..0
1.40c...0
z 1.00i=cNJi= 0.6:>
~
0.2
SUOAN GRASS GROWN FROM
SEED IN SOIL FOR 21 DAYS
* MEAN VALUE
92
80 120 160 200 240 280 320
PLANT ALUMINUM (PPM)
FIGURE 19, RELATIONSHIP BETWEEN PERCENT UTILIZATION OF ADDEDPHOSPHORUS AND PLANT ALUMINUM IN SUDAN GRASS GROWN FROM
SEED IN SOIL FOR 21 DAYS

100.0
lIII
~Q
N
II:1&1llLclz 10.0oi=::l..JoII)
~
ClZZC2 1.01&1II:
II)
::lII:o:z:4II)
o:z:4-
Q
~ 0.1ocl
•
/~
o
•
•
o
o
o
PHOSPHORUS EXTRACTION BY
SUDAN GRASS DURING 4 DAYS
r ao.B9l*
o UNLIMED SOIL
• LIMED SOIL (EARLY)
93
0.1 1.0 10.0 100.0
PHOSPHORUS IN PLANT FROM FERrlLIZER (% OF TOTAL)
FIGURE 20. RELATIONSHIP BETWEEN PHOSPHORUS SOLUBILITY IN SOILWATER SYSTEMS AND PHOSPHORUS TAKEN UP BY PLANTS DURING
4 DAYS
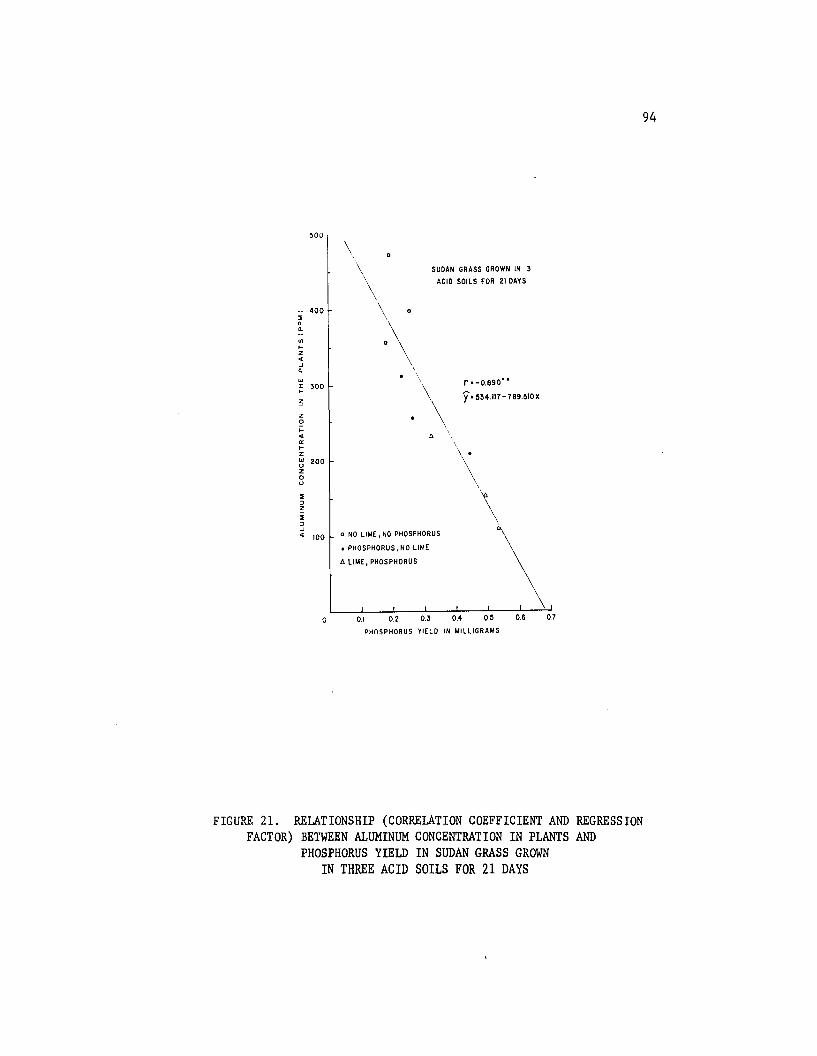
SUDAN GRASS GROWN IN 3
ACIO SOILS FOR 210AYS
500
- 400:I0.0.-'"I-Z«.J0.
"':r 300I-
,;
Z0
I-«a:I-z"' 200uz0u
:I::lZ
:I::l.J« 100
\\\
:\\\
\
o NO LIME, NO PHOSPHORUS
• PHOSPHORUS. NO LIME
t. LIME, PHOSPHORUS
r '-0.890"
y. ~34.117-789.~IOX
94
o 0.1 0.2 0.3 0.4 O.~ 0.6
PHOSPHORUS YIELD IN MILLIGRAMS
07
FIGURE 21. RELATIONSHIP (CORRELATION COEFFICIENT AND REGRESSIONFACTOR) BETWEEN ALUMINUM CONCENTRATION IN PLANTS AND
PHOSPHORUS YIELD IN SUDAN GRASS GROWNIN THREE ACID SOILS FOR 21 DAYS

140
LEUCAENA GLAUCAIKOAHAOLE) GROWN
IN 3 ACID SOILS FOR 24 DAYS
95
:IQ.t 120lJltZ<toJQ.
'":I:t-
~ 100zoi=<ta:tz'"ozoo 80
:IIjzijoJ<t
60
0.9
r --0.568 (N.S.!
'"Y- 206.568 -93.98 X
o
AA
o NO LIME,NO PHOSPHORUS A
• PHOSPHORUS, NO LIME
A LIME, PHOSPHORUS
1.0 1.1 1.2 1.3 1.4 1.5
PHOSPHORUS YIELD IN MILLIGRAMS1.6
FIGURE 22. RELATIONSHIP (CORRELATION COEFFICIENT AND REGRESSIONFACTOR) BETWEEN ALUMINUM CONCENTRATION IN PLANTS AND
PHOSPHORUS YIELD IN KOA HAOLE (1. GLAUCA)GROWN IN THREE ACID SOILS FOR 24 DAYS
96
in Sudan grass and Koa haole. This trend was in general pronounced when
lime was applied in conjunction with phosphorus. Similar results were
also obtained by Hartwell and Pember .(1918) with barley and rye grown on
acid soils. The increased plant growth was attributed to the reduction
of "ac.tive aluminum" in acid soils with both lime and phosphorus treatmen~:s.
Mirasol (1920) grew sweet clover on a strongly acid soil and concluded
that liming greatly increased plant growth, and phosphorus was beneficial~
but the combination of the two gave the best plant growth. Similar bene
ficial effects of lime and phosphorus treatments were reported by Rixon
(1962). Clements (1962) found progressively lower aluminum concentrations
at the bottom node of sugar cane with increasing rates of coral stone ap"
pli~ations. Average data showed that higher rates of phosphorus appli
cation did not change the aluminum content of the bottom node.
Burgess and Pember (1923) found that the phosphorus content of plant
tops was much higher when grown on limed soil than on acid soil. They
concluded that the beneficial effect of large applications of phosphorus
in correcting aluminum toxicity takes place within the plant, rather
than in the soil. Whether the addition of phosphorus and lime precipi
tates the aluminum in the soil or in the plant it is clear that with
such treatments it is possible to reduce the aluminum content and increase
the phosphorus status in plant tops. Phosphorus yields were greatl.y in
creased in plants on account of lime and phosphorus treatments in the
Hilo soil when compared to the other two acid representatives. Thi.s may
be related to the observation that a small increment of lime reduced
considerably the soluble and exchangeable (extractable) aluminum in Hilo
97 .
soil as compared with Kapaa and Halii soils receiving the same treatment.
At pH 6.0; least amount of extractable aluminum was obtained in the Hilo
soil as compared to the Kapaa and Halii soil (Table XXI). Three acid
soils were brought up to pH 6.0 by liming before planting.
A close: relationship (r =0.861**) exists between the P yields in
Sudan grass and P yields in Koa haole (Figure 23). Similar but inverse
relationship exists between aluminum yields of the two plant species
(r = -0.534*). This may be explained as follows: Phosphorus yields are
inversely related to aluminum yields in the two plant species. Dif
ferences in aluminum content between the two plant species (Sudan grass
and Koa haole) may be due to the inherent characteristics of the two
plant species. The inverse relationship in aluminum yields between the
two plant species may be due to lower translocation of aluminum from the
roots to the upper parts of plants. From the literature it seems certain
that most of the aluminum which becomes associated with plant roots stays
there and very little aluminum is translocated to the tops of most plants,
regardless of the intensity of aluminum injury. Plucknett (1961) found
with staining technique considerable amounts of aluminum accumulations
in the Koa haole roots.
Application of lime to three acid soils increased the fertilizer
phosphorus utilization by Sudan grass and especially so in plants grown
in Hilo soil. It does not seem likely that phosphorus solubility dif
ferences account for all of the very large effect of lime on fertilizer
phosphorus uptake from the Hilo soil. Ragland and Coleman (1959) demon
strated that root development of grain sorghum in aluminum-clay systems
was retarded greatly unless 80% of the permanent soil charge was

TABLE XXI. INFLUENCE OF RATES OF Ca(OH)2 APPLICATION AND TIMEOF EQUILIBRATION ON SOIL pH, ALUMINUM STATUS AND
IMMOBILIZATION OF ADDED PHOSPHORUS BY FOURACID SOILS OF HAWAII
98
Ca (OH)2' Added P remaining inSoil (CaC03 equiv- pH Al+t+ soil solution (%)
series alent) Extractable Aluminum 1-hour 48-hourparts/lOOO (IN BaC12) in soil equili- equili-
Al ppm. solution; bration brationin soil ppm.*
Hilo 0 3.8 428 4.4 0.6 0.062 4.8 184 0.2 1.0 0.164 5.2 83 0.0 1.6 0.245 5.4 14 0.0 0.9 0.2E9 6.1 11 0.0 1.0 0.27
15 7.0 11 0.0 0.9 0.24
Kapaa 0 4.8 295 0.1 1.9 0.171.5 5.3 134 0 2.7 0,383 5.4 106 0 3.3 0.437 6.2 61 0 3.5 0.23
10 6.6 22 0 4.0 0.2413 7.0 0 0 1.9 0.56
Ha1ii 0 5.3 269 0.4 36.3 2.650.5 5.4 136 0.2 37.6 3.021 5.7 110 0.1 38.8 2.972 5.8 65 0 33.7 2.514 6.1 13 0.1 19.1 1.676 6.4 11 0 12.6 1. 24
10 7.0 5 0 28.6 3.26
Pauwe1a 0 5.0 162 0,4 23.0 1. 800.5 5.6 55 0.3 30.5 2.581 5.8 33 0.2 32.4 2.212 6.2 19 0.2 30.5 2.235 6.8 7 0.1 17.8 1.117 7.2 8 0.0 15.4 1.04

99
1.8RELATIONSHIP OF PHOSPHORUS YIELD
OF TWO PLANT SPECIES•
1.7 •l/)
::Icl
ffi 1.6..J..J
i;;; I.ll..J0 •clXcl~ 1.4
~
c •..J •!!! 1.3>-l/) • r· 0.861**:::l •a:
1'1.1679+0.18911 X .~ 1.2II,etl •0:rII,
1.1 ,.
1.°0"----0.L..ll-----l1.0--..LI.Il--2..L.0--2.1.-.11--3L...0-·-i1l
PHOSPHORUS YIELD IN SUDAN GRASS (MILLIGRAMS)
FIGURE 23. RELATIONSHIP (CORRELATION COEFFICIENT AND REGRESSIONFACTOR) BETWEEN PHOSPHORUS YIELD IN SUDAN GRASS AND KOA
HAOLE <1,. GLAUCA) GROWN SUCCESSIVELYIN SIX DIFFERENT SOILS

100
neutralized. In addition; the effects of aluminum on root growth and on
phosphorus uptake are probably accumulative; thus, the Sudan grass roots
may be able to extract phosphorus effectively from the unlimed soils during
initial root-soil contact before aluminum uptake becomes critical,
The small amount of fertilizer phosphorus and the large amount of
aluminum taken up by Sudan grass from the Kapaa soil in relation to the
Hilo soil can be explained by the effect of lime on the aluminum status
of the soil. Liming to pH 5.4 was sufficient to reduce the exchangeable
(extractable) aluminum to 0.2 m.e./lOO g. (14 ppm,) in the Hilo soil to
accomplish the same thing in the Kapaa soil required liming the soil to
pH 6.6.
Modifying the active aluminum status of seils by liming (Figure 24)
had a beneficial effect on phosphorus solubility (Figures 25 and 26);
which was in turn related to phosphorus uptake by plants (Figure 20).
Results indicated that phosphorus applied prior to liming was as available
to plants as phosphorus which reacted with the soil after lime was applied.
In this respect the hypothesis that. phosphorus applied to the soil before
liming will form a complex with the solid phase which may become inacces
sible to plant roots when aluminum from solution is precipitated on the
solid phase by liming, was not substantiated.
High "A" values in the early applied phosphorus treatments may be
explained in terms of time of equilibration. Phosphorus applied early
had longer time to react with the various oxides, hydroxides, and clay
minerals in the soil and the immobilization of the added phosphorus was
~ore complete than when phosphorus was applied late. This trend in

101
6
0'0 50
"LU o ORIGINAL SOILS:i • AFTER LIMING
4*MEANCl: VALUE
LUoJal :3Cl:l-t.>Cl:ll:I-
2xLU
N
t.> •0al ·0
• •
04.0 5.0 7.0 8.0 9.0
SOIL pH
FIGURE 24. RELATIONSHIP BETWEEN SOIL pH AND ALUMINUMEXTRACTED WITH IN BaC1 2
,..

.-,,-
1/I
II
.fII,II
cl
I HOUR EQUILIBRATION
TIME
........ ''l{AUWELA
\\\\\\\\\\\\\\
\\ ,,
''0
102
~.O
SOIL pH
6.0 7.0
FIGURE 25. INFLUENCE OF VARIOUS RATES OF LIMING ON THE RETENTIONOF PHOSPHORUS BY FOUR ACID SOILS AFTER I-HOUR EQUILIBRATION

KAPAA--- .... --_ .....-..Q.._-~~o", ..... - .... 0
/)J HILO;/::-.--- ......
3.0
zoI::JoJoVI
~ 2.0(!)
zz<:lUIII::
VI::JII::oJ:~ 1.0oJ:n.oUIoo«
4.0
;:r-/
I/
I 0I
I PAUWELAI
tI
6
48 HOURS EQUILIBRATION
TIME
5.0\
·SOIL pH
""\\\\\\\\\\\\\\\,
6.0 7.0
103
FIGURE 26. INFLUENCE OF VARIOUS RATES OF LIMING ON THE RETENTIONOF PHOSPHORUS BY FOUR ACID SOILS AFTER 48-HOUR EQUILIBRATION

104
general was very consistent when ,~" values were determined by Sudan
grass. It seems certain that high "A" values were not associated with an
increase in the availability of soil phosphorus but was related to the ex~
tremely high rates of phosphorus fixation.
Seed phosphorus was usually greater than the phosphorus content of
plant tops. Thus it is possible that essentially all of the plant phos
phorus was derived from the seed. I~" values determined by Koa haole
were extremely high but phosphorus content of the Koa haole were not
correspondingly high. Therefore, high J~" values, especially in the acid
soils, probably were related to the amount of seed phosphorus which was
being carried into the plant tops and was therefore not being dis
tinguished from soil phosphorus. Plant yields obtained from the neutral
or slightly alkaline soils were better than those from the acid soils and
seed phosphorus was evidently diluted considerably in the neutral or al
kaline soils. Therefore, the "A" values were lower in the three neutral
or slightly alkaline soils. Seed phosphorus may have also contributed to
the high I~" values in the Sudan grass but not to the same extent as in
Koa haole.
Laboratory Experiments (Results)
Phosphorus fixation st~ldies. The efficiency of applied fertilizer
is of great importance in instances where the supply of phosphorus nutrient
limits plant growth. Low recovery of added phosphorus has led many workers
to study the problem of phosphorus fixation. Evidence showed that the rate
of immobilization of added phosphorus is a serious problem in most
Hawaiian soils. The present study was undertaken to obtain information
on the mode of phosphorus fixation in diverse soil systems.
105
The percentage of applied phosphorus remaining in soil solution
decreased considerably in all soils within 5 minutes (Figure 27). The
fixation process in the Hilo and Kapaa soils was very rapid for the first
5 minutes and continued at a rapid rate for 48 hours. The most striking
results were obtained from Hilo soil where less than 1% of the added
phosphorus remained in soil solution at the end of 15 minutes (Figure 27).
Rates of phosphorus fixation in the Halii, Pauwela j Molokai, Koko, and
Lualualei soils were slower than in the Hilo and Kapaa soils. Pauwela
Molokai, and Koko soils showed almost the same rate of fixation of the
applied phosphorus for a period of 15 minutes; but after 1 hour of
equilibration the Molokai and Koko soils had almost twice as much phos
phorus remaining in solution, as compared with the Pauwela soil. However,
at the end of 4 days, the amount of fertilizer phosphorus remaining in
solution in the soil was again identical for both the Molokai and Pauwela
soils but not for Koko soil. The rates of immobilization of added phos
phorus was much lower in Lualualei than the other six soils studied.
Phosphorus fixation was also studied, at two different equilibration
times, by liming the acid soils to various pH values (Figures 25 and 26
and Table XXI). The fertilizer phosphorus remaining in solution at the
48-hour equilibration was high in all soils at pH values close to 5.4.
Liming to neutrality (pH 7.0) seemed to have same merit in Kapaa and
Halii soils at the end of 2 days of equilibration.
Aluminum status in soils. Water soluble and extractable (IN BaC1 2)
aluminum in acid soils decreased with increasing pH (Table XXI). Figure
24 shows the relationship of exchangeable (BaC12
extractable) aluminum
and soil pH. Water soluble aluminum was extremely low (less than I ppm.)

106
5.0
0.5 .
,\\\\\
.......... .................
.... .... ............ ....
.... ',KAPAA,...., ,
....HILO .............
~ ...
~zof= 50.0:JoJo1/1
~
(!)
zzet::IilIJII:
1/1:JII:o:I:ll.1/1o:I:ll.
olIJg 0.05et
5 15 60 900 2880 5760
TIME (MINUTES)
FIGURE 27. IMMOBILIZATION OF PHOSPHORUS BY SEVEN HAWAIIANSOILS DURING 4-DAY EQUILIBRATION OF SOILS
WITH A PHOSPHORUS SOLlITION

l06a
in Kapaa: Halii, and Pauwela soils. The highest concentration of water
soluble aluminum was obtained from the Hilo soil (4.4 ppm.). Exchangeable
(extractable) aluminum was also highest in the unlimed Hilo soil and
lowest in the unlimed Pauwela soil. In similar treatment, Kapaa and
Halii had almost the same concentrations of exchangeable aluminum
(Table XXI).
Laboratory Experiment (Discussion)
Because of great mineralogical diversity among the seven soils
studied, as well as differences in active aluminum (ions) content,
there were very large differences in the degree to which they fixed
phosphorus. The fixation of applied phosphorus in Kapaa soil appears to
be due mostly to free oxides of aluminum and iron, The lower rates of
phosphorus fixation in the Pauwela soil are associated with dehydrated
iron and aluminum oxides, according to Chu and Sherman (1952). Dehy
drated iron and aluminum oxides are inert and do not fix added phosphorus.
The predominant mineral in Molokai soils seems to be kaolin, There can
be anionic exchange with phosphate ions and OH- ions present in kaolin.
The hydrated free oxides of iron and aluminum may also play a dominant
role in the anionic exchange of phosphate in this series.
In general, the more aluminous and less crystalline soils retained
phosphorus most strongly. Soils with 2:1 type clays fixed much less of
the added phosphorus. In general, the intensity of phosphorus fixation
for the various mineralogical systems was as follows: amorphous hydrated
oxides> goethite-gibbsite> kaolin (1: 1 clays) > montmorillonite (2~ 1
clays). Interesting features of the data presented in Figures 24 through
26 are: (1) The optimum level of liming for improved phosphorus solu-


107
bility was between pH 5.0 and 6.0. (2) The effect of lime varied greatly
on the different soils. (3) Most of the exchangeable (extractable) alu
minum was precipitated by low levels of liming on most soils, (4) Although
active aluminum ions did influence solubility of fertilizer phosphorus,
the effect of soil mineralogy apparently had a greater effect. Even
when active aluminum ion was reduced to virtually zero by liming, phos
phorus solubility in the soil differed as much as fortyfold (Figure 25).

SUMMARY
In view of the fact that most Hawaiian soils contain clay minerals
and compounds of iron and aluminum that fix added phosphorus quickly, in-
formation concerning phosphorus status of soils and soil-plant relation-
ships in the phosphorus nutrition of crops is of considerable importance.
A number of plant growth and laboratory experiments were conducted to
study phosphorus-aluminum relationships in plant nutrition.
Neutral or slightly alkaline surface soil materials from three great
soil groups, Low Humic Latosol (Molokai series), Red Desert (Koko series).
Dark Magnesium Clay (Lualualei series), were used for studies of phos,\
phorus nutrition of plants. Four acid soils belonging to the Hydrol
Humic Latosol (Hila series), Aluminous Ferruginous Latosol (Halii series).
Aluminous Ferruginous Latosol (Kapaa series), and Humic Ferruginous
Latosol (Pauwela series), were included in lime~phosphorus-aluminum
studies. The pH of the soil materials from the Hilo series was 3.8.
This is lower than normally expected under field conditions. The soil
material collected was from uncultivated land. Staghorn ferns were among
the cover plants and may have been responsible for the low soil pH. The
low soil pH may also be attributed to partial crystallization of amorphous
material. However; pH of this soil material was 3.8 shortly after it was
collected. This indicates that the pH value did not change appreciably
during storage, There is also a possibility that the soil series was
Akaka.
A short-term plant growth technique was used to extract phosphorus
from soils variously fertilized. Three rates of phoophorus) 0, 87.5, and
175 pounds phosphorus per acre, were applied to the experimental soils.
109
Nonradioactive as well as tagged sodium pyrophosphate were used as sources
of phosphorus. Phosphorus extraction by Sudan grass showed that phosphorus
concentration and phosphorus yield in plants increased with phosphorus
application. Phosphorus content of Sudan grass increased more per unit
phosphorus applied to the soil when the application rate was greatest.
Phosphorus concentration and phosphorus yield were higher in plants grown
entirely on vermiculite or sand culture than in plants transferred after
21 days to contact with soils for 5 days. Sodium pyrophosphate either ap
plied as p3l or as p32 did not change phosphorus yields significantly.
Radiochemical studies showed that less than 1% of the fertilizer phosphorus
added to the soil was utilized by Sudan grass,
An experiment was carried out in the greenhouse to determine the
availability of phosphorus and utilization of added phosphate fertilizers
from three fertilizer materials applied by two different methods. Sugar
cane was grown in four diverse soil systems. The soil materials were
from the Kapaa, Lualualei, Molokai, and Pauwela soil series. Phosphorus
was applied at the rate of 175 pounds phosphorus (400 pounds P205) per
acre on a surface area basis. Phosphorus was supplied to soils in one
installment (175 pounds P/acre) whereas the foliar application was di
vided into four equal (44 pounds P/acre) applications. Data obtained
from chemical and radio-chemical analyses were used to determine the
degree of isotope dilution.
Dry matter yields of sugar cane were distinctly different in treat
ments which lacked phosphorus and which were planted on different dates.
Higher response from added phosphorus in terms of sugar cane plant yields
was obtained from the Kapaa soil (Aluminous Ferruginous Latosol) and the
110
least response was obtained using the Lualualei soil (Dark Magnesium
Clay). Differences in plant yields of sugar cane were evidently asso
ciated with differences in phosphorus content in cane plants and in
certain cases reduction in the aluminum content in plant tops. Evidently,
less soluble superphosphate increased yields more than the highly soluble
NH4HZP04' Cane plants fertilized with K4PZ07 gave intermediate yields
but had the highest phosphorus content. Phosphate fertilizers applied
as foliar spray greatly increased the phosphorus content in the plants.
The plants contained twentyfold more phosphorus when sprayed with
NH4HZP04 than did plants receiving the same fertilizer applied to the
soil. Higher phosphorus status due to foliar spray did not change the
dry matter yields significantly. However, a relationship (r = 0.734**)
was obtained between percent utilization of added phosphorus (foliar
applied) and dry matter yield. However, increased phosphorus content in
the plants does not necessarily indicate that the phosphorus was trans
located within the plants or that the added phosphorus participated in
metabolic processes.
One of the important reactions of lime in acid soils is the replace
ment of exchangeable aluminum by calcium with the formation of Al(OH)3'
An investigation was made to ascertain the influence of liming and phos
phate fertilization on the solubility of aluminum and availability of
fertilizer phosphorus in some diverse soil systems. Soil materials from
the six soil series i.e. Hilo, Kapaa, Halii, Molokai, Koko, and
Lualualei were used in this investigation. The corresponding great soil
groups are described in the earlier paragraph. Phosphorus uptake by
Sudan grass and Koa haole (Leucaena glauca) was related to phosphorus
111
solubility and inversely related to aluminum concentrations in plants.
Inverse relationships were obtained between the aluminum concentrations
and phosphorus yields in Sudan grass and Koa haole. Significant positive
relationship was obtained between the phosphorus yields from the Sudan
grass and Koa haole grown successively in the same soil. Similar but
inverse relationship was obtained between the aluminum yields of the two
plant species. The influence of lime on fertilizer phosphorus uptake by
Sudan grass was much greater (about 15 X) when the roots were in contact
with the soil for 21 days as compared with 4-day (short-term) extraction.
This suggests side effects of aluminum on root growth and the precipi
tation of phosphorus, in or on the roots.
The phosphorus yield of sugar cane was inversely related to "A"
values (availability of soil phosphorus in relation to the added phosphate
fertilizer) of Fried and Dean. Extremely high "A" values obtained using
sugar cane and Sudan grass were evidently associated with high phosphorus
immobilization by the soil and do not represent soil phosphorus available
to the plants. Unreasonably high "A" values obtained using Koa haole are
attributed to the phosphorus supplied by the seed as well as immobilization
of added phosphorus by the soil. The basic assumptions made in calculating
"A" value evidently do not apply in soils where rate of phosphorus im
mobilization is extremely high.
Seven surface soils representing six great soil groups, were studi.ed
to obtain information on the mode of phosphorus fixation. Because of
great mineralogical diversity among these soils, as well as differences
in active aluminum content, there were very large differences in the de
gree to which they fixed phosphorus. The five Latosols immobilized 98-

112
99.5% of added phosphorus by the end of 4 days, Immobilization by two
other soils was less rapid. Phosphorus fixation by seven Hawaiian soils
was apparently related to: (1) amorphous nature of soil colloids, (2) hy
drated aluminum oxides and/or (3) active aluminum ions, Appare~tly more
aluminous and less crystalline soils retained phosphorus most strongly.
Soils with 2:1 type clays fixed much less of the added phosphorus. In
general, the intensity of phosphorus fixation for the various systems was
as follows: amorphous hydrated oxides;> goethite-gibbsite> kaolin;>
2.1 clays. Application of lime to acid soils to produce a pH of 5.5 ef
fectively precipitated much of the active aluminum ions and evidently
increased the solubility of phosphorus. From the standpoint of phosphorus
solubility; liming acid soils to a pH of about 5.5 was adequate. However,
higher rates of liming may be desirable since the root developments of
many plants (including Sudan grass) may be adversely affected by active
aluminum at somewhat higher pH.

APPENDIX
TABLE XXII.YIELD OF 3UGAR CANE (GRAMS DRY MATTER PER POT) AS INFLUENCED BY VARIOUS
PHOSPHATE FERTILIZERS AND METHODS OF PHOSPHORUS APPLICATION.PLANTS WERE GROWN IN POTS FOR 3 MONTHS IN FOUR DIFFERENT SOILS
Phosphate fertilizers usedSoil Phosphorus NH4H2P04 K4P207 Concentrated
treatment superphosphateg. g. g.
Kapaa None (check) 7 13 16Soil application 15 32 32Foliar application 19 29 31
Lualualei None (check) 12 25 23Soil application 11 24 20Foliar application 15 25 25
Molokai None (check) 9 15 18Soil application 12 19 18Foliar application 12 21 19
Pauwela None (check) 10 20 30Soil application 23 30 35Foliar application 19 29 32

114
TABLE XXIII.INFLUENCE OF VARIOUS PHOSPHATE FERTILIZERS AND METHODS OF PHOSPHORUS
APPLICATION ON PHOSPHORUS CONCENTRATION IN SUGAR CANE TOPS.PLANTS GROWN IN POTS FOR 3 MONTHS IN FOUR DIFFERENT SOILS
Phosphate fertilizers usedSoil Phosphorus NH4H2P04 K4P207 Concentrated
treatments superphosphate% % %
Kapaa None (check) 0.05 0.05 0.05Soil application 0.07 0.11 0.12Foliar application 0.19 0.34 0.21
Lua1ua1ei None (check) 0.21 0.19 0.23Soil application 0.23 0.21 0.26Foliar application 0.36 0.43 0.35
Molokai None (check) 0.12 0.09 0.11Soil application 0.17 0.14 0.15Foliar application 0.26 0.39 0.31
Pauwela None (check) 0.07 0.06 0,09Soil application 0.09 0.11 0.12Foliar application 0.20 0.36 0.26

115
TABLE XXIV.INFLUENCE OF VARIOUS PHOSPHATE FERTILIZERS AND METHODS OF PHOSPHORUSAPPLICATION ON PHOSPHORUS YIELD (P CONCENTRATION X DRY MATTER YIELD)IN MILLIGRAMS P/POT IN SUGAR CANE TOPS. PLANTS GROWN IN POTS FOR 3
MONTHS IN FOUR DIFFERENT SOILS
Phosphate fertilizers usedSoil Phosphorus NH4H2P04 K4P207 Concentrated
treatments superphosphatemgm. mgm. mgm.
Kapaa None (check) 3.77 6.94 7.50Soil application 10.67 35.04 37.40Foliar app1icatlon 34.84 98.63 64.00
Lua1ua1ei None (check) 24.31 46.31 51. 77Soil application 25.56 50.70 50.47Foliar application 52.53 106.73 86.57
Mo10kai None (check) 10.86 12.83 19.95Soil application 19.75 26.67 27.16Foliar application 30.37 83.50 57.74
Pauwe1a None (check) 6.51 11.23 25.87Soil application 20.28 31.90 40.52Foliar application 26.71 105.94 82.35

116
TABLE XXV.INFLUENCE OF VARIOUS PHOSPHATE FEKrILIZERS AND METHODS OF PHOSPHORUS
APPLICATION ON THE PERCENTAGE OF THE PLANT PHOSPHORUS DERIVEDFROM FERTILIZER DURING 3 MONTHS OF SUGAR CANZ GROWTH
IN POTS IN FOUR DIFFERENT SOILS
Phosphate fertilizers usedSoil Phosphorus NH4H2P04 K4P207 Concentrated
treatments superphosphate% % %
Kapaa Soil applicat ion 7.63 21.16 40.36Foliar application 38,26 72.63 72.75
Lua1ua1ei Soil application 14.31 28.07 36.31Foliar application 21. 97 62.56 55.66
Mo1okai Soil application 19.19 42.81 54,23Foliar application 24.84 77 .86 78.37
Pauwe1a Soil application 7.12 36.37 63.00Foliar application 26.37 75.74 58.84

117
TABLE XXVI.INFLUENCE OF VARIOUS PHOSPHATE FERTILIZERS AND METHODS OF PHOSPHORUSAPPLICATION ON THE PERCENTAGE UTILIZATION OF ADDED PHOSPHORUS DURING
3 MONTHS OF SUGAR CANE GROWTH IN POTS IN FOUR DIFFERENT SOILS
Phosphate fertilizers usedSoil Phosphorus NH4H2P04 K4P207 Concentrated
treatments Superphosphate% % %
Kapaa Soil application 0.12 1.09 2.23Foliar application 2.00 10.85 6.86
Lualualei Soil application 0.54 2.12 2.75Foliar application 1. 70 9.89 6.72
Molokai Soil application 0.55 1.67 2.18Foliar application 1.12 9.48 6.68
Pauwela Soil application 0.28 1. 70 3.62Foliar application 1.41 12.00 7.15

TABLE XXVII.INFLUENCE OF VARIOUS PHOSPHATE FERTILIZERS ON THE ,~" VALUE
OF FRIED AND DEAN, 1952. SUGAR CANE GROWN IN POTSFOR 3 MONTHS AND IN FOUR DIFFERENT SOILS
118
Phosphate fertilizers usedSoil NH4H2P04 Kl2°7 Concentrated
Superphosphateppm..Y ppm..Y ppm..Y
Kapaa 1961 581 225
Lua1ua1ei 954 381 302
Molokai 638 198 118
Pauwela 2035 275 85
l/Data are expressed as oven dry soil basis.
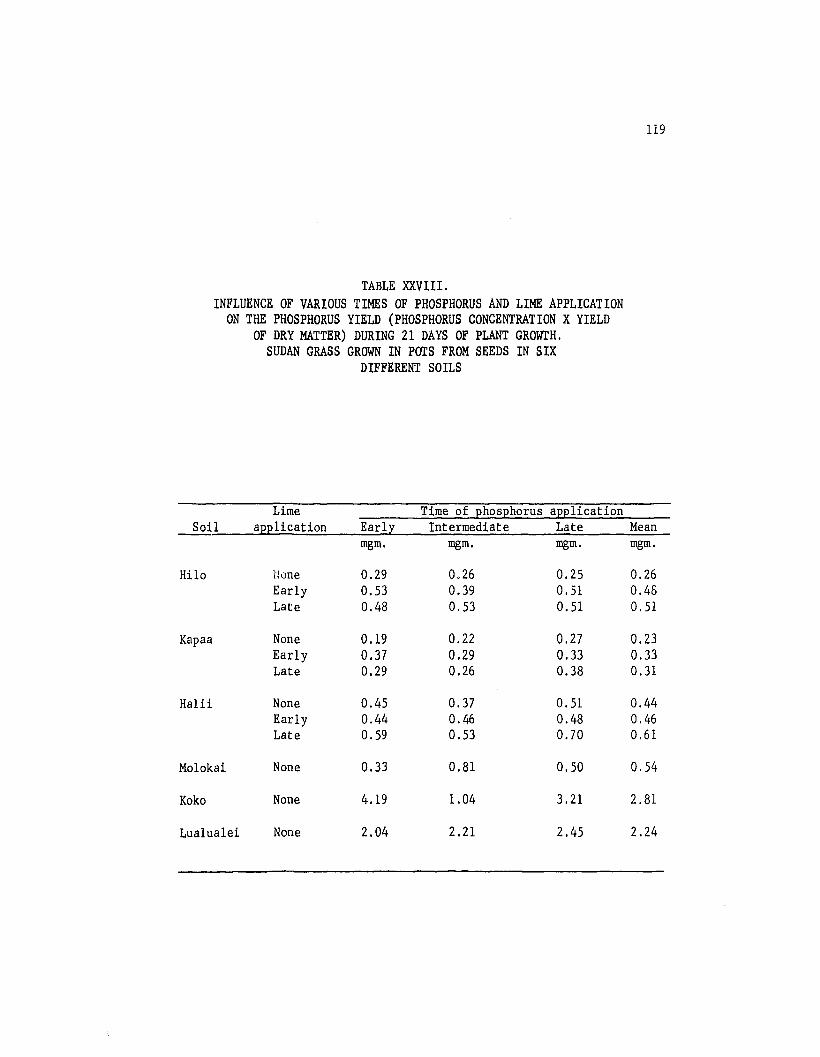
TABLE XXVIII.INFLUENCE OF VARIOUS TIMES OF PHOSPHORUS AND LIME APPLICATION
ON THE PHOSPHORUS YIELD (PHOSPHORUS CONCENTRATION X YIELDOF DRY MATTER) DURING 21 DAYS OF PLANT GROWTH.
SUDAN GRASS GROWN IN pars FROM SEEDS IN SIXDIFFERENT SOILS
119
Lime Time of phosphorus applicationSoil application Early Intermediate Late Mean
mgm. mgm. mgm. mgm.
Hilo Uone 0.29 0.26 0.25 0.26Early 0.53 0.39 0.51 0.48Late 0.48 0.53 0.51 0.51
Kapaa None 0.19 0.22 0.27 0.23Early 0.37 0.29 0.33 0.33Late 0.29 0.26 0.38 0.31
Halii None 0.45 0.37 0.51 0.44Early 0.44 0.46 0.48 0.46Late 0.59 0.53 0.70 0.61
Mo1okai None 0.33 0.81 0.50 0.54
Koko None 4.19 1.04 3.21 2.81
Lua1ua1ei None 2.04 2.21 2.45 2.24

TABLE XXIX.INFLUENCE OF VARIOUS TIMES OF PHOSPHORUS AND LIME APPLICATION
ON THE PHOSPHORUS YIELD (PHOSPHORUS CONCENTRATION X YIELDOF DRY MATTER) DURING 24 DAYS OF PLANT GROWIH.KOA HAOLE (1. GLAUCA) GROWN IN pars FROM SEEDS
IN SIX DIFFERENT SOILS
120
Lime Time of phosphorus applicationSoil application Early Intermediate Late Mean
mgm. mgm. mgm. 108m.
Hilo None 0.96 1,23 1.12 1.10Early 1.34 1.45 1.30 1.36Late 1. 45 0.25 1.12 0.94
Kapaa None 1.29 1.18 1.23 1.23Early 1.25 1.21 1.25 1.24Late 1.26 1.22 1.30 1.26
Halii None 1.67 1.15 1.23 1.35Early 1.41 1.28 1.32 1.34Late 1.25 1.41 1,34 1,34
Mo1okai None 1.19 1.52 1.68 1.47
Koko None 1.63 1.77 1.72 L 71
Lualua1ei None 1.80 1.66 1,72 1. 73

TABLE XXX.INFLUENCE OF VARIOUS TIMES OF PHOSPHORUS AND LIME APPLICATION
ON THE PERCENTAGE OF PLANT P DERIVED FROM FERTILIZERDURING 21 DAYS OF PLANT GROWTH. SUDAN GRASS GROw"N
IN POTS IN SIX DIFFERENT SOILS
121
Lime Time of phosphorus applicationSoil application Early Intermediate Late Mean
% % % %
Hilo None 0.57 0.72 1.43 0.91Early 40.06 27.39 36.91 34.79Late 30.97 28.39 32.97 30.78
Kapaa None 1.15 1.16 1.60 1.30Early 16.15 9.83 12.47 12.81Late 7.59 6.76 15.23 9.86
Halii None 23.30 22.49 30.18 25.32Early 22.39 27.71 33.70 27.93Late 28.05 28.21 43.54 33.27
M01~.ai None 18.46 34.43 25.51 26.13
Koko None 8.39 8.29 8.96 8.55
Lu<:J' .i1ei None 26,30 28.32 29.68 28.10

TABLE XXXI.INFLUENCE OF VARIOUS TIMES OF PHOSPHORUS AND LIME APPLICATION
ON THE PERCENTAGE OF PLANT P DERIVED FROM FERTILIZERDURING 24 DAYS OF PLANT GROWfH. KOA HAOLE
(1. GLAUCA) GROWN IN POTSIN SIX DIFFERENT SOILS
122
Lime Time of phosphorus applicationSoil application Early Intermediate Late Mean
% % % %
Hilo None 0.02 0.03 0.02 0.02Early 0.02 0.02 0.03 0.02Late 0.03 0.03 0.03 0.03
Kapaa None 0.18 0.22 0.27 0.22Early 0.24 0.29 0.33 0.28Late 0.11 0.20 0.11 0,14
Halii None 0.60 0.52 0,75 0.62Early 0.70 0.61 0.59 0.63Late 0.38 0.51 0.70 0.53
Mo1okai None 5.19 12.87 4.92 7.66
Koko None 1.94 1.61 1. 76 1.77
Lua1ua1ei None 6.52 7.06 8.25 7.28

TABLE XXXII.INFLUENCE OF VARIOUS TIMES OF PHOSPHORUS AND LIME APPLICATION
ON THE ALUMINUM YIELD (ALUMINUM CONCENTRATION X YIELDOF DRY MATTER) DURING 21 DAYS OF PLANT GROWTH.
SUDAN GRASS GROWN IN pars FROM SEEDSIN SIX DIFFERENT SOILS
123
Lime Time of phosphorus applicationSoil application Early Intermediate Late Mean
mgm. mgm. mgm. mgm.
Hilo None 0.05 O.ll 0.08 0.08Early O.ll 0.06 0.07 0.08Late 0.06 0.10 0.07 0.08
Kapaa None 0.09 0.10 0.12 0.10Early 0.07 0.08 0.06 0.07Late 0.14 0.07 0.10 0,10
Halii None 0.10 0.07 0.11 0.09Early 0.06 0.06 0.05 0.06Late 0.05 0.06 0,07 0,06
Molokai None 0.05 0.08 0.05 0.06
Koko None 0,18 0.10 0,18 0,16
Lualualei None 0.12 0.12 0.14 0,13

TABLE XXXIII.
INFLUENCE OF VARIOUS TIMES OF PHOSPHORUS AND LIME APPLICATIONON THE ALUMINUM YIELD (ALUMINUM CONCENTRATION X YIELD
OF DRY MATTER) DURING 24 DAYS OF PLANT GROWTH.KOA HAOLE (1. GLAUCA) GROWN IN pars
FROM SEEDS IN SIX DIFFERENT SOILS
124
Lime Time of phosphorus applicationSoil application Early Intermediate Late Mean
mgm. mgm. mgm. mgm.
Hilo None 0.06 0.07 0.06 0.06Early 0.05 0.06 0.06 0.06Late 0.06 0.05 0.05 0.05
Kapaa None 0.06 0.06 0.06 0.06Early 0.06 0.05 0.05 v.05Late 0.05 0.06 0.06 0.06
HaJ i.i None 0.09 0.07 0.06 0.07Early 0.04 0.05 0.05 0,05Late 0.04 0.06 0.07 0.06
Molokai None 0.06 0.06 0,07 0.06
Of) None 0.06 0.05 0.06 0.05
Lua1ualei None 0.05 0.04 0.06 0.05

TABLE XXXIV.INFLUENCE OF REACTION TIME ON THE IMMOBILIZATION OF ADDED
PHOSPHORUS BY SEVEN HAWAIIAN SOILS. DATA ARE EXPRESSEDAS PERCENTAGE OF P REMAINING
IN SOIL SOLUTION
125
Soil Time of equilibrationseries 5 15 1 15 2 4
minutes minutes hour hours days days% % % % % %
Hilo 3.3 0.8 0.6 0.2 0.06 0.05
Kapaa 17.4 3.6 1.7 0.6 0.17 0.14
HaUi 52.5 41.4 36.3 8.1 2.65 3.04
Pauwe1a 44.7 36.0 16.2 3,2 1.80 2.03
Mo10kai 45.9 36.6 25.4 8.5 4.0 2.24
Koko 47.2 33.5 26.0 11.0 9.3 4.98
Lua1ua1ei 61.2 54.5 53.3 30,9 27.7 21. 01

TABLE XXXV.RELATIONSHIP BETWEEN ALUMINUM CONCENTRATION IN SUDAN GRASS
AND PHOSPHORUS TAKEN UP FROM FERTILIZER IN SIXDIFFERENT SOILS. SUDAN GRASS GROWN
IN pars FOR 21 DAYS
126
Soil Soil %utilization of Al in plant Al in soil solutionseries pH added P by Sudan grass (ppm. ) (ppm. )
Hila 3.8 0.01 256 4,86.2 0,63 154 0,1
Kapaa 4,8 0.12 313 3,36.4 0.15 232 0,5
Halii 5.3 0.44 208 3,06.0 0.64 111 0.1
Mo10kai 7.0 0.60 110 0,4
Koko 7,1 0.92 120 0.1
Lua1ualei 7.8 2.41 94 0.1

BIBLIOGRAPHY
Aguiar, Fernando Queiroz de Barros. 1958. Some aspects of the leafabsorption of phosphorus (study with p32). Bot. Soc. Portuguesa.Cienc. Nat. 7(2): 83-105.
Army: T. J.,andE. V. Miller. 1959. Effect of lime, soil type, and soiltemperature on phosphorus nutrition of turnips grown on phosphorusdeficient soils. Agron. Jour. 51: 376-378.
Arnon, D. I., P. R. Stout, and F. Sipos. 1940, Radioactive phosphorusas an indicator of phosphorus absorption of tomato fruits at variousstages of development. Am. J. Botany. 27: 791-798.
Asen, S., S. H. Wittwer, and O. N. Hinsvark. 1953. Foliar absorptionand translocation of radio-phosphorus by Chrysanthemum morifolium.Proc. Amer. Soc. Hort. Sci. 62: 466-470.
Aufhammer, G., and M. Hopfengart. 1952.absorption by the leaves of cereals.
Investigations on mineral-saltZ. Pflbau. Pflschatz. 3: 241-246.
Ayres, A. s. 1934. Phosphate fixation in Hawaiian Soils - II. HawaiianPlanters' Rec. 38: 131-145.
Ayres, A. S. 1961, Liming Hawaiian sugarcane soils. Hawaiian Planters'Rec. 56(3): 227-244.
Barnes" E. E., C. A. Lamb, and G. W. Volk. 1960. Effect of lime leveland soil pH on selected crops and their response to phosphate andmanure. Ohio Agric. Expt. Sta. Res. Bull. 862: pp. 27.
Barrier, G. E., and W. E. Loomis. 1957. Absorption and translocation of2,4-dichlorophenoxyacetic acid and p32 by leaves. Plant Physiol.32: 225-231.
Biddulph, O. 1941. Diurnal migration of injected radiophosphorus frombean leaves. Amer. J. Botany. 28: 348-352.
Biddulph, 0., and J. Markle. 1944. Translocation of radiophosphorus inthe phloem of the cotton plant. Amer. J. Botany 31: 65-70.
Biddulph, Susann F. 1956. Visual indications of S35 and p32 translocationin the phloem. Amer. J. Botany 43: 143-148.
Black, C. A. 1942. Phosphate fixation by kaolinite and other clays asaffected by pH, phosphate concentration and time of contact. SoilSci. Soc. Amer. Proc. 7: 123-133,
Boroughs, Howard, Cesar Labarca, and Armindo Cardoso. 1961. The use ofwetting agents in foliar nutrition. Tenth Pacific Science Congress,Honolulu, Hawaii. Abstracts of Symposium Paper. 11-12.
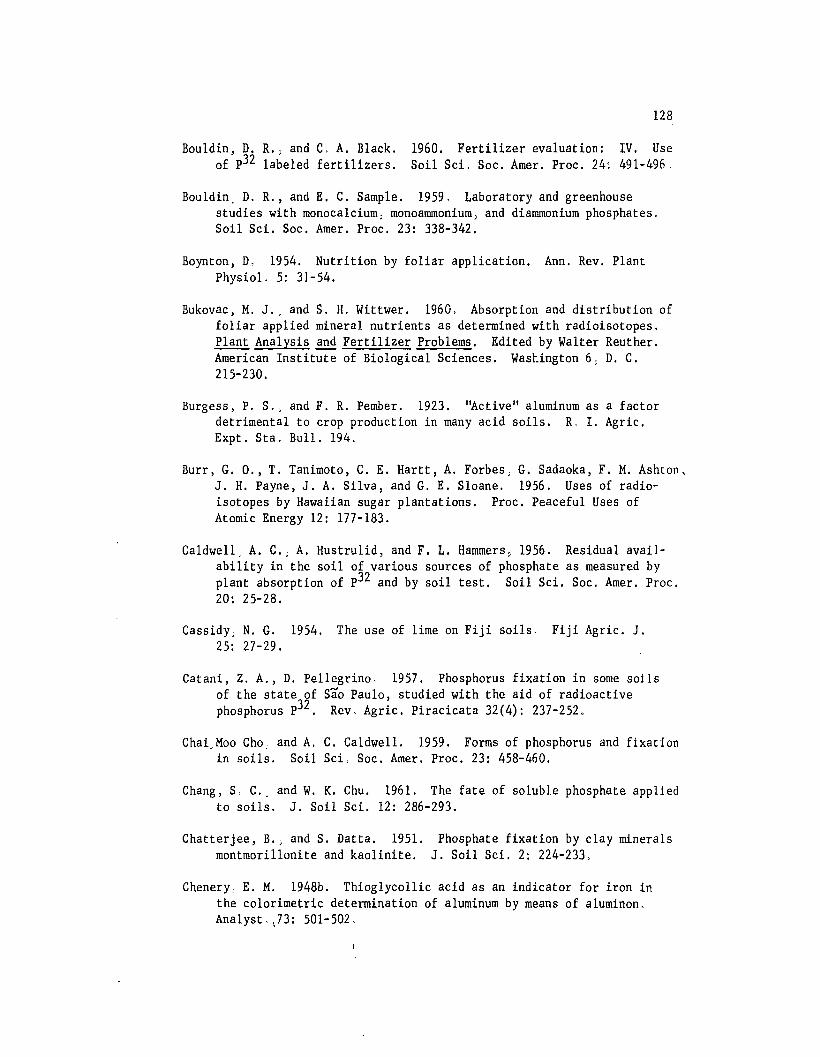
Bouldin, D. R., and C, A. Black.of p32 labeled fertilizers.
128
1960. Fertilizer evaluation: IV. UseSoil Sci. Soc. Amer. Proc. 24: 491-496.
Bouldin, D. R., and E. C. Sample. 1959, Laboratory and greenhousestudies with monocalcium; monoammonium, and diammonium phosphates.Soil Sci. Soc. Amer. Proc. 23: 338-342.
Boynton, D, 1954. Nutrition by foliar application. Ann. Rev. PlantPhysiol. 5: 31-54.
Bukovac, M. J.; and S. H. Wittwer. 1960, Absorption and distribution offoliar applied mineral nutrients as determined with radioisotopes.Plant Analysis and Fertilizer Problems. Edited by Walter Reuther.American Institute of Biological Sciences. Wastington 6, D. C.215-230.
Burgess, P. S" and F. R. Pember. 1923. "Active" aluminum as a factordetrimental to crop production in many acid soils. R, I. Agric.Expt. Sta. Bull. 194.
Burr, G. 0., T. Tanimoto, C. E. Hartt, A. Forbes) G. Sadaoka, F. M. Ashton,J. H. Payne, J. A. Silva, and G. E. Sloane. 1956. Uses of radioisotopes by Hawaiian sugar plantations. Proc. Peaceful Uses ofAtomic Energy 12: 177-183.
Caldwell, A. C.; A. Hustrulid, and F. L. Hammers, 1956. Residual availability in the soil of various sources of phosphate as measured byplant absorption of p32 and by soil test. Soil Sci. Soc. Amer. Proc.20: 25-28.
Cassidy; N. G. 1954. The use of lime on Fiji soils, Fiji Agric. J.25: 27-29.
Catani, Z. A., D. Pellegrino. 1957. Phosphorus fixation in some soilsof the state of Sao Paulo, studied with the aid of radioactivephosphorus p32 . Rev, Agric. Piracicata 32(4): 237-252,
Chai,Moo Cho, and A. C. Caldwell. 1959. Forms of phosphorus and fixationin soils. Soil Sci, Soc. Amer. Proc. 23: 458-460.
Chang, S, C.; and W. K. Chu. 1961. The fate of soluble phosphate appliedto soils. J. Soil Sci. 12: 286-293.
Chatterjee, B.) and S. Datta. 1951.montmorillonite and kaolinite.
Phosphate fixation by clay mineralsJ. Soil Sci. 2: 224-233,
Chenery. E. M. 1948b. Thioglycollic acid as an indicator for iron inthe colorimetric determination of aluminum by means of aluminon,Analyst, \73: 501-502.

I\.
129
Chu, Ada C., and G. Donald Sherman. 1952. Differential fixation ofphosphate by typical soils of the Hawaiian great soil groups.Univ. of Hawaii Agric. Expt. Sta. Tech. Bull. 16, pp. 20.
Clements~ Harry F. 1958. Recent developments in the crop logging ofsugar cane--phosphorus and calcium. Univ. of Hawaii Agric. Expt.Sta. Progress Notes No. 114. pp. 17.
Clements, Harry F. 1959. Recent developments in crop logging of sugarcane. Proc. International Soc. of Sugarcane Technologists. TenthCongress, Netherlands. 522-529.
Clements, Harry F. 1960. Crop logging of sugar cane in Hawaii. PlantAnalysis and Fertilizer Problems. Edited by Walter Reuther. Amer.Institute of Biological Sciences, Washington 6, D. C. 131-147.
Clements, Harry F. 1962. The coralstone-phosphate experiments on theHi10 and Hamakua coasts. Hawaiian Sugar Technologists 20th AnnualMeeting, November 13-16; 1961 Report: 77-105.
Coleman, R. 1944. The mechanism of phosphate fixation by montmori110nitic and kaolinitic clays. Soil Sci. Soc. Amer. Proc. 9: 72-78.
Coleman, R. 1944. Phosphorus fixation by the coarse and fine clayfractions of kaolinitic and montmoril10nitic clays. Soi~ Sci. 58'71-77.
Coleman, N. T., E. J. Kamprath, and S. B. Weed. 1958. Liming. Advancesin Agronomy Vol. X: 475-522. Edited by A. G. Norman. Academic Press,Inc., Publishers. New York.
Coleman, N. T., and A. Mehlich. 1948. Some chemical properties of soilsas related to their cation exchange-anion exchange ratios. Soil Sci.Soc. Amer. Proc. 13: 175-178.
Coleman, N. T., J. T. Thorup, and W. A. Jackson. 1960. Phosphatesorption reactions that involve exchangeable A1. Soil Sci. 90: 1-7.
Colwell, R. N.studies.
1942. The use of radioactive phosphorus in translocationAmer. J. Botany 29: 798-807.
Dean, L. A. 1949. Fixation of soil phosphorus. Advances in AgronomyVol. 1:391-411. Edited by A. G. Norman. Academic Press, Inc.,Publishers. New York.
Duncan, D. B. 1955. Multiple range and multiple F tests. Biometrics.11: 1-42.
Eggert, R., and L. T. Kardos. 1954. Further results on the absorptionof phosphorus by apple trees. Proc. Amer. Soc. Hort. Sci. 64: 47-51.

130
Eggert, R., L. T. Kardos; and R. D. Smith. 1952. The relative absorptionof phosphorus by apple trees and fruits from foliar sprays~ and fromsoil application of fertilizer, using radioactive phosphorus as atracer. Proc. Amer. Soc. Hort. Sci. 60: 75-86.
Ellis, R,; Jr., and E. Truog. 1955. Phosphate fixation by montmorillonite. Soil Sci. Soc. Amer. Proc. 19: 451-454.
Ensminger, L. E., and R. W. Pearson. 19~7. Residual effects of variousphosphates as measured by yields, P 2 uptake, and extractable phosphorus. Soil Sci. Soc. Amer. Proc. 21: 80-84.
Fisher. E. G., and D. R. Walker. 1955. The apparent absorption of phosphorus and magnesium from sprays applied to the lower surface ofMcIntosh apple leaves. Proc. Amer. Soc. Hort. Sci. 65: 17-24.
Franklin, W. T., and H. M. Reisenauer. 1960. Chemical characteristicsof soils related to phosphorus fixation and availability. Soil Sci.90: 192-200.
Fried. M. 1953. The feeding power of plants for phosphates. Soil Sci.Soc. Amer. Proc. 17: 357-359.
Fried, M. 1954.phosphates.
Quantitative evaluation of processed and naturalAgric. ~nd Food Chern. 2: 241-244.
Fried_ M. 1957. Measurement of plant nutrient supply of soils by radioactive isotopes. Proc. Fourth Annual Oak Ridge Summer Symposium,USAEC Report TID-5ll5: 452-480. Atomic Energy and Agriculture,AAAS: 1-18.
Fried, M., and L. A. Dean. 1952.of available soil nutrients.
A concept concerning the measurementSoil Sci. 73: 263-271.
Fried, M., and L. A. Dean. 1955. Phosphate retention by iron andaluminum in cation exchange systems. Soil Sci. Soc. Amer. Proc. 19.143-147.
Fox R. L., B. Kacar, A. Aydeniz, S. Zobunoglu; and N. Ozbek. (mimeographed report, 1960). Phosphorus status of Turkish soils: T.Response of wheat to phosphorus fertilization in relation to soiltests.
Fox, R. L., B. Kacar, S. Zobunoglu, A. Aydeniz, and H. Guner. (mimeo"graphed report, 1961). Phosphorus status of Turkish solIs: II.Estimations of available phosphorus levels by greenhouse andlaboratory methods.
Ginzburg; K. E. 1960. Importance of sesquioxides and humates i:. phospho~us
adsorption by soils. Trudy Prochv. Inst, Dokuchaeva 55: 239-271 LR_/

131
Golden) Laron E. 1959. The availability of native and radioactivefertilizer phosphorus to oaks of Lake Charles clay. DissertationAbsts. 19(12): 3077.
Golden, Laron E. 1961. Availability of native and radioactive ferti.lizerphosphorus to oats on Lake Charles clay. Soil Sci. 91(5); 349-355.
Goralski, J., and S. Moskal. 1960. Investigations on the influence ofliming on phosphorus and calcium uptake by red clover using p32 andCa45 . Reczn Glebzn. 9(1): 15-42.
Greene, H. 1954. Fertilizer prospects in Africa. Fifth InternationalCongress. Soil Sci. Trans. 1: 146-174.
Gris: E. 1844. (as quoted by Wittwer and Teubner, 1959). Foliar absorption of miner81 nutrients. By S. H. Wittwer and F. G. Teubner,1959. Foliar absorption of mineral nutrients. Ann. Rev. PlantPhys. 10: 13-32.
Grunes, D. L., H. J. Haas, and S. H. Shih. 1955. Effect of long-timedryland cropping on available phosphorus of Cheyenne Fine Sandy Loam.Soil Sci. 80: 127-138.
Harper, H. J. 1962. Limestone for improvement of acid soil in Oklahoma.Oklahoma State University. Expt, Sta. Processed Series. P-402,pp. 35.
Hartwell) B. L., and F. R. Pember, 1918. The presence of aluminum as areason for the difference in'the effect of so-called acid soil onbarley and rye. Soil Sci. 6: 259-279.
Haseman, J. F., E. H. Brown, and C. D. Whitt. 1950a. Some reactions ofphosphate with clays and hydrous oxides of iron and aluminum. SoilSci. 70: 257-271.
Heck, A. F. 1934. A method for determining the capacity of a soil tofix phosphorus in difficultly available forms. Soil Sci, 37: 477·482,
Hemwall, J. B. 1957. The fixation of phosphorus by soils. Advances 19Agronomy. Vol. IX: 95-111. Edited by A. G. Norman. Academic Press,Inc., Publishers. New York.
Hendricks, S, B., and L. A. Dean. 1952. Radioisotopes in soils researchand plant nutrition. Ann. Rev. of Nuclear Sci. 1: 597-610.
Hsu, P. H., and M, L. Jackson. 1960. Inorganic phosphate transformationsby chemical weathering in soils as influenced by pH. Soil Sci. 90,16-24.
Indenko, I. F. 1960. Extra-root top-dressing of b1ackcurrant and possibility of combining it with treatment with fungicides. Fiziol. Rast.7: 198-206, L~/

132
Ivanov, V. P. 1959. Effect of foliar nutrition and soil moisture on thegrowth and development of maize. Fiziol. Rast. 6: 358-360. lR_7
Kanehiro; Y., and G. Donald Sherman. 1956. Effect of dehydration-rehydration on cation exchange capacity of Hawaiian soils. Soil Sci.Soc. Amer. Proc. 20: 341-344.
Kardos, L. T. 1955. Soil Fixation of Plant Nutrient Chemistry of theSoil. Reinhold Publ. New York.
Kitson, R. E. and M. G, Mellon. 1944. Colorimetric determination ofphosphorus as molybdivanadophosphoric acid. Ind. and Eng. Chern.16: 379-383.
Koontz, H. V. 1958. Factors affecting absorption and translocation offoliar applied phosphorus. Dissertation Absts. 19(3): 422.
Koontz; H,; and O. Biddulph. 1957, Factors affecting absorption andtranslocation of foliar applied phosphorus. Plant Physiol. 32: 463-470,
Kurtz, T,; E. E. DeTurk, and R. H. Bray. 1946. Phosphate adsorption byIllinois soils. Soil Sci. 61: 111-124.
Larsen, J. E.; G. F. Warren, and R. Langston. 1959. Effect of ironaluminum and humic acid on phosphorus fixation by organic soils.Soil Sci. Soc, Amer. Proc. 23: 438-440,
Lecat. Sosa-Bourdouil. 1952. Measuring foliar absorption by means £f_radioactive phosphorus p32 C. R. Acad. Agric, 39: 665-667. LF_/
Lindsay,W,L., ·M, Peech, and J. S. Clark. 1959. Solubility criteria forthe existence of variscite in soilso Soil Sci, Soc. Amer. Proc.23. 357-360.
Lindsay, W. L., and J. D. DeMent, 1961. Effectiveness of some ironphosphates as sources of phosphorus for plants. Plant and Soil 14118-126.
Long, W. G. F. G. Teubner, S. H. Wittwer, and R. S. Lindstrom. 1955.The effects of internal and external factors upon foliar absorptionand distribution of radio-phosphorus, potassium and rubidium inplants. Plant Physiol. 30: 18 (supplement).
Low, P. F., and C. A. Black. 1950. Reactions of phosphate with kaolinite,Soil Sci. 70: 273-290.
Maeda, S.; and H. Kojima. 1959. The effect of light on foliar absorptionespecially on the infiltration of the solution into the intercellularspace through the stomata. Sci. Bull. Fac. Agric. Kyushu Univ. 17:91-97.
Maleina. A. A. 1960. Effect of systematic application of phosphorus fertilizers and of liming on the reserve of available phosphates in soil.Pochvovedenie No.9) 71-75.

Matsusaka, Y., and G. Donald Sherman. 1950.buffering capacities of Hawaiian soils.Expt, Sta. Tech. Bull. No. 11, 36 pp.
Titration curves andUniv. of Hawaii. Agric.
133
Mattingly, G. E. G.) and O. Talibudeen. 1961. Isotopic exchange ofphosphates in soil. Review of experimental techniques and resultsat Rothamsted. 1952-1960. Rep. Rothamsted Expt. Sta. 1960. 246-265.
Mattson, S. 1931. The laws of soil colloidal behavior: VI. Amphotericbehavior. Soil Sci. 32: 343-365.
Maung, Mya Thaung. 1960. Relative absorption of phosphorus hy rice plantsfrom native and additive sources, using radioactive phosphorus as atracer. Soil Sci. 90: 284-289.
McAuliffe, C. D., N. S. Hall, L. A. Dean, and S. H. Hendricks. 1947.Exchange reactions between phosphates and soils: Hydroxylic surfaces of soil minerals. Soil Sci. Soc. Am. Proc. 12: 119-123.
McGeorge, W. T. 1924.of Hawaiian soils.
Iron, aluminum and ,manganese in the soil solutionSoil Sci. 18: l-ll.
McLean, F. T., and B. E. Gilbert. 1927. The relative aluminum toleranceof crop plants. Soil Sci. 24: 163-174.
Midgley, A. R. 1940. Phosphate fixation in soils--A critical review.Soil Sci. Soc. Amer. Proc. 5: 24-30.
Mirasol, J. J. 1920. Aluminum as a factor ill soil acidity. Soil Sci.10: 153-217.
Mitsui, S. 1956. Studies on plant nutrition, fertilizer and s~il by theuse of radioisotopes. Proc. Peaceful Uses of Atomic Energy. l2~
87-88.
Monteith. N. H, 1961. The comparative effects of calcium carbonate andcalcium silicate on the yield of Sudan grass grown in a FerruginousLatosol and a Hydrol Humic Latosol. M. S. thesis. Univ. of Hawai.i.
Oliver, W. F.foliage.
1952. Absorption and translocation of phosphorus bySci. Agric. 32: 427-432.
Olsen, S. R. 1953. Inorganic phosphorus in alkaline and calcareous soils.Soil and Fertilizer Phosphorus in Crop Nutrition. Edited by W. H.Pierre and A. G. Norman. Academic Press, Inc.) Publishers. New York.89-122.
Olsen, S. R., F. S. Watanabe, H. R. Cosper, W. E. Larson, and L. B. Nelson.1954. Residual phosphorus availability in long-time rotations oncalcareous soils. Soil Sci. 78: 141-151.

134
Olson, Carster. 1953. The significance of concentration for the rateof ion absorption by higher plants in water culture: IV. The influence of hydroden ion concentration. Physiol.: Plant 6: 848-858.
Overstreet, R.; and L. A. Dean. 1951. The availability of soil anions.Mineral Nutrition of Plants. By Emil Truog. The University ofWisconsin Press. 79-105.
Pandey, S. 1959. Foliar application of phosphate and its potentialitiesin India. Allahabad Farmer. Vol. XXXIII: No.6: 1-6.
Patel; J. M., and B. V. Mehta. 1961. Soil phosphorus fractionationstudies. Soil Sci. Soc. Amer. Proc. 25: 190-192.
Paton, D. F.; and J. F. Loneagan. 1960. An effect of lime on residualphosphorus in soil. Australiaa Jour. Agric. Res. 2: 524-529.
Perkins; A. T., and H. H. King. 1944. Phosphate fixation by soilminerals. II. Soil Sci, 58: 243-250.
Piper, C. S. 1944. Soil and Plant Analysis. Interscience Pub.: Inc.368 pp.
Plucknett, D. L. 1961, Some plant relationships in the bauxitic soilsof Kauai. Ph.D. Thesis. Univ. of Hawaii. 87 pp.
Pratt, P. F., and D. W, Thorne. 1948. Solubility and physiologicalavailability of phosphate in somum and calcium systems. Soil Sci.Soc. Amer. Proc. 13: 213-217.
Ragland, J. L., and N. T. Coleman. 1959.aluminum and calcium on root growth.355-357.
The effect of soil solutionSoil Sci. Soc. Amer. Proc. 23
Rathje, W. 1960. On the mutual conversion of calcium bound phosphoricacid and aluminum and ferric-iron-bound phosphoric acid in soil.Plant and Soil 13: 159-167.
Ravikovitch, S. 1934. Anion exchange: II. Liberation of the phosphoricacid ions adsorbed by soils. Soil Sci. 38:279-290.
Ravikovitch S. 1939. Influence of exchangeable cations on the availability of phosphate in soils. Soil Sci. 47: 357-366.
Rixon, A. J. 1962. Effects of heavy applications of lime to soils derived from volcanic ash on the humid Hilo and Hamakua coasts, Islandof Hawaii. Ph.D. Thesis Univ, of Hawaii. 148 pp.
Rixon, A. J., and G. Donald Sherman. 1961. Calcium aluminum relationshipsresulting from liming soils of the Hamakua coast, Hawaii. Abstract.Proc. Haw. Acad. of Sci.: 36th Annual Meeting.

135
Rogers, H. T., R. W. Pearson, and L. E. Ensminger. 1953. Comparativeefficiency of various phosphate fertilizers. Soil ~nd FertilizerPhosphorus in Crop Nutrition. Edited by W. H. Pierre and A. G.Norman. Academic Press, Inc., Publishers. N,ew York. 189-242.
Rubins, E. J., and L. A. Dean. 1947. Anion exchange in soils. S01l S~i.
63: 389-397.
Saeki, H., and M. Okamoto. 1960. Studies on the fixation and availabilityof phosphates in soils: VI. Fractionation of phosphorus from phosphated clay minerals. J. Sci. Soil Tokyo. 31: 89-90. J. Soil andPlant Food 6: 96-97.
Saunders, W. M. H. 1958. The effect of different phosphate fertilizerson soil pH and the consequent effect on phosphate retention. NewZealand Jour, Agric. Res. 1(5); 675-682.
Scarseth, G. D. 1935. The mechanism of phosphate retention by naturalalumino-silicate colloids. Jour. Amer. Soc. Agron. 27: 596-616,
Scarseth; G. D" and J. W. Tidmore. 1934. The fixation of phosphates byclay soils. Jour. Amer. Soc. Agron. 26: 152-162.
Schachtschabel. P. 1960. The transformation of fertilizer phosphorus insoil and availa~ility of soil phosphorus. Landw. Forsch. Sonderh14: 30-37. LG_/
Sekioka, H. 1961. Effect of temperature on the translocation of foliarapplied p32 on the sweet potato plant. Proc. Crop Sci. Soc, Japan29: 273-275.
Shereverya, N. I. 1959. The interrelationship of foliar and root mineralnutrition in plants. Fiziol. Rasteni. 6(1): 18-26.
Sherman, G. Donald. 1952. The genesis and morphology of the alumina richlaterite clays. Problems of Clay and Laterite Genesis. A.I.M.E.,New York Symposium 1951, 154-161.
Sherman; G, Donald. 1957. Formation of gibbsite aggregates in latosolsdeveloped on volcanic ash. Science 125: 3260.
Sherman; G. Donald and L. T. Alexander. 1959. Characteristics andgenesis of Low Humic Latosols. Soil Sci. So~. Amer. Proc. 23; 168-1 70.
Sherman, G. Donald, and Y. Kanehiro. 1946-1948. The chemical compositi.onof certain forest floors in the Hawaiian Islands, Hawaii Agric. Expt,Sta. Biennial Report ending June 30, 1948, pp. 54-56,
Sherman, G. Donald; W. M. Johnson, J. D. Cady, H. Ikawa, and N. Blomberg.1962. The characteristics of the Halii soils of the Aluminous Ferruginous Latosols. Hawaii Agric. Expt. Sta. Tech. Bull. (In press).

13F
Silbertstein; 0., and S. H. Wittwer. 1951. Foliar application of phcsphati~
nutrients to vegetable crops. Proc. Amer. Soc. Hort. Sci. 58' 179··190.
Suehisa, R. H. 1961. Effects of silicates on phosphorus availability tvSudangrass grown on Hawaiian Goils. M. S. Thesis. Univ. of Hawaii,70 pp.
Suleimanov, I. G.phosphorus.
1956. On the question of non-root plant nutrition byUchenye Zap. Kazansk. Univ. 116(1): 212-216.
Stanford, G.; and J. D. DeMent. 1957. A method for measuring short~term
nutrient absorption by plants: I. Phosphorus. Soil Sci. Soc. Amer.Proc. 21: 612-617.
Stout, P. R. 1939. Alterations in the crystal structure of clay mineralsas a result of phosphate fixation. Soil Sci. Soc. Amer. Proc. 4: 177182.
Swanson, C. A., and J. B. Whitney, Jr. 1953. Studies on the translocationof foliar-applied p32 and other radioisotopes in bean plants. Amer.Jour. Botany 40: 816-823.
Taylor, A. W. 1960. The agronomic value of silica. Literature survey.Report No. 693. Tennessee Valley Authority, Division of ChemicalDevelopment, Fundamental Research Branch, Wilson Dam. Alabama,
Terman, G. L. and G. Stanford. 1960. Progress through cooperativeresearch on fertilizer evaluation. A report of TVA soils and fertilizer research branch for the period July 1957 through June 1960.Div. of Agric. ReI., TVA. Wilson Dam. Alabama.
Teubner, F. G., S. H. Wittwer, W. G. Long, and H. B. Tukey. 1957. Somefactors affecting absorption and transport of foliar-applied nL:Tit~:5
as revealed by radioactive isotopes. Michigan State Univ. Agrie.Expt. Sta. Quart. Bull. 39: 398-415.
Thomas, F. H. 1960. The effect of soil reaction on the availabiliry ofnative and applied phosphorus. Dissert. Abstr. 20: 2476.
Thomas, W. 1960. The effect of foliar applied nitrogen, phosphorus a~d
potassium on the growth and composition of corn. Dissert. Abstr,20: 2477.
Thompson. L. F., and P. F. Pratt. 1954. Solubility of phosphorus i~
chemical extract ants as indexes to available phosphorus in Ohiosoils. Soil Sci. Soc. Amer. Proc. 18: 467-470.
Thorne, G, N. 1958. Factors affecting uptake of radioactive phosphorusby leaves and its translocation to other parts of the plant. Ann.Botany 22: 381-398.

137
Thorne, G. N., and D. J, Watson. 1953. Uptake of nutrients from solutionsprayed on leaves. Rothamsted Expt. Sta. Rept. 1952: 66-68.
Trenel, M., and F. Alten. 1934. The physiological importance of themineral soil acidity, whereo~ consists the toxic action of aluminum.Angew Chem, 47: 813-820.
Truog, E. 1938. Phosphate fixation. Soil Sci. 38: 263-271.
Truog, E. 1953. Liming in relation to availability of native and appliedphosphates. Soil and Fertilizer Phosphorus tn Crop Nutrition.Edited by W. H. Pierre and A. G. Norman. Academic Press, Inc.,Publishers. New York. 281-297.
Tukey, H. B., S. H. Wittwer, F. G. Teubner, and W. G. Long. 1956.Utilization of radioactive isotopes in resolving the effectivenessof foliar absorption of plant nutrients. Proc. Int. Conference.Peaceful Uses of Atomic Energy held in 1955. (Biology and Agric.Vol. XII. 1956. 138-143.)
Van Den Hende, A., and R. De Loose. 1958. Recent acquisitions in agricultural chemistry using p32 and Ca45 Proc. First (UNESCO) International Conf. Sci. Res. 4: 259-269.
Van Den Hende, A., L. Baert, and W. Avermaete. 1960. A study of foliarnutrition by means of radioactive isotopes. Bull. Inst. Agron.Genrl. Hors. Ser. 2: 739-763.
Verma, R. D. 1956. Estimation of residual value of phosphorus fertilizerby chemical and radio chemical methods. Indian Jour. Agron. 1(1):7-14.
Webb, J. R., and J. T. Pesek, Jr, 1954. Evaluation of residual soilphosphorus in permanent fertility plots. Soil Sci. Soc. Amer. Pro~.
18: 449-453.
Wild, A. 1949. Retention of phosphate by soil, A review. Jour. SoilSci. 1: 221-238.
Williams, E. G. 1950. Phosphate fixation and availability. Jour. Sci.Food and Agric. I: 244-248.
Wittwer, S. H. 1957. Nutrient uptake with special reference to foliarabsorption. Atomic Energy and Agriculture. American Association forthe Aovancement of Science. 139-164.

138
Wittwer, S. H.; and W. S. Lundahl. 1951. Autoradiography as an aid indetermining the gro~s absorption and utilization of foliar appliednutrients. Plant Physiol. 26: 792-797.
Wittwer. S. H, and F. G. Teubner. 1959. Foliar absorption of mineralnutrients. Ann. Rev. Plant Physiol. 10: 13-32.
Wittwer, S. H.; F. G. Teubner, and tv. C. McCall. 1957. Comparative absorption and utilization by beans and tomatoes of phosphorus appliedto the soil and foliage. Proc. Amer. Soc, Hort. Sci. 69: 302-308.
Wolfenbarger, D, O. 1949. Nutritional value of phosphatic insectici.des.Jour. Econ. Ent. 41: 818-819.
Wright, B. C. 1959. Investigations of phosphate reaction products inacid soils by the application of solubility criteria. Disser. Abstr.20. 2991-2992.
Wright, B. C., and M. Peech. 1960. Characterization of phosphate reac:i.op.products in acid soils by the application of solubility criteria.Soil Sci. 90: 32-43.
Wright, K. E. 1937. Effects of phosphorus and lime in reducing 3lumi~um
toxicity of acid soils. Plant Physiol. 12: 173-181.
Yakushkina; N. I. 1960. Extra-root top dressing and physiologicalprocesses in sugar beet. Vestn. S-kh. Nauki. No. 11: 36-40.
Yatazawa, M., and S. Higashino. 1952. Studies in the foliar applicationof nutrient elements: I. The absorption of KH2P3204 through theleaf epidermis. Jour. Sci. Soil Man Japan 22: 191-192.
Yuan, T. L., and W. K. Robertson. 1958. Specific p32 sorption by soils.Soil Sci. 86: 220-225.
Yuan, T. L.; W. K. Robertson, and J. R. Neller. 1960. Forms of newlyfixed phosphorus in the three acid sandy soils. Soil Sci. Soc.Amer. Proc. 24: 447-450.
Younge, O. R. 1959. Clover seed production on Hawaiian wetlands requireslime. Hawaii Farm Science 8: 6-7.
Younge. O. R. 1961. Fertility requirements of bauxite stripsoil for :ropproduction, Hawaii Farm Science 10: 6-8.
Younge, O. R.; and J. C. Moomaw. 1960. Revegetation of stripminedbauxite lands in Hawaii. Economic Botany 14: 316-330.