availability, operation & maintenance costs of offshore ... · availability, operation &...
TRANSCRIPT
Availability, Operation & Maintenance Costs of Offshore
Wind Turbines with Different Drive Train Configurations
James Carroll1, Alasdair McDonald
1, Iain Dinwoodie
1, David McMillan
1,
Matthew Revie2 and Iraklis Lazakis
3
1Electronic and Electrical Engineering Department, University of Strathclyde, Glasgow, UK
2Managment Science Department, University of Strathclyde, Glasgow, UK
3Naval Architecture, Ocean and Marine Engineering Department, University of Strathclyde, Glasgow, UK
ABSTRACT
Different configurations of gearbox, generator and power converter exist for offshore wind turbines. This
paper investigated the performance of four prominent drive train configurations over a range of sites
distinguished by their distance to shore. Failure rate data from onshore and offshore wind turbine
populations was used where available or systematically estimated where no data was available. This was
inputted along with repair resource requirements to an offshore accessibility and operation and maintenance
model to calculate availability and operation and maintenance costs for a baseline wind farm consisting of
100 turbines. The results predicted that turbines with a permanent magnet generator and a fully rated power
converter will have a higher availability and lower operation and maintenance costs than turbines with
doubly-fed induction generators. This held true for all sites in this analysis. It was also predicted that in
turbines with a permanent magnet generator, the direct drive configuration has the highest availability and
lowest operation and maintenance costs followed by the turbines with 2 stage and 3 stage gearboxes.
Index Terms— availability, cost, drive train, lost production, O&M, offshore wind turbine, operational
performance, power train, PMG, gearbox, DFIG.
1. INTRODUCTION
Governments, researchers and industry are trying to reduce the Cost of Energy of offshore wind (e.g. [1]),
which currently has a higher cost than onshore wind and other commercially viable power plant
technologies [2]. Developers and investors are investigating the optimal balance between reduced capital
investment, operating costs and risk, and increased energy conversion to maximise revenue. Choosing
between competing wind turbine and wind farm enabling technologies is a key way for achieving industry-
wide and project-specific goals.
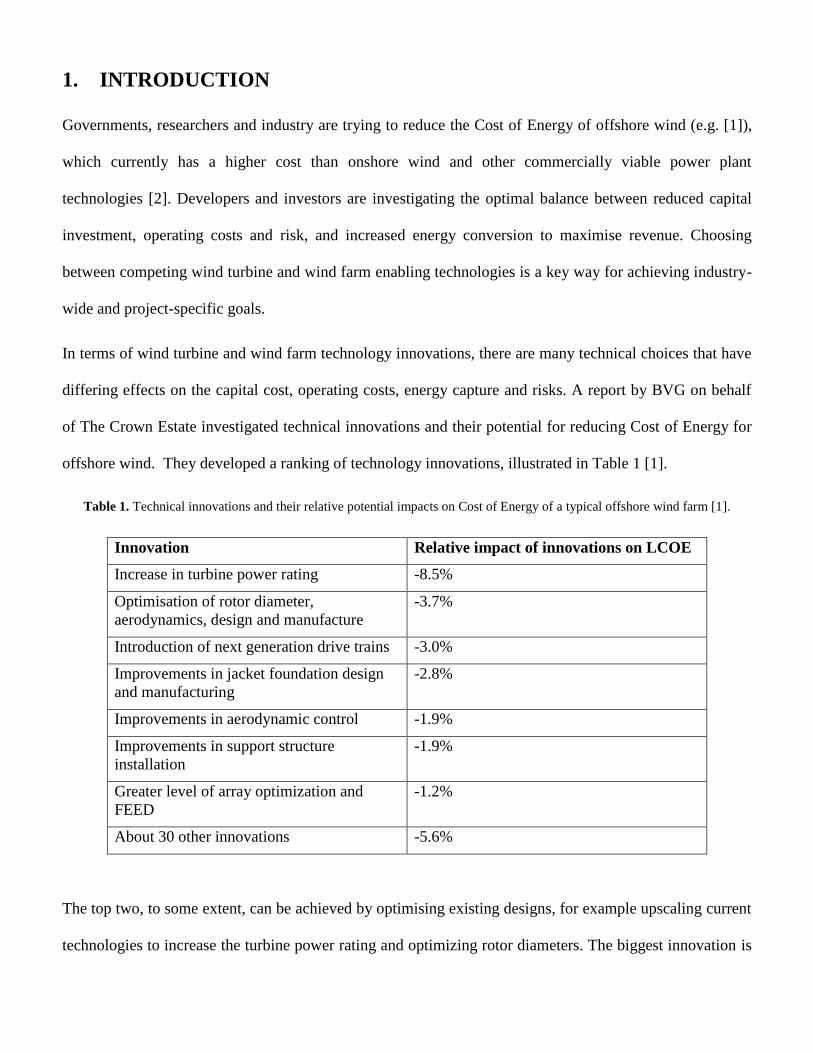
In terms of wind turbine and wind farm technology innovations, there are many technical choices that have
differing effects on the capital cost, operating costs, energy capture and risks. A report by BVG on behalf
of The Crown Estate investigated technical innovations and their potential for reducing Cost of Energy for
offshore wind. They developed a ranking of technology innovations, illustrated in Table 1 [1].
Table 1. Technical innovations and their relative potential impacts on Cost of Energy of a typical offshore wind farm [1].
Innovation Relative impact of innovations on LCOE
Increase in turbine power rating -8.5%
Optimisation of rotor diameter,
aerodynamics, design and manufacture
-3.7%
Introduction of next generation drive trains -3.0%
Improvements in jacket foundation design
and manufacturing
-2.8%
Improvements in aerodynamic control -1.9%
Improvements in support structure
installation
-1.9%
Greater level of array optimization and
FEED
-1.2%
About 30 other innovations -5.6%
The top two, to some extent, can be achieved by optimising existing designs, for example upscaling current
technologies to increase the turbine power rating and optimizing rotor diameters. The biggest innovation is

the selection of drive train and associated equipment (i.e. torque speed conversion, electrical machine and
power conversion) which requires a choice between competing technologies. A survey of current designs of
large wind turbines, Figure 1, reveals a variety of drive train technology choice.
Figure 1. Drivetrain choice for some large wind turbines, specified by speed and torque conversion, generator type and rating of
power converter [3].
Previous work on this technology choice has focused on how different technologies influence capital costs
and efficiency, however many arguments are based on their reliability and the impact of availability and
O&M costs. In this paper we evaluate how this technology choice influences availability and Operation and
Maintenance (O&M) costs. This understanding can feed into any decision making processes alongside the
capital costs and financing rates associated with different wind turbines and wind farm projects.

1.1 Availability of offshore wind farms
Wind turbine or wind farm availability is a time based ratio of the amount of time a wind turbine/farm is
ready to operate in a given time period divided by the total time in that time period. It is defined as follows:
[4]
Contractual availability is a similar measure in which the time the turbine is not ready to operate is
allocated to either the wind turbine manufacturer or the wind turbine owner based on the agreed allocation
procedure in the contract signed by both parties. A guarantee is often given by the manufacturers based on
contractual availability. Compensation is paid to the customer if the contracted availability guarantee is not
met. Typical contractual availability guarantees are 97% onshore and 95% offshore. [5]
1.2 Offshore wind farms operations and maintenance cost
The O&M costs of a wind farm can make up around 30% of the levelised cost of energy of an offshore
wind farm [6]. The location of newer offshore wind farms are generally further offshore than early wind
farms, e.g. Robin Rigg wind farm is 11km from shore whereas the planned Hornsea wind farm is more than
100km. It is expected that the O&M cost for wind farms further offshore will rise due to longer travel time
and accessibility issues leaving less time to carry out maintenance once maintenance crews can get to wind
turbines.
1.3 Offshore wind turbine drive trains
In this study a number of different drive train and generator types were modelled. The most widespread
drive train type in large onshore turbines has a three stage gearbox with a doubly fed induction generator
(DFIG) [7]. This configuration uses a partially rated power converter to vary the electrical frequency on the
generator rotor and hence provide variable speed operation. An alternative to this is to use a permanent
magnet synchronous generator – with the same gearbox type – and a power converter rated at the full rating
of the turbine. The failure rates of these two configurations have been studied in detail in [8]. Reference [8]
showed that while the permanent magnet generator (PMG) failed less often than the DFIG, the larger fully

rated power converter had a higher failure rate than the partially rated power converter in the DFIG
configuration. Offshore wind turbine designers are increasingly opting for permanent magnet generators [9]
because of their higher efficiencies. They are also tending to choose direct drive generators (i.e. drive trains
with no gearbox) or gearboxes with only 1 or 2 stages and medium speed generators. The direct drive
generator will have a higher failure rate than the gear driven generators. As highlighted in [10], wound
rotor direct drive generators are expected to have a failure rate up to twice that of gear driven generators.
However, it is direct drive permanent magnet machines that are the focus of this analysis and [10] suggests
that PMG direct drive generators may mitigate this higher failure rate through the removal of some of the
failure modes related to the excitation system and rotor windings. The analysis in this paper takes these
points into account when modelling the O&M costs of the direct drive PMG configuration.
It is possible for the powertrains to be designed so that they provide a level of partial redundancy. This can
be achieved by using independent windings in the generator, so that if there is an open circuit fault in one
of the stator windings, the turbine can still generate some electrical power from the other winding(s). The
same principle can be applied to the converter: if there are independent converter modules, then a fault in
one module does not necessarily stop the other modules from continuing to convert electrical power (albeit
at reduced total power output level). However, in this paper it is assumed that none of the turbines have
partial redundancy available. All four drive train types included in this analysis can be seen in Figure 2,
where FRC stands for fully rated power converter and PRC stands for partially rated power converter.

Figure 2. Drive train configurations in this analysis showing the different gearbox, generator and converter types used
1.4 Approach taken in this paper
This paper describes the results of analysis determining the O&M cost per MWh of wind turbines with
different drive types. Based on these findings, four different drive train types were evaluated to determine
which technology provides the highest availability and lowest O&M cost. Recommendations were provided
for methods of raising availability for each drive train type. O&M costs were presented detailing, transport
cost, lost production cost, staff cost and repair cost. In order to obtain these results, the availabilities and
downtimes for each drive train type were calculated using an offshore accessibility model.
The inputs for this model were obtained from the same on and offshore populations as in reference [8] and
[11]. These populations contained ~2650 modern multi MW on and offshore turbines. These have failure
rates for two of the four drive train types, but it was necessary to estimate failure rates for the other two
drive train types using a systematic approach detailed in section 4.2.1. Failure rates for both the 3 stage
machines were obtained from industrial partners and the 2 stage and direct drive failure rates were
estimated.
The work detailed in this paper is novel for two reasons. First, O&M costs and operational performance
have never before been modelled for offshore wind turbines based on such a large and up to date offshore

population. Second, no other work was encountered in the literature review in which O&M costs were
modelled for different drive train types. While [12] modelled O&M costs for a generic turbine no papers
were encountered in which different turbine drive train types were considered. Papers such as [13] and [14]
modelled the cost of energy for different drive train types, but in doing so they assumed a fixed O&M cost
per MWh, not one obtained by empirical analysis of a large offshore population.
The paper is structured as follows, Section 2 contains a short literature review of existing operational data
and O&M models. Section 3 provides an overview of the data, obtained from a leading wind turbine
manufacturer, and describes the hypothetical sites used in this analysis. The availability and O&M model
used in this analysis and the inputs required to populate it are detailed in Section 4. Results, discussion and
conclusion are seen in Section 5, 6 and 7.
2. Offshore O&M data sources and modelling literature review
The offshore wind turbine market is dominated by a small number of Original Equipment Manufacturers
(OEMs), and there are a correspondingly small number of developers and operators [15]. As a result, there
is still a significant degree of commercial sensitivity surrounding operational performance and limited data
in the public domain. Additionally, offshore wind turbine designs are continuing to evolve and this means
that newer turbine designs do not yet have full life operating histories. A detailed review of the issues
associated with offshore wind turbine O&M is presented in [10]
There are a limited number of operational reports from early sites that received government grants in the
UK and Netherlands. The performance of UK sites is examined in [16] and performance of the Netherlands
sites is reported at [17]. These reports provide limited details on wind farm availability and reliability of
subsystems. However, the wider applicability of these sources of data is limited due to a number of reasons.
A common turbine model that suffered a serial defect during the reporting period was used across all the
reporting sites and these reports do not provide detailed information of the operations and maintenance
actions and resources utilized.

Due to the limited sources of data in the public domain, commercial sensitivity surrounding operations and
the uncertainty associated with new technology in deeper water further from shore, in order to consider the
performance of future sites it is necessary to use operational simulations. A review of developed models for
offshore wind operation and maintenance is presented in [18]. The model used for this analysis is described
in detail in [19] and the relevant functionality briefly described in Section 4.1.
3. Population Analysis and Site characteristics
3.1 Population Analysis
To obtain the inputs for the O&M model used in this paper two populations of wind turbines were
analysed. The reader is referred to [8, 11] for more details of these populations. The first population used in
the analysis for this paper consists of offshore wind turbines. As in [11] the offshore population included up
to ~350 turbines over a five year period. The majority, ~68% of the population analysed was between three
and five years old and ~ 32% was more than five years old. The exact population details cannot be given
for confidentiality reasons. However, the population consisted of turbines with a rated power of between 2
and 4 MW and a rotor diameter of between 80 and 120m. The wind turbines were the same wind turbine
type and came from between 5 and 10 wind farms. In total this population provided 1768 years or ~15.5
million hours of turbine data.
The second population analysed was the same population used in [8]. It consisted of two subpopulations of
onshore wind turbines: those with drive trains with 3 stage gearboxes, DFIGs and partially rated converters
and those with drive trains consisting of 3 stage gearboxes, PMGs and fully rated converters. In this
onshore population the DFIG configuration had a sample size building up to 1,822 turbines over a five year
period. This sample size provided 3,391 years or ~29.7 million hours of turbine data. The PMG FRC
configuration had a sample size building up to 400 turbines over a 3 year period. This sample size provided
511 years or ~4.5 million hours of turbine data.
3.2 Case Study Site Characteristics

Forty hypothetical offshore wind farms were modelled. These sites consisted of four wind farms located at
10 different distances from shore: 10km, 20km, 30km… 100km. 100km was chosen as the final distance to
model because the majority of round three UK wind sites are less than 100km from shore. It was assumed
that each site had the same climate characteristics. FINO climate data from an offshore research platform
located 45 km off the German coast in the North Sea was used at each site to simulate the offshore
environment [20]. This location corresponds to existing and future wind farms in the North Sea, and can
therefore be considered representative of expected operating conditions for future developments.
The hypothetical wind farms consisted of 100 modern multi MW offshore wind turbines. The exact rated
power cannot be provided for confidentiality reasons but was the same across all turbine types simulated.
O&M costs are provided in £/MWh so even though exact rated power is not provided O&M cost
comparisons for the different drive train types can be made. At each distance from shore a 100 turbine wind
farm with each of the four drive train types was simulated, i.e. one of the wind farms at 10km from shore
consisted of 3 stage DFIG PRC turbines, one with 3 stage PMG FRC turbines, one with direct drive PMG
FRC turbines and one with 2 Stage PMG FRC turbines.
4. Overview of O&M Model and its Inputs
4.1 StrathOW O&M Model
The O&M model chosen for this analysis was the one developed by the University of Strathclyde detailed
in [19]. The model is a time based simulation of the lifetime operations of an offshore wind farm. Failure
behaviour is implemented using a Monte Carlo Markov Chain and maintenance and repair operations are
simulated based on available resource and site conditions. The model determines accessibility, downtime,
maintenance resource utilisation, and power production of the simulated wind farms. The outputs of the
model for this paper were the availability and costs for the operations and maintenance of each of the forty
hypothetical offshore wind farms.

Reference [20] provided the mean wind speeds, wave height and wave period data for FINO as described in
Section 3.2. The vessel operating parameters and costs were based on [19, 21]. For the purpose of this
analysis and as seen in Table 2, Heavy Lift Vessels (HLVs) were used for major replacements in the
generators and gearboxes of the different drive train configurations and Crew Transfer Vessels (CTVs)
were used for all minor and major repairs.
In this analysis, repair time is defined as the amount of time the technicians spend in the turbine for a
certain failure. Repair times and the number of technicians required for repair of the same failures on each
of the drive train types were assumed to be the same across all wind turbine types. However this does not
mean each turbine type will have the same annual downtime (downtime includes repair time). This is
because the failure rate will be different for each turbine type. Different failure rates for the three different
failure categories will lead to a different requirement for the various vessels leading to different downtimes.
An example of the repair time inputs and the downtime outputs for the 4 turbine types can be seen in Table
3 for a site located 10km from shore.
Table 2. Failure rates for gearbox, generator and power converter used for each drive train configuration in this paper
Subsystem Failure Category 3 stage gearbox with
DFIG and PRC
3 stage gearbox with
PMG and FRC
2 stage gearbox with
PMG and FRC
Direct Drive
PMG and FRC
Gearbox Major Replacement 0.059 (HLV) 0.059 (HLV) 0.042 (HLV) -
Major Repair 0.042 (CTV) 0.042 (CTV) 0.03 (CTV) -
Minor Repair 0.432 (CTV) 0.432 (CTV) 0.305 (CTV) -
Generator Major Replacement 0.109 (HLV) 0.007 (HLV) 0.008 (HLV) 0.009 (HLV)
Major Repair 0.356 (CTV) 0.024 (CTV) 0.026 (CTV) 0.03 (CTV)
Minor Repair 0.538 (CTV) 0.437 (CTV) 0.473(CTV) 0.546 (CTV)
Power
Converter
Major Replacement 0.006 (CTV) 0.077 (CTV) 0.077 (CTV) 0.077 (CTV)
Major Repair 0.09 (CTV) 0.338 (CTV) 0.338 (CTV) 0.338 (CTV)
Minor Repair 0.084 (CTV) 0.538 (CTV) 0.538 (CTV) 0.538 (CTV)
Offshore wind
turbine data taken
from [11] or adjusted
by [8]. For
confidentiality
reasons it cannot be
stated which of the
two 3 stage
configurations is
taken directly from
[11]
Offshore wind
turbine data taken
from [11] or adjusted
by [8]. For
confidentiality
reasons it cannot be
stated which of the
two 3 stage
configurations is
taken directly from
[11]
Gearbox failure rate
taken from [11] and
adjusted based on
[22]
Generator failure rate
taken from [11] and
adjusted based on
[23]
Same power
converter failure rate
as ―3 stage gearbox
with PMG and FRC‖
No gearbox.
Generator
failure rate
taken from [11]
and adjusted
based on [23]
Same power
converter failure
rate as ―3 stage
gearbox with
PMG and FRC‖

Table 3. Repair Time Input for all Turbine Types (h)
Grouping Minor Repair Major Repair Major Replacement
Gearbox (h) 7.9 21.9 231 Generator (h) 6.5 24.3 81.1
Converter (h) 6.9 13.6 56.5 Rest of Turbine (h) 6.2 16.4 108.9
Downtime Output for all Turbine Types at 10km from shore per turbine per year (h)
Grouping Configuration Minor Repair Major Repair Major Replacement
Gearbox (h)
3s DFIG PRC 16.62 26 97.8
3s PMG FRC 13.3 27.7 75.8
2s PMG FRC 11.7 19.5 51.7 DD PMG FRC 0 0 0
Generator
(h)
3s DFIG PRC 19.9 38.1 88.1 3s PMG FRC 16 2.7 5.9
2s PMG FRC 17.2 2.8 7.5
DD PMG FRC 19.5 3.1 12
Converter
(h)
3s DFIG PRC 3.1 6 4.4
3s PMG FRC 19.4 22.6 63.2 2s PMG FRC 19.4 22.7 63.7
DD PMG FRC 19.3 22.4 63.9
Rest of
Turbine (h)
3s DFIG PRC 210.9 52.2 9.49
3s PMG FRC 207 51.4 12
2s PMG FRC 207.3 51.3 11.4 DD PMG FRC 204.5 50.9 11.7
The following subsections describe the other inputs that were required to model each of the drive train
types.
4.2 Model inputs: failure rates
The failure rate inputs to the model came from a combination of field data, past publications and estimates
based on data transformation. The empirical and estimated failure rates are detailed in Table 1. Offshore
failure rates for subsystems apart from the gearbox, the generator and the power converter were adopted for
all turbine configurations from [11]. The gearbox, generator and power converter failure rates for each of
the turbine types were obtained or adapted, based on:
the generator, gearbox and converter data in [11]. In this paper offshore failure rates for the drive
train components were provided for one of the 3 stage drive train types. To determine offshore
failure rates for the other 3 stage drive train types, failure rates were estimated based on [8].
Reference [8] provided a percentage difference between onshore failure rates from 3 stage DFIG
configurations and 3 stage PMG FRC configurations. This percentage difference was then applied

to the offshore generator and converter failure rates from [11] allowing offshore failure rates to be
obtained for both 3 stage generator and converter types.
the failure rate estimation method from [23] which used a similar reliability modelling approach to
[24]. This reliability modelling approach is described in more detail in Section 4.2.1. An example
of what this reliability modelling approach was used for is obtaining a failure rate for the direct
drive and 2 stage permanent magnet generators based on the known failure rate of the 3 stage
permanent magnet generator.
4.2.1 Reliability enhancement methodology and modelling (REMM)
The direct drive PMG and 2 stage drive train configurations are relatively new, compared to 3 stage DFIG
turbines and there is, as yet, no published failure rate data on wind turbines with these set ups. Other
innovative drive train configurations are also untried, so the challenge of estimating failure rate without
operational data is a common and significant one. REMM is a methodology, created for the Aerospace
and Defence industry, to combine engineering design concerns with historical data to estimate the
reliability of a system in the design phase [24, 25, 26, 27]. The methodology then identifies different
activities that can be actioned to optimize reliability improvement.
A key feature of REMM is that the method assumes that new systems are based in part on previous
technologies where engineering judgement can identify, from a reliability perspective, the key differences
between the new system and the previous system. Design changes between the two systems will in part
remove failure modes and improve reliability. However, the design team may have concerns that new
failure mechanisms have been introduced based on these design changes. For example, in the case of this
paper, new stator winding issues are encountered when going from high speed to low speed generators.
These engineering concerns are elicited along with an estimate of how likely it is that these concerns will
occur in-service and a distribution on the time to failure of these concerns. This data is combined with
historical data to create a new reliability distribution.

Figure 3, taken from [27] illustrates how the reliability of a new system or component can be modelled
based on experience from a similar older system or component. Figure 4 shows how this approach was
applied to estimate the failure rate of a direct drive and 2 stage PMG based on the field experience of a 3
stage PMG.
In these cases the known offshore 3 stage PMG failure rate was adjusted to represent the offshore failure
rate for the direct drive PMG and the 2 stage PMG. To estimate the offshore direct drive PMG failure rate,
paper [28] was used because it describes how the onshore direct drive wound rotor generator has a failure
rate twice as high as a 3 stage generator. However as the direct drive failure rate was for a wound rotor
generator the doubling of the failure rate was not simply applied to the 3 stage PMG generator, it was only
applied to the stator related failures leading to an offshore failure rate of 0.585 failures per turbine per year
for the direct drive generator. A similar method was carried out for the two stage generator.
The failure rate for the two stage gearbox was obtained by reducing the 3 stage gearbox failure rate, which
was based on field data, by 29.5%. This reduction is based on the FMEA published in [22].

Figure 3. Flow chart showing reliability modelling of a new
component based on a similar old component [27].
Figure 4. Flow chart showing the process applied to drive
train configurations with low and medium speed PMGs
4.3 Model Inputs: Failure Costs
The cost of the failures in [11] were adjusted to represent all drive train types and then used as inputs to the
model for this analysis. Costs were provided by the industrial partner for the 3 stage configurations. The
costs for the direct drive PMG and the 2 stage PMG were estimated by adjusting the 3 stage PMG cost by
the same percentage difference as in [14] where costs were given for a direct drive PMG, 2 stage PMG and
3 stage PMG. The two stage gearbox cost adjustment was carried out in a similar manner based on the
percentage difference in cost between the 3 stage and 2 stage gearbox in [23].
Figure 5 shows the difference in costs for the components of all drive train types. The costs are normalized
against the most expensive component e.g. the 3 stage DFIG is shown as a percentage of the capital cost of
the most expensive direct drive PMG. For the gearbox the 100% cost is ~ £35,000/MW, for the generator
the 100% cost is ~ £180,000 per MW and for the converter the 100% cost is ~£15,500/MW.

Figure 5. Normalised capital costs showing components from both 3 stage drive train types
4.4 Model inputs: Power curves
The model also required power curves for all drive train types so that lost production and O&M costs per
MWh could be calculated. An empirical analysis on power curves from two identical turbine types except
for their drive trains was carried out for both of the 3 stage configurations. This analysis was based on the
populations described in Section 3.1. The direct drive and two stage power curves were estimated based on
the percentage difference in power curves in [14] in which power curves were provided for direct drive
PMG, 2 stage PMG and 3 stage PMG. All power curves in this analysis had the same rated power.
5. Results and Analysis
Using the inputs and the model detailed in Section 4 the availability (Section 5.1), downtime and failure
group contributions to downtime (Section 5.2), O&M costs and contributions to O&M cost (Section 5.3)
were modelled for the forty wind farms described in Section 3.2. A sensitivity analysis (Section 5.4) was
carried out on the influence of the failure rates and repair times used as inputs.
5.1 Availability
Figure 6 shows the modelled availability of the wind farms across all sites with the four different turbine
types. Regardless of whether there was a gearbox or not, the PMG FRC turbines have a higher availability
than the DFIG turbine type at all sites. Reference [8] found that the combined failure rate of the generator
and power converter was approximately 3 times greater for the PMG configuration than for the DFIG
3 StageDFIGPRC
3 StagePMGFRC
2 StagePMGFRC
DD PMGFRC
Gearbox 100.0% 100.0% 70.5% 0.0%
0.0%10.0%20.0%30.0%40.0%50.0%60.0%70.0%80.0%90.0%
100.0%N
orm
alis
ed G
ear
bo
x C
apit
al
Co
sts
Gearbox
3 StageDFIG PRC
3 StagePMG FRC
2 StagePMG FRC
DD PMGFRC
Generator 11.0% 18.2% 45.5% 100.0%
0.0%
10.0%
20.0%
30.0%
40.0%
50.0%
60.0%
70.0%
80.0%
90.0%
100.0%
No
rmal
ised
Gen
erat
or
Cap
ital
C
ost
s
Generator
3 StageDFIG PRC
3 StagePMG FRC
2 StagePMG FRC
DD PMGFRC
Converter 39.5% 100.0% 100.0% 100.0%
0.0%
10.0%
20.0%
30.0%
40.0%
50.0%
60.0%
70.0%
80.0%
90.0%
100.0%
No
rmal
ised
Co
nve
rter
Cap
ital
C
ost
s
Converter

configuration (mainly due to the failures in the power converter). The opposite outcome in availability is
due to the types of failures that occur in the generator of the DFIG configuration. Failures that occur in the
DFIG have a higher down time and larger vessel requirement for repair, consequently the lower failure rate
does not mean higher turbine availability because each failure leads to greater downtime per failure.
If the converters alone were considered, the higher failure rate of the minor and major repairs for the FRC
would mean the gap between the downtime of the 3 stage DFIG FRC and the direct drive PMG FRC would
close as the wind farm moves further offshore. This would happen because of the higher downtime caused
by the travel time required to get that further distance from shore to repair the more regularly failing FRCs.
However, as the wind farm moves further offshore, both the gearbox and the generator minor and major
repairs must also be considered along with the converters. The DFIG will have a higher minor repair
downtime than the direct drive PMG because of the high failure rate of brush and slip ring related issues
[8]. As the direct drive turbine has no gearbox, the gearbox also has a higher minor and major repair failure
rate than the direct drive. As we move further offshore the combination of the higher minor and major
repairs to both the gearbox and the generator of the DFIG outweigh the higher downtime of the FRC
meaning the gap between the 3 stage DFIG PRC and direct drive PMG FRC is maintained.
Across all sites the direct drive configuration was the best performing turbine followed by the turbines with
2 stage and 3 stage gearboxes with a PMG and a FRC, while the turbine with a DFIG had the lowest
availability. It is clear from Figure 6 that in terms of availability the direct drive machine performed just as
well at 70km as the DFIG turbine did at 10km. The main driver for this is the removal of the gearbox
downtime for the direct drive wind turbines. Considering sites 40km, 80km and 100km one can see:
Turbines with high speed PMGs have a higher availability of 0.6% (40km), 0.7% (80km) and 0.9%
(100km) points compared to the turbines with DFIGs
Reducing the speed of the generator with a 2 stage gearbox gives a higher availability compared to
turbines with DFIGs of 1% (40km), 1.2% (80km) and 1.36% (100km)

Using a direct drive turbine with PMG gives a higher availability compared to the turbines with
DFIGs of 1.9% (40km), 2.4% (80km) and 3.4% (100km)
A drop in availability is noticeable in Figure 6 at the 90 and 100km sites. This was due to a limitation on
the number of technicians and vessel capacity working on repairs. The availability could be improved by
increasing the number of technicians or increasing the vessel capacity but this work was deemed to be out
of the scope of this paper.
Figure 6. Availability of wind farms showing all drive train types at sites varying distances from shore
The reader should be reminded that the failure rates for wind turbines with 3 stage gearboxes (both PMG
and DFIG) were based on real data whereas the direct drive and 2 stage configuration were estimated
according to the process in Section 4.2.1, and so there is a greater degree of uncertainty in the results for the
latter two configurations. A sensitivity analysis on the failure rate inputs for each drive train type is shown
later in the paper.
Figure 6 illustrates that as the sites move further from shore, the availability drops for all turbines but at
different rates for different configurations and the gradients vary with distance from shore. This is even
clearer in Figure 7, in which the availability drop per km offshore increases between drive train types the
further offshore the site is. Considering ranges 10-40km, 40-80km and 80-100km one can see the rate that
10km 20km 30km 40km 50km 60km 70km 80km 90km 100km
DFIG PRC 91.6% 91.5% 91.3% 91.2% 90.5% 90.3% 90.0% 88.7% 80.1% 79.1%
3S PMG FRC 92.2% 92.1% 91.9% 91.8% 91.3% 91.0% 90.8% 89.4% 80.8% 80.0%
2S PMG FRC 92.6% 92.5% 92.3% 92.2% 91.9% 91.6% 91.2% 89.9% 81.1% 80.5%
DD PMG FRC 93.5% 93.4% 93.3% 93.1% 92.6% 92.4% 92.3% 91.1% 83.3% 82.5%
75.0%
77.0%
79.0%
81.0%
83.0%
85.0%
87.0%
89.0%
91.0%
93.0%
95.0%
Ava
ilib
ility
%

the availability drops with distance as turbines are placed further from shore: 0.013-0.016%/km (10-40km),
0.050-0.062%/km (40-80km) and 0.43-0.48%/km (80-100km). The difference in availability between the
geared drive train types and the direct drive turbines increases the further the wind farm is from shore. One
reason for this is that the direct drive minor and major repair failure rates are lower than the combination of
the gearbox and higher speed generator minor and major repair failure rates. This leads less of a loading on
CTV and technician resources further offshore for the direct drive configuration.
Figure 7. Availability drop per km for 4 drive train types as wind farms move further from shore
5.2 Downtime analysis
The downtime analysis was carried out across three sites rather than all ten (for the sake of brevity). The
10, 50 and 100km sites were chosen as near, medium and far shore representative sites. Figure 8 shows the
percentage of downtime each failure group has on each wind farm; failure groups were divided by
subsystems (i.e. gearbox, generator, power converter and the rest of turbine) and by failure severity (i.e.
minor repair, major repair and major replacement). It can be seen that across all three wind farms the
failure group called ―Rest of turbine minor repairs‖ had the greatest influence on downtime. As predicted in
[29], when wind farms moved further offshore the percentage of downtime contributed by minor failures
increased.
10km-40km 40km-80km 80km-100km
DFIG PRC 0.015% 0.062% 0.478%
3S PMG FRC 0.016% 0.060% 0.467%
2S PMG FRC 0.014% 0.058% 0.470%
DD PMG FRC 0.013% 0.050% 0.432%
0.0%
0.1%
0.2%
0.3%
0.4%
0.5%
0.6%
% A
vaila
bili
ty D
rop
/ k
m O
ffsh
ore

Although the failure rate (for any turbine type) at the different distances was the same, these minor repairs
became more significant due to longer travel times which in turn led to a requirement for larger
travel/repair time accessibility windows. Greater travel time led to a greater mean time to repair; hence the
product of failure rate and mean time to repair for the different failure categories was closer in magnitude
than for near shore sites.
If the contributions of the three drive train components alone are considered, the generator failures are the
biggest contributors to downtime for the turbines with a DFIG configuration, followed by the gearbox
failures and then the converter failures. This was consistent across all three sites. If the 3 stage PMG FRC
turbine drive train alone is considered it can be seen that for the 10km and 50km sites the gearbox was the
biggest contributor to downtime followed by the FRC and then the generator. For the 100km site the
converter becomes the largest contributor to downtime followed by the gearbox and then the generator, this
switch in ranking of the gearbox and converter for the site further offshore was due to the higher failure rate
of the converter and the increasing travel time. Considering the drive train alone for the 2 stage PMG FRC
turbines, Figure 8 shows across all sites that the FRC was the biggest contributor to downtime followed by
the gearbox and then the generator. When the drive train of the direct drive turbine is considered, the FRC
was the biggest contributor to downtime across all sites and the generator was the second biggest. As it is a
direct drive there was no gearbox to contribute failures. It should be noted that the absolute contribution
from "Rest of Turbine Minor Repair" is the same across the different drive train types as they are all based
on the same turbine type, however they show up different values in the graph as these are percentage
contributions.

Figure 8. Failure group contribution to downtime showing the different turbine subsystems
Rest ofTurbineMinorRepair
RemoteResets
GearboxMajor
Replacment
GeneratorMajor
Replacment
ScheduledMaintena
nce
Rest ofTurbineMajorRepair
GeneratorMajorRepair
GearboxMajorRepair
GeneratorMinorRepair
GearboxMinorRepair
Rest ofTurbineMajor
Replacment
ConverterMajorRepair
ConverterMajor
Replacment
ConverterMinorRepair
3S DFIG PRC 28.7% 13.6% 13.4% 12.1% 8.2% 7.1% 5.2% 3.5% 2.7% 2.3% 1.3% 0.8% 0.6% 0.4%
3S PMG FRC 30.4% 14.7% 11.1% 0.9% 8.8% 7.6% 0.4% 4.1% 2.3% 2.4% 1.8% 3.3% 9.3% 2.9%
2S PMG FRC 32.1% 15.5% 8.0% 1.1% 9.3% 7.9% 0.4% 3.0% 2.7% 1.8% 1.8% 3.5% 9.9% 3.0%
DD PMG FRC 36.0% 17.6% 0.0% 2.1% 10.6% 9.0% 0.6% 0.0% 3.4% 0.0% 2.1% 3.9% 11.3% 3.4%
0.0%
10.0%
20.0%
30.0%
40.0%
50.0%
60.0%C
on
trib
uti
on
to
Do
wn
tim
e
10km Offshore
Rest ofTurbineMinorRepair
GearboxMajor
Replacment
RemoteResets
GeneratorMajor
Replacment
Rest ofTurbineMajorRepair
ScheduledMaintena
nce
GeneratorMajorRepair
GearboxMajorRepair
GeneratorMinorRepair
GearboxMinorRepair
Rest ofTurbineMajor
Replacment
ConverterMajorRepair
ConverterMajor
Replacment
ConverterMinorRepair
3S DFIG PRC 30.9% 12.0% 12.0% 10.6% 9.1% 7.2% 6.4% 3.2% 2.9% 2.5% 1.3% 0.9% 0.5% 0.5%
3S PMG FRC 33.1% 9.7% 13.1% 0.8% 9.8% 7.8% 0.5% 3.5% 2.5% 2.6% 1.5% 3.7% 8.2% 3.1%
2S PMG FRC 35.5% 7.5% 14.0% 1.0% 9.7% 8.1% 0.5% 2.5% 2.5% 1.7% 1.5% 3.7% 8.5% 3.2%
DD PMG FRC 38.0% 0.0% 15.5% 1.8% 11.5% 9.3% 0.7% 0.0% 3.6% 0.0% 1.7% 4.4% 9.9% 3.6%
0.0%
10.0%
20.0%
30.0%
40.0%
50.0%
60.0%
Co
ntr
ibu
tio
n t
o d
ow
nti
me
50km Offshore
Rest ofTurbineMinorRepair
Rest ofTurbineMajorRepair
GeneratorMajorRepair
RemoteResets
GearboxMajor
Replacment
GeneratorMajor
Replacment
GeneratorMinorRepair
GearboxMinorRepair
ScheduledMaintena
nce
GearboxMajorRepair
ConverterMajorRepair
ConverterMinorRepair
Rest ofTurbineMajor
Replacment
ConverterMajor
Replacment
3S DFIG PRC 53.3% 9.5% 6.1% 5.6% 5.5% 5.0% 4.9% 4.0% 2.0% 1.4% 1.1% 0.8% 0.6% 0.3%
3S PMG FRC 54.0% 9.6% 0.4% 5.8% 4.3% 0.3% 4.1% 4.1% 2.2% 1.6% 4.2% 5.1% 0.7% 3.6%
2S PMG FRC 54.9% 10.0% 0.5% 6.1% 3.2% 0.4% 4.5% 3.0% 2.3% 1.2% 4.2% 5.2% 0.7% 3.8%
DD PMG FRC 58.4% 10.6% 0.6% 6.6% 0.0% 0.8% 5.5% 0.0% 2.6% 0.0% 4.5% 5.5% 0.7% 4.2%
0.0%
10.0%
20.0%
30.0%
40.0%
50.0%
60.0%
Co
ntr
ibu
tio
n t
o d
ow
nti
me
100km Offshore

5.3 O&M Costs
Figure 9 shows the O&M costs per MWh for near shore, medium and far shore sites. Lost production costs
are shown in black, transport costs are shown in dark grey, staff costs are shown in lighter grey and repair
costs are shown in white. It can be seen that for three of the four wind turbine types up to 50km the
majority of O&M costs came equally from transport and lost production costs representing ~ 45% of costs
each, with repair and staff costs representing ~5% each. For the direct drive turbines the contribution of
transport cost was lower because the expensive jack up vessel was not required as often due to the absence
of the gearbox. At the 100km wind farm, the rise in lost production costs due to the drop in availability is
clear in Figure 9 in which the lost production cost is seen to rise from ~45% of the overall O&M cost to
~65%, with transport costs making up ~28% and staff and repair costs each making up ~3.5% of the overall
O&M cost for the DFIG turbine type.
O&M costs (expressed on an annual basis) are higher for the DFIG configuration than for the PMG
configurations because the lost production costs, transport costs, staff costs and repair costs are all higher
for the DFIGs in this analysis . The lost production costs are higher for the same reasons as the low DFIG
availability, as discussed in section 5.2. The mean annual transport costs are higher for DFIGs because the
DFIG configuration requires the jack-up vessel more often (due to its higher overall major replacement
failure rate) and as seen in Figure 10 it is the jack up vessel that contributes most to the transport costs. The
staff and repair costs are higher because the major replacement failure rates for the DFIG configuration are
higher than for the PMG configuration. As seen in [11] it is these major replacements that encounter the
highest repair costs and staff requirements. The 2 stage and direct drive configurations have lower O&M
costs than the 3 stage because the downsizing or removal of the gearbox reduce or eliminate the major
replacement failures which are the largest contributors to the O&M costs. In terms of O&M costs, the

reduction in gearbox major replacements outweighs any increase in O&M costs due to generator failures.
Figure 9. Breakdown of O&M costs showing all drive train types
The largest contributors to the O&M costs came from the lost production and transport cost, therefore
further analysis has been carried out for both of these areas. Figure 8, which gives the percentage of
downtime for each failure group, is also indicative of the percentage of lost production costs for each
failure group. Consequently the earlier comments on the downtime categories hold true for the lost
production contributions.
Transport costs were the second largest contributor to the overall O&M costs. Figure 10 shows the
transport costs for 10km, 50km and 100km sites. The transport costs are made up of crew transfer vessels
(CTVs) shown by the lines with a square, and heavy lift vessels (HLVs) vessels shown by the lines with a
triangle. The DFIG drive train is shown in black and the PMG drive trains are shown in different shades of
grey. Across all three sites the PMG turbines had a higher percentage of overall transport cost for the CTV,
this was due to the higher failure rate of the converter. However the DFIG turbine had a higher percentage
of its overall costs attributed to HLVs because the DFIG has a higher failure rate than the PMG. It is this
higher heavy lift vessel cost that makes the 3 stage DFIG configuration have a ~16% higher overall
transport cost at 50km than the turbine with a 3 stage PMG. The overall transport costs are shown for each
site and turbine type in Figure 9.
10km DFIGPRC
10 km 3SPMG FRC
10 km 2SPMG FRC
10 km DDPMG FRC
50km DFIGPRC
50 km PMGFRC
50 km 2SPMG FRC
50 km DDPMG FRC
100km DFIGPRC
100 km PMGFRC
100 km 2SPMG FRC
100 km DDPMG FRC
Repair Costs (£) 1.61 1.26 0.94 0.79 1.65 1.26 1.15 0.80 1.88 1.46 1.08 0.89
Staff Costs (£) 1.71 1.63 1.6 1.49 1.74 1.65 1.65 1.5 2.01 1.9 1.85 1.71
Transport Costs (£) 13.95 11.75 10.73 5.66 14.37 12.05 11.06 5.88 17.03 14.24 13 7.02
Lost Production Costs (£) 12.26 11.16 10.53 9.04 14.37 13.03 11.68 10.72 38.81 36.63 35 31.13
0.00
10.00
20.00
30.00
40.00
50.00
60.00
70.00O
&M
Co
st (
£/M
Wh
)
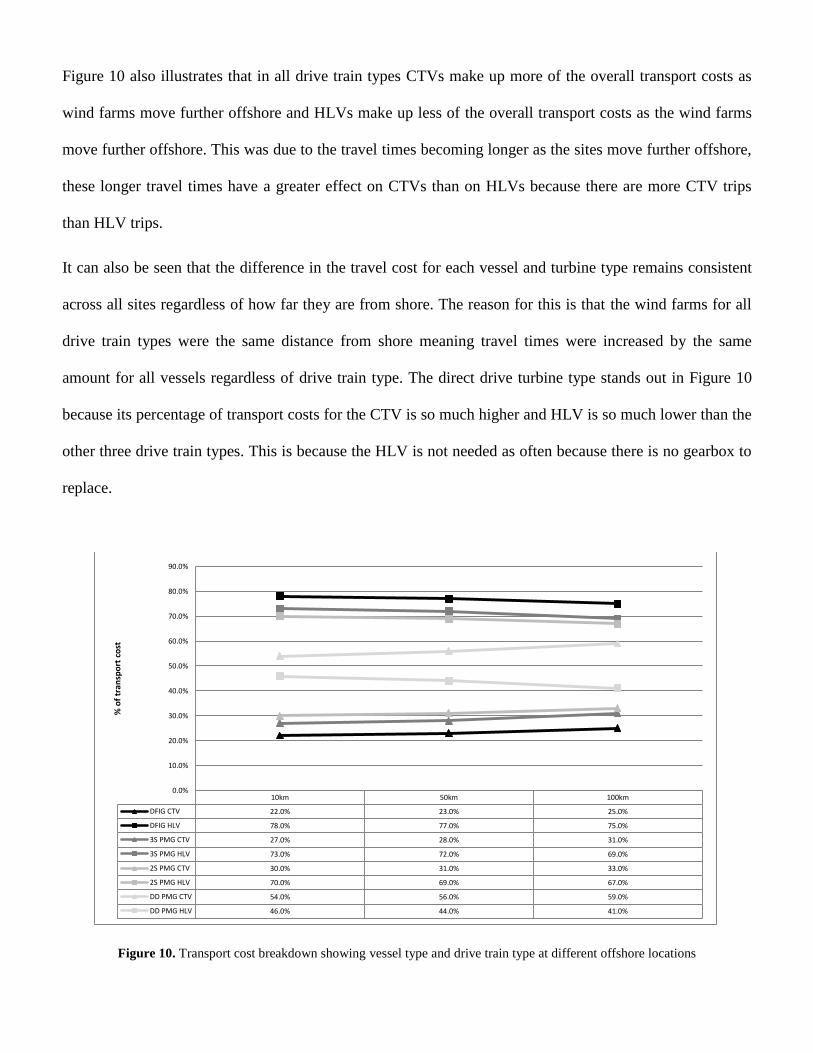
Figure 10 also illustrates that in all drive train types CTVs make up more of the overall transport costs as
wind farms move further offshore and HLVs make up less of the overall transport costs as the wind farms
move further offshore. This was due to the travel times becoming longer as the sites move further offshore,
these longer travel times have a greater effect on CTVs than on HLVs because there are more CTV trips
than HLV trips.
It can also be seen that the difference in the travel cost for each vessel and turbine type remains consistent
across all sites regardless of how far they are from shore. The reason for this is that the wind farms for all
drive train types were the same distance from shore meaning travel times were increased by the same
amount for all vessels regardless of drive train type. The direct drive turbine type stands out in Figure 10
because its percentage of transport costs for the CTV is so much higher and HLV is so much lower than the
other three drive train types. This is because the HLV is not needed as often because there is no gearbox to
replace.
Figure 10. Transport cost breakdown showing vessel type and drive train type at different offshore locations
10km 50km 100km
DFIG CTV 22.0% 23.0% 25.0%
DFIG HLV 78.0% 77.0% 75.0%
3S PMG CTV 27.0% 28.0% 31.0%
3S PMG HLV 73.0% 72.0% 69.0%
2S PMG CTV 30.0% 31.0% 33.0%
2S PMG HLV 70.0% 69.0% 67.0%
DD PMG CTV 54.0% 56.0% 59.0%
DD PMG HLV 46.0% 44.0% 41.0%
0.0%
10.0%
20.0%
30.0%
40.0%
50.0%
60.0%
70.0%
80.0%
90.0%
% o
f tr
ansp
ort
co
st

5.4 Failure Rate Input Sensitivity Analysis
As a means of determining how reliant the results are on the failure rate inputs, a sensitivity analysis was
carried out. The reader should recall that the failure rate data for both of the 3 stage turbines came from
empirical data, but those inputs for the turbines with PMGs with a 2 stage gearbox and direct drive
generators were synthesized. All of these failure rates have uncertainty, though the uncertainty is greater for
the turbines with synthesized failure rates. As the failure rates for both 3 stage drive trains came from
empirical data their failure rates remained the same and were plotted as constant lines in Figure 11. The
sensitivity analysis was carried out to determine how much the failure rate could increase in the direct drive
and 2 stage drive train types before their availability was lower than the 3 stage drive train types. Figure 11
illustrates that if the 2 stage failure rate is increased by 10% the availability drops below both 3 stage
turbine types. It also shows that the availability of the direct drive turbine type drops below both 3 stage
turbines when its failure rates were increased by 20%. The failure rate was also decreased by 20% for both
turbine types that used estimated failure rates to demonstrate the scale of improvement in availability when
failure rates were reduced.
Figure 11 also shows that the 2 stage and direct drive lines diverge further at 120% than at 80% of the
baseline failure rate. It is clear from this that as the failure rates increase the difference in availability
between the turbine types also increases. The driver for this increase in difference is the increase in failure
rates of the gearbox and 2 stage PMG repairs that require a HLV. This has a greater effect on the overall
availability than the increase of failures in the direct drive PMG does as the latter does not require HLVs as
frequently.

Figure 11. Sensitivity analysis of failure rate inputs on availability outputs showing varying failure rate inputs for both drivetrain
types that use estimated failure rates.
Reference [8] states that the failure rates for the DFIG PRC configuration have reached their lowest failure
rate level because it is a mature technology whereas the failure rates for the PMG FRC turbines may still
fall as it is still maturing. This suggests that if the failure rates are going to change, it is most likely that
they will change in favour of the PMG configurations.
As mentioned in section 4.1 and discussed in section 6.4, the technician time in turbine (repair time) for
each repair type (e.g. minor generator repair, major converter repair etc.) was assumed the same across all 4
turbine types. As this is an assumption it was investigated if changes to this repair time would affect the
overall results of this paper. Based on [30] it was concluded that the 3 stage DFIG would remain the drive
train configuration with the highest O&M costs even if the repair times for the gearbox, generator and
converter dropped by 20%. Based on the same paper it was concluded that the direct drive PMG FRC
would remain the drive train configuration with the lowest O&M costs even if the repair times for the
generator and converter increased by 20% . Consequently it is felt that changes to the repair times of less
than 20% should not affect the overall order of the turbine type O&M costs shown in this paper.
80% 90% 100% 110% 120%
DFIG PRC (€) 90.5% 90.5% 90.5% 90.5% 90.5%
3S PMG FRC (€) 91.3% 91.3% 91.3% 91.3% 91.3%
2S PMG FRC (€) 93.4% 92.5% 91.9% 90.6% 89.3%
DD PMG FRC (€) 94.1% 93.4% 92.6% 91.6% 90.5%
86.0%
87.0%
88.0%
89.0%
90.0%
91.0%
92.0%
93.0%
94.0%
95.0%
Ava
ilib
ility

6. Discussion
The choice of different drive train types is one of the main differentiators between different offshore wind
turbines. Improvements in availability and O&M costs are often cited as reasons for choosing one type over
another, yet most papers concentrate on the variation in capital costs and efficiency. This paper is unique in
simulating availability and O&M cost analysis for a number of hypothetical offshore wind farms with wind
turbines consisting of different drive train types. Results are based on up to date reliability and cost input
data from existing modern multi-MW offshore turbines and on derived failure rates for those turbines about
to enter service.
6.1 Turbine selection – which drivetrain is best?
Availability
This study found that turbines with a permanent magnet generator have a higher availability at all sites than
those turbines with a DFIG. Based on onshore failure rates only [8] this may have been unexpected as the
combined failure rates of generator and power converter were higher for the turbines with PMG. This result
was somewhat unexpected as experience from a previous study of onshore failure rates (presented in [8])
showed that the combined failure rates of generator and power converter were higher for a turbine with a
PMG than for a near identical DFIG wind turbine. The turbines with PMGs have a higher availability than
the DFIG configuration in this study because the higher minor/major repair failure rate of the FRC – and
the mean annual downtime related to it – is outweighed by the higher major replacement failure rates and
subsequent downtimes of the DFIG. The primary cause of these higher downtimes is the increased need for
heavy lift vessels. Reference [10] has suggested that the failure rate for direct drive wound rotor generators
will be twice that of the geared machines. However, the direct drive generator included in this analysis is a
PMG and not a wound rotor generator. In this paper, the direct drive PMG is estimated to have around 30%
more failures than a geared PMG. This result is based on [31], in which the failure modes related to the

excitation system and rotor windings of the wound rotor direct drive generator are removed. Out of the
turbines with a permanent magnet generator, the direct drive had the highest availability, and then the
turbine with a 2 stage gearbox followed by the turbine with a 3 stage gearbox. This is consistent across all
the wind farms regardless of the distance to shore.
Turbines with permanent magnet generators are recommended from a point of view of maximizing
availability, with a preference for lower speed generators with no gearbox.
O&M cost
DFIG PRC turbine types have a higher O&M cost/MWh than all of the PMG FRC turbine types across all
wind farms in this paper. As with availability, the direct drive turbine type with a PMG appears to be the
best performing with the lowest O&M costs, followed by the PMG with a 2 stage gearbox and then a 3
stage gearbox.
Of the two turbines which have failure rates based on real machines, the difference at the 50km site in:
lost production costs are 9.5% in favour of the PMG,
O&M transport costs are 16.5% in favour of the PMG,
O&M staff costs are 5% in favour of the PMG,
repair costs are 22% in favour of the PMG
Turbines with permanent magnet generators are recommended from a point of view of minimizing O&M
costs, with a preference for lower speed generators with no gearbox.
6.2 How should the different drivetrain equipment be improved?
If the contributions of the three drive train components alone were considered, the generator failures were
the biggest contributors to downtime for the DFIG turbine, followed by the gearbox failures and then the
PRC failures. This is consistent across all sites. So as to improve the future performance of these turbines,
efforts should be focused on reducing failure rates in the DFIG followed by reducing failures in the
gearbox.

For the direct drive turbines and turbines with a 2 stage gearbox and PMG, it is the power converter that is
the biggest contributor to downtime followed by the gearbox (if there is one) and then the generator. This is
consistent across all sites. Reducing failure rates in the converters is important, especially for wind farms
further offshore.
If the turbine with a 3 stage gearbox and PMG is considered it can be seen that for the 10km and 50km sites
the gearbox is the biggest contributor to downtime followed by the converter and then the generator. For
the 100km site, the converter becomes the largest contributor to downtime followed by the gearbox and
then the generator.
The results also suggest that significant availability improvements and O&M cost reductions can be
expected from redesigning gearboxes and generators so that the most severe failures can be repaired
without the use of heavy lift vessels.
6.3 The importance of distance to shore
The study has found that all turbine types here have increased downtime for wind farms much further from
shore. The decline in availability is fairly constant up until about 70-80km from shore, when availability
drops more sharply. At wind farms this far from shore, the percentage contribution of minor repairs
becomes larger, and it is recommended that increased resources and different O&M strategies are used in
order to address these issues (especially the cost of CTV use for far offshore sites).
For the O&M costs, the relative costs of the different categories changes with distance to shore. At the
10km and 50km sites in this analysis for the turbines with gearboxes the O&M costs were broken down as
follows: lost production costs and transport costs each equal ~45% and the staff and repair costs each equal
~ 5% of the total O&M costs. When the wind farms moved further offshore to 100km this overall O&M
cost break down changed to ~65% lost production costs, 28% transport costs, 3.5% staff costs and 3.5%
repair costs. The fourth (direct drive) turbine had a lower transport cost due to the removal of the need for a

jack up vessel for gearbox replacements. These changes to relative cost categories further reinforces the
need to spend more on staff and transport for far offshore sites.
The direct drive turbine appeared to be the best turbine, no matter what distance from shore. The location
of the wind farm only influenced the relative superiority of the turbines with PMGs over the DFIG turbines
and between direct drive turbines and those with gearboxes.
6.4 How robust are these conclusions?
It is important to reflect on the analysis here, its limitations and the major causes of uncertainties. The
quality of the results of the analysis presented here depend on:
Failure rates and repair times for the gearbox, generator and power converters. These were
based on data from a variety of sources. For one of the 3 stage gearbox configurations the failure
rates and repair times were taken from offshore wind farms over a number of years and so these
results have the smallest uncertainty, although it should be noted that future equipment or
equipment from other manufacturers may have higher or lower failure rates. For the second 3 stage
configuration, there is additional uncertainty as the failure rates for the generator and power
converter were scaled from data from real onshore wind farms and repair times were assumed the
same as the first 3 stage configuration. The turbines with the greatest uncertainty in failure rates are
those with a 2 stage gearbox and the direct drive configuration, as failure rates for the gearbox and
generator were modified using the REMM approach. Repair times were once again assumed the
same as the other configurations. If the assumed failure rates or repair times are significantly wrong,
then one turbine type may be relatively penalised compared to another.
Failure rate and repair times for the rest of the turbine. These were based on data for an
existing offshore wind turbine. Future, improved turbines or turbine from other manufacturers may
have higher or lower failure rates, resource requirements and repair types. If these inputs change,
the effect would be to shift up or down the availability and O&M costs, but should not affect the
relative performance on the different turbine types.

Repair for failures. There is uncertainty as the model is predicated on using particular vessel types
and resources for different failures. Partly based on a real wind farm data, this will be different for
different wind farms, turbine manufacturers and O&M operators.
Strategies to improve availability and O&M. We have assumed the same scheduled and reactive
strategy of O&M for all wind farms. It has been shown that condition monitoring and condition
based maintenance can improve availability and may do so more for turbines with DFIGs and those
with gearboxes.
The authors have tried to expose the study’s results to some of these uncertainties by carrying out a set of
sensitivity analyses, focusing on the failure rates. If input failure rates range from 80% to 120% of the
baseline failure rate, the direct drive turbine continues to have a higher availability and lower O&M costs
than the other turbines. This holds true for all sites in this analysis.
6.5 Final remarks
Given the relatively small difference between the wind farm capital costs and the turbines having similar
efficiencies, the improvements in availability and the lower O&M costs suggest that the direct drive wind
turbine with a permanent magnet generator should give a lower cost of energy than the turbines with
gearboxes, whether they use DFIGs or PMGs. This is borne out by [32] in which the lower turbine cost of
the 3 stage turbine is outweighed by its lower energy production (driven by availability) and higher O&M
costs (driven by its more regular requirement for the more costly heavy lift vessel for repair).
7. Conclusion
As described in the results and discussion sections of this paper, this study found that turbines with a
permanent magnet generator have a higher availability at all sites analysed than those turbines with a DFIG.
It has been shown (subject to the proviso of the input data and assumptions being correct) that wind
turbines with permanent magnet generators are recommended from a point of view of maximizing
availability, with a preference for lower speed generators with no gearbox.

The paper found that DFIG PRC turbine types have a higher O&M cost/MWh than all of the PMG FRC
turbine types across all wind farms in this paper. As with availability, the direct drive turbine type with a
PMG performed best with the lowest O&M costs, followed by the PMG with a 2 stage gearbox and then a
3 stage gearbox. The cost of the heavy lift vessel and its higher frequency of use in the 3 stage
configuration was the main reason for the higher O&M cost.
The study has found that all turbine types considered here have increased downtime for wind farms much
further from shore. The direct drive turbine appeared to be the best turbine, no matter what distance from
shore. The location of the wind farm only influenced the relative superiority of the turbines with PMGs
over the DFIG turbines and between direct drive turbines and those with gearboxes.
It should be noted that these conclusions are based on a number of assumptions regarding failure severities,
repair times and modes and costs of access, thus there are notable levels of uncertainty. Uncertainty is
present in this analysis through failure rate inputs (some were based on field data from a particular model
of wind turbines, whereas as a formal methodology was used to estimate failure rates for the turbines with
PMGs and 2 stage gearboxes and direct drive configurations) and through assumptions made in the
modelling such as the repair times for different failure severity categories. As with most models, the
uncertainty of the results and conclusions can be reduced by refining the input data. Suggestions for further
work include more detailed offshore failure rate analysis for direct drive turbines and 2 stage gearboxes
configurations with PMGs and FRCs along with further repair time analysis for all configurations.
Acknowledgements
The authors would like to thank the University of Strathclyde Technology Innovation Centre Wind partners
for allowing the use of the AM-02 O&M modelling tool in this paper. The authors would also like to thank
Yalcin Dalgic for his guidance on the vessel types and strategies.

References
[1] The Crown Estate. Offshore Wind Cost Reduction, Pathways Study. The Crown Estate 2012
[2] Department of Energy and Climate Change UK. Electricity Generation Costs 2013
[3] Ng CH. Ran L. Offshore wind farms: Technologies, design and operation. Book. Woodhead Publishing
2016
[4] Graves et al. Understanding Availability Trends of Operating Wind Farms. Houston. AWEA 2008
[5] Carroll J, May A, McDonald A, McMillan D. Availability Improvements From Condition Monitoring
Systems and Performance Based Maintenance Contracts. Copenhagen. EWEA Offshore 2015
[6] van Bussel GW, Schontag C. Operation and Maintenance Aspects of Large Offshore Windfarms.
Dublin. EWEA 1997
[7] El- Sharkawi M. Wind Energy Intoduction. Book. CRC Press 2015
[8] Carroll J, McDonald A, McMillian D. Reliability Comparison of Wind Turbines with DFIG and PMG
Drive Trains. IEEE Trans. Energy Convers., vol. PP, pp. 1–8, Dec. 2014
[9] Vestas Promotional Material. Offshore V164 & V112. Accessed on 26/08/2015 Accesed at:
http://nozebra.ipapercms.dk/Vestas/Communication/Productbrochure/OffshoreProductBrochure/OffshorePr
oductBrochure/
[10] Tavner P. Offshore Wind Turbines: Reliability, availability & maintenance. Book. The IET 2012
[11] Carroll J. McDonald A. McMillan D. Failure Rate, Repair Time and Unscheduled O&M Cost Analysis
of Offshore Wind Turbines. Wiley Wind Energy Journal, July 2015.
[12] Dinwoodie I, McMillan D, Quail F. Analysis of offshore wind turbine operation & maintenance using
a novel time domain meteo-ocean modeling approach. Copenhagen. ASME Turbo Expo 2012
[13] Hart K, McDonald A, Polinder H, Corr E, Carroll J. Improved cost energy comparison of permanent
magnet generators for large offshore wind turbines. Barcelona. EWEA 2014
[14] Polinder H, Van Der Pijl F, De Vilder G, Tavner P. Comparison of Direct-Drive and Geared Generator
Concepts for Wind Turbines. IEEE Trans. on Energy Convers., vol. 21, no. 3, pp. 725- 733, 2006.
[15] EWEA. The European offshore wind industry - key trends and statistics 2014. EWEA 2015
[16] Feng Y, Tavner P, Long H. Early experiences with UK Round 1 offshore wind farms. Proceedings of
the Institution of Civil Engineers : energy., 163 (4). pp. 167-181. 2010
[17] Nordzeewind. Operational Reports. Accessed on: 04/09/2015. Accessed at:
http://www.noordzeewind.nl/en/knowledge/reportsdata/

[18] Hofmann M. A Review of Decision Support Models for Offshore Wind Farms with an Emphasis on
Operation and Maintenance Strategies. Wind Engineering 2011
[19] Dalgic Y, Lazakis I, Dinwoodie I, McMillan D, Revie M. Advanced logistics planning for offshore
wind farm operation and maintenance activities. Ocean Engineering Volume 101, 1 June 2015, Pages 211–
226
[20] BMU and PTJ, FINO 1 Meteorological Dataset 2004 – 2012, Accesed on: 01/12/2014. Accessed at
http://fino.bsh.de
[21] Dalgic Y, Lazakis I, Turan O. Vessel charter rate estimation for offshore wind O&M activity. A
Coruna IMAM 2013
[22] Smoulders K, Long H, Feng Y, Tavner P. Reliability Analysis and Prediction of Wind Turbine
Gearboxes. Warsaw. EWEC, 2010.
[23] Carroll J, McDonald A, Feuchtwang J, McMillan D. Drive Train Availability in Offshore Wind
Turbines. Barcelona EWEA 2014
[24] Walls L, Quigley J, Marshall J. Modeling to support reliability enhancement during product
development with applications in the UK aerospace industry. Engineering Management, IEEE Transactions
on 53.2 (2006): 263-274.
[25] Walls L, Quigley J. Learning to enhance reliability of electronic systems through effective modeling
and risk assessment. Reliability and Maintainability Symposium, 2000. Proceedings. Annual. IEEE, 2000.
[26] Quigley J, Walls L. Cost–benefit modelling for reliability growth. Journal of the Operational Research
Society 54.12 (2003): 1234-1241.
[27] Hodge R et al. Eliciting engineering knowledge about reliability during design‐lessons learnt from
implementation. Quality and Reliability Engineering International 17.3 (2001): 169-179.
[28] Spinato F, Tavner P, van Bussel G, Koutoulakos E. Reliability of wind turbine subassemblies, IET
Renew. Power Generation, vol. 3, no. 4, pp. 1–15, Sep. 2009.
[29] Faulstich S, Hahn B, Tavner P. Wind turbine downtime and its importance for offshore deployment.
Wiley Wind Energy 2011
[30] Carroll J, Dinwoodie I, McDonald A, McMillan D. Quantifying O&M savings and availability
improvements from wind turbine design for maintenance techniques. EWEA Offshore CPH 2015
[31] Alewine K. Wind Turbine Generator Failure modes analysis and occurance. NREL, 2011.
[32] Carroll J, McDonald A, McMillan D, Stehly T, Mone Christopher, Maples B. Cost of Energy for
Offshore Wind Turbines with Different Drive Train Types. EWEA Paris 2015