available online a t · 3170 n-h stretching 3165 n-h stretching 2870, 2703 c ... the dielectric...
TRANSCRIPT

www.scholarsresearchlibrary.com tAvailable online a
Scholars Research Library
Archives of Applied Science Research, 2014, 6 (5):135-143
(http://scholarsresearchlibrary.com/archive.html)
ISSN 0975-508X
CODEN (USA) AASRC9
135 Scholars Research Library
A comparative study of Growth and Characterization of Nonlinear Optical materials: L – Threonine hydrochloride and Zinc chloride doped L - Threonine hydrochloride
V. Ramesha,b* , P.R. Umaranib and D. Jayaramanb
aDepartment of Physics , Bharath University, Chennai -India bDepartment of Physics, Presidency College, Chennai-India
_____________________________________________________________________________
ABSTRACT L - Threonine hydrochloride (LTHCl) and zinc chloride doped L - Threonine hydrochloride crystals are aminoacid compounds which have been successfully grown by slow evaporation method . Single crystal X-ray diffraction studies reveal that the LTHCl and zinc chloride doped crystals belong to orthorhombic crystal system with space group P21 . UV-vis-NIR absorption spectrum shows that crystals have wide optical window in the range of 190-1100 nm. The functional groups of the grown crystals were analyzed by FT-IR spectral studies. The dielectric property of grown crystals was established by dielectric measurements. Vickers microhardness test was also carried out to elucidate the mechanical behavior of the grown crystals. FESEM - EDAX and ICP-OES studies confirm the presence of zinc chloride in LTHCl crystal . The second harmonic generation (SHG) behaviour of the grown crystals has been confirmed by Kurtz-Perry powder technique and the result shows that the incorporation of zinc chloride in LTHCl has improved the SHG efficiency. Keywords: UV–vis–NIR study, FTIR spectral study, Dielectric study, Microhardness study, SHG. ___________________________________________________________________________________________
INTRODUCTION Growth and characterization of aminoacid compound L-Threonine hydro chloride (LTHCl) have already been reported as a promising NLO material with SHG efficiency higher than that of KDP [1]. For the past few years, the nonlinear optical (NLO) properties of organic materials draw more attention due to their large electro optic coefficient with low frequency dispersion and high nonlinearity. Hence, there is need to expand the search for the new metal – ions doped aminoacid NLO materials and their properties with a view to study the effect of doped metal -ions on the host material [2,3]. Non-linear optical materials have wide applications in various fields like optical data storage, photorefractive phenomenon, frequency multipliers, optical switches, etc. In the present study, LTHCl and zinc chloride doped L- Threonine hydrochloride crystals have been successfully grown by slow evaporation technique to analyze the changes in the properties of the doped materials. The grown crystals were characterized by XRD, UV- vis –NIR, FTIR, Dielectric, Microhardness studies, FESEM-EDAX, ICP-OES and NLO Measurements.
V Ramesha et al Arch. Appl. Sci. Res., 2014, 6 (5):135-143 ______________________________________________________________________________
136 Scholars Research Library
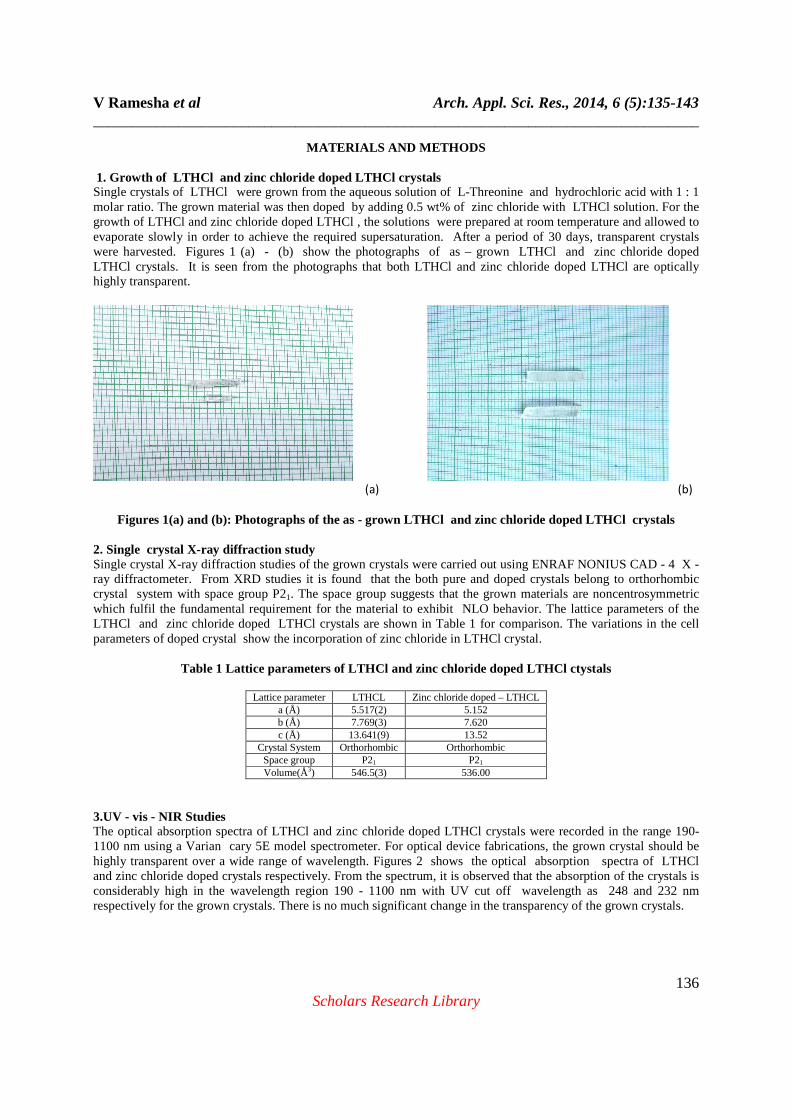
MATERIALS AND METHODS 1. Growth of LTHCl and zinc chloride doped LTHCl cry stals Single crystals of LTHCl were grown from the aqueous solution of L-Threonine and hydrochloric acid with 1 : 1 molar ratio. The grown material was then doped by adding 0.5 wt% of zinc chloride with LTHCl solution. For the growth of LTHCl and zinc chloride doped LTHCl , the solutions were prepared at room temperature and allowed to evaporate slowly in order to achieve the required supersaturation. After a period of 30 days, transparent crystals were harvested. Figures 1 (a) - (b) show the photographs of as – grown LTHCl and zinc chloride doped LTHCl crystals. It is seen from the photographs that both LTHCl and zinc chloride doped LTHCl are optically highly transparent.
(a) (b)
Figures 1(a) and (b): Photographs of the as - grown LTHCl and zinc chloride doped LTHCl crystals
2. Single crystal X-ray diffraction study Single crystal X-ray diffraction studies of the grown crystals were carried out using ENRAF NONIUS CAD - 4 X - ray diffractometer. From XRD studies it is found that the both pure and doped crystals belong to orthorhombic crystal system with space group P21. The space group suggests that the grown materials are noncentrosymmetric which fulfil the fundamental requirement for the material to exhibit NLO behavior. The lattice parameters of the LTHCl and zinc chloride doped LTHCl crystals are shown in Table 1 for comparison. The variations in the cell parameters of doped crystal show the incorporation of zinc chloride in LTHCl crystal.
Table 1 Lattice parameters of LTHCl and zinc chloride doped LTHCl ctystals
Lattice parameter LTHCL Zinc chloride doped – LTHCL a (Å) 5.517(2) 5.152 b (Å) 7.769(3) 7.620 c (Å) 13.641(9) 13.52
Crystal System Orthorhombic Orthorhombic Space group P21 P21 Volume(Å3) 546.5(3) 536.00
3.UV - vis - NIR Studies The optical absorption spectra of LTHCl and zinc chloride doped LTHCl crystals were recorded in the range 190-1100 nm using a Varian cary 5E model spectrometer. For optical device fabrications, the grown crystal should be highly transparent over a wide range of wavelength. Figures 2 shows the optical absorption spectra of LTHCl and zinc chloride doped crystals respectively. From the spectrum, it is observed that the absorption of the crystals is considerably high in the wavelength region 190 - 1100 nm with UV cut off wavelength as 248 and 232 nm respectively for the grown crystals. There is no much significant change in the transparency of the grown crystals.

V Ramesha et al Arch. Appl. Sci. Res., 2014, 6 (5):135-143 ______________________________________________________________________________
137 Scholars Research Library
1 0 0 2 0 0 3 0 0 4 0 0 5 0 0 6 0 0 7 0 0 8 0 0 9 0 0 1 0 0 0
0
2
4
6
8
1 0
L T H C l + Z n c l2
L T H C l
n m
Abs
orba
nce
Figure 2 : UV– vis- NIR Absorption Spectra of LTHCl and zinc chloride doped LTHCl crystals
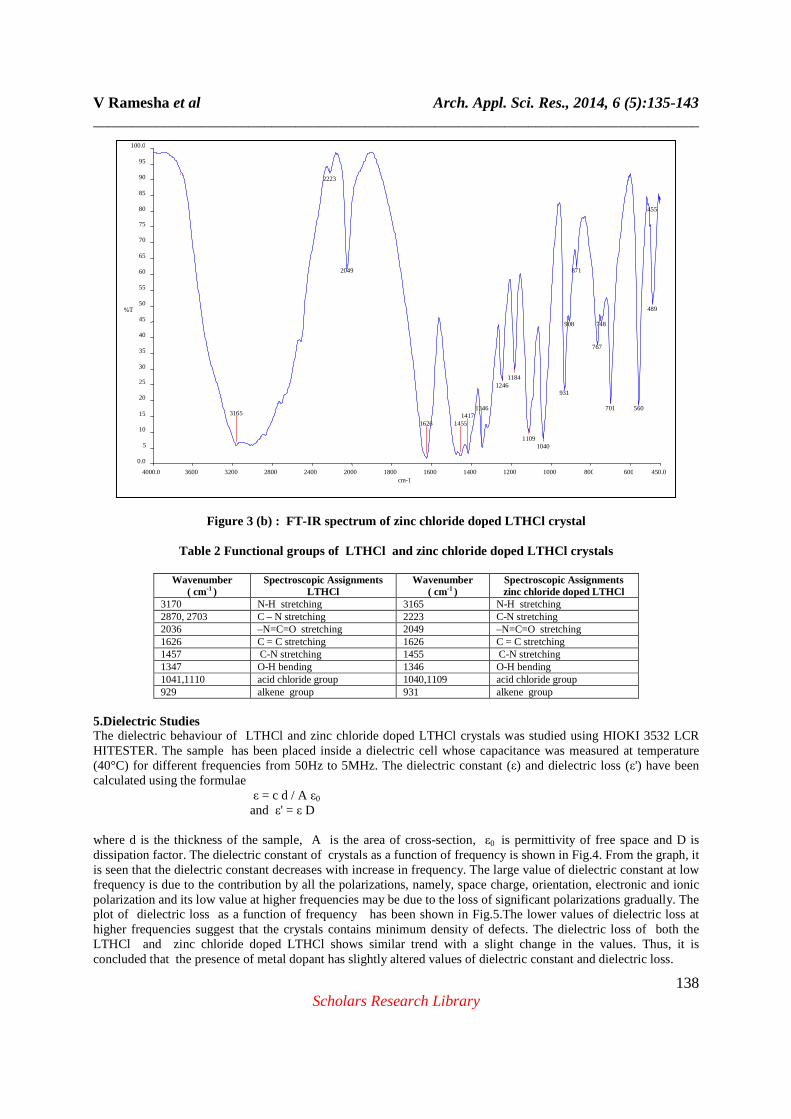
4. FT-IR Spectroscopic Analysis The various functional groups present in LTHCl and doped LTHCl crystals were identified using FTIR spectral analyses. FT- IR spectrum was recorded for the samples in the range 450 - 4000 cm-1 using the instrument FT- IR 4100 type spectrometer. Figures 3 (a) and(b) show the FTIR spectrum of LTHCl and zinc chloride doped LTHCl respectively. The broad envelope positioned between 2049 - 3165 cm -1 and 2036 - 3170 cm -1 correspond to the N-H and C-N stretching of pure and zinc chloride doped LTHCl crystals. The peaks at 1626 cm -1 corresponds to C - C stretching. The O - H bending is indicated at 1346 cm -1. Acid chloride group is shown corresponding to the peaks at 1041 and 1110 cm -1. The presence of alkene group is confirmed due to the peak at 929 cm -1 . Table 2 presents the various functional groups present in LTHCl and zinc chloride doped LTHCl crystals. The shift in the various peaks of the FTIR spectrum of zinc chloride doped LTHCl may be due to the incorporation of metal ion in LTHCl.
Figure 3(a) : FT-IR spectrum of LTHCl crystal
4 0 0 0 3 5 0 0 3 0 0 0 2 5 0 0 2 0 0 0 1 5 0 0 1 0 0 0 5 0 0- 1 0
0
1 0
2 0
3 0
4 0
5 0
6 0
7 0
8 0
9 0
1 0 0
1 1 0
% T
c m - 1
3170
28 70
2703
25 09
2036
1626
1459
14171347
1110
1041
929
V Ramesha et al Arch. Appl. Sci. Res., 2014, 6 (5):135-143 ______________________________________________________________________________
138 Scholars Research Library
Figure 3 (b) : FT-IR spectrum of zinc chloride doped LTHCl crystal
Table 2 Functional groups of LTHCl and zinc chloride doped LTHCl crystals
Wavenumber ( cm-1 )
Spectroscopic Assignments LTHCl
Wavenumber ( cm-1 )
Spectroscopic Assignments zinc chloride doped LTHCl
3170 N-H stretching 3165 N-H stretching 2870, 2703 C – N stretching 2223 C-N stretching 2036 –N=C=O stretching 2049 –N=C=O stretching 1626 C = C stretching 1626 C = C stretching 1457 C-N stretching 1455 C-N stretching 1347 O-H bending 1346 O-H bending 1041,1110 acid chloride group 1040,1109 acid chloride group 929 alkene group 931 alkene group
5.Dielectric Studies The dielectric behaviour of LTHCl and zinc chloride doped LTHCl crystals was studied using HIOKI 3532 LCR HITESTER. The sample has been placed inside a dielectric cell whose capacitance was measured at temperature (40°C) for different frequencies from 50Hz to 5MHz. The dielectric constant (ε) and dielectric loss (ε') have been calculated using the formulae
ε = c d / A ε0
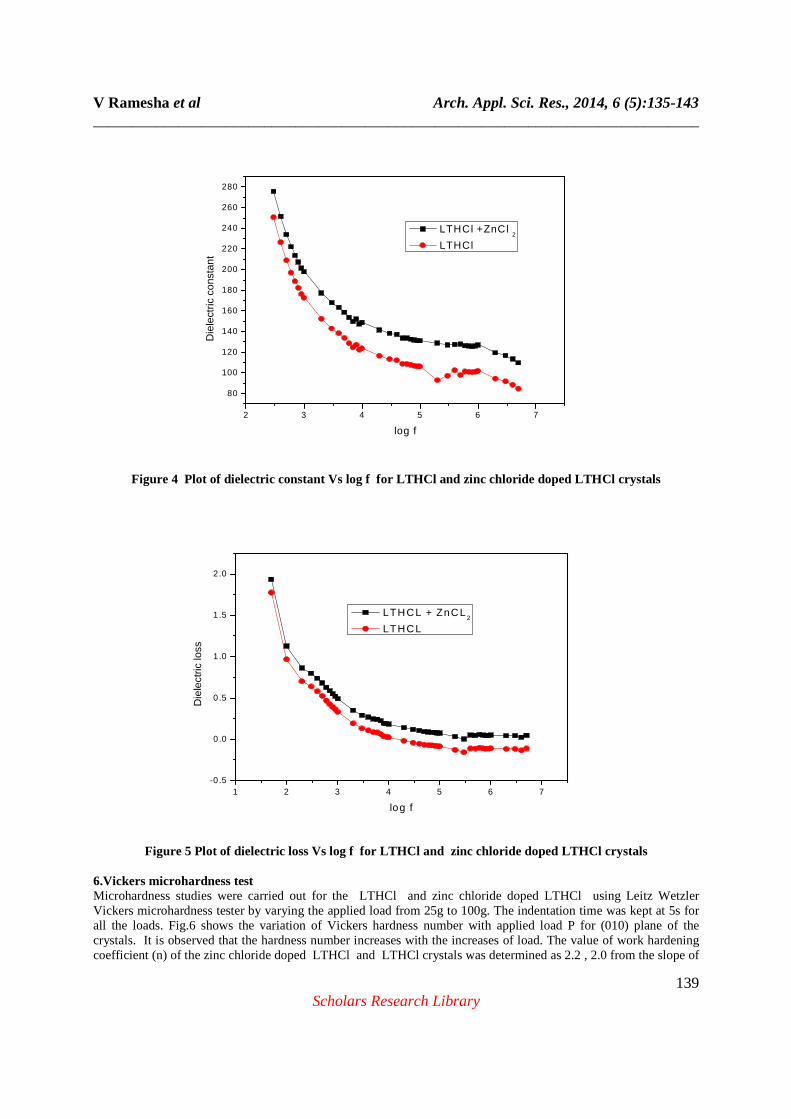
and ε' = ε D where d is the thickness of the sample, A is the area of cross-section, ε0 is permittivity of free space and D is dissipation factor. The dielectric constant of crystals as a function of frequency is shown in Fig.4. From the graph, it is seen that the dielectric constant decreases with increase in frequency. The large value of dielectric constant at low frequency is due to the contribution by all the polarizations, namely, space charge, orientation, electronic and ionic polarization and its low value at higher frequencies may be due to the loss of significant polarizations gradually. The plot of dielectric loss as a function of frequency has been shown in Fig.5.The lower values of dielectric loss at higher frequencies suggest that the crystals contains minimum density of defects. The dielectric loss of both the LTHCl and zinc chloride doped LTHCl shows similar trend with a slight change in the values. Thus, it is concluded that the presence of metal dopant has slightly altered values of dielectric constant and dielectric loss.
4000.0 3600 3200 2800 2400 2000 1800 1600 1400 1200 1000 800 600 450.0
0.0
5
10
15
20
25
30
35
40
45
50
55
60
65
70
75
80
85
90
95
100.0
cm-1
%T
3165
2223
2049
1626 1455 1417
1346
1246 1184
1109 1040
931
908
871
767
748
701 560
489
455
V Ramesha et al Arch. Appl. Sci. Res., 2014, 6 (5):135-143 ______________________________________________________________________________
139 Scholars Research Library
2 3 4 5 6 7
80
100
120
140
160
180
200
220
240
260
280
Die
lect
ric c
onst
ant
log f
LTHCl +ZnCl 2
LTHCl
Figure 4 Plot of dielectric constant Vs log f for LTHCl and zinc chloride doped LTHCl crystals
Figure 5 Plot of dielectric loss Vs log f for LTHCl and zinc chloride doped LTHCl crystals
6.Vickers microhardness test Microhardness studies were carried out for the LTHCl and zinc chloride doped LTHCl using Leitz Wetzler Vickers microhardness tester by varying the applied load from 25g to 100g. The indentation time was kept at 5s for all the loads. Fig.6 shows the variation of Vickers hardness number with applied load P for (010) plane of the crystals. It is observed that the hardness number increases with the increases of load. The value of work hardening coefficient (n) of the zinc chloride doped LTHCl and LTHCl crystals was determined as 2.2 , 2.0 from the slope of
1 2 3 4 5 6 7-0.5
0.0
0.5
1.0
1.5
2.0
Die
lect
ric lo
ss
log f
LTHCL + ZnCL2
LTHCL

V Ramesha et al Arch. Appl. Sci. Res., 2014, 6 (5):135-143 ______________________________________________________________________________
140 Scholars Research Library
the plot of log P vs log d (Fig.7). According to Onitch, if n is less than 3, the hardness number will increase with increase in load [5].The microhardness studies reveal that the doped crystals have a relatively high value for its work hardening coefficient. The results reveal that the zinc chloride doped LTHCl crystals are found to be harder than LTHCl[6].
20 30 40 50 60 70 80 90 100 110
45
50
55
60
65
70 LTHCl ZnCl
2 + LTHCl
Har
dnes
s N
umbe
r (K
g / m
m2 )
Load P (g)
Figure 6: Plot of hardness number vs load P
3 .4 3 .6 3 .8 4 .0
2 .1
2 .8
3 .5
ln P
ln d
LT H C l ZnC l
2 + L T H C l
Figure 7 : Plot of ln P vs ln d
7. EDAX and ICP- OES ANALYSIS The doped LTHCl crystal was analyzed by INCA200 energy dispersive X-ray micro analyzer equipped with LED steroscon 440 scanning electron microscope. Fig.8 shows the EDAX spectrum of crystal which confirms the presence of elements chlorine , carbon, nitrogen, oxygen and zinc in the grown crystal. Table 3 presents the compositional analysis of zinc chloride doped LTHCl crystal. The crystal was then subjected to inductively coupled
V Ramesha et al Arch. Appl. Sci. Res., 2014, 6 (5):135-143 ______________________________________________________________________________
141 Scholars Research Library
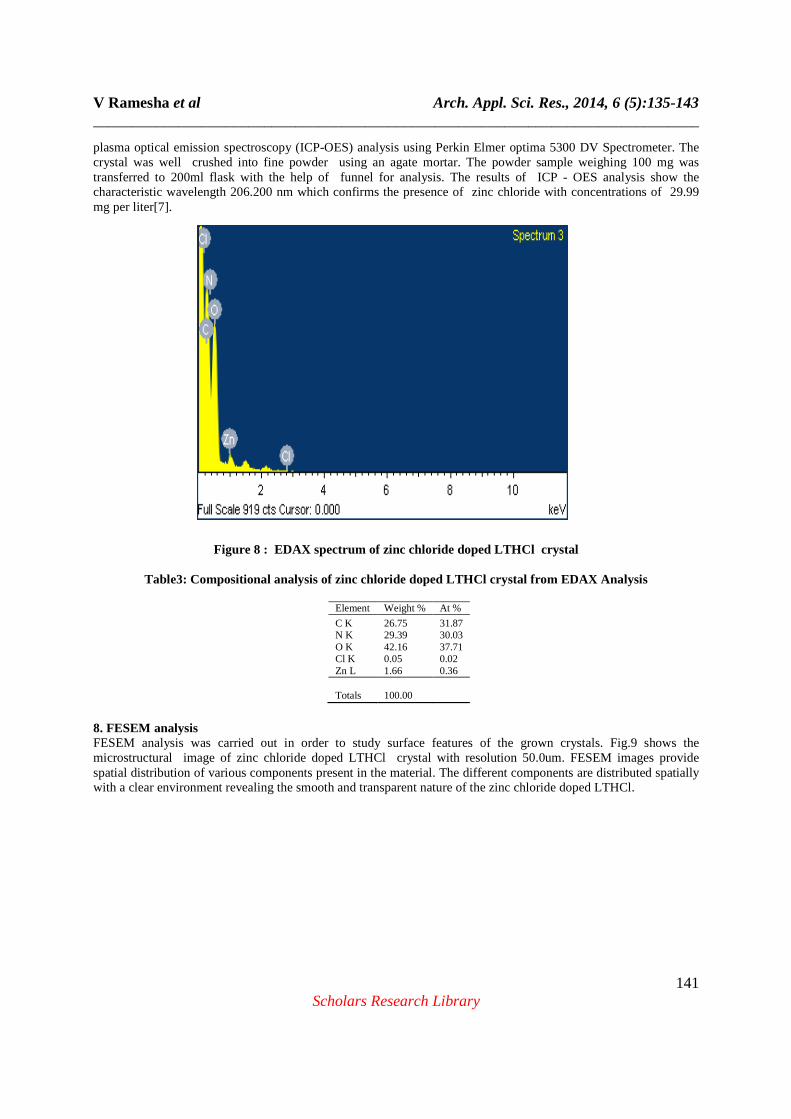
plasma optical emission spectroscopy (ICP-OES) analysis using Perkin Elmer optima 5300 DV Spectrometer. The crystal was well crushed into fine powder using an agate mortar. The powder sample weighing 100 mg was transferred to 200ml flask with the help of funnel for analysis. The results of ICP - OES analysis show the characteristic wavelength 206.200 nm which confirms the presence of zinc chloride with concentrations of 29.99 mg per liter[7].
Figure 8 : EDAX spectrum of zinc chloride doped LTHCl crystal
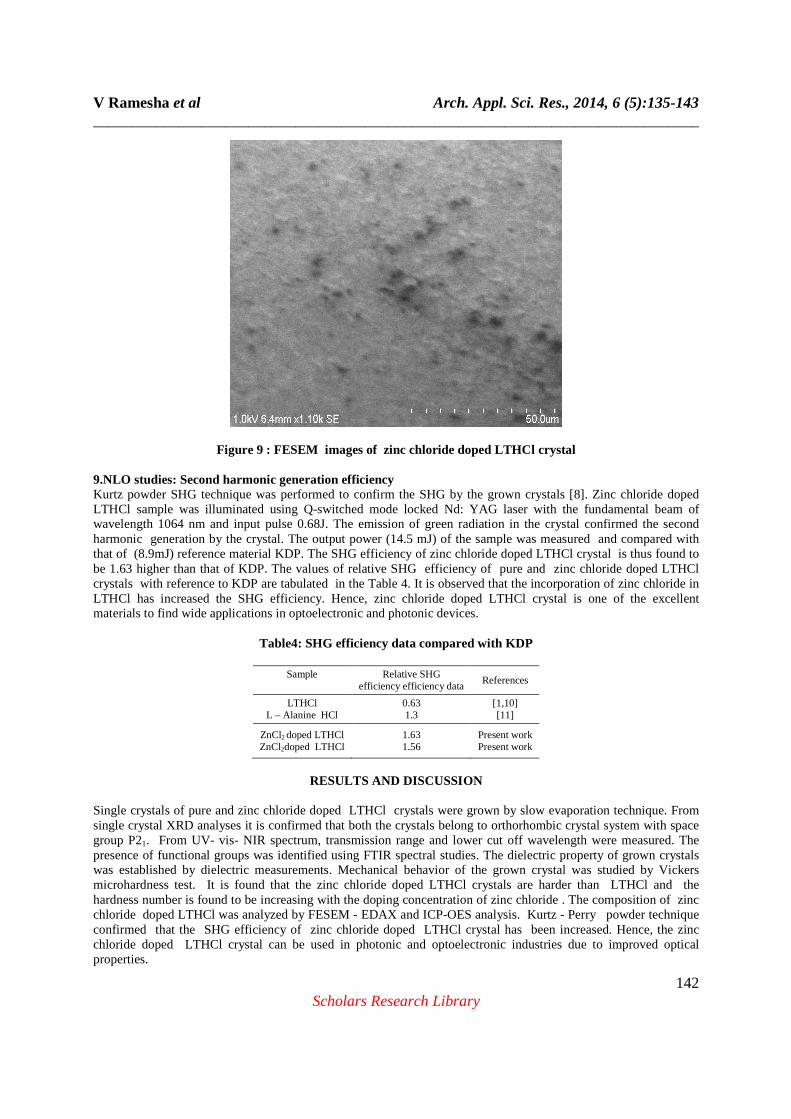
Table3: Compositional analysis of zinc chloride doped LTHCl crystal from EDAX Analysis 8. FESEM analysis FESEM analysis was carried out in order to study surface features of the grown crystals. Fig.9 shows the microstructural image of zinc chloride doped LTHCl crystal with resolution 50.0um. FESEM images provide spatial distribution of various components present in the material. The different components are distributed spatially with a clear environment revealing the smooth and transparent nature of the zinc chloride doped LTHCl.
Element Weight % At % C K 26.75 31.87
N K 29.39 30.03 O K 42.16 37.71 Cl K 0.05 0.02 Zn L 1.66 0.36 Totals 100.00
V Ramesha et al Arch. Appl. Sci. Res., 2014, 6 (5):135-143 ______________________________________________________________________________
142 Scholars Research Library
Figure 9 : FESEM images of zinc chloride doped LTHCl crystal 9.NLO studies: Second harmonic generation efficiency Kurtz powder SHG technique was performed to confirm the SHG by the grown crystals [8]. Zinc chloride doped LTHCl sample was illuminated using Q-switched mode locked Nd: YAG laser with the fundamental beam of wavelength 1064 nm and input pulse 0.68J. The emission of green radiation in the crystal confirmed the second harmonic generation by the crystal. The output power (14.5 mJ) of the sample was measured and compared with that of (8.9mJ) reference material KDP. The SHG efficiency of zinc chloride doped LTHCl crystal is thus found to be 1.63 higher than that of KDP. The values of relative SHG efficiency of pure and zinc chloride doped LTHCl crystals with reference to KDP are tabulated in the Table 4. It is observed that the incorporation of zinc chloride in LTHCl has increased the SHG efficiency. Hence, zinc chloride doped LTHCl crystal is one of the excellent materials to find wide applications in optoelectronic and photonic devices.
Table4: SHG efficiency data compared with KDP
Sample
Relative SHG efficiency efficiency data
References
LTHCl L – Alanine HCl
0.63 1.3
[1,10] [11]
ZnCl2 doped LTHCl ZnCl2doped LTHCl
1.63 1.56
Present work Present work
RESULTS AND DISCUSSION
Single crystals of pure and zinc chloride doped LTHCl crystals were grown by slow evaporation technique. From single crystal XRD analyses it is confirmed that both the crystals belong to orthorhombic crystal system with space group P21. From UV- vis- NIR spectrum, transmission range and lower cut off wavelength were measured. The presence of functional groups was identified using FTIR spectral studies. The dielectric property of grown crystals was established by dielectric measurements. Mechanical behavior of the grown crystal was studied by Vickers microhardness test. It is found that the zinc chloride doped LTHCl crystals are harder than LTHCl and the hardness number is found to be increasing with the doping concentration of zinc chloride . The composition of zinc chloride doped LTHCl was analyzed by FESEM - EDAX and ICP-OES analysis. Kurtz - Perry powder technique confirmed that the SHG efficiency of zinc chloride doped LTHCl crystal has been increased. Hence, the zinc chloride doped LTHCl crystal can be used in photonic and optoelectronic industries due to improved optical properties.
V Ramesha et al Arch. Appl. Sci. Res., 2014, 6 (5):135-143 ______________________________________________________________________________
143 Scholars Research Library
Acknowledgements The author wishes to thank SAIF IIT Madras, M.K.University Madurai, Loyola College, Crescent Engg College , NCNSNT (University of Madras) and St. Joseph’s college Trichy for their kind support and help to complete this work.
REFERENCES
[1] V.V.Ghazaryan, International conference on laser physics 2010,SPIE 79980G March 04, 2011. [2] D.S. Chemla, J.Zyss (Eds.), Nonlinear Optical Properties of Organic Molecules and Crystals, Academic Press, New York, (1987). [3] Zyss, J.Molecular Nonlinear Optics : Materials, Physics and Devices. Academic Press, Boston, 1994. [4] Le Fur Y., Masse R., Cherkaovi M.Z., Nicoud J.F., Z. Kristallogr. 2010(1955)856. [5] E.M.Onitch, mikroskopie 1950,95,12. [6] Hanneman, Metallurgia Manchu 23(1941) 135. [7] V.Ramesh, P.R.Umarani,Jayaraman,Manivannan International journal of ChemTech Research Aug-sep 2014,vol. 6 ,No 5 pp 2869-2874. [8] S. K. Kurtz, T. T. Perry, J .Apply. phy. 39, 3798 , (1968). [9] Tautz,W.Teitel J.med.chem. 1973,vol.16,p.705. [10] V.V.Ghazaryan, M.Fleck,A.M.petrosyan,New salt of amino acids with dimeric cations proc.of spie vol.7998.