avanced image classification
TRANSCRIPT
Welcometo the Workshop Presentation on
Advanced Image Classification
BAYES AHMEDPhD Student
University College London (UCL), UK
Workshop at BIP, Bangladesh
13 September 2014
Image ClassificationImage Classification
Image classification refers to the task of extracting information classes from a multiband raster image.
The resulting raster from image classification can be used to create thematic maps.
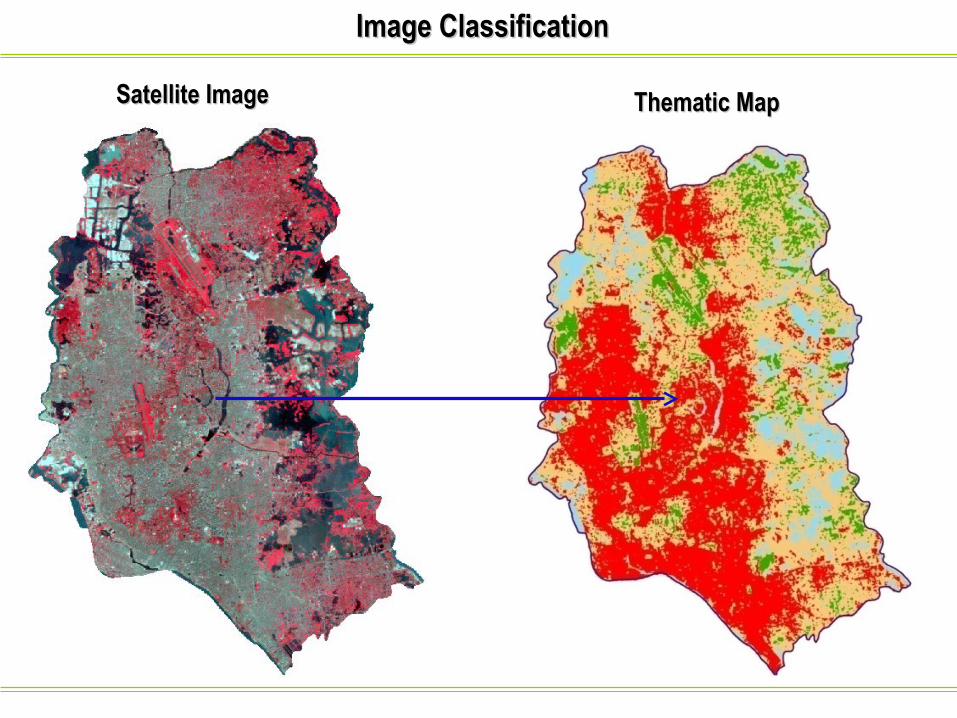
Image ClassificationImage Classification
Satellite ImageSatellite Image Thematic MapThematic Map
Image ClassificationImage Classification
Here IMAGE stands for Raster Image (e.g. Satellite Image)
In general in GIS, we use two types of Image Classification:
1.Pixel Based
2.Object Based
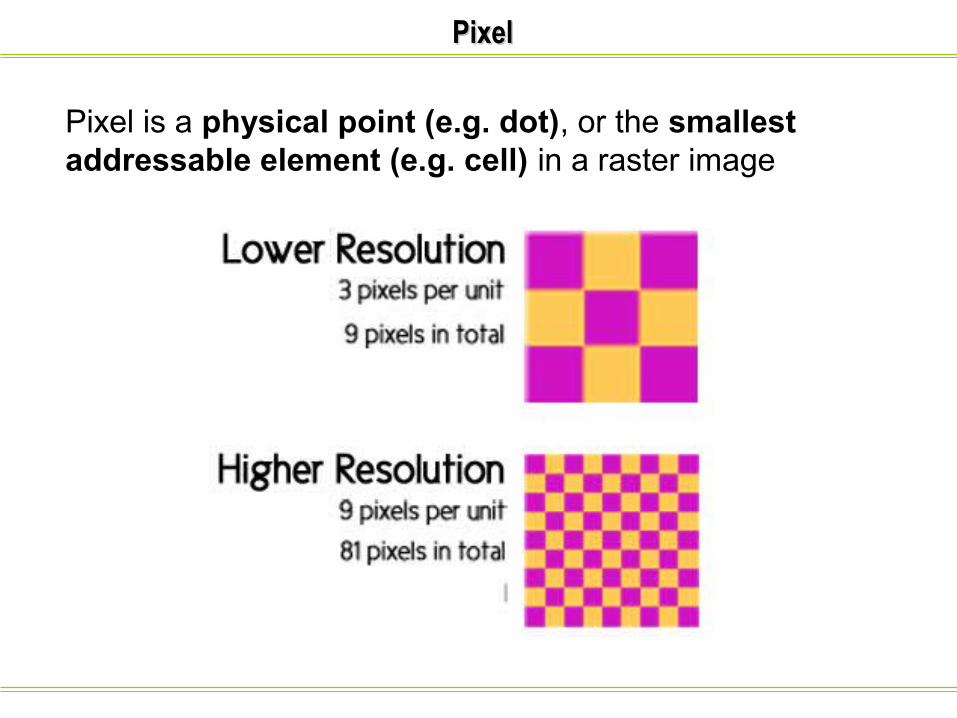
PixelPixel
Pixel is a physical point (e.g. dot), or the smallest addressable element (e.g. cell) in a raster image
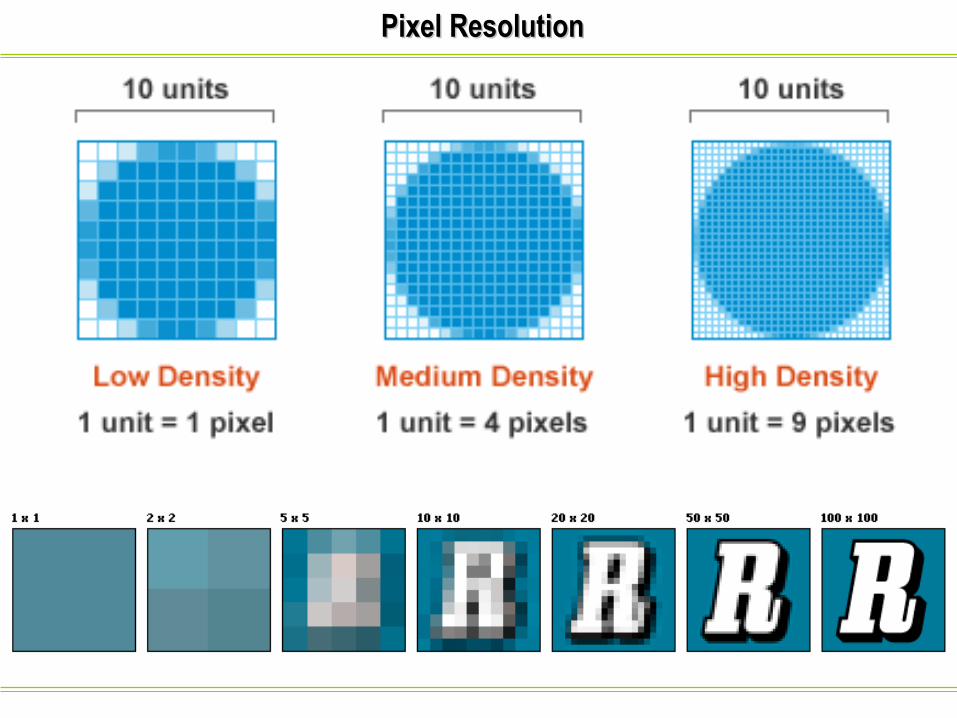
Pixel ResolutionPixel Resolution
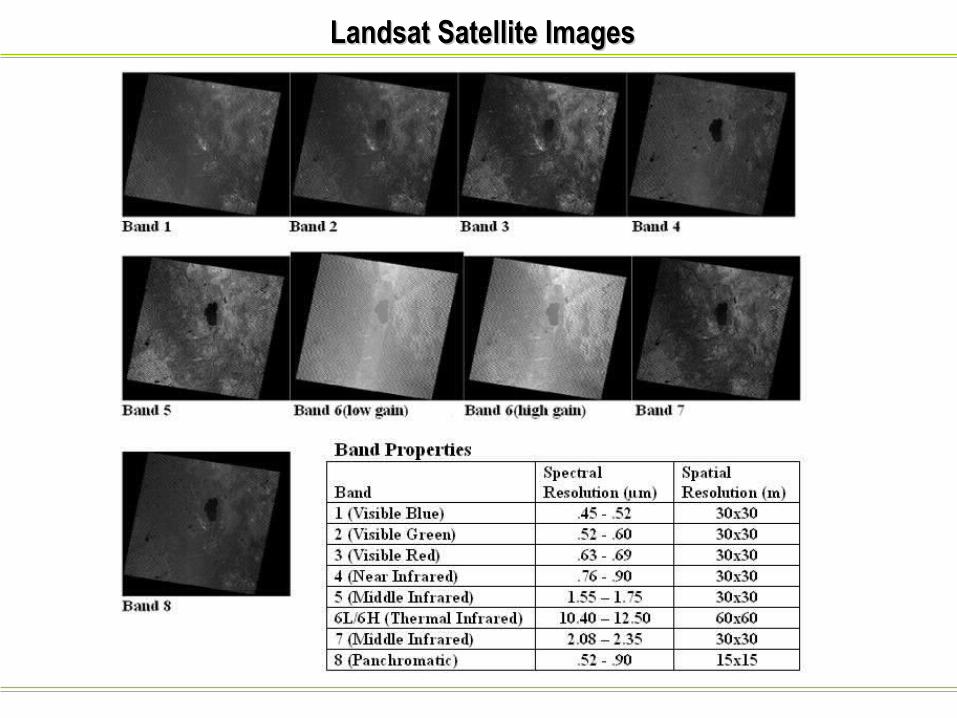
Landsat Satellite ImagesLandsat Satellite Images
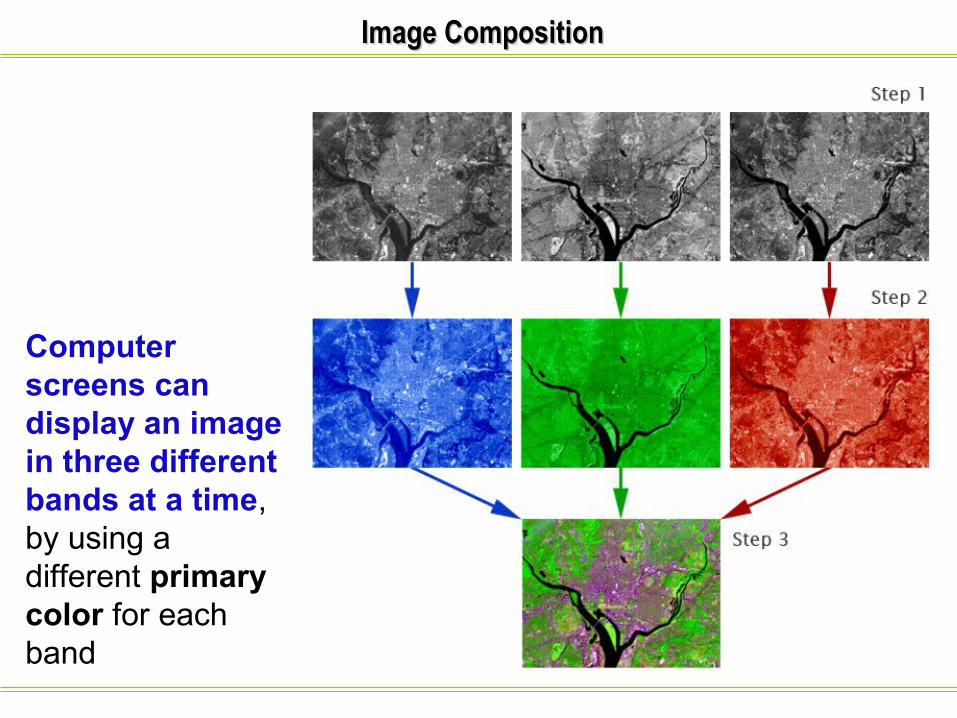
Image CompositionImage Composition
Computer screens can display an image in three different bands at a time, by using a different primary color for each band
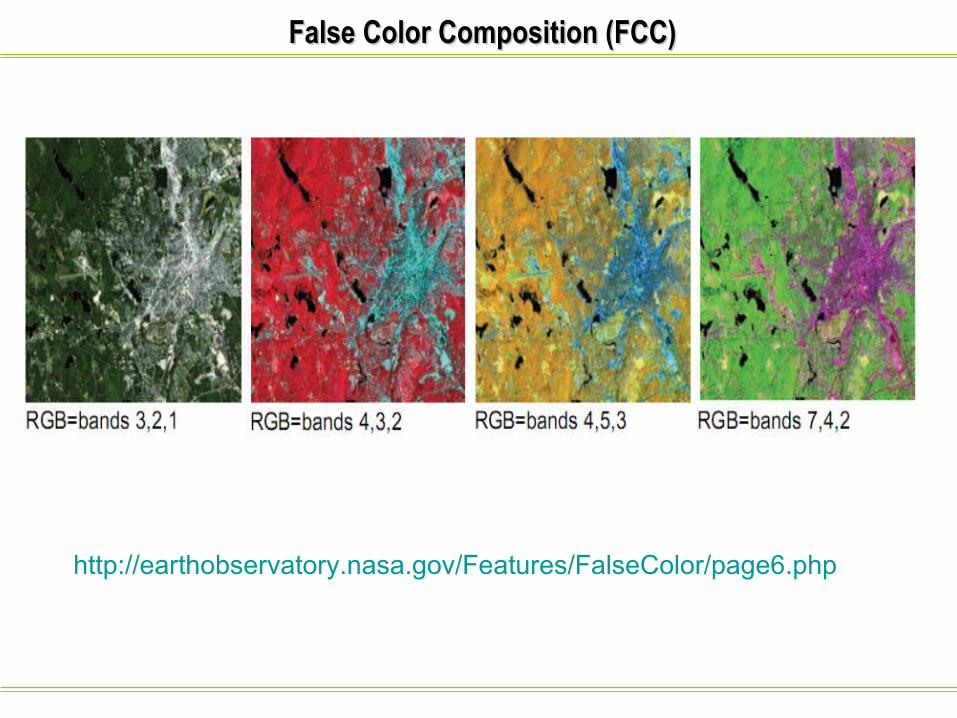
False Color Composition (FCC)False Color Composition (FCC)
http://earthobservatory.nasa.gov/Features/FalseColor/page6.php
Digital Image ClassificationDigital Image Classification
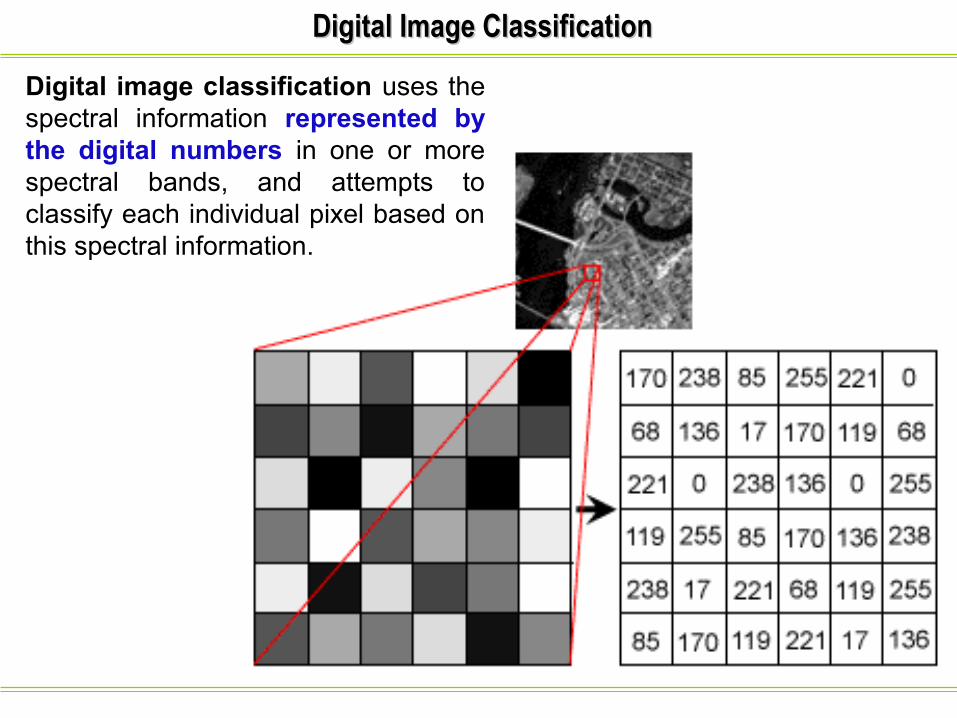
Digital image classification uses the spectral information represented by the digital numbers in one or more spectral bands, and attempts to classify each individual pixel based on this spectral information.
Spectral Classes are groups of pixels that are uniform (or near-similar) with respect to their brightness values in the different spectral channels of the data.
Information Classes are those categories of interest that the analyst is actually trying to identify in the imagery.
A broad information class may contain a number of spectral sub-classes with unique spectral variations. It is the analyst's job to decide on the utility of the different spectral classes and their correspondence to useful information classes.
Spectral and Information Classes
Supervised ClassificationSupervised Classification
There are two general approaches to pixel-based image classification: supervised and unsupervised.
Supervised Classification: the analyst identifies in the imagery homogeneous representative samples (information classes) of interest. These samples are referred to as training areas.
The selection of appropriate training areas is based on the analyst's familiarity with the geographical area and their knowledge of the actual surface cover types present in the image. Thus, the analyst is "supervising" the categorization of a set of specific classes.
Supervised ClassificationSupervised Classification
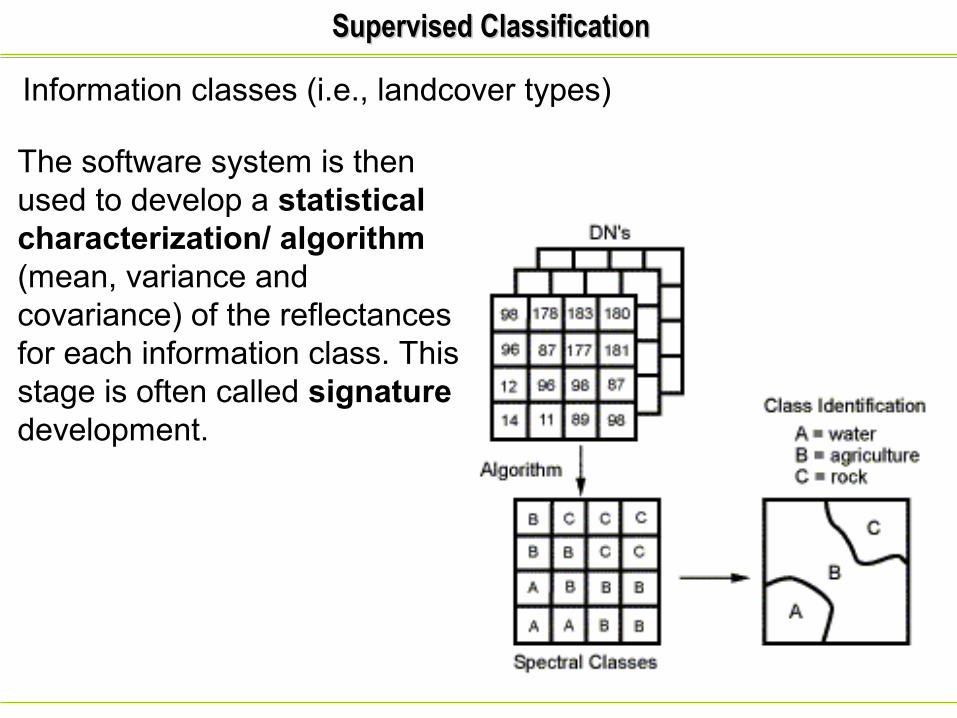
Information classes (i.e., landcover types)
The software system is then used to develop a statistical characterization/ algorithm (mean, variance and covariance) of the reflectances for each information class. This stage is often called signature development.
Supervised ClassificationSupervised Classification
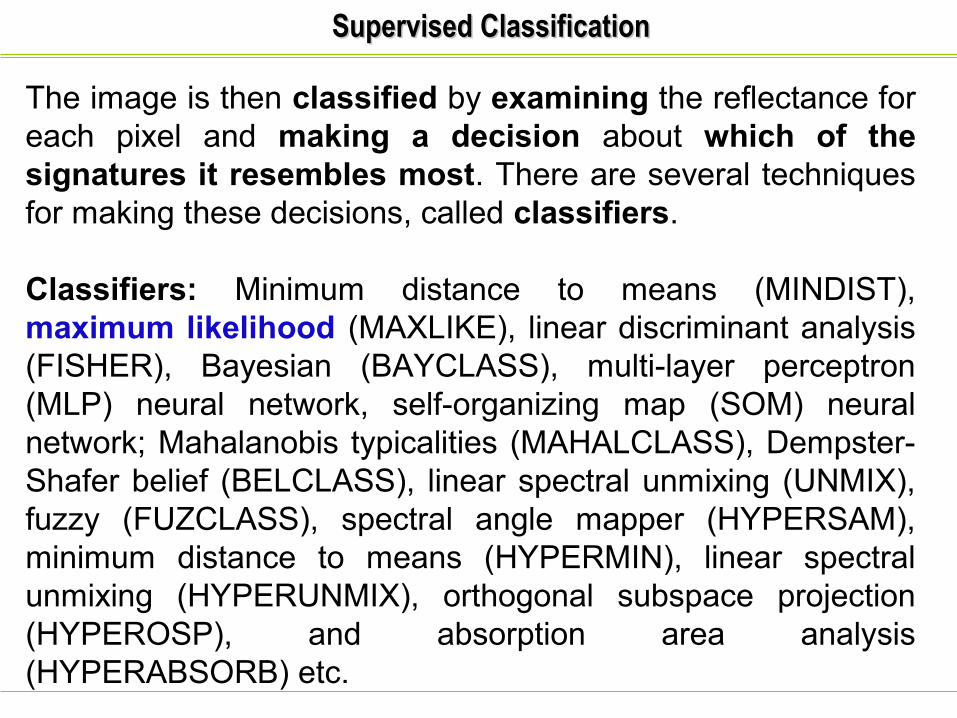
The image is then classified by examining the reflectance for each pixel and making a decision about which of the signatures it resembles most. There are several techniques for making these decisions, called classifiers.
Classifiers: Minimum distance to means (MINDIST), maximum likelihood (MAXLIKE), linear discriminant analysis (FISHER), Bayesian (BAYCLASS), multi-layer perceptron (MLP) neural network, self-organizing map (SOM) neural network; Mahalanobis typicalities (MAHALCLASS), Dempster- Shafer belief (BELCLASS), linear spectral unmixing (UNMIX), fuzzy (FUZCLASS), spectral angle mapper (HYPERSAM), minimum distance to means (HYPERMIN), linear spectral unmixing (HYPERUNMIX), orthogonal subspace projection (HYPEROSP), and absorption area analysis (HYPERABSORB) etc.
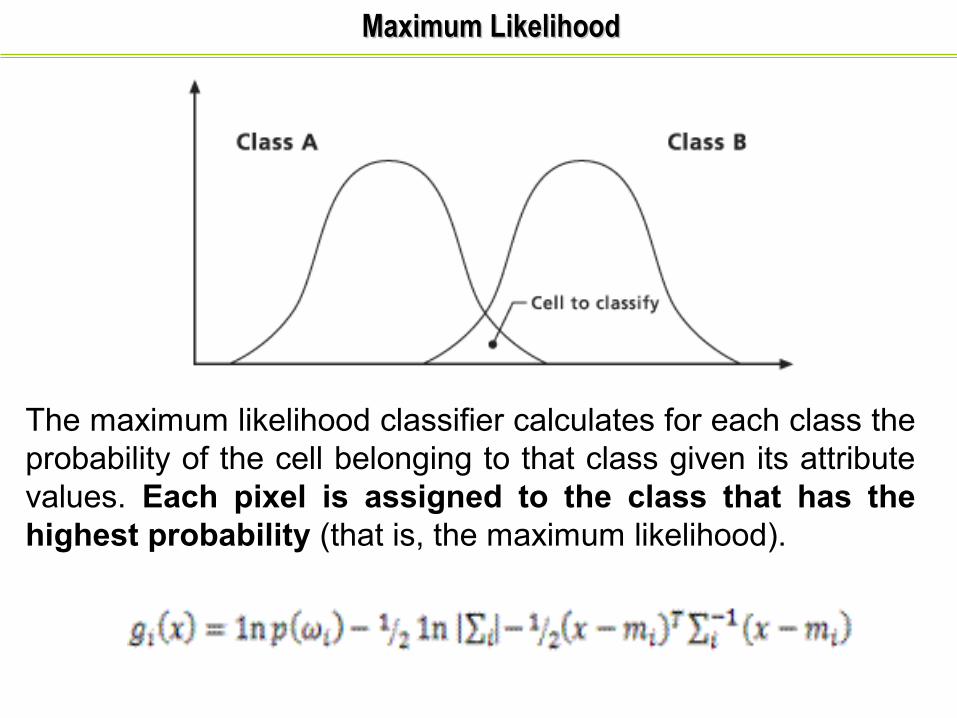
Maximum LikelihoodMaximum Likelihood
The maximum likelihood classifier calculates for each class the probability of the cell belonging to that class given its attribute values. Each pixel is assigned to the class that has the highest probability (that is, the maximum likelihood).
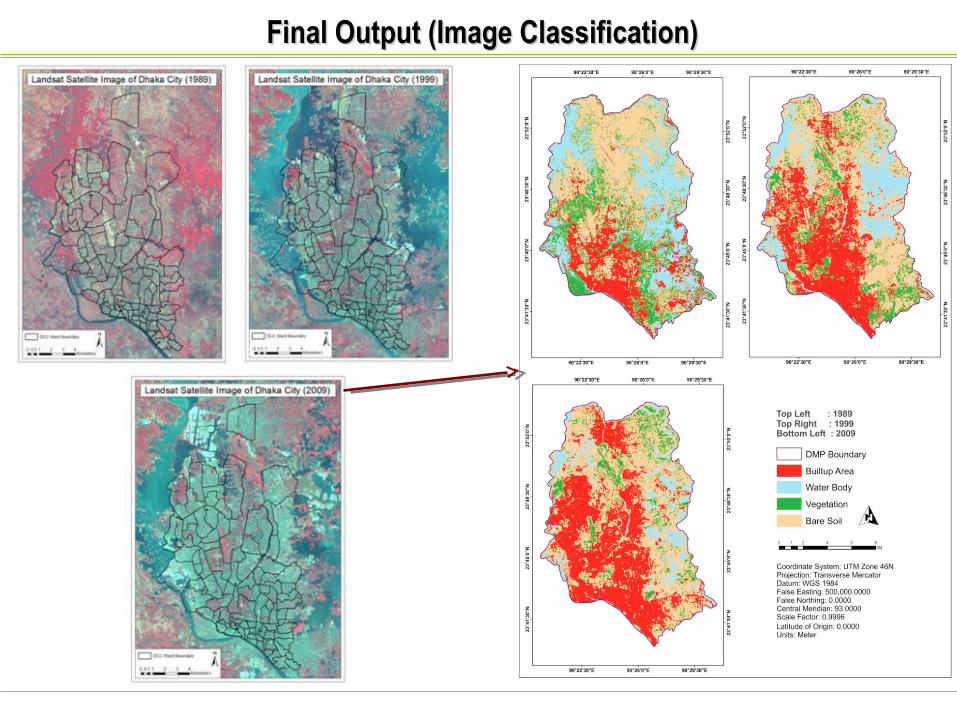
Final Output (Image Classification)Final Output (Image Classification)
Unsupervised ClassificationUnsupervised Classification
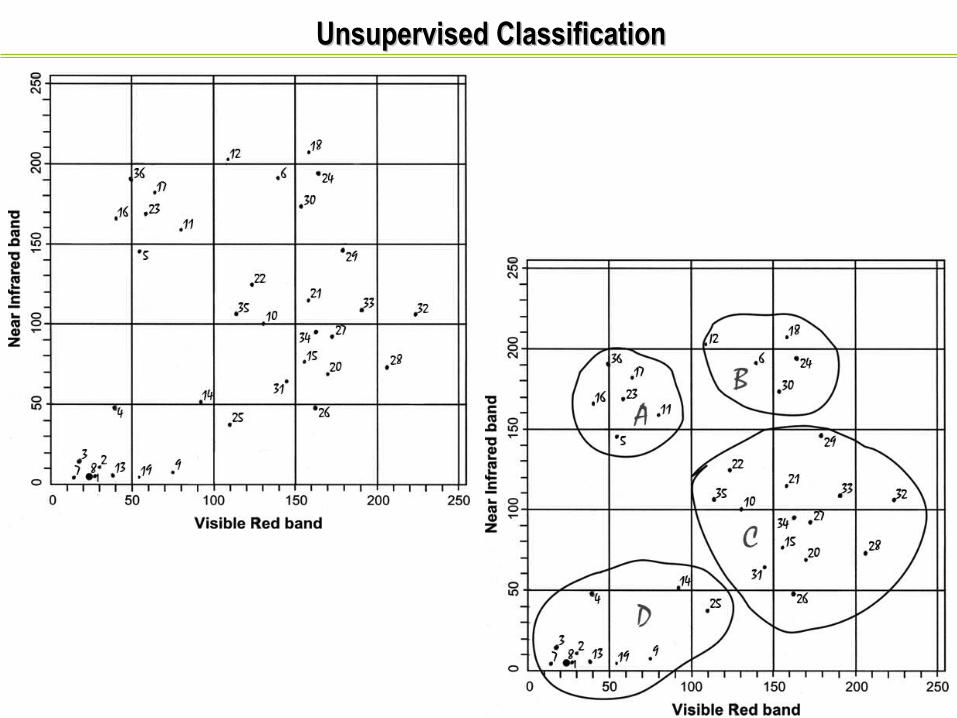
Unsupervised classification reverses the supervised classification process.
Spectral classes (or clusters) are grouped first, based solely on the numerical information in the data, and are then matched by the analyst to information classes (if possible).
Programs, called clustering algorithms, are used to determine the natural (statistical) groupings or structures in the data.
Unsupervised ClassificationUnsupervised Classification
Iso Cluster Unsupervised ClassificationIso Cluster Unsupervised Classification
Statistically, clusters are naturally occurring groupings in the data.
The Iso prefix of the isodata clustering algorithm stands for Iterative Self Organizing (ISO), a method of performing clustering.
The iso cluster algorithm is an iterative process for computing the minimum Euclidean distance when assigning each candidate cell to a cluster.
The specified Number of classes value is the maximum number of clusters that can result from the clustering process.
Iso Cluster Unsupervised ClassificationIso Cluster Unsupervised Classification
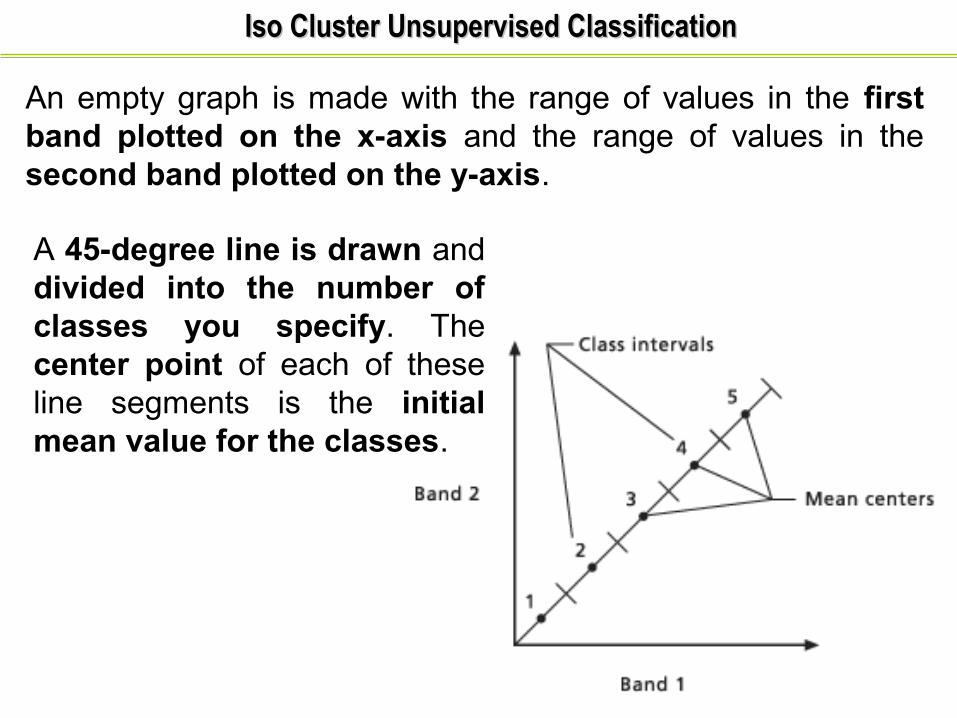
An empty graph is made with the range of values in the first band plotted on the x-axis and the range of values in the second band plotted on the y-axis.
A 45-degree line is drawn and divided into the number of classes you specify. The center point of each of these line segments is the initial mean value for the classes.
Iso Cluster Unsupervised ClassificationIso Cluster Unsupervised Classification
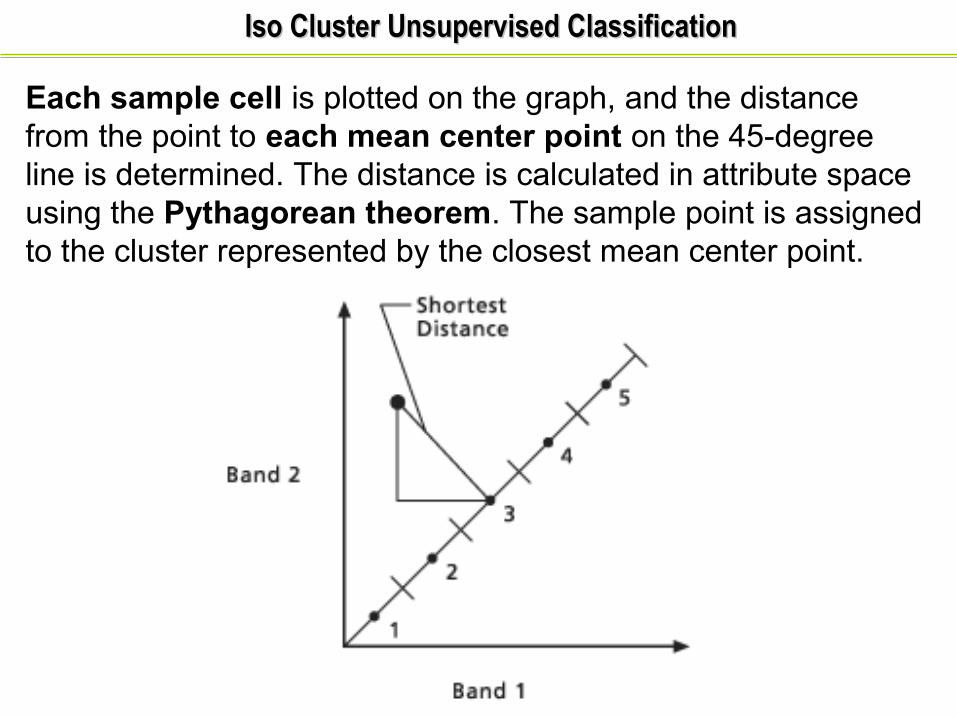
Each sample cell is plotted on the graph, and the distance from the point to each mean center point on the 45-degree line is determined. The distance is calculated in attribute space using the Pythagorean theorem. The sample point is assigned to the cluster represented by the closest mean center point.
Iso Cluster Unsupervised ClassificationIso Cluster Unsupervised Classification
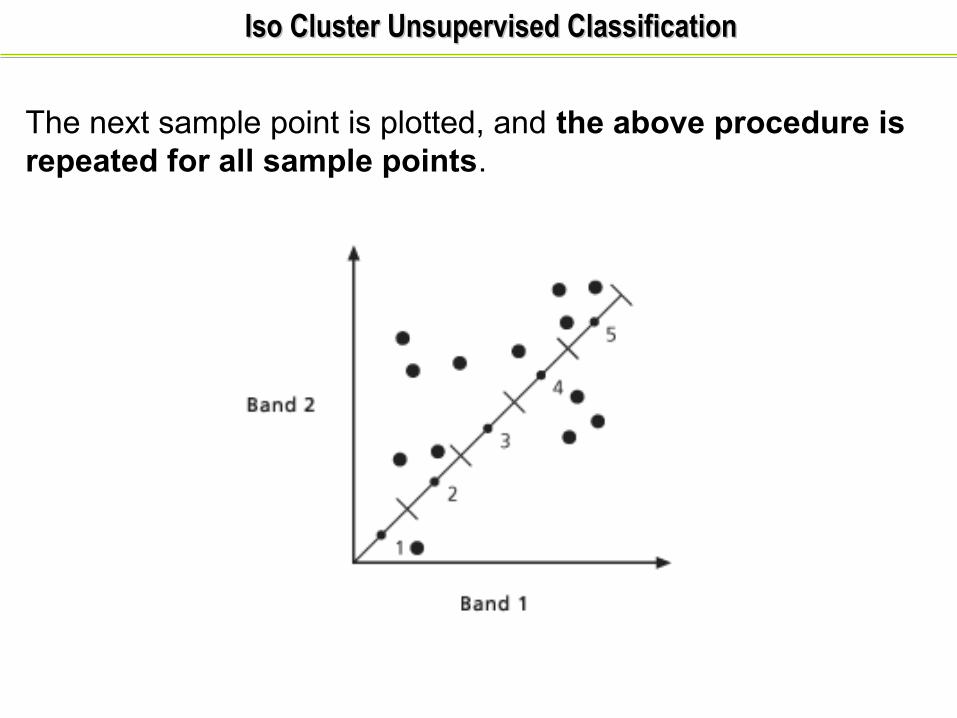
The next sample point is plotted, and the above procedure is repeated for all sample points.
Iso Cluster Unsupervised ClassificationIso Cluster Unsupervised Classification
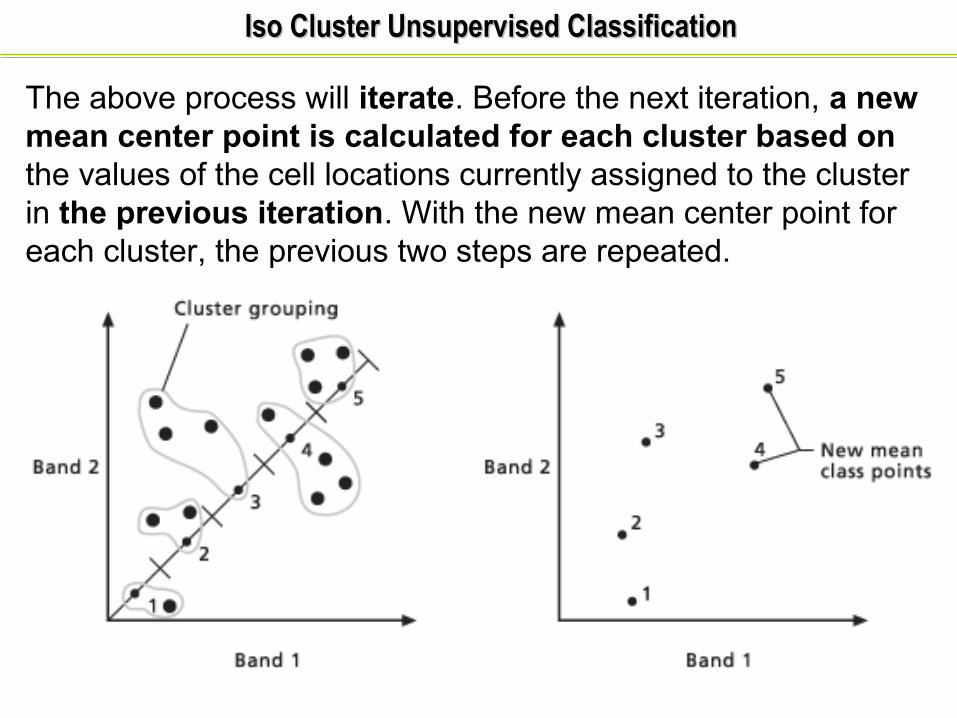
The above process will iterate. Before the next iteration, a new mean center point is calculated for each cluster based on the values of the cell locations currently assigned to the cluster in the previous iteration. With the new mean center point for each cluster, the previous two steps are repeated.
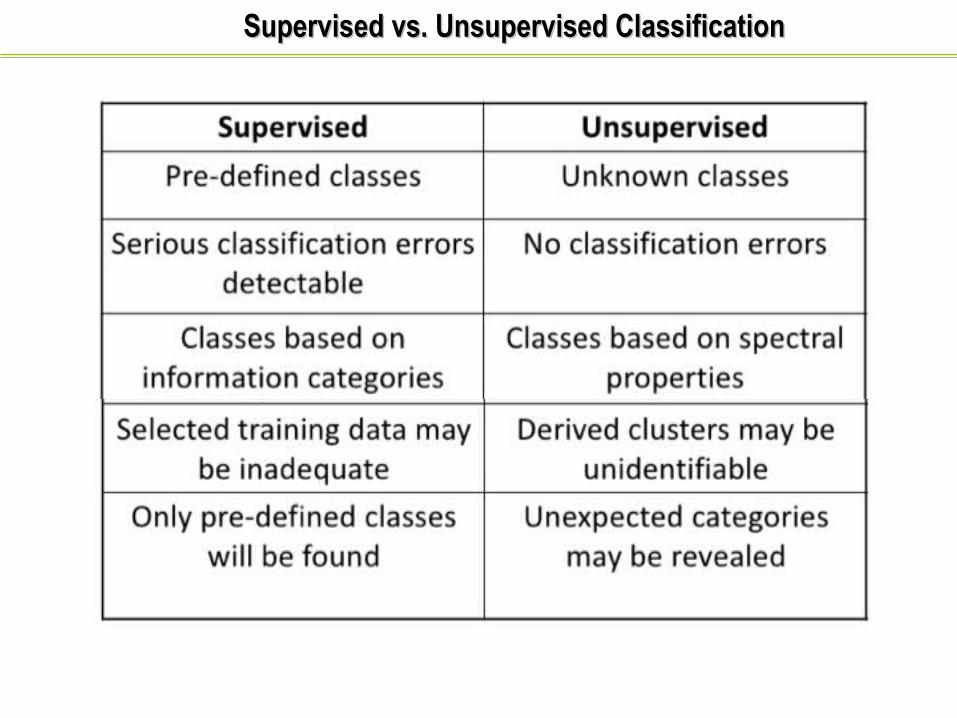
Supervised vs. Unsupervised ClassificationSupervised vs. Unsupervised Classification
Object-based Image Analysis (OBIA) Object-based Image Analysis (OBIA)
The pixel-based procedures analyze the spectral properties of every pixel within the area of interest, without taking into account the spatial or contextual information related to the pixel of interest.
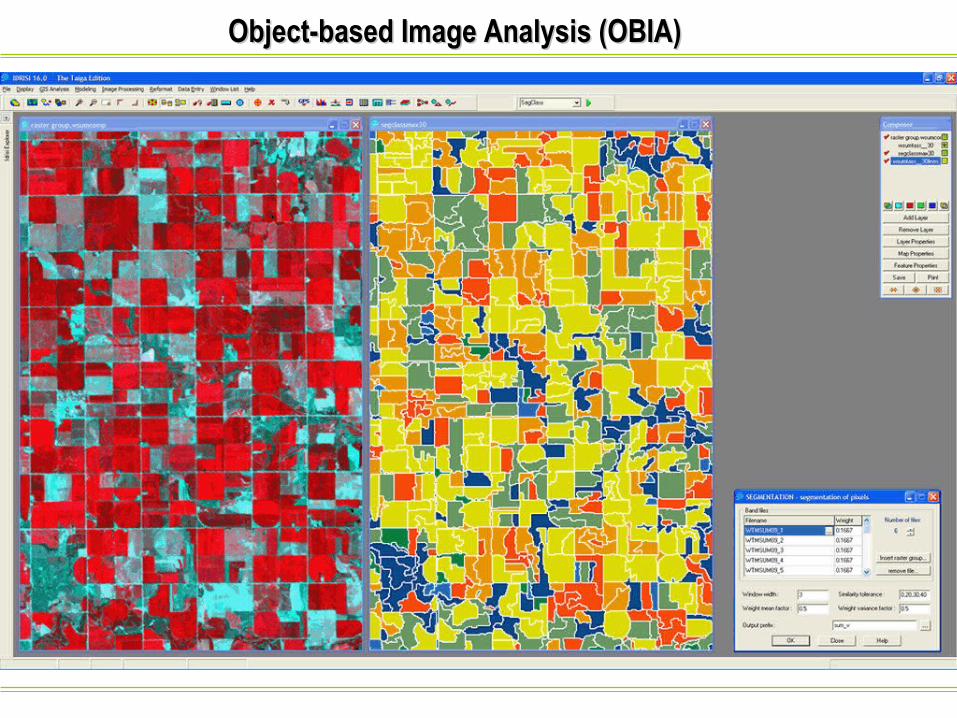
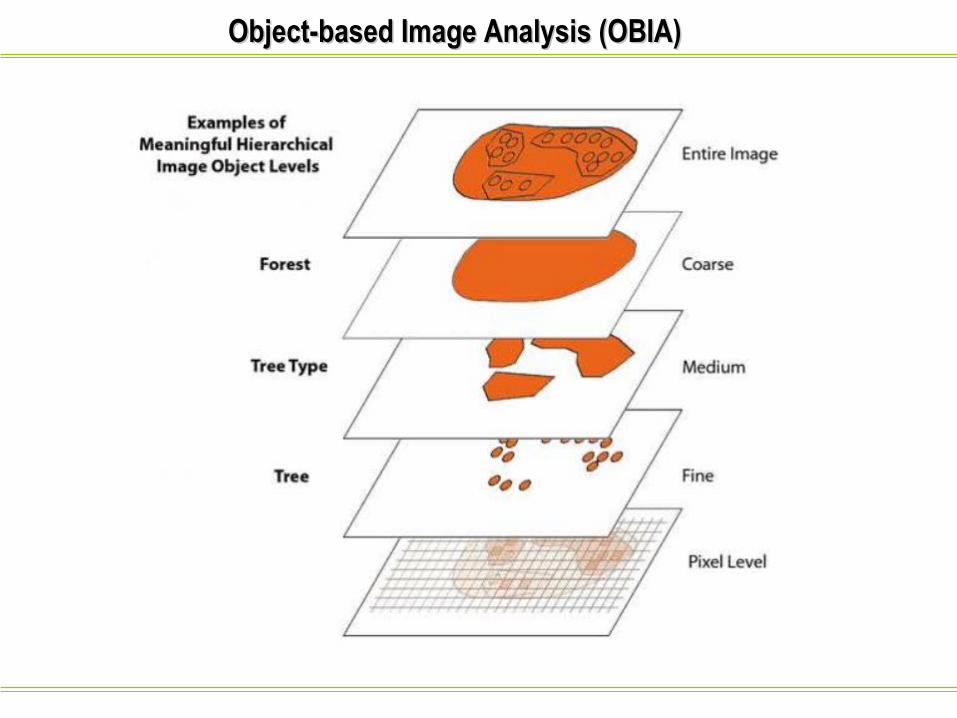
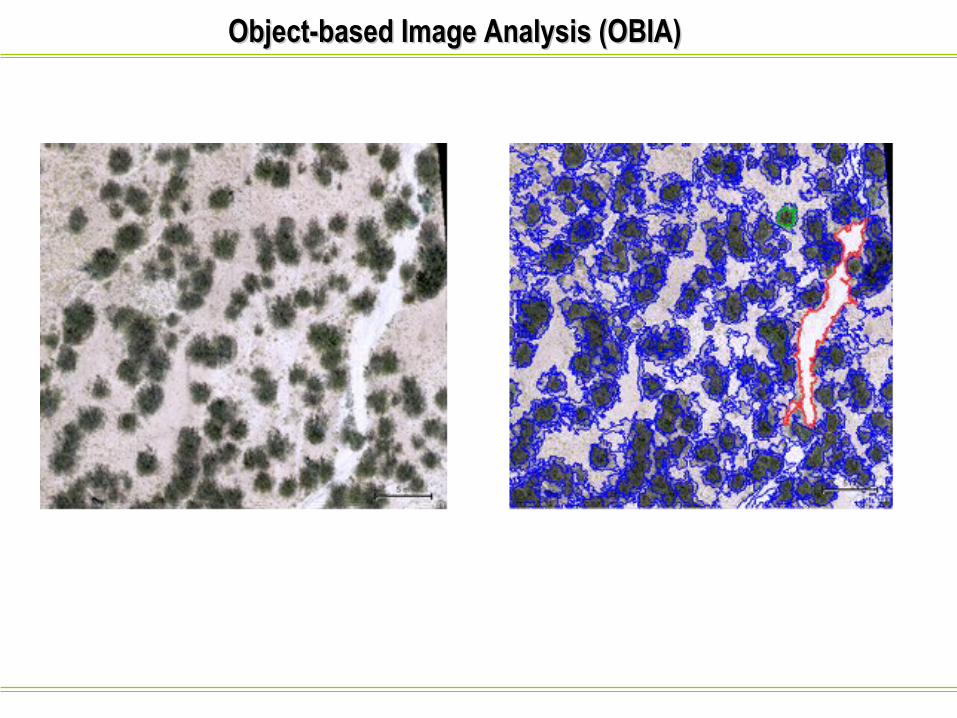
OBIA analyzes both the spectral and spatial/contextual properties of pixels and use a segmentation process and iterative learning algorithm to achieve a semi-automatic classification.
It considers – spectral properties (i.e., color), size, shape, and texture, as well as context from a neighborhood surrounding the pixels.
Object-based Image Analysis (OBIA) Object-based Image Analysis (OBIA)
Object-based Image Analysis (OBIA) Object-based Image Analysis (OBIA)
Object-based Image Analysis (OBIA) Object-based Image Analysis (OBIA)