aviation safety culture measurement …granthaalayah.com/articles/vol4iss3/07_ijrg16_b03_08.pdf ·...
TRANSCRIPT

[Onen *, Vol.4 (Iss.3): March, 2016] ISSN- 2350-0530(O) ISSN- 2394-3629(P)
Impact Factor: 2.035 (I2OR)
Http://www.granthaalayah.com ©International Journal of Research - GRANTHAALAYAH [59-79]
Management
AVIATION SAFETY CULTURE MEASUREMENT MODEL FIT
VALIDATION OF A SURVEY FOR THE AVIATION MAINTENANCE
REPAIR ORGANIZATIONS
Vahap ÖNEN *1
*1
Associate Professor, OKAN University Civil Aviaition Transportation Management,
TURKEY
ABSTRACT
It is believed that safety is the major issue for the aviation industry. According to Boeing Study
%15 of the fatal accidents are incurred by maintenance sources related. On the other hand,
from the last ten years safety management system which firstly introduced by ICAO became
popular in the aviation industry. In the beginning, enforcement by ICAO Annex 19 then
following it consequtively by EASA’s regulation, at the same time issued many advisory
circulars by FAA that SMS entried in force and still other authorities are acting by similar
way. However, the most important element of the SMS is based on properly establishment of
safety culture in organization. Up to now there are many methods introduced in the literature
for measuring safety culture of aviation organizations. Even though an aviation company may
select one model as to another one for measuring own safety culture, but they are not sure
whether this model run perfectly and reflect true results or not. In this study it is aimed to
bring out how the proposed ECAST’s safety culture model which is compliance for the
aviation maintenance organizations by validating Structural Equation Modelling.
Keywords:
Structural Equation Model, Safety Culture, Aviation, Maintenance, Certifying Staff.
Cite This Article: Vahap ÖNEN, “AVIATION SAFETY CULTURE MEASUREMENT
MODEL FIT VALIDATION OF A SURVEY FOR THE AVIATION MAINTENANCE
REPAIR ORGANIZATIONS” International Journal of Research – Granthaalayah, Vol. 4, No. 3
(2016): 59-79.
1. INTRODUCTION
1.1.SAFETY CULTURE DEFINITION IN AVIATION
Safety culture is a term that nearly everyone uses but few can agree upon its precise meaning or
how it can be measured. The social as a first it comprises the beliefs, attitudes and values often
unspoken of an organization’s membership regarding the pursuit of safety and the second is
more concrete and embraces the structures, practices, controls and policies that organizations

[Onen *, Vol.4 (Iss.3): March, 2016] ISSN- 2350-0530(O) ISSN- 2394-3629(P)
Impact Factor: 2.035 (I2OR)
Http://www.granthaalayah.com ©International Journal of Research - GRANTHAALAYAH [59-79]
possesses and employs to achieve greater safety (J.Reason, A.Hobbs 2003). A Safety Culture
refers to the extent to which every individual and every group of the organization is aware of the
risks and unknown hazards induced by its activities; is continuously behaving so as to preserve
and enhance safety; is willing and able to adapt itself when facing safety issues; is willing to
communicate safety issues; and consistently evaluates safety related behaviour (P. Montijn,
B.NLR, 2009)
1.1.1. SAFETY CULTURE REQUIREMENTS FOR AVIATION
When it comes to review the Space Shuttle accident’s executive report in 2003, it will be seen
that the organizational causes of this accident are rooted in the Space Shuttle Program’s history
and culture. Additionally, cultural traits and organizational practices detrimental to safety were
allowed to develop (Patrick Hudson, 2007). it may be cited as an examples (IAEA, 2014)
because of national culture which is sub-components of the safety culture caused five serious
aviation accidents that are Tenerif - Runway Incursion – Canary Island, Sprain - 1977 (583
dead), Avianca 052 – Crash - New York – 1990 (73 dead), Korean Air 801 – Crash - Guam –
1997 (228 dead), The Überlingen mid-air collision – Switzerland – 2002 (71 dead), Asiana 214 –
Crash - San Francisco -2013 (3 dead). These samples can be risen however, nowadays it is
considered that safety culture still is the most important problem in order to set up safety
management system (Ender Gerede, 2012). Since safety culture is almost the root cause of the
errors which are occurred by based on general system (James Reason, 2013, 81).
1.2.AVIATION SAFETY CULTURE MODELS
There are many kind of model for measurement and assessment of the Aviation Safety Culture in
the literature. Reason Model, Hudson Model, ICAO’s proposition, Cooper ve Zohar Models,
Weigman & Gibbons’s SCIMS Model, Schein Model, 4P-4C Model, Cooper’s interactive safety
culture model may be some examples of them. One of the well-known European Aviation
Safety Agency’s (EASA) proposed safety culture model which is introduced by ECAST
(European Commercial Aviation Safety Team) that the scope of work in this study.
1.2.1. ECAST (EUROPEAN COMMERCIAL AVIATION SAFETY TEAM) SAFETY
CULTURE MODEL
As Safety Culture is still an emerging issue and since the introduction of the ICAO and EASA
Safety Management requirements will expedite Safety Culture activity across Europe. (Piers,
Montijn & Balk, NLR 2009, Safety Culture Frame Work for the ECAST-Working Group).
Nevertheless, a strong Safety Culture is generally considered as a vital condition to a well-
functioning of SMS. For this reason, the SMS Working Group of ECAST has been tasked to
propose Safety Culture reference material.
1.2.2. ECAST’S PROPOSED SAFETY CULTURE FRAMEWORK
From the review of the main existing and emerging Safety Culture frameworks in aviation and
beyond, we know that Safety Culture is a multi-dimensional construct. To capture the common

[Onen *, Vol.4 (Iss.3): March, 2016] ISSN- 2350-0530(O) ISSN- 2394-3629(P)
Impact Factor: 2.035 (I2OR)
Http://www.granthaalayah.com ©International Journal of Research - GRANTHAALAYAH [59-79]
and key-elements of the various leading framework, six dimensions are needed. The six
Characteristics are commitment, behaviour, awareness, adaptability, information and justness.
ECAST selected this model as based on Westrum’s studies. Besides, there are also many others
studies which indicate different characteristics for measuring safety culture. For example;
Thaden, Sharma, & Mitchell (2002) and Wiegmann et al. (2002) reviewed the safety culture
literature across a number of industries and identified five critical indicators of an organization’s
safety culture organizational, managerial involvement, employee empowerment, accountability
system, reporting system. This model had been supported by FAA (Wiegmann, D.A., von
Thaden, T. L., Mitchell, A.A., Sharma, G., & Zhang, H., 2003). When we closely looked in these
six characteristics they will be represented by some indicators which are shown below:
Table 1: Safety Culture Indicators Characteristic Indicators Commitment - Management concern
- Perception of importance of safety
- Prioritization of safety
- Safety procedures and requirements
- Personal involvement and responsibility for
safety
Behaviour - Employee behaviour with respect to safety
- Mutual expectations and encouragement
- Job satisfaction
- Adequate equipment
Awerness - Attitude towards unreported hazards
- Awareness of job induced risk
- Concern for safety
Aadaptability - Pro-activity to prevent negative happenings
- Actions with respect to negative happenings
- Employee input
Information - Availability of information
- Communication of work related information
- Training
- Safety issues reporting system
- Willingness to use the reporting system
- Consequences of safety reports
- Communication of safety related information
- Information exchange about safety issues
Justness - Evaluation of safety related behaviours
- Perception of evaluation
- Passing of responsibility
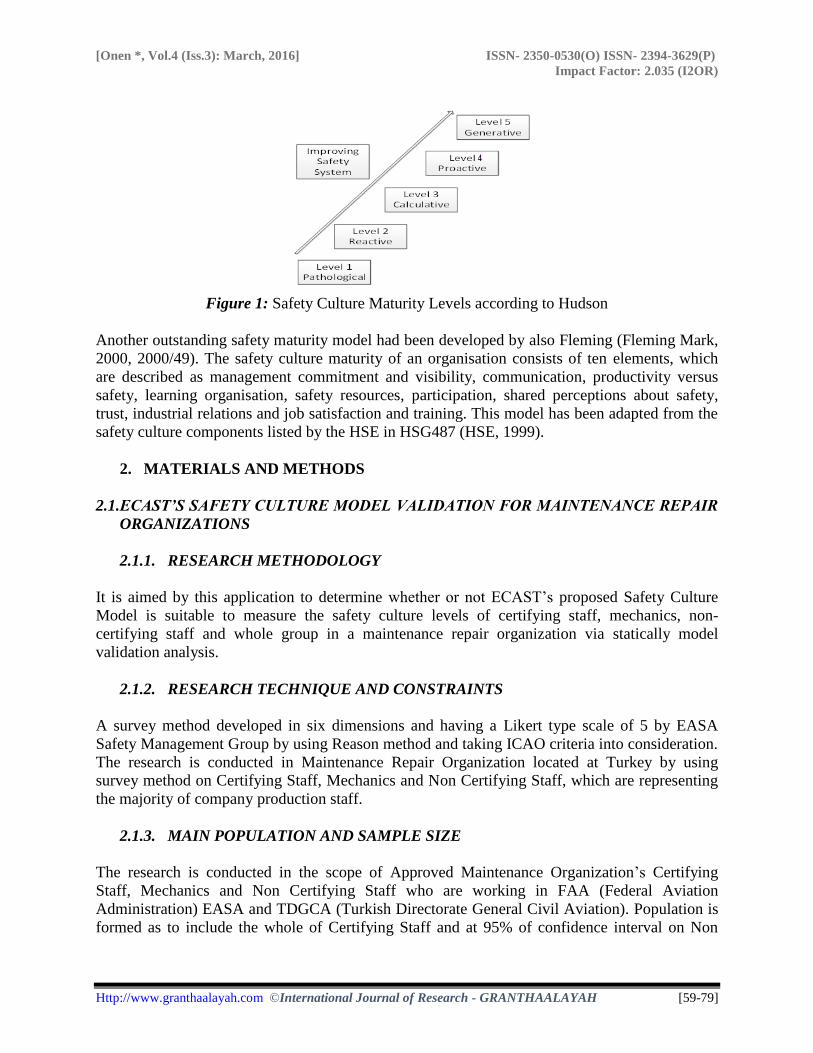
1.2.3. SAFETY CULTURE MATURITY LEVELS
Parcker, Lawrie & Hudson (2006) have developed a framework for development and maturation
of organization Safety Culture. The framework is based on Westrum’s classification of culture
based on how safety-related information is handled (Westrum, R., 1992, 288-99). Westrum
levels of culture are pathological, bureaucratic and generative each shortly described by Parker et
al. built on this (Parker D. Lawrie, M. & Hudson, 2006). But use five levels as Safety Culture
Maturity are cited by Patric Hudson and even though it was not particularly developed for
aviation industry, ECAST placed it in this framework that is indicated following figure 1.
[Onen *, Vol.4 (Iss.3): March, 2016] ISSN- 2350-0530(O) ISSN- 2394-3629(P)
Impact Factor: 2.035 (I2OR)
Http://www.granthaalayah.com ©International Journal of Research - GRANTHAALAYAH [59-79]
Figure 1: Safety Culture Maturity Levels according to Hudson
Another outstanding safety maturity model had been developed by also Fleming (Fleming Mark,
2000, 2000/49). The safety culture maturity of an organisation consists of ten elements, which
are described as management commitment and visibility, communication, productivity versus
safety, learning organisation, safety resources, participation, shared perceptions about safety,
trust, industrial relations and job satisfaction and training. This model has been adapted from the
safety culture components listed by the HSE in HSG487 (HSE, 1999).
2. MATERIALS AND METHODS
2.1.ECAST’S SAFETY CULTURE MODEL VALIDATION FOR MAINTENANCE REPAIR
ORGANIZATIONS
2.1.1. RESEARCH METHODOLOGY
It is aimed by this application to determine whether or not ECAST’s proposed Safety Culture
Model is suitable to measure the safety culture levels of certifying staff, mechanics, non-
certifying staff and whole group in a maintenance repair organization via statically model
validation analysis.
2.1.2. RESEARCH TECHNIQUE AND CONSTRAINTS
A survey method developed in six dimensions and having a Likert type scale of 5 by EASA
Safety Management Group by using Reason method and taking ICAO criteria into consideration.
The research is conducted in Maintenance Repair Organization located at Turkey by using
survey method on Certifying Staff, Mechanics and Non Certifying Staff, which are representing
the majority of company production staff.
2.1.3. MAIN POPULATION AND SAMPLE SIZE
The research is conducted in the scope of Approved Maintenance Organization’s Certifying
Staff, Mechanics and Non Certifying Staff who are working in FAA (Federal Aviation
Administration) EASA and TDGCA (Turkish Directorate General Civil Aviation). Population is
formed as to include the whole of Certifying Staff and at 95% of confidence interval on Non
[Onen *, Vol.4 (Iss.3): March, 2016] ISSN- 2350-0530(O) ISSN- 2394-3629(P)
Impact Factor: 2.035 (I2OR)
Http://www.granthaalayah.com ©International Journal of Research - GRANTHAALAYAH [59-79]
Certifying Staff and Mechanics having at least 1 year experience by simple random sampling
method through quota sampling (Saunders, Lewis, Thornhill, 2000).
Relevant numeric values are illustrated in the table below:
Table 2: The number of the enquetee
Groups Main Population
(Facility 1+Facility 2)
Interviewed Sample Size
(Facility 1)
Sample Size
(Facility 2)
Certifying Staff 120 110 60 50
Mechanics 139 92 43 49
Non-Certifying Staff 405 220 148 72
2.1.4. DATA COLLECTION
The questionnaire is tested before the using in the field via pilot study on each group’s
representative sampling. At the two locations, each group who are certifying staff, mechanics
and non- certifying staff are invited to the classroom in different days. First of all, they are
informed respectively about to survey. Then, the representative of each group who are 25 staff
fill in questionnaires since it has been translated from English to Turkish language. Thereby, 52
survey questions are checked whether they are understood by each group correctly or not. On
the other hand, the purpose of time study is to determine average response time of one question
because of the survey is containing 52 questions. Questionnaires are distributed to all attendances
and collected back after they are filled by company safety officers. Filling the questionnaire
process is conducted under the supervision of safety officers. Therefore, misunderstood
questions, response time etc. have been corrected. After then, in accordance with sampling
model, representative of each group member respectively are invited to the classroom for filling
the questionnaire in different days at two locations (facility-1 and facility-2). Finally, the
concerned survey has been conducted within two months.
2.1.5. DESIGNING SURVEY QUESTIONNAIRE
Questionnaire form which designed by EASA Safety Steering Group, scaled by 6 dimensions
and consists in 52 questions for using aviation safety culture levels measurement. The responses
are addressed on a 5 point Likert type scale ranging from 1 to 5 (1= Totally Agree, 5= totally
disagree). This questionnaire used by translation of this scale.
2.1.6. ANALYSIS METHODOLOGY
The data analysed by means of SPSS and AMOS statistic software. The collected data processed
by outlier analysis, homogeneity analysis for each group then exploratory factor analysis,
reliability analysis are performed for each dimension of the scale by using SPSS. Thereby,
uncorrelated and insignificant questions were extracted from its concerned dimension. To
continue with that by means of structural equation model of the AMOS software, first order
conformity factor analysis performed for the model goodness fit and validation of scale’s
dimensions. Finally, by the path analysis method the concerned scale was tested for each group
whether they are significant to explain and aligned in response to the proposed model or not.
[Onen *, Vol.4 (Iss.3): March, 2016] ISSN- 2350-0530(O) ISSN- 2394-3629(P)
Impact Factor: 2.035 (I2OR)
Http://www.granthaalayah.com ©International Journal of Research - GRANTHAALAYAH [59-79]
3. RESULTS AND DISCUSSIONS
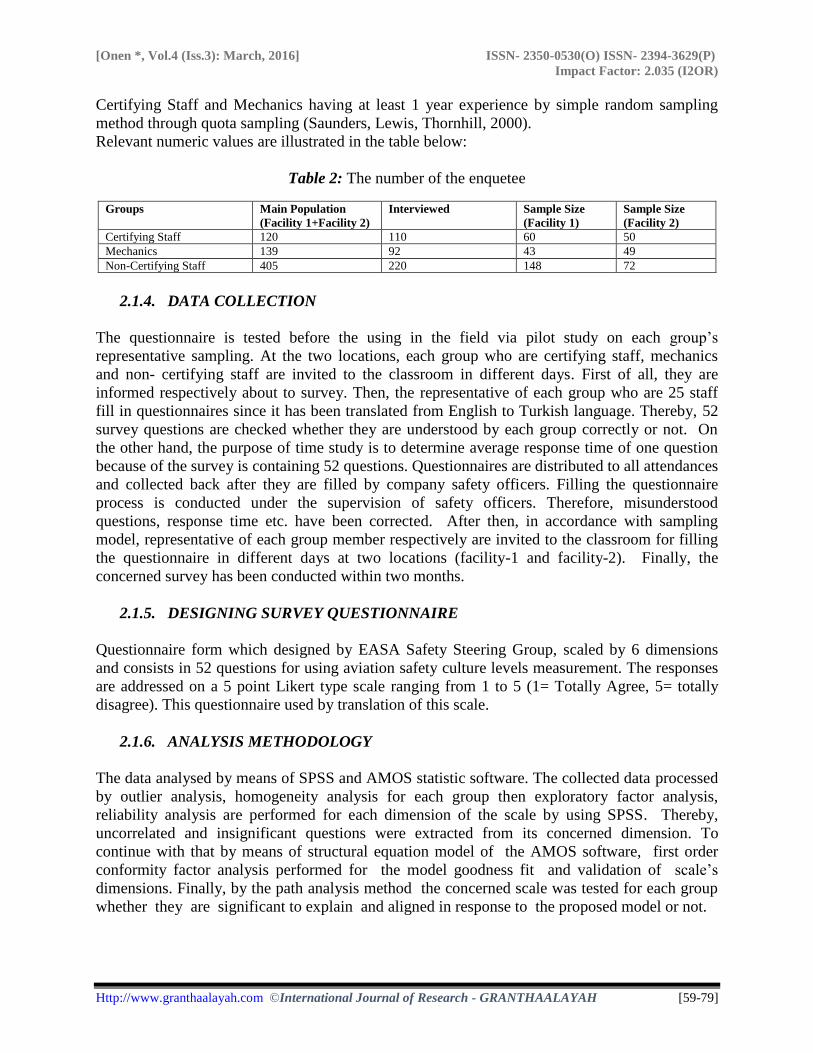
3.1.THE PROPOSED RESEARCH MODEL
As It can be seen that Safety Culture Model scale’ consist in 6 dimensions. The model has been
shown as below:
Figure 2: ECAST’s Safety Culture Measurement Model in Aviation
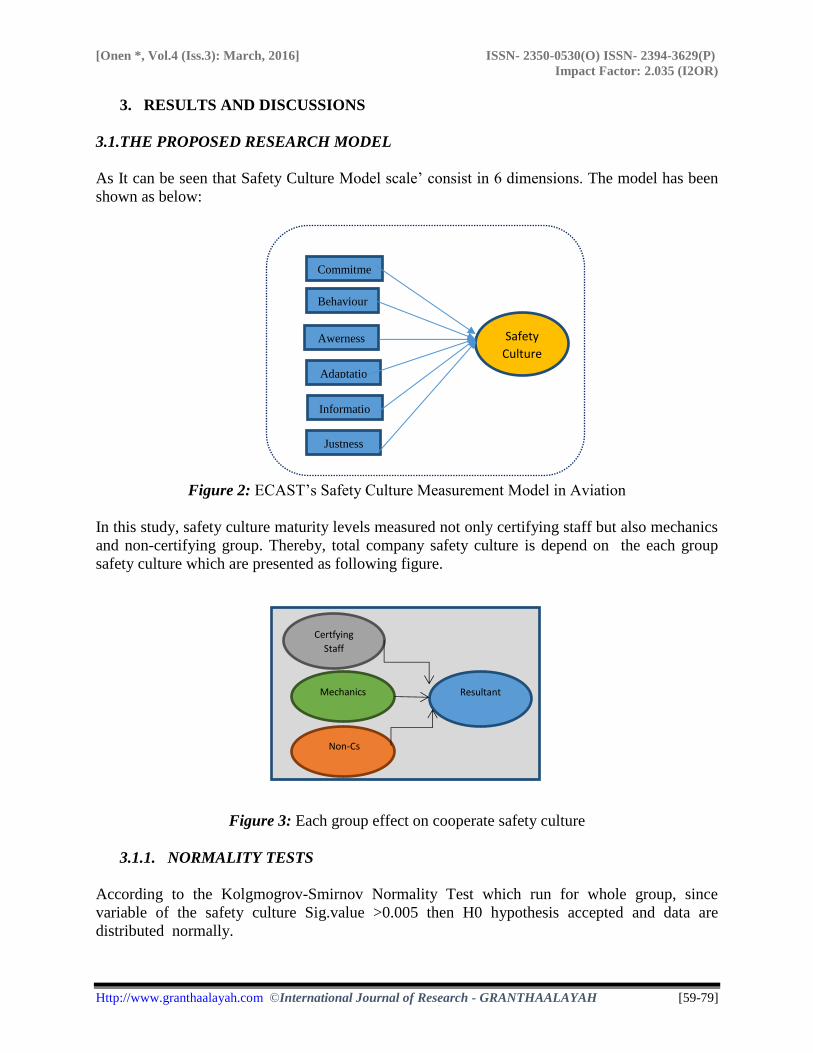
In this study, safety culture maturity levels measured not only certifying staff but also mechanics
and non-certifying group. Thereby, total company safety culture is depend on the each group
safety culture which are presented as following figure.
Figure 3: Each group effect on cooperate safety culture
3.1.1. NORMALITY TESTS
According to the Kolgmogrov-Smirnov Normality Test which run for whole group, since
variable of the safety culture Sig.value >0.005 then H0 hypothesis accepted and data are
distributed normally.
Commitme
nt
Behaviour
Awerness
Adaptatio
n
Informatio
n
Justness
Safety
Culture
Resultant
Safety
Mechanics
Mechanics
Certfying
Staff
Non-Cs
Non-CS

[Onen *, Vol.4 (Iss.3): March, 2016] ISSN- 2350-0530(O) ISSN- 2394-3629(P)
Impact Factor: 2.035 (I2OR)
Http://www.granthaalayah.com ©International Journal of Research - GRANTHAALAYAH [59-79]
3.1.2. OUTLIERS ANALYSIS
According to the certifying staff’s outlier analysing results, the number of data 7,45,61 and
107th accepted as outliers then they were omitted from the data list.
3.1.3. HOMOGENEITY TEST
According to the results of homogeneity test for the certifying staff, Sig. values >0.05 thereby
homogeneity is validated.
3.1.4. FACTOR ANALYSIS AND RELIABILITY ANALYSIS
For each dimension factor analysis performed at the first step and then reliability analysis
performed at the second step after uncorrelated and insignificant questions extracted from the
its dimension. In order to examine reliability of structure which formed by each latent variable
reliability of structure, the proportion total variance explained and Cronbach’s alpha reliability
criteria are calculated. Nunnalyy argue that each of structure Cronbah’s alpha value must be
greater than 0.70 in social sciences for reliability of measurement tool (Nunnaly, J.C. and
Bernstein, I.H., 1994). Some authors suggest Measure of Sampling Adequacy which developed
by Kaiser to apply the factor analysis model successfully (Rencher A.C, 1998). Hair and Et are
considered to be sufficient coefficient value for reliability of structure must be greater than 0.70
and the proportion of total explained variance values must be greater than 0,50 for the latent
variables (Hair, 1998). The following table indicates final results for each dimension of the
Certifying Staff.
Table 3: Factor and Reliability Analysis Summary Results Certifying
Staff
Reliability
Analysis Results
Exploratory Factor Analysis Results Extracted Questions
After the Factor &
Reliability Analysis Cronbach alpha KMO Barlett
Sig Total Variance
Explained
Commitment 0,81 0,81 0,00 51,79 1,5,7,8
Behaviour 0,74 0,76 0,00 50,15 14,17,18
Awareness 0,68 0,59 0,00 49,56 21,22
Adaptation 0,70 0,72 0,00 40,45 -
Information 0,88 0,84 0,00 46,7 31,32,33,40,41,43,44,45,47
Justness 0,74 0,67 0,00 56,89 -
Analysis results shows that KMO values are acceptable levels, p-value for the Bartlett test is 0,00
hence, the results obtained in terms of applicability factor analysis, the data statistically is
sufficient. According to the Scherer, Wiebe, Luther and Adams, if total variance explained value
is between on %40 and %52 it is acceptable in the social science (Tavşancıl, 2005, 399).
Tebachnic and Fidel assert that decision of the size of the factor loadings which are acceptable
should be given by researchers (Tebachnic and Fidel, 2001). Therefore, the relevant scale has
been ready for the analysis of the structural equation modelling.
3.1.5. DESCRIPTIVE STATISTICS AND DEMOGRAPHICS
Descriptive statistics for each group are as follows:
[Onen *, Vol.4 (Iss.3): March, 2016] ISSN- 2350-0530(O) ISSN- 2394-3629(P)
Impact Factor: 2.035 (I2OR)
Http://www.granthaalayah.com ©International Journal of Research - GRANTHAALAYAH [59-79]
Certifying Staff: All certifying staff (110) gender are consist of “male” and selected 78% of the
group from facility-1. The department distribution of certifying staff is base maintenance 80%
and component maintenance 20%.
Mechanics: There are only one woman and 91 men in mechanics group. Mechanics are selected
from facility-1 as 53% and facility-2 as 47%. The department distribution of mechanics is base
maintenance 71% and component maintenance 29%.
Non-Certifying Staff: There are 6 women and 214 men in non-certifying staff group. Non-
certifying staffs are selected from facility-1 as 33% and facility-2 as 67%. The department
distribution of non-certifying staff is base maintenance 67% and component maintenance 33%.
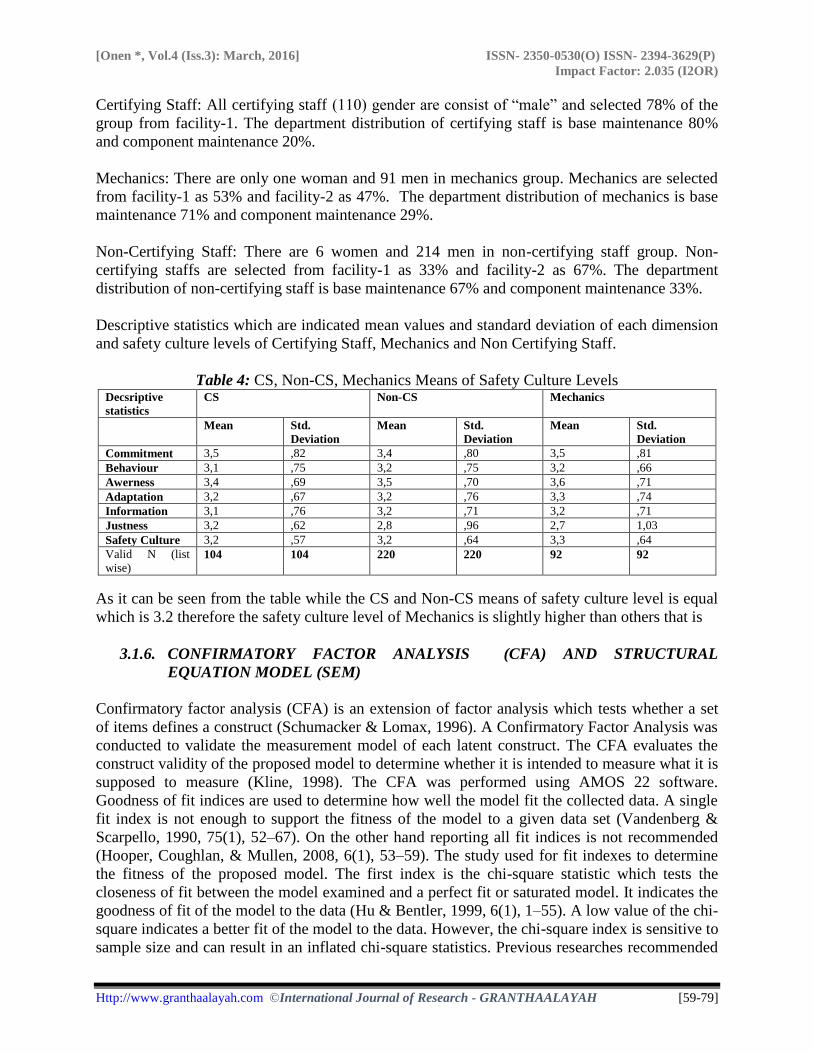
Descriptive statistics which are indicated mean values and standard deviation of each dimension
and safety culture levels of Certifying Staff, Mechanics and Non Certifying Staff.
Table 4: CS, Non-CS, Mechanics Means of Safety Culture Levels Decsriptive
statistics
CS Non-CS Mechanics
Mean Std.
Deviation
Mean Std.
Deviation
Mean Std.
Deviation
Commitment 3,5 ,82 3,4 ,80 3,5 ,81
Behaviour 3,1 ,75 3,2 ,75 3,2 ,66
Awerness 3,4 ,69 3,5 ,70 3,6 ,71
Adaptation 3,2 ,67 3,2 ,76 3,3 ,74
Information 3,1 ,76 3,2 ,71 3,2 ,71
Justness 3,2 ,62 2,8 ,96 2,7 1,03
Safety Culture 3,2 ,57 3,2 ,64 3,3 ,64
Valid N (list
wise) 104 104 220 220 92 92
As it can be seen from the table while the CS and Non-CS means of safety culture level is equal
which is 3.2 therefore the safety culture level of Mechanics is slightly higher than others that is
3.1.6. CONFIRMATORY FACTOR ANALYSIS (CFA) AND STRUCTURAL
EQUATION MODEL (SEM)
Confirmatory factor analysis (CFA) is an extension of factor analysis which tests whether a set
of items defines a construct (Schumacker & Lomax, 1996). A Confirmatory Factor Analysis was
conducted to validate the measurement model of each latent construct. The CFA evaluates the
construct validity of the proposed model to determine whether it is intended to measure what it is
supposed to measure (Kline, 1998). The CFA was performed using AMOS 22 software.
Goodness of fit indices are used to determine how well the model fit the collected data. A single
fit index is not enough to support the fitness of the model to a given data set (Vandenberg &
Scarpello, 1990, 75(1), 52–67). On the other hand reporting all fit indices is not recommended
(Hooper, Coughlan, & Mullen, 2008, 6(1), 53–59). The study used for fit indexes to determine
the fitness of the proposed model. The first index is the chi-square statistic which tests the
closeness of fit between the model examined and a perfect fit or saturated model. It indicates the
goodness of fit of the model to the data (Hu & Bentler, 1999, 6(1), 1–55). A low value of the chi-
square indicates a better fit of the model to the data. However, the chi-square index is sensitive to
sample size and can result in an inflated chi-square statistics. Previous researches recommended
[Onen *, Vol.4 (Iss.3): March, 2016] ISSN- 2350-0530(O) ISSN- 2394-3629(P)
Impact Factor: 2.035 (I2OR)
Http://www.granthaalayah.com ©International Journal of Research - GRANTHAALAYAH [59-79]
a ratio of chi-square to degrees of freedom of between two and three represents an acceptable fit.
The second and third fit indices are the comparative fit index (CFI) and the Tucker-Lewis index
(TLI). The CFI compares the hypothesized model with a null model and considered to be
reasonably robust against violation of assumption. A value above 0.95 is considered good
whereas a value between 0.90 and 0.95 is acceptable. The TLI is used to compare a single model
or alternative models to a null model and is less sensitive to sample size. A value of more than
0.95 indicates a good fit while a value between 0.90 and 0.95 is acceptable. In addition, a value
of less than 0.90 requires a restructure of the model. The fourth and fifth indices are goodness of
fit index (GFI) and adjusted goodness of fit index (AGFI). Theses indices are developed by
Joreskog and Sörbom. GFI has been developed alternatively to the chi-square in order to
evaluate fit of model independently from sample size. Indices of GFI and AGFI changes between
0 and 1. AGFI is an arranged derivation of the GVI to estimate parameters numbers. A value
above or equal 0.90 is considered good A value above or equal 0.90 is considered good and a
value equal 1 is considered perfect (Hooper, Coughlan and Mullen, 2008; Kelloway, 1989;
Sümer, 2000, Schumacker and Lomax, 1996). The sixth fit index is normed fit index (NFI)
which is handled in the incremental fit indices. It was developed by Bentler-Bonnet. NFI
function is similar to CFI, but in the NFI, it is evaluated model estimation via comparison of the
value of the chi-square independency model with the model of chi-square value. Values above
0.90 or equal is considered good and a value equal 1 is considered perfect (Kelloway, 1989;
Schumacker and Lomax, 1996; Sümer, 2000; Tebacknick and Fidell, 2001).The seventh fit index
is the root mean square error of approximation (RMSEA) which account for model complexity.
The lower the value, the less manipulation of the fit exists. A value of less than 0.05 considered a
good fit while a value between 0.05 and 0.08 indicate an adequate fit. A model of 0.10 or more
considered poor fit to the data (Evans et al., 2007).
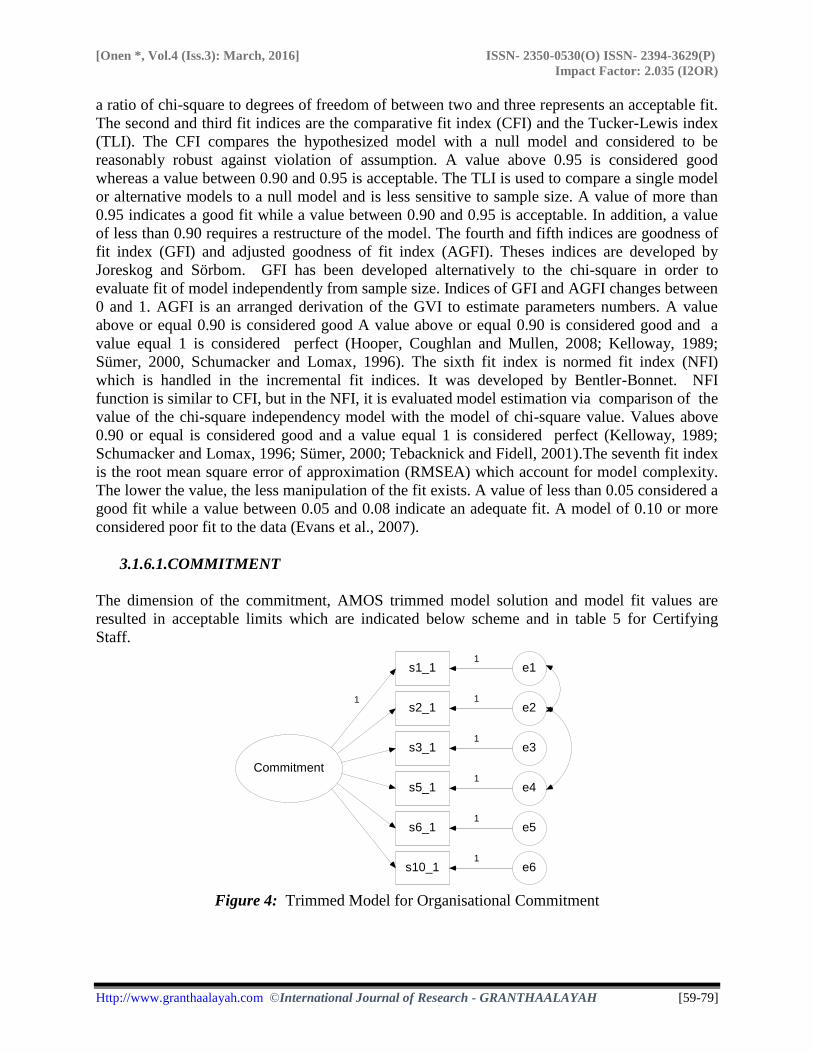
3.1.6.1.COMMITMENT
The dimension of the commitment, AMOS trimmed model solution and model fit values are
resulted in acceptable limits which are indicated below scheme and in table 5 for Certifying
Staff.
Figure 4: Trimmed Model for Organisational Commitment
Commitment
s1_1 e1
1
1
s2_1 e21
s3_1 e31
s5_1 e41
s6_1 e51
s10_1 e61

[Onen *, Vol.4 (Iss.3): March, 2016] ISSN- 2350-0530(O) ISSN- 2394-3629(P)
Impact Factor: 2.035 (I2OR)
Http://www.granthaalayah.com ©International Journal of Research - GRANTHAALAYAH [59-79]
Table 5: Model fit indices for Organizational Commitment Dimensions CMIN/DIF
<5
GFI
>0,85
AGFI
>0,80
CFI
>0,90
NFI
>0,90
TLI
>0,90
RMSEA
<0,08
,889 ,981 ,944 1,000 ,968 1,009 ,000
3.1.6.2.BEHAVIOUR
The dimension of the behaviour, AMOS trimmed model solution and model fit values are
resulted in acceptable as seen below scheme and in table 6 for Certifying Staff.
Figure 5: Trimmed Model for Organisational Behaviour
Table 6: Model fit indices for Organizational Behaviour Dimensions CMIN/DIF
<5
GFI
>0,85
AGFI
>0,80
CFI
>0,90
NFI
>0,90
TLI
>0,90
RMSEA
<0,08
4,154 ,984 ,939 ,999
,964 ,996 ,019
3.1.6.3.AWARENESS
The dimension of the awareness, AMOS trimmed model solution and model fit values are
resulted in as seen below for Certifying Staff.
Figure 6: Trimmed Model for Organisational Awareness
Behaviour
s11_1 e1
1
1
s12_1 e21
s13_1 e31
s15_1 e41
s16_1 e51
Awerness
s19_1 e1
1
1
s20_1 e21
s21_1 e31
s24_1 e61

[Onen *, Vol.4 (Iss.3): March, 2016] ISSN- 2350-0530(O) ISSN- 2394-3629(P)
Impact Factor: 2.035 (I2OR)
Http://www.granthaalayah.com ©International Journal of Research - GRANTHAALAYAH [59-79]
Table 7: Model fit indices for Organizational Awareness Dimensions CMIN/DIF
<5
GFI
>0,85
AGFI
>0,80
CFI
>0,90
NFI
>0,90
TLI
>0,90
RMSEA
<0,08
1,417 ,993 ,932 ,995 ,985 972 ,064
3.1.6.4.ADAPTATION
The dimension of adaptation AMOS trimmed model solution and model fit values are resulted in
as seen below for Certifying Staff.
Figure 7: Trimmed Model for Organizational Adaptation
Table 8: Model fit indices for Organizational Adaptation Dimensions CMIN/DIF
<5
GFI
>0,85
AGFI
>0,80
CFI
>0,90
NFI
>0,90
TLI
>0,90
RMSEA
<0,08
1,469
,973 ,918 ,974 ,927 ,948 ,067
3.1.6.5.INFORMATION
The dimension of the information, AMOS trimmed model solution and good of fitness values are
resulted in as seen below for Certifying Staff.
Figure 8: Trimmed Model for Organisational Information
1
Adaptation
s26_1 e21
s27_1 e31
s28_1 e41
s29_1 e51
s30_1 e61
Infomation
s34_1 e1
1
1
s35_1 e21
s36_1 e31
s37_1 e41
s38_1 e51
s39_1 e61
s42_1 e71
s46_1 e81
s47_1 e91

[Onen *, Vol.4 (Iss.3): March, 2016] ISSN- 2350-0530(O) ISSN- 2394-3629(P)
Impact Factor: 2.035 (I2OR)
Http://www.granthaalayah.com ©International Journal of Research - GRANTHAALAYAH [59-79]
Table 9: Model fit indices for Organizational Information Dimensions CMIN/DIF
<5
GFI
>0,85
AGFI
>0,80
CFI
>0,90
NFI
>0,90 TLI
>0,90
RMSEA
<0,08
1,211 ,946 ,890 ,982 ,909 ,970 ,045
3.1.6.6.JUSTNESS
The dimension of the information, AMOS trimmed model solution and good of fitness values are
resulted in as seen below for Certifying Staff.
Figure 9: Trimmed Model for Organisational Justness
Table 10: Model fit indices for Organizational Justness Dimensions CMIN/DIF
<5
GFI
>0,85
AGFI
>0,80
CFI
>0,90
NFI
>0,90
TLI
>0,90
RMSEA
<0,08
,176 ,999 ,991 1,000 ,998 1,058 ,000
3.2.THE FIRST ORDER CONFIRMATORY FACTOR ANALYSIS AND STRUCTURAL
EQUATION MODEL
When we performed the first order confirmatory factor analysis for Certifying Staff in all
dimensions by using SEM we would be got following modified model.
Justness
s49_1 e1
1
1
s50_1 e21
s51_1 e31
s52_1 e41

[Onen *, Vol.4 (Iss.3): March, 2016] ISSN- 2350-0530(O) ISSN- 2394-3629(P)
Impact Factor: 2.035 (I2OR)
Http://www.granthaalayah.com ©International Journal of Research - GRANTHAALAYAH [59-79]
Figure 10: Confirmatory Factor Analysis and Structural Equation Model
The concerned SEM l regression weights and estimated values are acceptable levels and seen as
follows:
Table 11: Regression Weights: (Group number 1 - Default model) Estimate S.E. C.R. P
COMMITMENT SAFETY CULTURE ,503 ,103 4,875 ***
ADAPTABILITY SAFETY CULTURE ,627 ,096 6,550 ***
BEHAVIOUR SAFETY CULTURE ,700 ,103 6,833 ***
AWERENESS SAFETY CULTURE ,650 ,085 7,686 ***
JUSTNESS SAFETY CULTURE ,661 ,106 6,222 ***
INFORMATION SAFETY CULTURE ,419 ,089 4,694 ***
s10_1 COMMITMENT 1,000
s6_1 COMMITMENT ,932 ,176 5,286 ***
s5_1 COMMITMENT 1,076 ,204 5,283 ***
s3_1 COMMITMENT ,854 ,157 5,441 ***
s2_1 COMMITMENT ,893 ,166 5,390 ***
s1_1 COMMITMENT ,990 ,190 5,212 ***
s16_1 BEHAVIOUR 1,000
s15_1 BEHAVIOUR ,801 ,156 5,141 ***
s13_1 BEHAVIOUR ,772 ,166 4,651 ***
s12_1 BEHAVIOUR ,663 ,182 3,640 ***
s11_1 BEHAVIOUR ,847 ,155 5,450 ***
s30_1 ADAPTABILITY 1,000
s29_1 ADAPTABILITY 1,051 ,197 5,330 ***
s28_1 ADAPTABILITY ,949 ,158 6,002 ***
s27_1 ADAPTABILITY ,595 ,135 4,416 ***
s26_1 ADAPTABILITY ,644 ,158 4,070 ***
COMMITMENT
s10_1
e18
1
1
s6_1
e191
s5_1
e201
s3_1
e211
s2_1
e221
s1_1
e231
BEHAVIOUR
s16_1e24
1
1
s15_1e251
s13_1e261
s12_1e271
s11_1e281
ADAPTABIITY
s30_1
e29
1
1s29_1
e30
1s28_1
e31
1s27_1
e32
1s26_1
e33
1
1
SAFETY CULTURE
INFORMATION
s47_1e38
1
1
s46_1e391
s42_1e401
s39_1e411
s38_1e421
s37_1e431
s36_1e441
s35_1e451
s34_1e461
JUSTNESS
s52_1
e47
1
1
s51_1
e48
1
s50_1
e49
1
s49_1
e50
1
e51
1
e52
1
e53
1
e541
e551
AWERNESS
s19_1 e561
s20_1 e57
s21_1 e58
s24_1e59
e601
1
1
1
1

[Onen *, Vol.4 (Iss.3): March, 2016] ISSN- 2350-0530(O) ISSN- 2394-3629(P)
Impact Factor: 2.035 (I2OR)
Http://www.granthaalayah.com ©International Journal of Research - GRANTHAALAYAH [59-79]
s47_1 INFORMATION 1,000
s46_1 INFORMATION ,836 ,184 4,538 ***
s42_1 INFORMATION 1,122 ,277 4,052 ***
s39_1 INFORMATION 1,053 ,264 3,995 ***
s38_1 INFORMATION 1,137 ,278 4,086 ***
s37_1 INFORMATION 1,212 ,282 4,304 ***
s36_1 INFORMATION 1,240 ,296 4,187 ***
s35_1 INFORMATION 1,616 ,350 4,616 ***
s34_1 INFORMATION 1,402 ,289 4,847 ***
s52_1 JUSTNESS 1,000
s51_1 JUSTNESS 1,110 ,186 5,973 ***
s50_1 JUSTNESS ,674 ,148 4,556 ***
s49_1 JUSTNESS ,628 ,137 4,582 ***
s19_1 AWARENESS 1,000
s20_1 AWARENESS ,851 ,110 7,715 ***
s21_1 AWARENESS ,621 ,126 4,925 ***
s24_1 AWARENESS ,585 ,154 3,811 ***
Regarding model fit values are acceptable and have been calculated as below:
Table 12: Regarding model fit values CMIN Model NPAR CMIN DF P CMIN/DF
Default model 81 761,940 480 ,000 1,587
Saturated model 561 ,000 0
Independence model 33 1854,802 528 ,000 3,513
RMR, GFI
Model RMR GFI AGFI PGFI
Default model ,091 ,717 ,669 ,613
Saturated model ,000 1,000
Independence model ,312 ,251 ,204 ,236
RMSEA
Model RMSEA LO 90 HI 90 PCLOSE
Default model ,076 ,065 ,085 ,000
Independence model ,156 ,149 ,164 ,000
Baseline Comparisons
Model
NFI
Delta1
RFI
rho1
IFI
Delta2
TLI
rho2
CFI
Default model ,589 ,548 ,795 ,766 ,788
Saturated model 1,000 1,000 1,000
Independence model ,000 ,000 ,000 ,000 ,000
3.2.1. CERTIFYING STAFF , MECHANICS, NON- CERTIFYING STAFF PATH
ANALYSIS
Confirmatory Factor Analysis which explained above not only performed Certifying staff but
also performed for the Mechanics and Non Certifying Staff. Therefore, when it comes to path
analysis for each group, as specified in below, by using the latent variables the related
structural equation model developed and model fit values calculated for each group.
[Onen *, Vol.4 (Iss.3): March, 2016] ISSN- 2350-0530(O) ISSN- 2394-3629(P)
Impact Factor: 2.035 (I2OR)
Http://www.granthaalayah.com ©International Journal of Research - GRANTHAALAYAH [59-79]
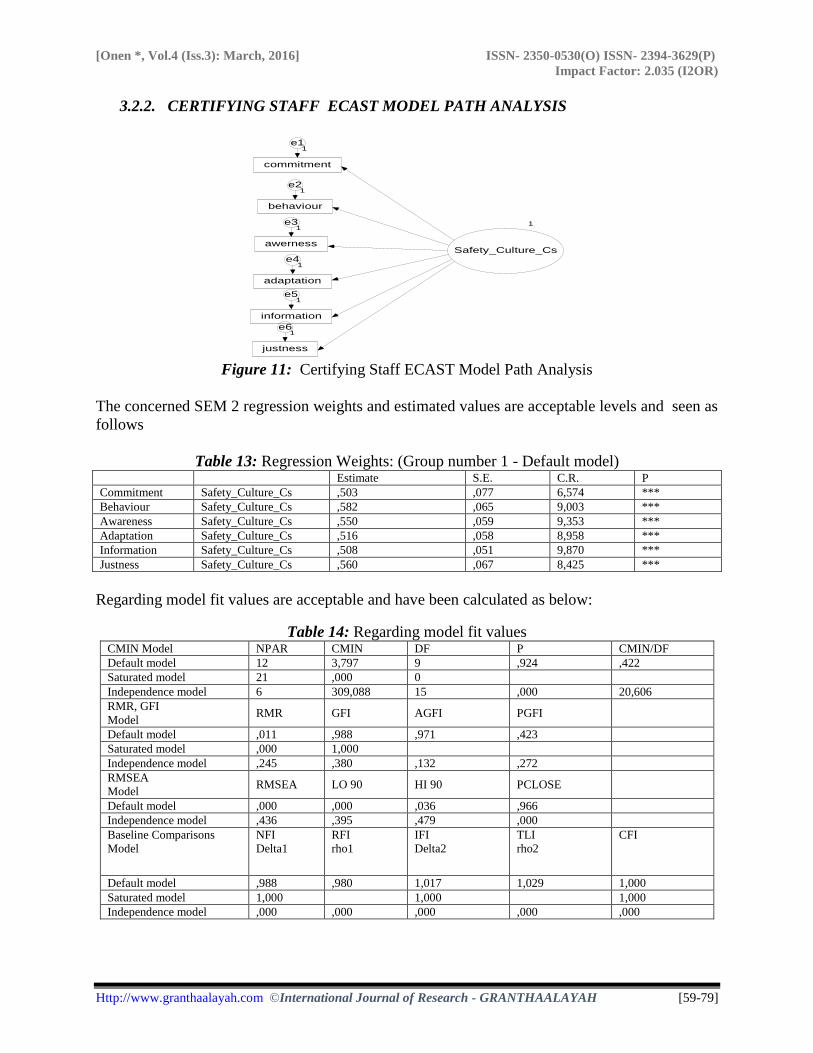
3.2.2. CERTIFYING STAFF ECAST MODEL PATH ANALYSIS
Figure 11: Certifying Staff ECAST Model Path Analysis
The concerned SEM 2 regression weights and estimated values are acceptable levels and seen as
follows
Table 13: Regression Weights: (Group number 1 - Default model) Estimate S.E. C.R. P
Commitment Safety_Culture_Cs ,503 ,077 6,574 ***
Behaviour Safety_Culture_Cs ,582 ,065 9,003 ***
Awareness Safety_Culture_Cs ,550 ,059 9,353 ***
Adaptation Safety_Culture_Cs ,516 ,058 8,958 ***
Information Safety_Culture_Cs ,508 ,051 9,870 ***
Justness Safety_Culture_Cs ,560 ,067 8,425 ***
Regarding model fit values are acceptable and have been calculated as below:
Table 14: Regarding model fit values CMIN Model NPAR CMIN DF P CMIN/DF
Default model 12 3,797 9 ,924 ,422
Saturated model 21 ,000 0
Independence model 6 309,088 15 ,000 20,606
RMR, GFI
Model RMR GFI AGFI PGFI
Default model ,011 ,988 ,971 ,423
Saturated model ,000 1,000
Independence model ,245 ,380 ,132 ,272
RMSEA
Model RMSEA LO 90 HI 90 PCLOSE
Default model ,000 ,000 ,036 ,966
Independence model ,436 ,395 ,479 ,000
Baseline Comparisons
Model
NFI
Delta1
RFI
rho1
IFI
Delta2
TLI
rho2
CFI
Default model ,988 ,980 1,017 1,029 1,000
Saturated model 1,000 1,000 1,000
Independence model ,000 ,000 ,000 ,000 ,000
commitment
behaviour
awerness
adaptation
information
justness
1
Safety_Culture_Cs
e11
e21
e31
e41
e51
e61
[Onen *, Vol.4 (Iss.3): March, 2016] ISSN- 2350-0530(O) ISSN- 2394-3629(P)
Impact Factor: 2.035 (I2OR)
Http://www.granthaalayah.com ©International Journal of Research - GRANTHAALAYAH [59-79]
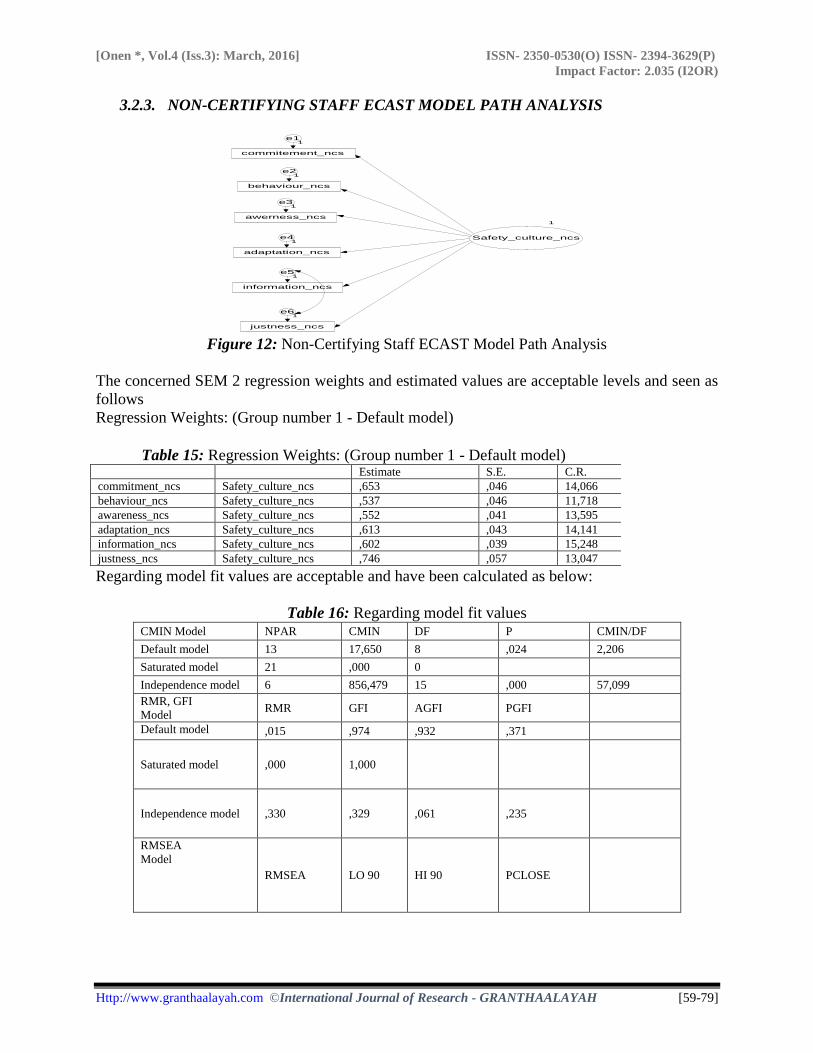
3.2.3. NON-CERTIFYING STAFF ECAST MODEL PATH ANALYSIS
Figure 12: Non-Certifying Staff ECAST Model Path Analysis
The concerned SEM 2 regression weights and estimated values are acceptable levels and seen as
follows
Regression Weights: (Group number 1 - Default model)
Table 15: Regression Weights: (Group number 1 - Default model) Estimate S.E. C.R. P
commitment_ncs Safety_culture_ncs ,653 ,046 14,066 ***
behaviour_ncs Safety_culture_ncs ,537 ,046 11,718 ***
awareness_ncs Safety_culture_ncs ,552 ,041 13,595 ***
adaptation_ncs Safety_culture_ncs ,613 ,043 14,141 ***
information_ncs Safety_culture_ncs ,602 ,039 15,248 ***
justness_ncs Safety_culture_ncs ,746 ,057 13,047 ***
Regarding model fit values are acceptable and have been calculated as below:
Table 16: Regarding model fit values CMIN Model NPAR CMIN DF P CMIN/DF
Default model 13 17,650 8 ,024 2,206
Saturated model 21 ,000 0
Independence model 6 856,479 15 ,000 57,099
RMR, GFI
Model RMR GFI AGFI PGFI
Default model ,015 ,974 ,932 ,371
Saturated model ,000 1,000
Independence model ,330 ,329 ,061 ,235
RMSEA
Model
RMSEA LO 90 HI 90 PCLOSE
commitement_ncs
behaviour_ncs
awerness_ncs
adaptation_ncs
information_ncs
justness_ncs
1
Safety_culture_ncs
e11
e21
e31
e41
e51
e61
[Onen *, Vol.4 (Iss.3): March, 2016] ISSN- 2350-0530(O) ISSN- 2394-3629(P)
Impact Factor: 2.035 (I2OR)
Http://www.granthaalayah.com ©International Journal of Research - GRANTHAALAYAH [59-79]
Default model
,074 ,026 ,121 ,171
Independence model ,506 ,478 ,535 ,000
Baseline Comparisons
Model
NFI
Delta1
RFI
rho1
IFI
Delta2
TLI
rho2
CFI
Default model
,979 ,961 ,989 ,978 ,989
Saturated model 1,000 1,000 1,000
Independence model ,000 ,000 ,000 ,000 ,000
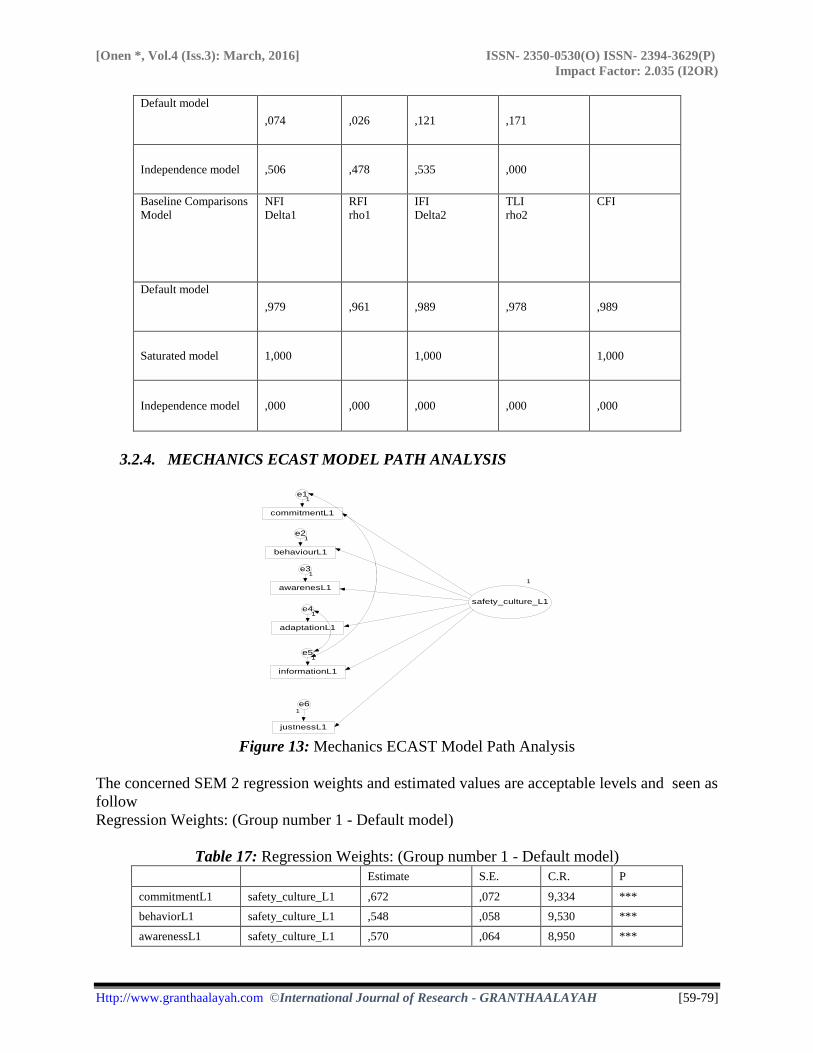
3.2.4. MECHANICS ECAST MODEL PATH ANALYSIS
Figure 13: Mechanics ECAST Model Path Analysis
The concerned SEM 2 regression weights and estimated values are acceptable levels and seen as
follow
Regression Weights: (Group number 1 - Default model)
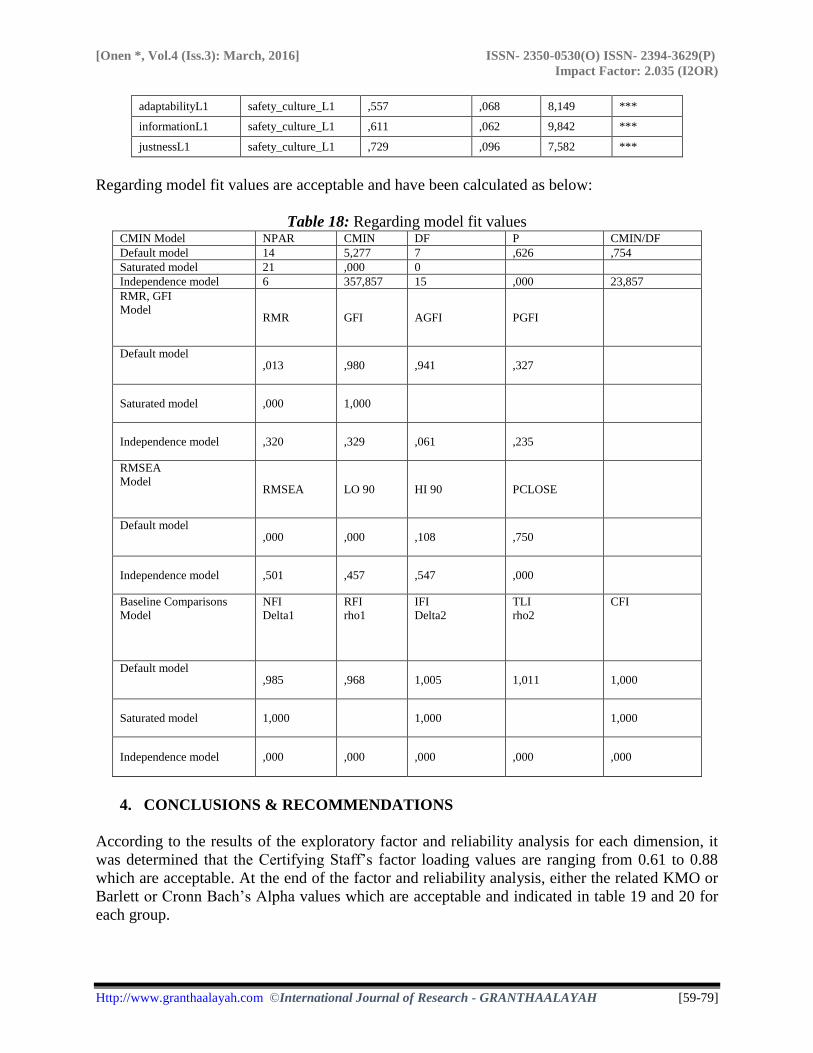
Table 17: Regression Weights: (Group number 1 - Default model) Estimate S.E. C.R. P
commitmentL1 safety_culture_L1 ,672 ,072 9,334 ***
behaviorL1 safety_culture_L1 ,548 ,058 9,530 ***
awarenessL1 safety_culture_L1 ,570 ,064 8,950 ***
commitmentL1
behaviourL1
awarenesL1
adaptationL1
informationL1
justnessL1
e11
e21
e31
e41
e51
e61
1
safety_culture_L1
[Onen *, Vol.4 (Iss.3): March, 2016] ISSN- 2350-0530(O) ISSN- 2394-3629(P)
Impact Factor: 2.035 (I2OR)
Http://www.granthaalayah.com ©International Journal of Research - GRANTHAALAYAH [59-79]
adaptabilityL1 safety_culture_L1 ,557 ,068 8,149 ***
informationL1 safety_culture_L1 ,611 ,062 9,842 ***
justnessL1 safety_culture_L1 ,729 ,096 7,582 ***
Regarding model fit values are acceptable and have been calculated as below:
Table 18: Regarding model fit values CMIN Model NPAR CMIN DF P CMIN/DF
Default model 14 5,277 7 ,626 ,754
Saturated model 21 ,000 0
Independence model 6 357,857 15 ,000 23,857
RMR, GFI
Model RMR GFI AGFI PGFI
Default model ,013 ,980 ,941 ,327
Saturated model ,000 1,000
Independence model ,320 ,329 ,061 ,235
RMSEA
Model RMSEA LO 90 HI 90 PCLOSE
Default model ,000 ,000 ,108 ,750
Independence model ,501 ,457 ,547 ,000
Baseline Comparisons
Model
NFI
Delta1
RFI
rho1
IFI
Delta2
TLI
rho2
CFI
Default model ,985 ,968 1,005 1,011 1,000
Saturated model 1,000 1,000 1,000
Independence model ,000 ,000 ,000 ,000 ,000
4. CONCLUSIONS & RECOMMENDATIONS
According to the results of the exploratory factor and reliability analysis for each dimension, it
was determined that the Certifying Staff’s factor loading values are ranging from 0.61 to 0.88
which are acceptable. At the end of the factor and reliability analysis, either the related KMO or
Barlett or Cronn Bach’s Alpha values which are acceptable and indicated in table 19 and 20 for
each group.

[Onen *, Vol.4 (Iss.3): March, 2016] ISSN- 2350-0530(O) ISSN- 2394-3629(P)
Impact Factor: 2.035 (I2OR)
Http://www.granthaalayah.com ©International Journal of Research - GRANTHAALAYAH [59-79]
Table 19: KMO and Barlett values for each dimesion Group Dimensions Commitment Behaviour Awareness Adaptation Information Justness
CS KMO 0,81 0,68 0,59 0,72 0,84 0,78
Barlett 0,00 0,00 0,00 0,00 0,00 0,00
Mechanics KMO 0,88 0,74 0,73 0,79 0,83 0,84
Barlett 0,00 0,00 0,00 0,00 0,00 0,00
Non-CS KMO 0,90 0,80 0,76 0,79 0,90 0,79
Barlett 0,00 0,00 0,00 0,00 0,00 0,00
Table 20: Cron Bach’s Alpha values for each dimension
The relevant overall model fit summary values are indicated as seen below:
Table 21: Model fit indices for each group Group CMIN/DIF
<5
GFI
>0,85
AGFI
>0,80
CFI
>0,90
NFI
>0,90
TLI
>0,90
RMSEA
<0,08
Safety Culture
Certifying Staff
Safety Culture
Mechanics
Safety Culture Non-
Certifying Staff
0,422 0,988 0,971
1,000
0,980
1,029
0,00
0,754 0,980 0,941
1,000
0,985
1,015
0,000
2,206 0,974 0,932
0,989
0,979
0,978
0,074
When examined model fit indices of each group, the values of CMIN/DIF, the values of GFI, the
values of AGFI the values of CFI, the values of NFI, the values of TLI and the values of
RMSEA were found acceptable. As a result, above mentioned summary tables shows that this
structural equation model is acceptable since obtained data, values and goodness of fitness
indices are statistically satisfactory levels (Joreskog ve Sorborm, 1993: Kline 1998). Each
group’s RMSEA value is lower than 0.08. Thereby, model estimation results and model god of
fitness values such as CMIN/DEF, RMSEA, TLI, NFI, AGFI are satisfactory to explain the
model.
To conclude with that, Westrum’s safety culture measurement model can use in maintenance
repair organizations. There are more than 500 maintenance repair organizations which may
benefit from this model in the EU and Turkey. Finally, this study is addressing safety culture
measurement model fitness in the maintenance repair organizations not the others aviation
operations therefore it must be validated before using others type of aviation operations.
Group Dimensions Commitment Behaviour Awarenes
s
Adaptation Information Justness
CS CronnBach’s
Alpha
0,81 0,74 0,68 0,70 0,86 0,74
Mechanics CronnBach’s
Alpha
0,90 0,71 0,80 0,77 0,91 0,76
Non-CS CronnBach’s
Alpha
0,86 0,76 0,77 0,77 0,91 0,86
[Onen *, Vol.4 (Iss.3): March, 2016] ISSN- 2350-0530(O) ISSN- 2394-3629(P)
Impact Factor: 2.035 (I2OR)
Http://www.granthaalayah.com ©International Journal of Research - GRANTHAALAYAH [59-79]
5. REFERENCES
[1] Reason, James, and Alan Hobbs. Managing Maintenance Error. Chp. 11. 2003. 145-148.
[2] Piers, Montijn & Balk. Safety Culture Frame Work for the ECAST-WG. NLR, 2009.
[3] Hudson, Patrick. Safety Management and Safety Culture: The Long, Hard and Winding
Road. Leiden University, 2007.
[4] IAEA. Workshop on Global Safety Culture: National Factors Relevant to Safety Culture,
Vienna, 2014.
[5] Gerede, Ender. SMS Workshop, Anatolian University, 2012.
[6] Reason, J. T. A Life in Error: From Little Slips to Big Disasters, 2013. 81.
[7] Wiegmann, A. Douglas. Development and Initial Validation of a Safety Culture Survey
for Commercial Aviation. Savoy, Ill.: University of Illinois at Urbana-Champaign,
Aviation Human Factors Division, 2003.
[8] Westrum, Ron. Culture with requisite imagination. In J. A. Wise, V. D. Hopkin, & P.
Stager, Verification and Validation of Complex Systems: Human Factors Issues. NATO
ASI Series F, Vol.110. Berlin: Springer-Verlag, pp. 315-332. 1993.
[9] Parker, Dianne, Lawrie, Matthew & Hudson, Patrick. A framework for understanding the
development of organizational safety culture. Safety science, 44. 2006.
[10] Fleming, Mark. Offshore Technology Report. Safety Culture Maturity Model, 49.
Sudbury: HSE Books, 1999.
[11] HSG 48. In Reducing Error and Influencing Behaviour. 2nd ed. Sudbury: HSE Books,
1999.
[12] Saunders, Mark, and Lewis, Philip. Research Methods for Business Students. 2nd ed.
Harlow, England: Prentice Hall, 2000.
[13] Nunnally, C. Jum. Psychometric Theory. 3rd ed. New York: McGraw-Hill, 1994.
[14] Rencher, C. Alvin and William F. Christensen. Methods of Multivariate Analysis. Third
ed. Hoboken, New Jersey: Wiley, 2012.
[15] Rencher, C. Alvin and William F. Christensen. Methods of Multivariate Analysis. 1st ed.
Hoboken, New Jersey: Wiley, 1998.
[16] Hair, Joseph F. Multivariate Data Analysis. 5th ed. Upper Saddle River, N.J.: Prentice
Hall, 1998.
[17] Tavşancıl, Ezel. Tutumların Ölçülmesi ve SPSS ile Veri Analizi. 2nd ed. Ankara:Nobel
Yayınları, 2005.
[18] Tabachnick, Barbara G., and Linda S. Fidell. Using Multivariate Statistics. 4th ed.
Boston: Pearson/Allyn & Bacon, 2001.
[19] Schumacker, Randall E., and Richard G. Lomax. A Beginner's Guide to Structural
Equation Modelling. 1st ed. Mahwah, N.J.: Lawrence Erlbaum Associates, 1996.
[20] Kline, Paul. The Handbook of Psychological Testing. 2nd ed. London: Routledge, 1998.
[21] Vandenberg & Scarpello. The matching model: An examination of the processes
underlying realistic job previews. Journal of Applied Psychology, 75(1), 52–67.
doi:10.1037/0021-9010.75.1.52. 1990.
[22] Hooper, Daire, Coughlan, Joseph & Mullen, Michael. Structural Equation Modelling:
Guidelines for Determining Model Fit. Electronic Journal of Business Research Methods,
6(1), 53–59, 2008.
[Onen *, Vol.4 (Iss.3): March, 2016] ISSN- 2350-0530(O) ISSN- 2394-3629(P)
Impact Factor: 2.035 (I2OR)
Http://www.granthaalayah.com ©International Journal of Research - GRANTHAALAYAH [59-79]
[23] Hu & Bentler. Cut off criteria for fit indexes in covariance structure analysis:
Conventional criteria versus new alternatives. Structural Equation Modelling, 6(1), 1–
55. doi:10.1080/10705519909540118. 1999.
[24] Kelloway, E. Kevin. Using LISREL for Structural Equation Modelling: A researcher's
Guide. Thousand Oaks: Sage Publications, 1989.
[25] Sümer, Nebi. Yapısal Eşitlik Modelleri. Türk Psikoloji Yazıları, 3 (6), 49-74, 2000.
[26] Evans, B., Glendon, A. I., & Creed, P. A. Development and initial validation of an
aviation safety climate scale. Journal of Safety Research, 38, 675-682, 2007.
[27] Jöreskog, G. Karl & Sörbom, Dag. LISREL 8: Structural Equation Modelling with the
SIMPLIS Command Language. Chicago: Scientific Software International, Inc, 1993.
[28] Şimşek, G. Gülhayat. Latent Değişkenli Yapısal Denklem Modellerine İlişkin Bir Uygula-
ma, Doctorate Thesis, Marmara University, 2007.