aviation statistics airline on time performance · aviation statistics airline on time performance...
TRANSCRIPT

AVIATION STATISTICS
AirlineOn Time Performance
2007 Annual Report—OTP 55
AVSTATS_OTP.ai 8/01/2008 2:00:10 PM

BITRE – Aviation Statistics OTP 55
ii
© Commonwealth of Australia 2008
ISSN 1832-0759
This work is copyright and the data contained in this publication should not be reproduced or used in any form without acknowledgement.
Enquiries
Bureau of Infrastructure, Transport and Regional Economics GPO Box 501 Canberra ACT 2601
Telephone: 02 6274 7720
Facsimile: 02 6274 7727
Web site: www.bitre.gov.au
Email: [email protected]
This publication, including a spreadsheet of the time-series data, can be downloaded from the BITRE web site: http://www.bitre.gov.au/info.aspx?Resourceld=214&Nodeld=104.
Disclaimers
BITRE seeks to publish its work to the highest professional standards. However, it cannot accept responsibility for any consequences arising from the use of information herein. Readers should rely on their own skill and judgment in applying any information or analysis to particular issues or circumstances.
Foreword
iii
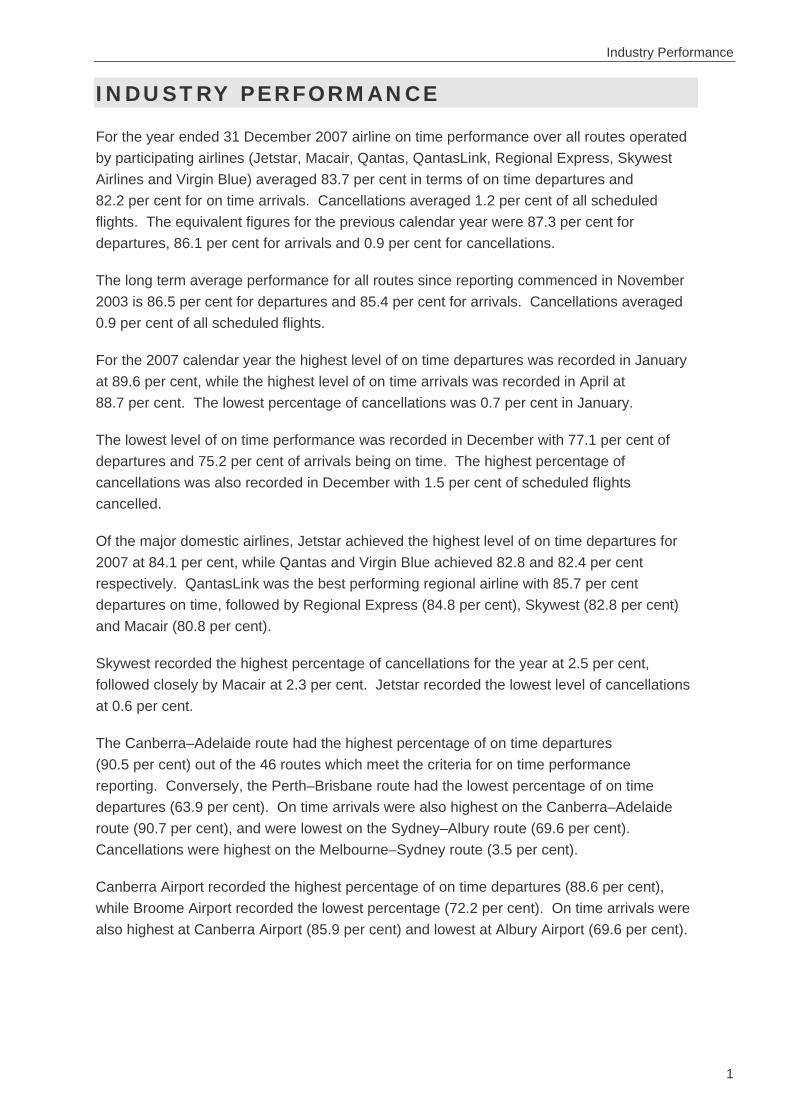
FOREWORD
The Bureau of Infrastructure, Transport and Regional Economics (BITRE) reports on domestic aviation on time performance of participating Australian domestic airlines: Jetstar, Qantas, QantasLink, Regional Express, Skywest Airlines, and Virgin Blue. Reporting commenced in November 2003. Macair, which commenced reporting in July 2005, only supply total network data as they have no competitive routes.
The purpose of collecting this information is to monitor overall industry and individual airline performance on punctuality and to allow consumers of air travel to make informed decisions when planning air travel.
On time performance is reported for all routes where the passenger load averages over 8 000 passengers per month and where two or more airlines operate in competition. There are currently 46 routes which meet this definition. However, over time, routes which meet this criteria may change as airline networks and traffic levels vary.
Airlines also report overall monthly network performance. Total industry figures refer to all services operated by reporting airlines only. This currently represents over 99 per cent of scheduled domestic aviation services in Australia.
The method of capturing on time performance varies between airlines utilising different recording systems. Jetstar and Qantas jet aircraft use Aircraft Communication Addressing and Reporting System (ACARS) to electronically measure on time performance. Virgin Blue, Macair, Regional Express, Skywest and the Qantas non-jet fleet record on time performance manually using records from pilots, gate agents and/or ground crews.
Reports are published monthly on the BITRE web site. After collection of initial data, aggregate reports are subject to internal audit by participating airlines prior to publication. The target date for publication is within six weeks of the end of the reporting period. This report collates data for the total industry and individual routes and airports for the year ended 31 December 2007.
Information on the total network for the year ending 31 December 2007 is presented on Page 1.
On time performance reporting was provided for 46 different routes covering 28 airports for the year ending 31 December 2007. Detailed information on the performance of these routes is included in the tables beginning on Page 5, while detailed information on performance by airport is included from Page 15. The definitions can be found on Page 19.
Detailed time series data is available in Microsoft Excel spreadsheet format from the BITRE web site at – http://www.bitre.gov.au/info.aspx?Resourceld=214&Nodeld=104.

BITRE – Aviation Statistics OTP 55
iv

Contents
v
CONTENTS
Industry Performance ..................................................................................................1
Individual Routes ..........................................................................................................5
Airports...........................................................................................................................15
Definitions .....................................................................................................................19

BITRE – Aviation Statistics OTP 55
vi
Industry Performance
1
INDUSTRY PERFORMANCE
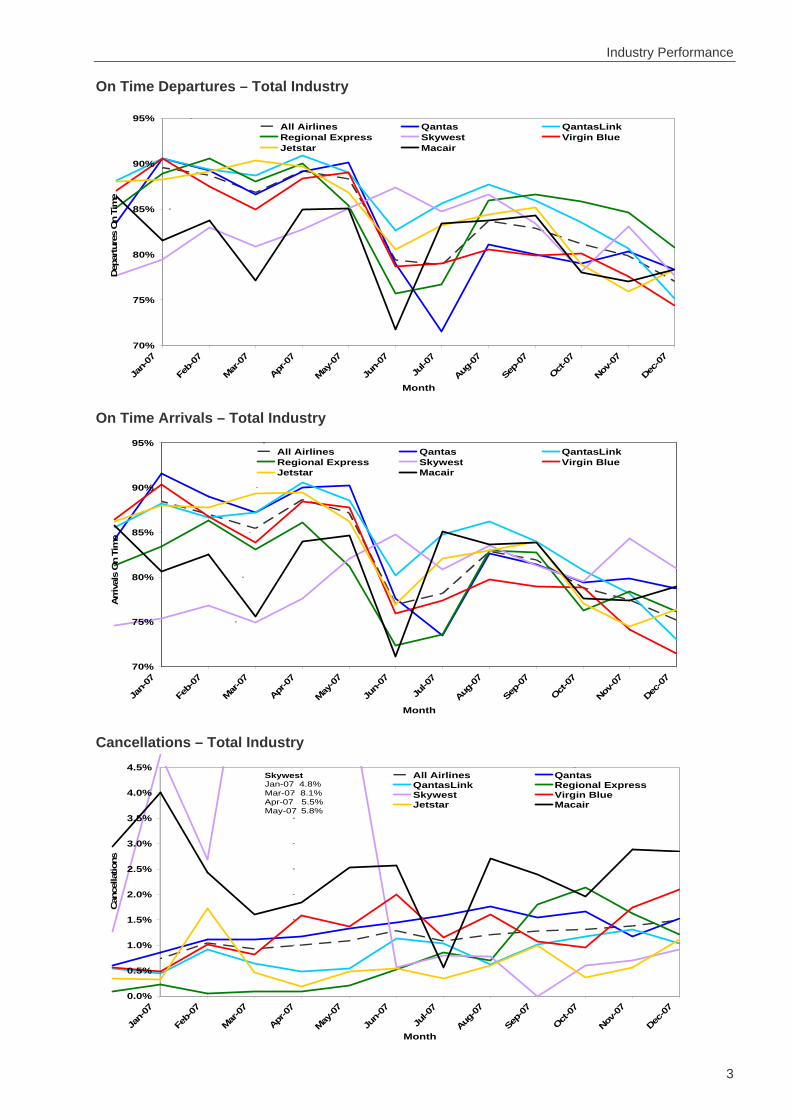
For the year ended 31 December 2007 airline on time performance over all routes operated by participating airlines (Jetstar, Macair, Qantas, QantasLink, Regional Express, Skywest Airlines and Virgin Blue) averaged 83.7 per cent in terms of on time departures and 82.2 per cent for on time arrivals. Cancellations averaged 1.2 per cent of all scheduled flights. The equivalent figures for the previous calendar year were 87.3 per cent for departures, 86.1 per cent for arrivals and 0.9 per cent for cancellations.
The long term average performance for all routes since reporting commenced in November 2003 is 86.5 per cent for departures and 85.4 per cent for arrivals. Cancellations averaged 0.9 per cent of all scheduled flights.
For the 2007 calendar year the highest level of on time departures was recorded in January at 89.6 per cent, while the highest level of on time arrivals was recorded in April at 88.7 per cent. The lowest percentage of cancellations was 0.7 per cent in January.
The lowest level of on time performance was recorded in December with 77.1 per cent of departures and 75.2 per cent of arrivals being on time. The highest percentage of cancellations was also recorded in December with 1.5 per cent of scheduled flights cancelled.
Of the major domestic airlines, Jetstar achieved the highest level of on time departures for 2007 at 84.1 per cent, while Qantas and Virgin Blue achieved 82.8 and 82.4 per cent respectively. QantasLink was the best performing regional airline with 85.7 per cent departures on time, followed by Regional Express (84.8 per cent), Skywest (82.8 per cent) and Macair (80.8 per cent).
Skywest recorded the highest percentage of cancellations for the year at 2.5 per cent, followed closely by Macair at 2.3 per cent. Jetstar recorded the lowest level of cancellations at 0.6 per cent.
The Canberra–Adelaide route had the highest percentage of on time departures (90.5 per cent) out of the 46 routes which meet the criteria for on time performance reporting. Conversely, the Perth–Brisbane route had the lowest percentage of on time departures (63.9 per cent). On time arrivals were also highest on the Canberra–Adelaide route (90.7 per cent), and were lowest on the Sydney–Albury route (69.6 per cent). Cancellations were highest on the Melbourne–Sydney route (3.5 per cent).
Canberra Airport recorded the highest percentage of on time departures (88.6 per cent), while Broome Airport recorded the lowest percentage (72.2 per cent). On time arrivals were also highest at Canberra Airport (85.9 per cent) and lowest at Albury Airport (69.6 per cent).

BITRE – Aviation Statistics OTP 55
2
On time performance – total industry for the 2007 calendar year Sectors On Time Cancellations On Time (%) Cancellations
Scheduled Flown Departures Arrivals Departures Arrivals (%)Jetstar 51 979 51 650 43 461 42 776 329 84.1 82.8 0.6Macair 14 258 13 923 11 246 11 200 335 80.8 80.4 2.3Qantas 121 133 119 479 98 921 99 531 1 654 82.8 83.3 1.4QantasLink 99 568 98 705 84 624 82 864 863 85.7 84.0 0.9Regional Express 67 587 67 034 56 846 53 686 553 84.8 80.1 0.8Skywest 12 787 12 461 10 313 10 025 326 82.8 80.5 2.5Virgin Blue 112 363 110 869 91 396 89 812 1,494 82.4 81.0 1.3All Airlines 479 675 474 121 396 807 389 894 5 554 83.7 82.2 1.2
Top ten routes for on time performance for the 2007 calendar year (participating airlines only)
Departures ArrivalsRoute On Time (%) Route On Time (%)Canberra-Adelaide 90.5 Canberra-Adelaide 90.7Sydney-Townsville 89.9 Sydney-Townsville 87.3Sydney-Maroochydore 89.3 Sydney-Maroochydore 84.9Cairns-Brisbane 89.2 Cairns-Brisbane 88.8Canberra-Melbourne 88.4 Canberra-Melbourne 85.8Canberra-Brisbane 88.3 Canberra-Brisbane 85.8Adelaide-Melbourne 87.9 Adelaide-Melbourne 87.6Mackay-Brisbane 87.9 Mackay-Brisbane 86.3Hobart-Sydney 87.8 Hobart-Sydney 86.9Adelaide-Sydney 87.3 Adelaide-Sydney 88.1
Top ten airports for on time performance for the 2007 calendar year (participating airlines and reported routes only)
Departures ArrivalsAirport On Time (%) Airport On Time (%)Canberra 88.6 Canberra 85.9Mackay 87.9 Rockhampton 85.1Adelaide 87.0 Townsville 84.9Rockhampton 86.6 Adelaide 84.9Townsville 86.5 Maroochydore 83.9Mildura 85.7 Kalgoorlie 83.7Hobart 85.1 Hamilton Island 83.4Coffs Harbour 85.0 Newcastle 83.3Cairns 85.0 Brisbane 83.2Brisbane 84.1 Mackay 82.7
Industry Performance
3
On Time Departures – Total Industry
70%
75%
80%
85%
90%
95%
Jan-
07
Feb-
07
Mar-07
Apr-07
May-07
Jun-
07
Jul-0
7
Aug-07
Sep-
07
Oct-07
Nov-07
Dec-07
Month
Dep
artu
res
On
Tim
eAll Airlines Qantas QantasLinkRegional Express Skywest Virgin BlueJetstar Macair
On Time Arrivals – Total Industry
70%
75%
80%
85%
90%
95%
Jan-
07
Feb-
07
Mar-07
Apr-07
May-07
Jun-
07
Jul-0
7
Aug-07
Sep-
07
Oct-07
Nov-07
Dec-07
Month
Arr
ival
s O
n Ti
me
All Airlines Qantas QantasLinkRegional Express Skywest Virgin BlueJetstar Macair
Cancellations – Total Industry
0.0%
0.5%
1.0%
1.5%
2.0%
2.5%
3.0%
3.5%
4.0%
4.5%
Jan-
07
Feb-
07
Mar-07
Apr-07
May-07
Jun-
07
Jul-0
7
Aug-07
Sep-
07
Oct-07
Nov-07
Dec-07
Month
Can
cella
tions
All Airlines QantasQantasLink Regional ExpressSkywest Virgin BlueJetstar Macair
SkywestJan-07 4.8% Mar-07 8.1%Apr-07 5.5% May-07 5.8%

BITRE – Aviation Statistics OTP 55
4

Individual Routes
5
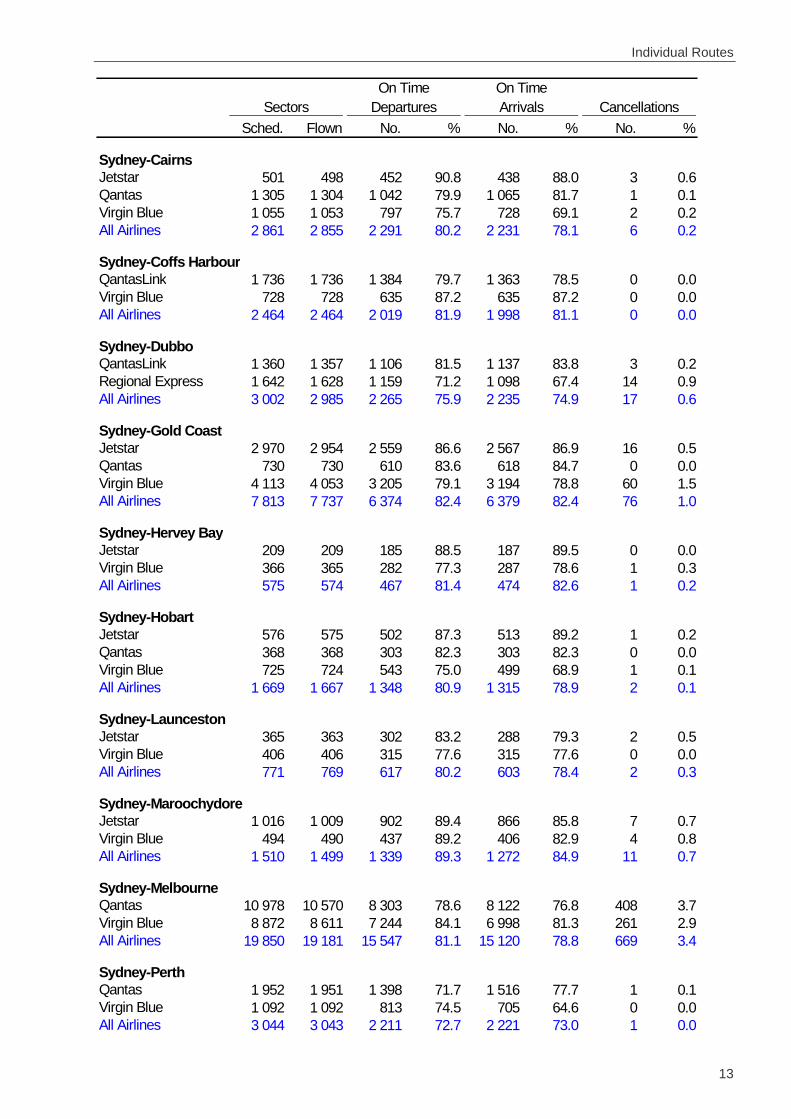
INDIVIDUAL ROUTES
On time performance is reported for all routes which are flown by two or more airlines where the passenger load averages over 8 000 passengers per month. There are currently 46 routes which meet this definition. However, over time, routes which meet this definition may change as airline networks and traffic levels vary.
Sched. Flown No. % No. % No. %
Adelaide-BrisbaneJetstar 365 361 303 83.9 309 85.6 4 1.1Qantas 1 048 1 048 927 88.5 929 88.6 0 0.0Virgin Blue 1 107 1 105 938 84.9 963 87.1 2 0.2All Airlines 2 520 2 514 2 168 86.2 2 201 87.5 6 0.2
Adelaide-CanberraQantas 543 543 489 90.1 491 90.4 0 0.0Virgin Blue 358 357 261 73.1 275 77.0 1 0.3All Airlines 901 900 750 83.3 766 85.1 1 0.1
Adelaide-Gold CoastJetstar 316 316 284 89.9 283 89.6 0 0.0Virgin Blue 365 364 279 76.6 270 74.2 1 0.3All Airlines 681 680 563 82.8 553 81.3 1 0.1
Adelaide-MelbourneQantas 4 083 4 033 3 529 87.5 3 551 88.0 50 1.2Virgin Blue 3 093 3 043 2 694 88.5 2 649 87.1 50 1.6All Airlines 7 176 7 076 6 223 87.9 6 200 87.6 100 1.4
Adelaide-PerthQantas 1 703 1 699 1 469 86.5 1 481 87.2 4 0.2Virgin Blue 449 449 390 86.9 384 85.5 0 0.0All Airlines 2 152 2 148 1 859 86.5 1 865 86.8 4 0.2
Adelaide-SydneyJetstar 524 521 493 94.6 476 91.4 3 0.6Qantas 3 765 3 725 3 282 88.1 3 278 88.0 40 1.1Virgin Blue 1 813 1 804 1 504 83.4 1 576 87.4 9 0.5All Airlines 6 102 6 050 5 279 87.3 5 330 88.1 52 0.9
Albury-SydneyQantasLink 1 354 1 354 1 096 80.9 1 098 81.1 0 0.0Regional Express 1 390 1 374 1 067 77.7 1 012 73.7 16 1.2All Airlines 2 744 2 728 2 163 79.3 2 110 77.3 16 0.6
Ballina-SydneyJetstar 370 370 315 85.1 305 82.4 0 0.0Regional Express 1 224 1 206 921 76.4 814 67.5 18 1.5Virgin Blue 438 427 348 81.5 334 78.2 11 2.5All Airlines 2 032 2 003 1 584 79.1 1 453 72.5 29 1.4
Sectors ArrivalsOn Time On Time
CancellationsDepartures

BITRE – Aviation Statistics OTP 55
6
Sched. Flown No. % No. % No. %
Brisbane-AdelaideJetstar 365 361 331 91.7 317 87.8 4 1.1Qantas 1 047 1 047 866 82.7 932 89.0 0 0.0Virgin Blue 1 109 1 107 934 84.4 931 84.1 2 0.2All Airlines 2 521 2 515 2 131 84.7 2 180 86.7 6 0.2
Brisbane-CairnsJetstar 1 066 1 062 793 74.7 824 77.6 4 0.4Qantas 1 463 1 462 1 245 85.2 1 306 89.3 1 0.1Virgin Blue 1 534 1 530 1 312 85.8 1 296 84.7 4 0.3All Airlines 4 063 4 054 3 350 82.6 3 426 84.5 9 0.2
Brisbane-CanberraQantas 1 450 1 445 1 220 84.4 1 283 88.8 5 0.3QantasLink 364 357 324 90.8 327 91.6 7 1.9Virgin Blue 1 162 1 153 996 86.4 996 86.4 9 0.8All Airlines 2 976 2 955 2 540 86.0 2 606 88.2 21 0.7
Brisbane-DarwinJetstar 313 313 270 86.3 269 85.9 0 0.0Qantas 367 367 317 86.4 300 81.7 0 0.0Virgin Blue 365 365 276 75.6 272 74.5 0 0.0All Airlines 1 045 1 045 863 82.6 841 80.5 0 0.0
Brisbane-Hamilton IslandJetstar 364 360 315 87.5 319 88.6 4 1.1Virgin Blue 366 365 316 86.6 286 78.4 1 0.3All Airlines 730 725 631 87.0 605 83.4 5 0.7
Brisbane-HobartJetstar 156 156 124 79.5 116 74.4 0 0.0Virgin Blue 417 417 355 85.1 337 80.8 0 0.0All Airlines 573 573 479 83.6 453 79.1 0 0.0
Brisbane-MackayJetstar 1 094 1 091 937 85.9 934 85.6 3 0.3QantasLink 693 689 593 86.1 592 85.9 4 0.6Virgin Blue 1 122 1 121 907 80.9 874 78.0 1 0.1All Airlines 2 909 2 901 2 437 84.0 2 400 82.7 8 0.3
Brisbane-MelbourneQantas 5 396 5 355 4 549 84.9 4 720 88.1 41 0.8Virgin Blue 3 648 3 614 2 983 82.5 2 974 82.3 34 0.9All Airlines 9 044 8 969 7 532 84.0 7 694 85.8 75 0.8
Brisbane-NewcastleJetstar 1 089 1 088 909 83.5 928 85.3 1 0.1QantasLink 610 601 512 85.2 483 80.4 9 1.5Virgin Blue 586 583 484 83.0 477 81.8 3 0.5All Airlines 2 285 2 272 1 905 83.8 1 888 83.1 13 0.6
Brisbane-PerthQantas 1 347 1 347 1 031 76.5 1 054 78.2 0 0.0Virgin Blue 365 365 269 73.7 268 73.4 0 0.0All Airlines 1 712 1 712 1 300 75.9 1 322 77.2 0 0.0
CancellationsSectorsOn Time
Departures ArrivalsOn Time

Individual Routes
7
Sched. Flown No. % No. % No. %
Brisbane-ProserpineJetstar 365 362 279 77.1 275 76.0 3 0.8Virgin Blue 365 363 307 84.6 292 80.4 2 0.5All Airlines 730 725 586 80.8 567 78.2 5 0.7
Brisbane-RockhamptonJetstar 365 365 315 86.3 314 86.0 0 0.0QantasLink 2 564 2 544 2 256 88.7 2 260 88.8 20 0.8Virgin Blue 1 095 1 094 853 78.0 833 76.1 1 0.1All Airlines 4 024 4 003 3 424 85.5 3 407 85.1 21 0.5
Brisbane-SydneyQantas 7 927 7 757 6 515 84.0 6 313 81.4 170 2.1Virgin Blue 6 590 6 394 5 481 85.7 5 225 81.7 196 3.0All Airlines 14 517 14 151 11 996 84.8 11 538 81.5 366 2.5
Brisbane-TownsvilleJetstar 365 364 293 80.5 304 83.5 1 0.3Qantas 1 679 1 676 1 424 85.0 1 440 85.9 3 0.2Virgin Blue 1 185 1 184 994 84.0 978 82.6 1 0.1All Airlines 3 229 3 224 2 711 84.1 2 722 84.4 5 0.2
Broome-PerthQantas 385 385 275 71.4 283 73.5 0 0.0QantasLink 325 322 270 83.9 275 85.4 3 0.9Skywest 422 411 305 74.2 275 66.9 11 2.6Virgin Blue 257 256 142 55.5 154 60.2 1 0.4All Airlines 1 389 1 374 992 72.2 987 71.8 15 1.1
Cairns-BrisbaneJetstar 1 071 1 067 921 86.3 876 82.1 4 0.4Qantas 1 464 1 461 1 358 93.0 1 386 94.9 3 0.2Virgin Blue 1 533 1 530 1 341 87.6 1 340 87.6 3 0.2All Airlines 4 068 4 058 3 620 89.2 3 602 88.8 10 0.2
Cairns-MelbourneJetstar 410 405 360 88.9 344 84.9 5 1.2Qantas 365 365 252 69.0 297 81.4 0 0.0Virgin Blue 747 743 583 78.5 594 79.9 4 0.5All Airlines 1 522 1 513 1 195 79.0 1 235 81.6 9 0.6
Cairns-SydneyJetstar 499 495 425 85.9 405 81.8 4 0.8Qantas 1 305 1 304 1 089 83.5 1 154 88.5 1 0.1Virgin Blue 1 054 1 052 826 78.5 854 81.2 2 0.2All Airlines 2 858 2 851 2 340 82.1 2 413 84.6 7 0.2
Canberra-AdelaideQantas 590 590 543 92.0 548 92.9 0 0.0Virgin Blue 356 356 313 87.9 310 87.1 0 0.0All Airlines 946 946 856 90.5 858 90.7 0 0.0
On Time On TimeSectors Departures Arrivals Cancellations

BITRE – Aviation Statistics OTP 55
8
Sched. Flown No. % No. % No. %
Canberra-BrisbaneQantas 1 449 1 445 1 300 90.0 1 254 86.8 4 0.3QantasLink 364 357 298 83.5 290 81.2 7 1.9Virgin Blue 1 163 1 153 1 011 87.7 992 86.0 10 0.9All Airlines 2 976 2 955 2 609 88.3 2 536 85.8 21 0.7
Canberra-MelbourneQantas 2 572 2 554 2 249 88.1 2 193 85.9 18 0.7QantasLink 1 214 1 197 1 058 88.4 1 013 84.6 17 1.4Virgin Blue 1 520 1 513 1 345 88.9 1 311 86.6 7 0.5All Airlines 5 306 5 264 4 652 88.4 4 517 85.8 42 0.8
Coffs Harbour-SydneyQantasLink 1 736 1 735 1 450 83.6 1 363 78.6 1 0.1Virgin Blue 728 725 642 88.6 631 87.0 3 0.4All Airlines 2 464 2 460 2 092 85.0 1 994 81.1 4 0.2
Darwin-BrisbaneJetstar 313 312 255 81.7 240 76.9 1 0.3Qantas 367 367 278 75.7 304 82.8 0 0.0Virgin Blue 365 365 286 78.4 309 84.7 0 0.0All Airlines 1 045 1 044 819 78.4 853 81.7 1 0.1
Darwin-MelbourneJetstar 318 317 275 86.8 281 88.6 1 0.3Virgin Blue 140 138 112 81.2 104 75.4 2 1.4All Airlines 458 455 387 85.1 385 84.6 3 0.7
Dubbo-SydneyQantasLink 1 360 1 357 1 178 86.8 1 117 82.3 3 0.2Regional Express 1 641 1 624 1 256 77.3 1 257 77.4 17 1.0All Airlines 3 001 2 981 2 434 81.7 2 374 79.6 20 0.7
Gold Coast-AdelaideJetstar 316 316 275 87.0 280 88.6 0 0.0Virgin Blue 365 362 216 59.7 273 75.4 3 0.8All Airlines 681 678 491 72.4 553 81.6 3 0.4
Gold Coast-MelbourneJetstar 2 010 2 009 1 565 77.9 1 561 77.7 1 0.0Virgin Blue 2 352 2 312 1 820 78.7 1 842 79.7 40 1.7All Airlines 4 362 4 321 3 385 78.3 3 403 78.8 41 0.9
Gold Coast-SydneyJetstar 2 963 2 955 2 547 86.2 2 476 83.8 8 0.3Qantas 730 729 626 85.9 640 87.8 1 0.1Virgin Blue 4 115 4 052 3 210 79.2 3 307 81.6 63 1.5All Airlines 7 808 7 736 6 383 82.5 6 423 83.0 72 0.9
Hamilton Island-BrisbaneJetstar 364 359 299 83.3 291 81.1 5 1.4Virgin Blue 366 364 291 79.9 306 84.1 2 0.5All Airlines 730 723 590 81.6 597 82.6 7 1.0
On Time On TimeSectors Departures Arrivals Cancellations

Individual Routes
9
Sched. Flown No. % No. % No. %
Hervey Bay-SydneyJetstar 209 207 181 87.4 184 88.9 2 1.0Virgin Blue 366 364 298 81.9 293 80.5 2 0.5All Airlines 575 571 479 83.9 477 83.5 4 0.7
Hobart-BrisbaneJetstar 156 156 105 67.3 110 70.5 0 0.0Virgin Blue 416 416 301 72.4 310 74.5 0 0.0All Airlines 572 572 406 71.0 420 73.4 0 0.0
Hobart-MelbourneJetstar 1 462 1 460 1 290 88.4 1 236 84.7 2 0.1Qantas 732 731 632 86.5 615 84.1 1 0.1Virgin Blue 1 497 1 494 1 248 83.5 1 207 80.8 3 0.2All Airlines 3 691 3 685 3 170 86.0 3 058 83.0 6 0.2
Hobart-SydneyJetstar 576 572 511 89.3 500 87.4 4 0.7Qantas 368 368 285 77.4 296 80.4 0 0.0Virgin Blue 725 723 664 91.8 649 89.8 2 0.3All Airlines 1 669 1 663 1 460 87.8 1 445 86.9 6 0.4
Kalgoorlie-PerthQantas 570 566 451 79.7 467 82.5 4 0.7QantasLink 330 330 270 81.8 288 87.3 0 0.0Skywest 494 452 371 82.1 354 78.3 42 8.5All Airlines 1 394 1 348 1 092 81.0 1 109 82.3 46 3.3
Launceston-MelbourneJetstar 1 098 1 095 813 74.2 824 75.3 3 0.3QantasLink 764 762 700 91.9 598 78.5 2 0.3Virgin Blue 1 494 1 485 1 250 84.2 1 260 84.8 9 0.6All Airlines 3 356 3 342 2 763 82.7 2 682 80.3 14 0.4
Launceston-SydneyJetstar 367 364 280 76.9 304 83.5 3 0.8Virgin Blue 406 406 296 72.9 317 78.1 0 0.0All Airlines 773 770 576 74.8 621 80.6 3 0.4
Mackay-BrisbaneJetstar 1 094 1 090 917 84.1 885 81.2 4 0.4QantasLink 724 719 665 92.5 647 90.0 5 0.7Virgin Blue 1 122 1 120 992 88.6 997 89.0 2 0.2All Airlines 2 940 2 929 2 574 87.9 2 529 86.3 11 0.4
Maroochydore-MelbourneJetstar 681 673 510 75.8 507 75.3 8 1.2Virgin Blue 732 713 549 77.0 584 81.9 19 2.6All Airlines 1 413 1 386 1 059 76.4 1 091 78.7 27 1.9
Maroochydore-SydneyJetstar 1 014 999 837 83.8 812 81.3 15 1.5Virgin Blue 494 488 379 77.7 384 78.7 6 1.2All Airlines 1 508 1 487 1 216 81.8 1 196 80.4 21 1.4
On Time On TimeSectors Departures Arrivals Cancellations

BITRE – Aviation Statistics OTP 55
10
Sched. Flown No. % No. % No. %
Melbourne-AdelaideQantas 4 349 4 276 3 628 84.8 3 652 85.4 73 1.7Virgin Blue 3 091 3 046 2 537 83.3 2 513 82.5 45 1.5All Airlines 7 440 7 322 6 165 84.2 6 165 84.2 118 1.6
Melbourne-BrisbaneQantas 5 354 5 322 4 448 83.6 4 407 82.8 32 0.6Virgin Blue 3 642 3 607 2 890 80.1 2 893 80.2 35 1.0All Airlines 8 996 8 929 7 338 82.2 7 300 81.8 67 0.7
Melbourne-CairnsJetstar 411 406 380 93.6 367 90.4 5 1.2Qantas 365 365 297 81.4 293 80.3 0 0.0Virgin Blue 747 744 565 75.9 543 73.0 3 0.4All Airlines 1 523 1 515 1 242 82.0 1 203 79.4 8 0.5
Melbourne-CanberraQantas 2 306 2 290 1 960 85.6 1 970 86.0 16 0.7QantasLink 1 211 1 193 1 032 86.5 1 012 84.8 18 1.5Virgin Blue 1 520 1 514 1 286 84.9 1 248 82.4 6 0.4All Airlines 5 037 4 997 4 278 85.6 4 230 84.7 40 0.8
Melbourne-DarwinJetstar 317 317 252 79.5 254 80.1 0 0.0Virgin Blue 141 138 111 80.4 117 84.8 3 2.1All Airlines 458 455 363 79.8 371 81.5 3 0.7
Melbourne-Gold CoastJetstar 2 020 2 019 1 692 83.8 1 665 82.5 1 0.0Virgin Blue 2 355 2 318 1 924 83.0 1 908 82.3 37 1.6All Airlines 4 375 4 337 3 616 83.4 3 573 82.4 38 0.9
Melbourne-HobartJetstar 1 462 1 459 1 272 87.2 1 256 86.1 3 0.2Qantas 732 731 542 74.1 529 72.4 1 0.1Virgin Blue 1 496 1 494 1 215 81.3 1 178 78.8 2 0.1All Airlines 3 690 3 684 3 029 82.2 2 963 80.4 6 0.2
Melbourne-LauncestonJetstar 1 100 1 096 847 77.3 818 74.6 4 0.4QantasLink 764 760 619 81.4 623 82.0 4 0.5Virgin Blue 1 494 1 487 1 177 79.2 1 152 77.5 7 0.5All Airlines 3 358 3 343 2 643 79.1 2 593 77.6 15 0.4
Melbourne-MaroochydoreJetstar 682 678 593 87.5 564 83.2 4 0.6Virgin Blue 733 720 577 80.1 594 82.5 13 1.8All Airlines 1 415 1 398 1 170 83.7 1 158 82.8 17 1.2
Melbourne-MilduraQantasLink 1 632 1 626 1 305 80.3 1 298 79.8 6 0.4Regional Express 1 304 1 298 1 159 89.3 1 092 84.1 6 0.5All Airlines 2 936 2 924 2 464 84.3 2 390 81.7 12 0.4
On Time On TimeSectors Departures Arrivals Cancellations

Individual Routes
11
Sched. Flown No. % No. % No. %
Melbourne-NewcastleJetstar 729 729 597 81.9 586 80.4 0 0.0QantasLink 912 909 794 87.3 769 84.6 3 0.3Virgin Blue 365 363 324 89.3 317 87.3 2 0.5All Airlines 2 006 2 001 1 715 85.7 1 672 83.6 5 0.2
Melbourne-PerthQantas 2 478 2 462 1 638 66.5 1 801 73.2 16 0.6Virgin Blue 1 429 1 427 1 242 87.0 1 148 80.4 2 0.1All Airlines 3 907 3 889 2 880 74.1 2 949 75.8 18 0.5
Melbourne-SydneyQantas 11 033 10 606 8 722 82.2 8 215 77.5 427 3.9Virgin Blue 8 867 8 606 7 138 82.9 6 838 79.5 261 2.9All Airlines 19 900 19 212 15 860 82.6 15 053 78.4 688 3.5
Mildura-MelbourneQantasLink 1 633 1 616 1 332 82.4 1 318 81.6 17 1.0Regional Express 1 305 1 300 1 168 89.8 1 136 87.4 5 0.4All Airlines 2 938 2 916 2 500 85.7 2 454 84.2 22 0.7
Newcastle-BrisbaneJetstar 1 088 1 087 836 76.9 785 72.2 1 0.1QantasLink 612 605 531 87.8 508 84.0 7 1.1Virgin Blue 586 580 484 83.4 481 82.9 6 1.0All Airlines 2 286 2 272 1 851 81.5 1 774 78.1 14 0.6
Newcastle-MelbourneJetstar 728 728 575 79.0 587 80.6 0 0.0QantasLink 907 903 779 86.3 745 82.5 4 0.4Virgin Blue 365 363 294 81.0 273 75.2 2 0.5All Airlines 2 000 1 994 1 648 82.6 1 605 80.5 6 0.3
Perth-AdelaideQantas 1 703 1 692 1 445 85.4 1 469 86.8 11 0.6Virgin Blue 449 449 382 85.1 390 86.9 0 0.0All Airlines 2 152 2 141 1 827 85.3 1 859 86.8 11 0.5
Perth-BrisbaneQantas 1 345 1 343 855 63.7 975 72.6 2 0.1Virgin Blue 365 365 236 64.7 243 66.6 0 0.0All Airlines 1 710 1 708 1 091 63.9 1 218 71.3 2 0.1
Perth-BroomeQantas 385 385 292 75.8 313 81.3 0 0.0QantasLink 323 321 249 77.6 245 76.3 2 0.6Skywest 421 414 331 80.0 322 77.8 7 1.7Virgin Blue 257 256 138 53.9 146 57.0 1 0.4All Airlines 1 386 1 376 1 010 73.4 1 026 74.6 10 0.7
Perth-KalgoorlieQantas 569 567 494 87.1 483 85.2 2 0.4QantasLink 330 330 268 81.2 276 83.6 0 0.0Skywest 495 451 369 81.8 369 81.8 44 8.9All Airlines 1 394 1 348 1 131 83.9 1 128 83.7 46 3.3
On Time On TimeSectors Departures Arrivals Cancellations

BITRE – Aviation Statistics OTP 55
12
Sched. Flown No. % No. % No. %
Perth-MelbourneQantas 2 477 2 456 1 743 71.0 1 729 70.4 21 0.8Virgin Blue 1 429 1 426 1 208 84.7 1 133 79.5 3 0.2All Airlines 3 906 3 882 2 951 76.0 2 862 73.7 24 0.6
Perth-Port HedlandQantasLink 981 977 773 79.1 818 83.7 4 0.4Skywest 77 77 52 67.5 51 66.2 0 0.0All Airlines 1 058 1 054 825 78.3 869 82.4 4 0.4
Perth-SydneyQantas 1 951 1 945 1 425 73.3 1 447 74.4 6 0.3Virgin Blue 1 092 1 090 911 83.6 851 78.1 2 0.2All Airlines 3 043 3 035 2 336 77.0 2 298 75.7 8 0.3
Port Hedland-PerthQantasLink 974 969 790 81.5 783 80.8 5 0.5Skywest 79 79 42 53.2 39 49.4 0 0.0All Airlines 1 053 1 048 832 79.4 822 78.4 5 0.5
Proserpine-BrisbaneJetstar 365 362 266 73.5 262 72.4 3 0.8Virgin Blue 365 362 288 79.6 299 82.6 3 0.8All Airlines 730 724 554 76.5 561 77.5 6 0.8
Rockhampton-BrisbaneJetstar 365 365 284 77.8 262 71.8 0 0.0QantasLink 2 015 1 999 1 784 89.2 1 783 89.2 16 0.8Virgin Blue 1 094 1 092 924 84.6 922 84.4 2 0.2All Airlines 3 474 3 456 2 992 86.6 2 967 85.9 18 0.5
Sydney-AdelaideJetstar 393 390 292 74.9 309 79.2 3 0.8Qantas 3 454 3 435 2 842 82.7 2 986 86.9 19 0.6Virgin Blue 1 813 1 804 1 455 80.7 1 417 78.5 9 0.5All Airlines 5 660 5 629 4 589 81.5 4 712 83.7 31 0.5
Sydney-AlburyQantasLink 1 356 1 356 1 001 73.8 950 70.1 0 0.0Regional Express 1 389 1 373 1 041 75.8 950 69.2 16 1.2All Airlines 2 745 2 729 2 042 74.8 1 900 69.6 16 0.6
Sydney-BallinaJetstar 372 372 330 88.7 322 86.6 0 0.0Regional Express 1 229 1 209 927 76.7 875 72.4 20 1.6Virgin Blue 437 431 360 83.5 358 83.1 6 1.4All Airlines 2 038 2 012 1 617 80.4 1 555 77.3 26 1.3
Sydney-BrisbaneQantas 7 974 7 808 6 463 82.8 6 677 85.5 166 2.1Virgin Blue 6 586 6 389 5 161 80.8 4 965 77.7 197 3.0All Airlines 14 560 14 197 11 624 81.9 11 642 82.0 363 2.5
On Time On TimeSectors Departures Arrivals Cancellations
Individual Routes
13
Sched. Flown No. % No. % No. %
Sydney-CairnsJetstar 501 498 452 90.8 438 88.0 3 0.6Qantas 1 305 1 304 1 042 79.9 1 065 81.7 1 0.1Virgin Blue 1 055 1 053 797 75.7 728 69.1 2 0.2All Airlines 2 861 2 855 2 291 80.2 2 231 78.1 6 0.2
Sydney-Coffs HarbourQantasLink 1 736 1 736 1 384 79.7 1 363 78.5 0 0.0Virgin Blue 728 728 635 87.2 635 87.2 0 0.0All Airlines 2 464 2 464 2 019 81.9 1 998 81.1 0 0.0
Sydney-DubboQantasLink 1 360 1 357 1 106 81.5 1 137 83.8 3 0.2Regional Express 1 642 1 628 1 159 71.2 1 098 67.4 14 0.9All Airlines 3 002 2 985 2 265 75.9 2 235 74.9 17 0.6
Sydney-Gold CoastJetstar 2 970 2 954 2 559 86.6 2 567 86.9 16 0.5Qantas 730 730 610 83.6 618 84.7 0 0.0Virgin Blue 4 113 4 053 3 205 79.1 3 194 78.8 60 1.5All Airlines 7 813 7 737 6 374 82.4 6 379 82.4 76 1.0
Sydney-Hervey BayJetstar 209 209 185 88.5 187 89.5 0 0.0Virgin Blue 366 365 282 77.3 287 78.6 1 0.3All Airlines 575 574 467 81.4 474 82.6 1 0.2
Sydney-HobartJetstar 576 575 502 87.3 513 89.2 1 0.2Qantas 368 368 303 82.3 303 82.3 0 0.0Virgin Blue 725 724 543 75.0 499 68.9 1 0.1All Airlines 1 669 1 667 1 348 80.9 1 315 78.9 2 0.1
Sydney-LauncestonJetstar 365 363 302 83.2 288 79.3 2 0.5Virgin Blue 406 406 315 77.6 315 77.6 0 0.0All Airlines 771 769 617 80.2 603 78.4 2 0.3
Sydney-MaroochydoreJetstar 1 016 1 009 902 89.4 866 85.8 7 0.7Virgin Blue 494 490 437 89.2 406 82.9 4 0.8All Airlines 1 510 1 499 1 339 89.3 1 272 84.9 11 0.7
Sydney-MelbourneQantas 10 978 10 570 8 303 78.6 8 122 76.8 408 3.7Virgin Blue 8 872 8 611 7 244 84.1 6 998 81.3 261 2.9All Airlines 19 850 19 181 15 547 81.1 15 120 78.8 669 3.4
Sydney-PerthQantas 1 952 1 951 1 398 71.7 1 516 77.7 1 0.1Virgin Blue 1 092 1 092 813 74.5 705 64.6 0 0.0All Airlines 3 044 3 043 2 211 72.7 2 221 73.0 1 0.0
Sectors Departures Arrivals CancellationsOn Time On Time

BITRE – Aviation Statistics OTP 55
14
Sched. Flown No. % No. % No. %
Sydney-TownsvilleJetstar 260 260 254 97.7 250 96.2 0 0.0Virgin Blue 365 364 307 84.3 295 81.0 1 0.3All Airlines 625 624 561 89.9 545 87.3 1 0.2
Sydney-Wagga WaggaQantasLink 1 361 1 361 1 018 74.8 982 72.2 0 0.0Regional Express 1 798 1 773 1 429 80.6 1 273 71.8 25 1.4All Airlines 3 159 3 134 2 447 78.1 2 255 72.0 25 0.8
Townsville-BrisbaneJetstar 365 364 284 78.0 286 78.6 1 0.3Qantas 1 679 1 674 1 481 88.5 1 493 89.2 5 0.3Virgin Blue 1 185 1 182 1 037 87.7 1 059 89.6 3 0.3All Airlines 3 229 3 220 2 802 87.0 2 838 88.1 9 0.3
Townsville-SydneyJetstar 261 261 241 92.3 238 91.2 0 0.0Virgin Blue 365 364 283 77.7 299 82.1 1 0.3All Airlines 626 625 524 83.8 537 85.9 1 0.2
Wagga Wagga-SydneyQantasLink 1 359 1 358 1 067 78.6 966 71.1 1 0.1Regional Express 1 803 1 777 1 425 80.2 1 370 77.1 26 1.4All Airlines 3 162 3 135 2 492 79.5 2 336 74.5 27 0.9
On Time On TimeSectors Departures Arrivals Cancellations

Airports
15
AIRPORTS
On time performance is reported for all routes where the passenger load averages over 8 000 passengers per month and where two or more airlines operate in competition. The following data reports by airport against flights operated on those routes only.
Sectors On Time Sectors On TimeFlown No. % Flown No. %
Adelaide AirportJetstar 1198 1080 90.2 1067 906 84.9Qantas 11 048 9 696 87.8 11 040 9 587 86.8Virgin Blue 7 122 6 066 85.2 7 124 5 834 81.9All Airlines 19 368 16 842 87.0 19 231 16 327 84.9Relates to services to and from Brisbane, Canberra, Gold Coast, Melbourne, Perth and Sydney.
Albury AirportQantasLink 1 354 1 096 80.9 1 356 950 70.1Regional Express 1 374 1 067 77.7 1 373 950 69.2All Airlines 2 728 2 163 79.3 2 729 1 900 69.6Relates to services to and from Sydney only.
Ballina AirportJetstar 370 315 85.1 372 322 86.6Regional Express 1206 921 76.4 1209 875 72.4Virgin Blue 427 348 81.5 431 358 83.1All Airlines 2 003 1 584 79.1 2 012 1 555 77.3Relates to services to and from Sydney only.
Brisbane AirportJetstar 5 522 4 566 82.7 5 523 4 306 78.0Qantas 20 456 17 167 83.9 20 468 17 425 85.1QantasLink 4 191 3 685 87.9 3 680 3 228 87.7Virgin Blue 19 655 16 467 83.8 19 630 16 079 81.9All Airlines 49 824 41 885 84.1 49 301 41 038 83.2Relates to services to and from Adelaide, Cairns, Canberra, Darwin, Hamilton Island, Hobart, Mackay, Melbourne, Newcastle, Perth, Proserpine, Rockhampton, Sydney and Townsville.
Broome AirportQantas 385 275 71.4 385 313 81.3QantasLink 322 270 83.9 321 245 76.3Skywest 411 305 74.2 414 322 77.8Virgin Blue 256 142 55.5 256 146 57.0All Airlines 1 374 992 72.2 1 376 1 026 74.6Relates to services to and from Perth only.
Cairns AirportJetstar 1 967 1 706 86.7 1 966 1 629 82.9Qantas 3 130 2 699 86.2 3 131 2 664 85.1Virgin Blue 3 325 2 750 82.7 3 327 2 567 77.2All Airlines 8 422 7 155 85.0 8 424 6 860 81.4Relates to services to and from Brisbane, Melbourne and Sydney.
Departures Arrivals

BITRE – Aviation Statistics OTP 55
16
Sectors On Time Sectors On TimeFlown No. % Flown No. %
Canberra AirportQantas 4 589 4 092 89.2 4 278 3 744 87.5QantasLink 1 554 1 356 87.3 1 550 1 339 86.4Virgin Blue 3 022 2 669 88.3 3 024 2 519 83.3All Airlines 9 165 8 117 88.6 8 852 7 602 85.9Relates to services to and from Adelaide, Brisbane and Melbourne.
Coffs Harbour AirportQantasLink 1 735 1 450 83.6 1 736 1 363 78.5Virgin Blue 725 642 88.6 728 635 87.2All Airlines 2 460 2 092 85.0 2 464 1 998 81.1Relates to services to and from Sydney only.
Darwin AirportJetstar 629 530 84.3 630 523 83.0Qantas 367 278 75.7 367 300 81.7Virgin Blue 503 398 79.1 503 389 77.3All Airlines 1 499 1 206 80.5 1 500 1 212 80.8Relates to services to and from Brisbane and Melbourne.
Dubbo AirportQantasLink 1 357 1 178 86.8 1 357 1 137 83.8Regional Express 1 624 1 256 77.3 1 628 1 098 67.4All Airlines 2 981 2 434 81.7 2 985 2 235 74.9Relates to services to and from Sydney only.
Gold Coast AirportJetstar 5 280 4 387 83.1 5 289 4 515 85.4Qantas 729 626 85.9 730 618 84.7Virgin Blue 6 726 5 246 78.0 6 735 5 372 79.8All Airlines 12 735 10 259 80.6 12 754 10 505 82.4Relates to services to and from Adelaide, Melbourne and Sydney.
Hamilton Island AirportJetstar 359 299 83.3 360 319 88.6Virgin Blue 364 291 79.9 365 286 78.4All Airlines 723 590 81.6 725 605 83.4Relates to services to and from Brisbane only.
Hervey Bay AirportJetstar 207 181 87.4 209 187 89.5Virgin Blue 364 298 81.9 365 287 78.6All Airlines 571 479 83.9 574 474 82.6Relates to services to and from Sydney only.
Hobart AirportJetstar 2 188 1 906 87.1 2 190 1 885 86.1Qantas 1 099 917 83.4 1 099 832 75.7Virgin Blue 2 633 2 213 84.0 2 635 2 014 76.4All Airlines 5 920 5 036 85.1 5 924 4 731 79.9Relates to services to and from Brisbane, Melbourne and Sydney.
Departures Arrivals

Airports
17
Sectors On Time Sectors On TimeFlown No. % Flown No. %
Kalgoorlie AirportQantas 566 451 79.7 567 483 85.2QantasLink 330 270 81.8 330 276 83.6Skywest 452 371 82.1 451 369 81.8All Airlines 1 348 1 092 81.0 1 348 1 128 83.7Relates to services to and from Perth only.
Launceston AirportJetstar 1 459 1 093 74.9 1 459 1 106 75.8QantasLink 762 700 91.9 760 623 82.0Virgin Blue 1 891 1 546 81.8 1 893 1 467 77.5All Airlines 4 112 3 339 81.2 4 112 3 196 77.7Relates to services to and from Melbourne and Sydney.
Mackay AirportJetstar 1 090 917 84.1 1 091 934 85.6QantasLink 719 665 92.5 689 592 85.9Virgin Blue 1 120 992 88.6 1 121 874 78.0All Airlines 2 929 2 574 87.9 2 901 2 400 82.7Relates to services to and from Brisbane only.
Maroochydore AirportJetstar 1 672 1 347 80.6 1 687 1 430 84.8Virgin Blue 1 201 928 77.3 1 210 1 000 82.6All Airlines 2 873 2 275 79.2 2 897 2 430 83.9Relates to services to and from Melbourne and Sydney.
Melbourne AirportJetstar 6 704 5 633 84.0 6 687 5 340 79.9Qantas 26 052 21 235 81.5 26 064 21 227 81.4QantasLink 4 488 3 750 83.6 4 478 3 674 82.0Regional Express 1 298 1 159 89.3 1 300 1 136 87.4Virgin Blue 25 464 20 986 82.4 25 455 20 929 82.2All Airlines 64 006 52 763 82.4 63 984 52 306 81.7Relates to services to and from Adelaide, Brisbane, Cairns, Canberra, Darwin, Gold Coast, Hobart, Launceston, Maroochydore, Mildura, Newcastle, Perth and Sydney.
Mildura AirportQantasLink 1 616 1 332 82.4 1 626 1 298 79.8Regional Express 1 300 1 168 89.8 1 298 1 092 84.1All Airlines 2 916 2 500 85.7 2 924 2 390 81.7Relates to services to and from Melbourne only.
Newcastle AirportJetstar 1 815 1 411 77.7 1 817 1 514 83.3QantasLink 1 508 1 310 86.9 1 510 1 252 82.9Virgin Blue 943 778 82.5 946 794 83.9All Airlines 4 266 3 499 82.0 4 273 3 560 83.3Relates to services to and from Brisbane and Melbourne.
Departures Arrivals

BITRE – Aviation Statistics OTP 55
18
Sectors On Time Sectors On TimeFlown No. % Flown No. %
Perth AirportQantas 8 388 6 254 74.6 8 410 6 602 78.5QantasLink 1 628 1 290 79.2 1 621 1 346 83.0Skywest 942 752 79.8 942 668 70.9Virgin Blue 3 586 2 875 80.2 3 589 2 659 74.1All Airlines 14 544 11 171 76.8 14 562 11 275 77.4Relates to services to and from Adelaide, Brisbane, Broome, Kalgoorlie, Melbourne, Port Hedland and Sydney.
Port Hedland AirportQantasLink 969 790 81.5 977 818 83.7Skywest 79 42 53.2 77 51 66.2All Airlines 1 048 832 79.4 1 054 869 82.4Relates to services to and from Perth only.
Proserpine AirportJetstar 362 266 73.5 362 275 76.0Virgin Blue 362 288 79.6 363 292 80.4All Airlines 724 554 76.5 725 567 78.2Relates to services to and from Brisbane only.
Rockhampton AirportJetstar 365 284 77.8 365 314 86.0QantasLink 1 999 1 784 89.2 2 544 2 260 88.8Virgin Blue 1 092 924 84.6 1 094 833 76.1All Airlines 3 456 2 992 86.6 4 003 3 407 85.1Relates to services to and from Brisbane only.
Sydney AirportJetstar 6 630 5 778 87.1 6 744 5 700 84.5Qantas 26 166 20 961 80.1 26 434 21 343 80.7QantasLink 5 810 4 509 77.6 5 804 4 544 78.3Regional Express 5 983 4 556 76.1 5 981 4 453 74.5Virgin Blue 26 510 21 554 81.3 26 495 21 558 81.4All Airlines 71 099 57 358 80.7 71 458 57 598 80.6Relates to services to and from Adelaide, Albury, Ballina, Brisbane, Cairns, Coffs Harbour, Dubbo, Gold Coast,Hervey Bay, Hobart, Launceston, Maroochydore, Melbourne, Perth, Townsville and Wagga Wagga.
Townsville AirportJetstar 625 525 84.0 624 554 88.8Qantas 1 674 1 481 88.5 1 676 1 440 85.9Virgin Blue 1 546 1 320 85.4 1 548 1 273 82.2All Airlines 3 845 3 326 86.5 3 848 3 267 84.9Relates to services to and from Brisbane and Sydney.
Wagga Wagga AirportQantasLink 1 358 1 067 78.6 1 361 982 72.2Regional Express 1 777 1 425 80.2 1 773 1 273 71.8All Airlines 3 135 2 492 79.5 3 134 2 255 72.0Relates to services to and from Sydney only.
Departures Arrivals

Definitions
19
DEFINITIONS
On time departure A flight departure is counted as "on time" if it departs the gate within 15 minutes of the scheduled departure time shown in the carriers' schedule.
On time arrival A flight arrival is counted as "on time" if it arrived at the gate within 15 minutes of the scheduled arrival time shown in the carriers' schedule. Neither diverted nor cancelled flights count as on time.
Cancellation A flight is regarded as a cancellation if it is cancelled or rescheduled less than 7 days prior to its scheduled departure time.
On time departure percentage
The percentage of on time departures is measured against the number of departures operated on any particular sector.
On time arrival percentage
The percentage of on time arrivals is measured against the number of arrivals operated on any particular sector.
Cancellation percentage The percentage of cancellations is measured against the number of services scheduled on any particular sector.