aviation - aafc321sqn.aafc.org.au/sites/default/files/aviationadvanced.pdfstate the standard...
TRANSCRIPT
AVIATION ADVANCED
Australian Air Force Cadets
Cadet / Instructor Notes
Rewrite Edition, April 2007
AVIATION ADVANCED (AVA) (9 PERIODS)
Serial Inst/Stud Title & Objective Attain Periods No Ratio level AVA 1 1/20 Aero Engine, Systems and Instruments B 2
a. Revise AVP 3 b. Outline the basic operation of the following aircraft systems:
(1) Ignition (2) Carburetion (3) Fuel (4) Oil (5) Vacuum (6) Cooling, and (7) Electrical
c. Outline the basic operation of the following aircraft instruments: (1) Pressure (2) Gyroscopic, and (3) Flight.
AVA 2 1/20 Aircraft Operation and Performance C 1
a. Outline the following airframe limitations: (1) Weight (2) Speed (3) Flying in turbulence (4) Velocity - load factor (or Vn) diagram
b. Outline aircraft take-off and landing performances. c. Outline the concepts of:
(1) Aircraft weight and weight terminology (MTOW, MLW, Gross Weight) (2) Aircraft balance (3) Moment of force (4) Balancing a loaded aircraft
AVA 3 1/20 Navigation B 2
a. State the purpose for each of the following maps, charts and publications used for aerial navigation:
(1) WAC/ONC (2) VTC/ERC (3) ERSA/FLIP
b. Explain the symbols and scales used in charts for aerial navigation B c. Demonstrate the use of each chart 2 d. Explain and demonstrate the use of the information in each section. B 2
AVA 4 1/20 Meteorology B 2
a. Identify and classify cloud types. Classifications required are: (1) High, medium, low (2) Cumuliform, stratiform. (3) Examples of “type” are Cu, Ci etc
b. State the standard abbreviation for each cloud type and the method used to report cloud amount.
c. Describe the weather associated with each cloud type. d. Given a diagram, identify the following basic features on a weather map:
(1) High (2) Low (3) Trough (4) Ridge (5) Cold front (6) Warm front (7) Tropical cyclone
AVA 5 1/20 Examination 1 AVA 6 1/20 Examination Review 1
AVIATION ADVANCED (AVA) AVA 1 - AERO ENGINES, SYSTEMS & INSTRUMENTS
2 PERIODS
Objective
1001.
a. Revise AVP3
b. Outline the basic operation of the following aircraft systems:
1. Ignition
2. Carburetion
3. Fuel
4. Oil
5. Vacuum
6. Cooling
7. Electrical
c. Outline the basic operation of the following instrumentation s:
1. Pressure
2. Gyroscopic
3. Flight
Revision of AVP3
1002. State the basic principles of the operation and, with the aid of a diagram or model, identify the basic components of:
a. a four stroke cycle internal combustion engine;
b. basic turbo jet engine.
Four stroke piston aircraft engine
1003. This has a cycle of four operations:
1. induction;
2. compression;
3. expansion (or ignition)
4. exhaust.

Figure above shows the operation of the piston and inlet/exhaust valves during the four stroke cycle.
1004. It can be seen that the inlet valve opens on the induction - down stroke, to allow a mixture of fuel and air into the cylinder chamber.
1005. Both valves remain closed during the compression stroke and the rising piston compresses the mixture into the small enclosed space above the piston, known as the combustion chamber.
1006. When the piston reaches the end of the compression stroke, the mixture is ignited by an electrical spark, the heat so generated rapidly expanding the mixture and forcing the piston down, thus turning the crankshaft.
1007. The inlet/exhaust valves are both closed throughout the compression and power strokes.
1008. At the beginning of the final up stroke of the cycle, the exhaust valve is opened and the burnt gases are released to the atmosphere. Complete sweeping of the cylinder by the piston during its upward travel cleans the cylinder of the burnt gases ready for the new charge of the next cycle. The inlet valve remains closed during the exhaust stroke.
The Jet Engine
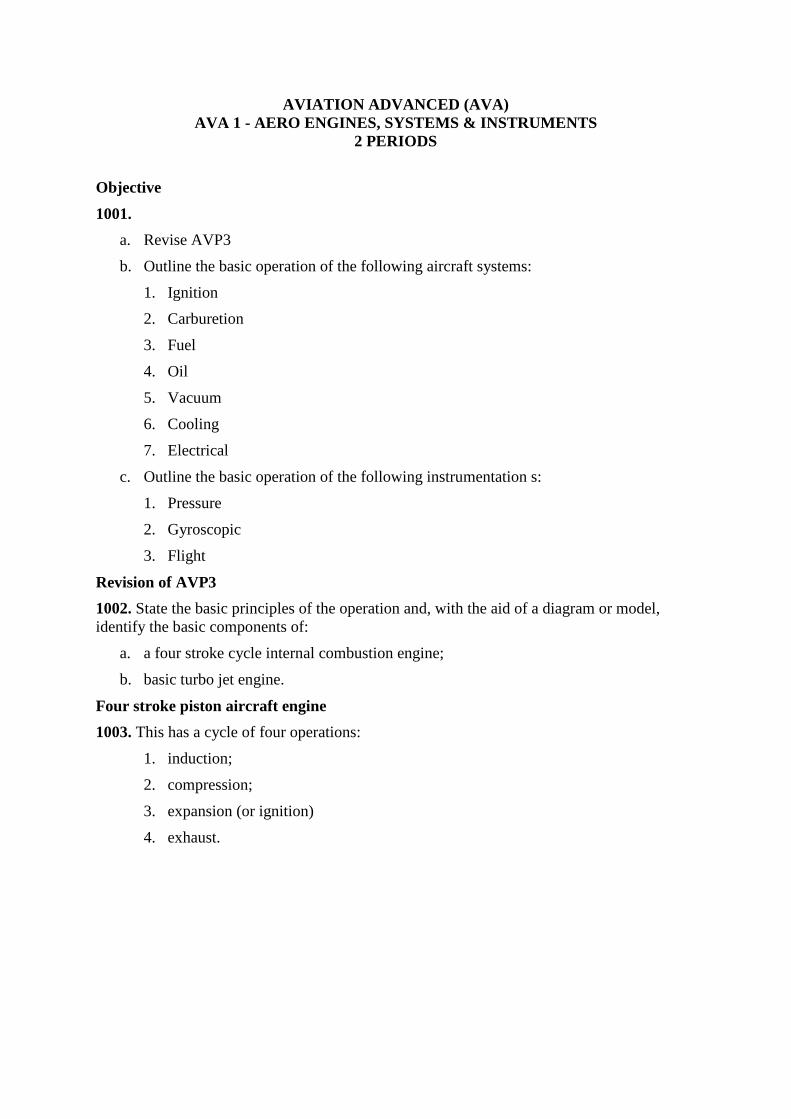
1009. The sequence of induction, compression, expansion and exhaust can be applied to the turbojet engine. Note that all these processes are occurring continuously in the engine, and the delivery is uninterrupted, unlike that of the piston engine. Figure above shows the various sections of a turbojet parts less stressed than in the piston engine.
1011. The incoming air is squeezed through the front fan (compressor) into the compression chamber to which is added the fuel and ignited. The gases expand and flow out the rear of the engine. To maintain the movement of the compressor another fan (rear turbine) is located at the rear and connected to the compressor by a shaft. The fan is turned by the hot gases passing through at a very high velocity. After passing through the turbine, the heated gases, still expanding, issue from the exhaust nozzle as a jet.
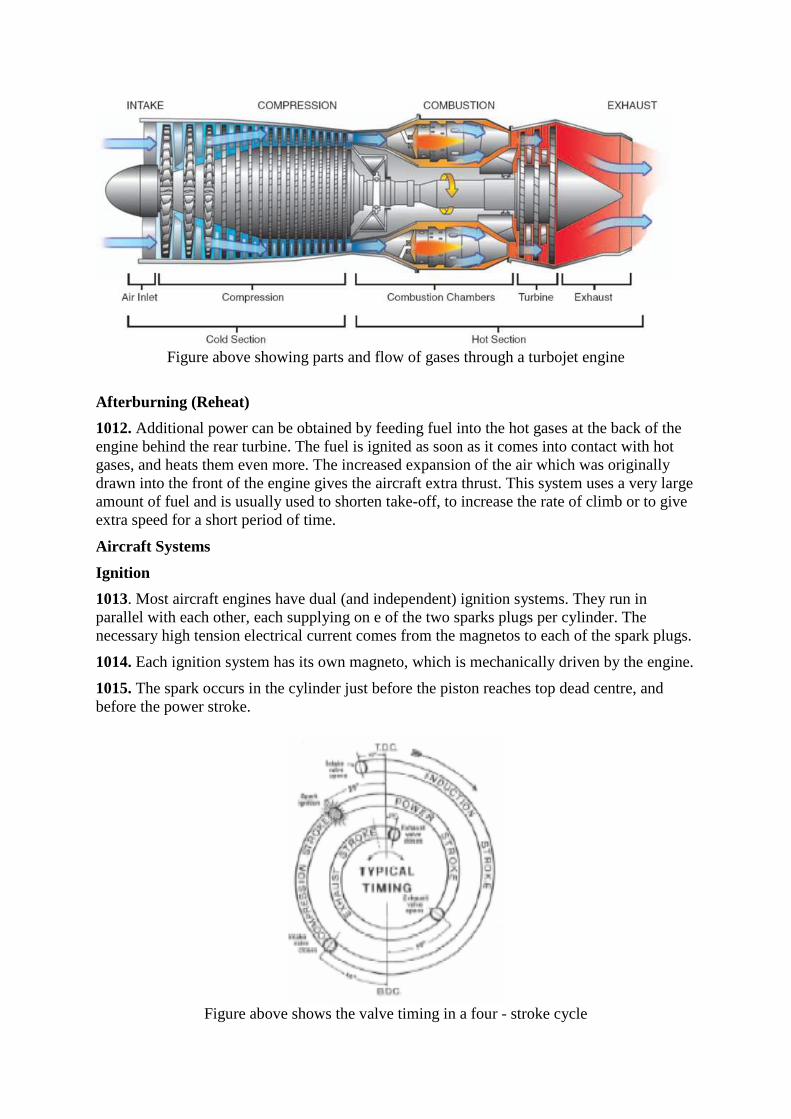
Figure above showing parts and flow of gases through a turbojet engine
Afterburning (Reheat)
1012. Additional power can be obtained by feeding fuel into the hot gases at the back of the engine behind the rear turbine. The fuel is ignited as soon as it comes into contact with hot gases, and heats them even more. The increased expansion of the air which was originally drawn into the front of the engine gives the aircraft extra thrust. This system uses a very large amount of fuel and is usually used to shorten take-off, to increase the rate of climb or to give extra speed for a short period of time.
Aircraft Systems
Ignition
1013. Most aircraft engines have dual (and independent) ignition systems. They run in parallel with each other, each supplying on e of the two sparks plugs per cylinder. The necessary high tension electrical current comes from the magnetos to each of the spark plugs.
1014. Each ignition system has its own magneto, which is mechanically driven by the engine.
1015. The spark occurs in the cylinder just before the piston reaches top dead centre, and before the power stroke.
Figure above shows the valve timing in a four - stroke cycle
1016. The timing of the spark is critical, and is advanced to ensure a flame front starts moving through the compressed fuel/air mixture prior to the down stroke (power).
1017. To ensure each spark is timed correctly, the magneto has breaker points which are forced to open and shut by a small rotating cam. The spark, or current, is then sent to each spark plug by the distributor.
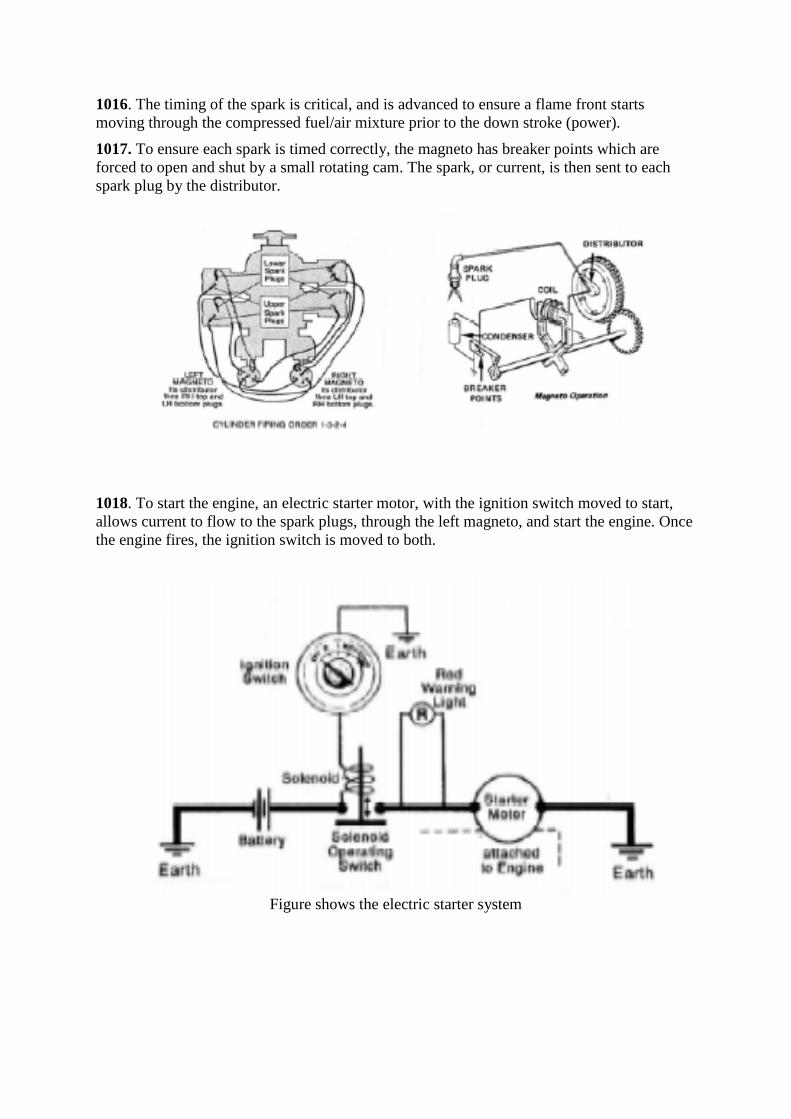
1018. To start the engine, an electric starter motor, with the ignition switch moved to start, allows current to flow to the spark plugs, through the left magneto, and start the engine. Once the engine fires, the ignition switch is moved to both.
Figure shows the electric starter system
Carburetion
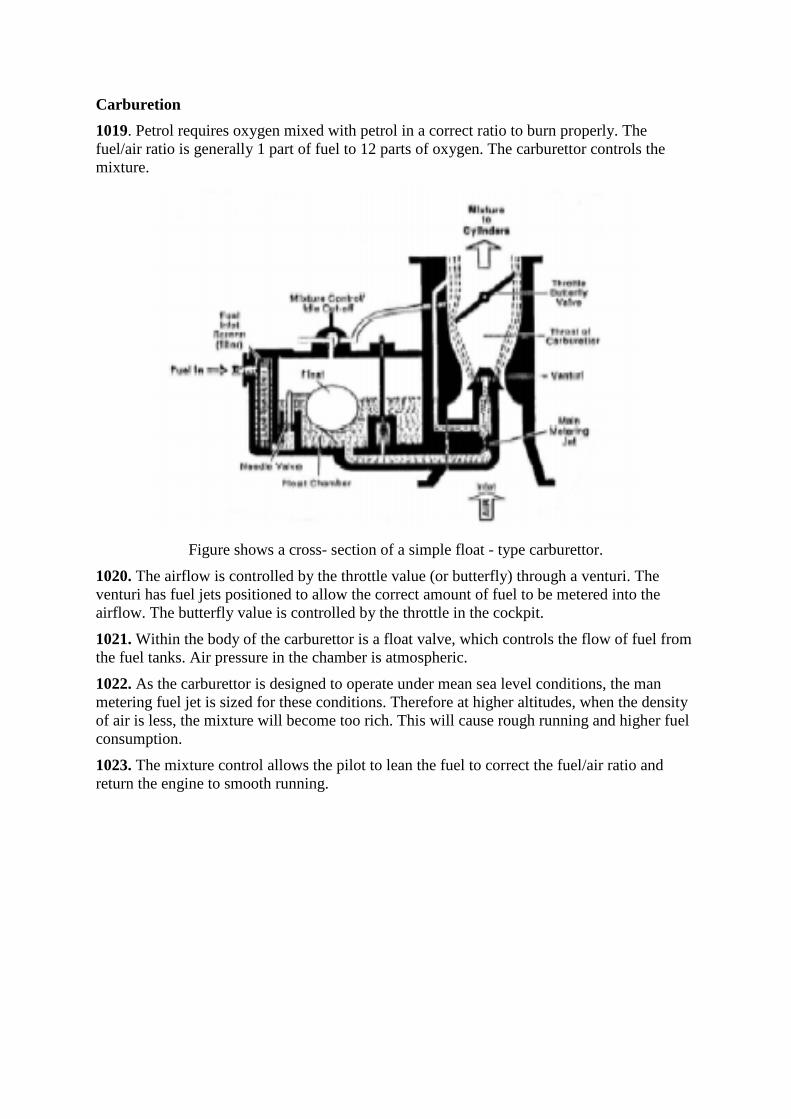
1019. Petrol requires oxygen mixed with petrol in a correct ratio to burn properly. The fuel/air ratio is generally 1 part of fuel to 12 parts of oxygen. The carburettor controls the mixture.
Figure shows a cross- section of a simple float - type carburettor.
1020. The airflow is controlled by the throttle value (or butterfly) through a venturi. The venturi has fuel jets positioned to allow the correct amount of fuel to be metered into the airflow. The butterfly value is controlled by the throttle in the cockpit.
1021. Within the body of the carburettor is a float valve, which controls the flow of fuel from the fuel tanks. Air pressure in the chamber is atmospheric.
1022. As the carburettor is designed to operate under mean sea level conditions, the man metering fuel jet is sized for these conditions. Therefore at higher altitudes, when the density of air is less, the mixture will become too rich. This will cause rough running and higher fuel consumption.
1023. The mixture control allows the pilot to lean the fuel to correct the fuel/air ratio and return the engine to smooth running.
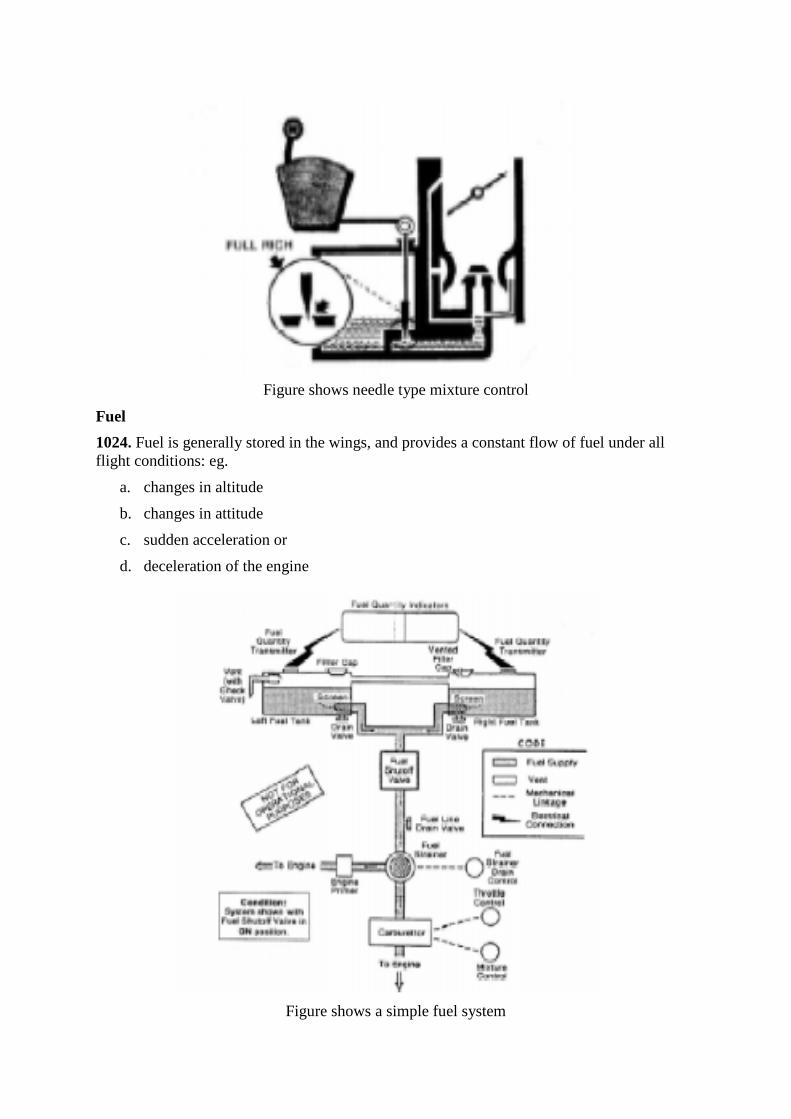
Figure shows needle type mixture control
Fuel
1024. Fuel is generally stored in the wings, and provides a constant flow of fuel under all flight conditions: eg.
a. changes in altitude
b. changes in attitude
c. sudden acceleration or
d. deceleration of the engine
Figure shows a simple fuel system
1025. Fuel tanks / systems have:
a. a sump
b. a drain point at the lowest point of the tank to allow heavy impurities to be drained off and inspected.
c. baffles to stop the fuel from surging around in flight
d. fuel filter in the fuel line to stop small impurities from entering the system.
e. fuel vent allows atmospheric pressure to be retained in the tank during changes in altitude and usage. It also allows for expansion of the fuel when heated by the sun.
1026. High wing aircraft have gravity fed systems, while low wing aircraft use a fuel pump. It is important to ensure that fuel strainer valve is shut during pre-flight inspection.
1027. A fuel primer pump is hand operated from within the cockpit, to force fuel to the induction system of the engine prior to start up. (it does not flow through the carburettor.)
Oil
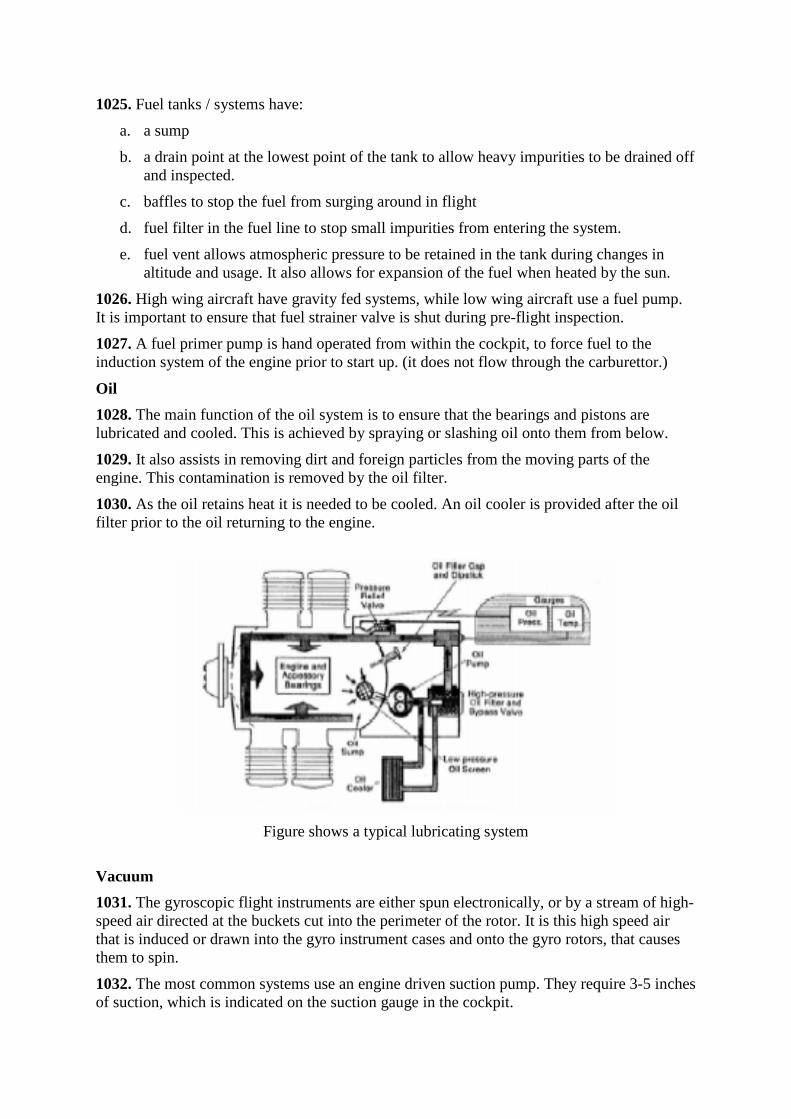
1028. The main function of the oil system is to ensure that the bearings and pistons are lubricated and cooled. This is achieved by spraying or slashing oil onto them from below.
1029. It also assists in removing dirt and foreign particles from the moving parts of the engine. This contamination is removed by the oil filter.
1030. As the oil retains heat it is needed to be cooled. An oil cooler is provided after the oil filter prior to the oil returning to the engine.
Figure shows a typical lubricating system
Vacuum
1031. The gyroscopic flight instruments are either spun electronically, or by a stream of high-speed air directed at the buckets cut into the perimeter of the rotor. It is this high speed air that is induced or drawn into the gyro instrument cases and onto the gyro rotors, that causes them to spin.
1032. The most common systems use an engine driven suction pump. They require 3-5 inches of suction, which is indicated on the suction gauge in the cockpit.
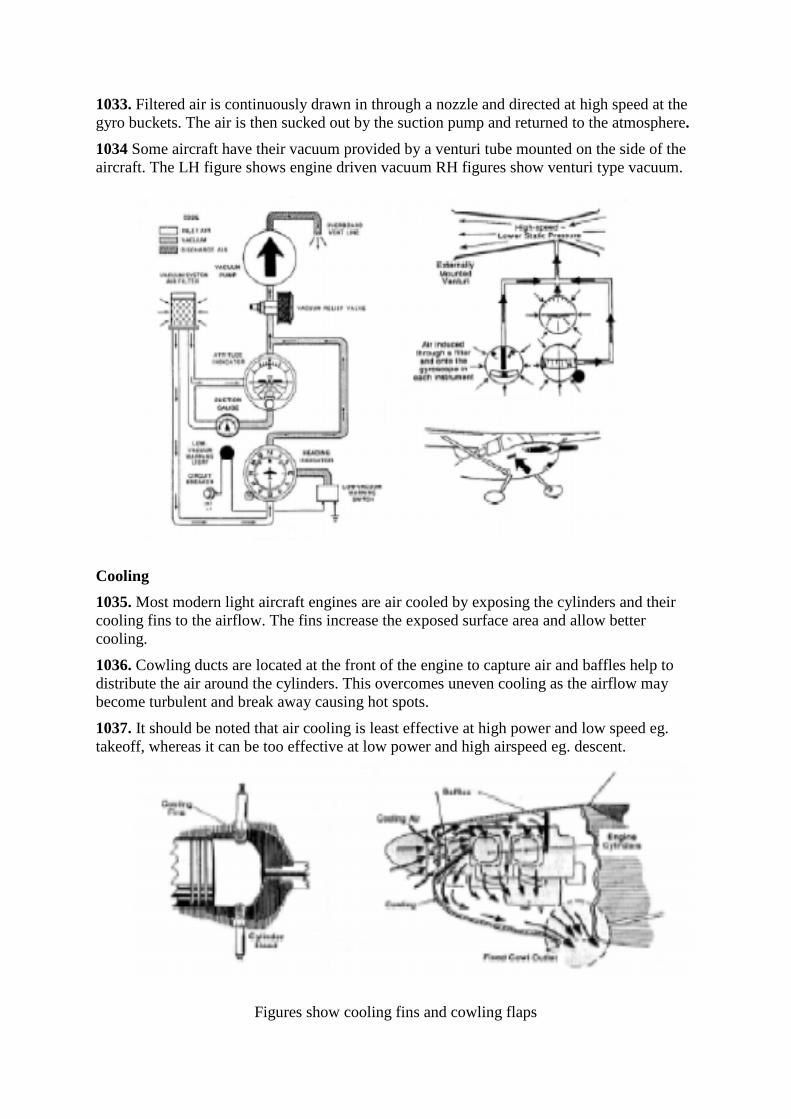
1033. Filtered air is continuously drawn in through a nozzle and directed at high speed at the gyro buckets. The air is then sucked out by the suction pump and returned to the atmosphere.
1034 Some aircraft have their vacuum provided by a venturi tube mounted on the side of the aircraft. The LH figure shows engine driven vacuum RH figures show venturi type vacuum.
Cooling
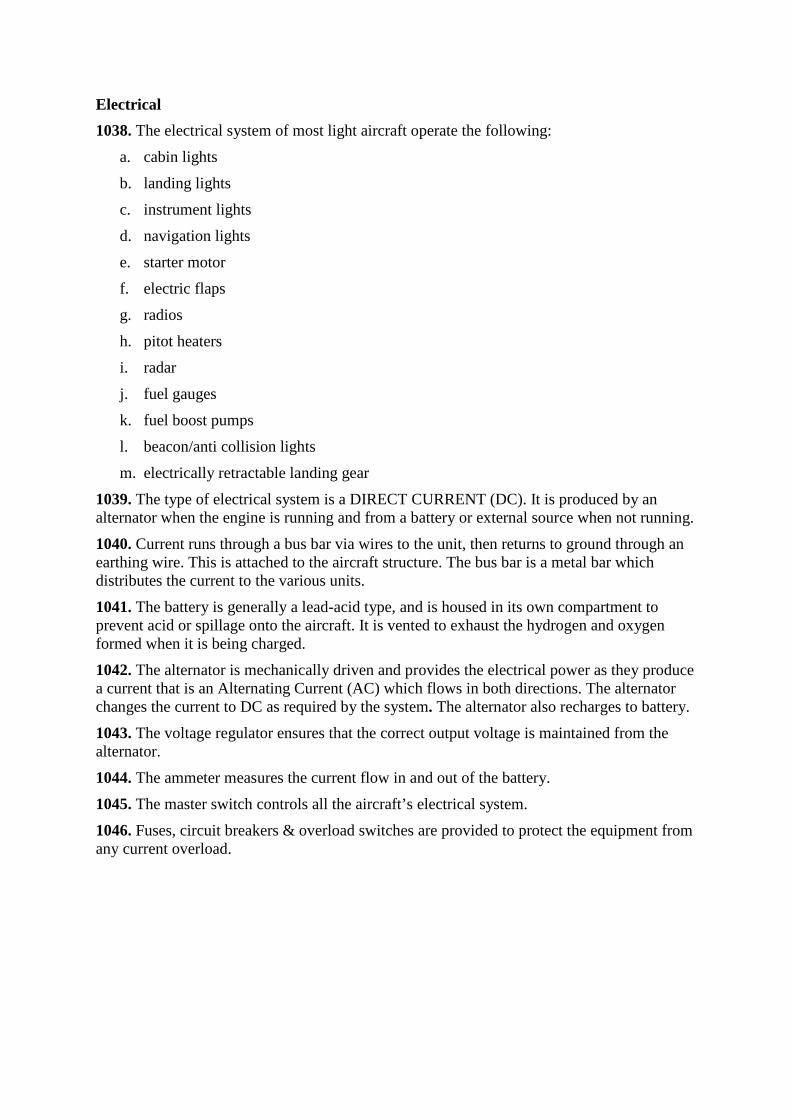
1035. Most modern light aircraft engines are air cooled by exposing the cylinders and their cooling fins to the airflow. The fins increase the exposed surface area and allow better cooling.
1036. Cowling ducts are located at the front of the engine to capture air and baffles help to distribute the air around the cylinders. This overcomes uneven cooling as the airflow may become turbulent and break away causing hot spots.
1037. It should be noted that air cooling is least effective at high power and low speed eg. takeoff, whereas it can be too effective at low power and high airspeed eg. descent.
Figures show cooling fins and cowling flaps
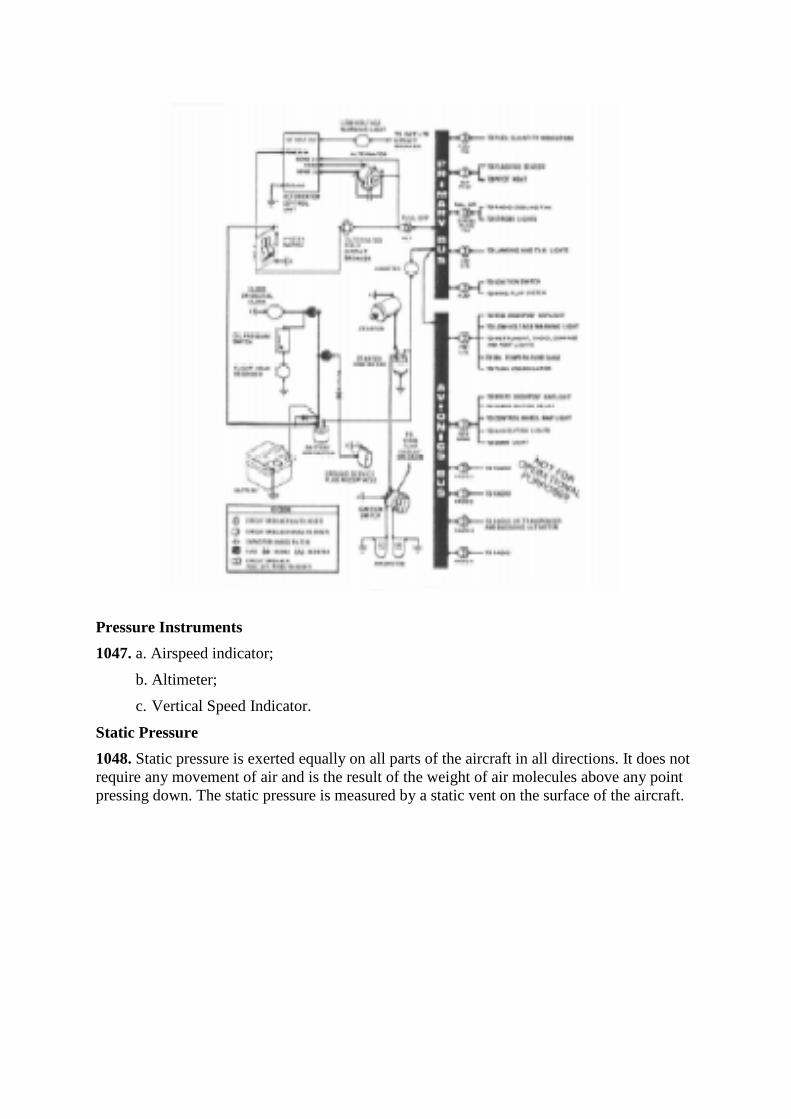
Electrical
1038. The electrical system of most light aircraft operate the following:
a. cabin lights
b. landing lights
c. instrument lights
d. navigation lights
e. starter motor
f. electric flaps
g. radios
h. pitot heaters
i. radar
j. fuel gauges
k. fuel boost pumps
l. beacon/anti collision lights
m. electrically retractable landing gear
1039. The type of electrical system is a DIRECT CURRENT (DC). It is produced by an alternator when the engine is running and from a battery or external source when not running.
1040. Current runs through a bus bar via wires to the unit, then returns to ground through an earthing wire. This is attached to the aircraft structure. The bus bar is a metal bar which distributes the current to the various units.
1041. The battery is generally a lead-acid type, and is housed in its own compartment to prevent acid or spillage onto the aircraft. It is vented to exhaust the hydrogen and oxygen formed when it is being charged.
1042. The alternator is mechanically driven and provides the electrical power as they produce a current that is an Alternating Current (AC) which flows in both directions. The alternator changes the current to DC as required by the system. The alternator also recharges to battery.
1043. The voltage regulator ensures that the correct output voltage is maintained from the alternator.
1044. The ammeter measures the current flow in and out of the battery.
1045. The master switch controls all the aircraft’s electrical system.
1046. Fuses, circuit breakers & overload switches are provided to protect the equipment from any current overload.
Pressure Instruments
1047. a. Airspeed indicator;
b. Altimeter;
c. Vertical Speed Indicator.
Static Pressure
1048. Static pressure is exerted equally on all parts of the aircraft in all directions. It does not require any movement of air and is the result of the weight of air molecules above any point pressing down. The static pressure is measured by a static vent on the surface of the aircraft.
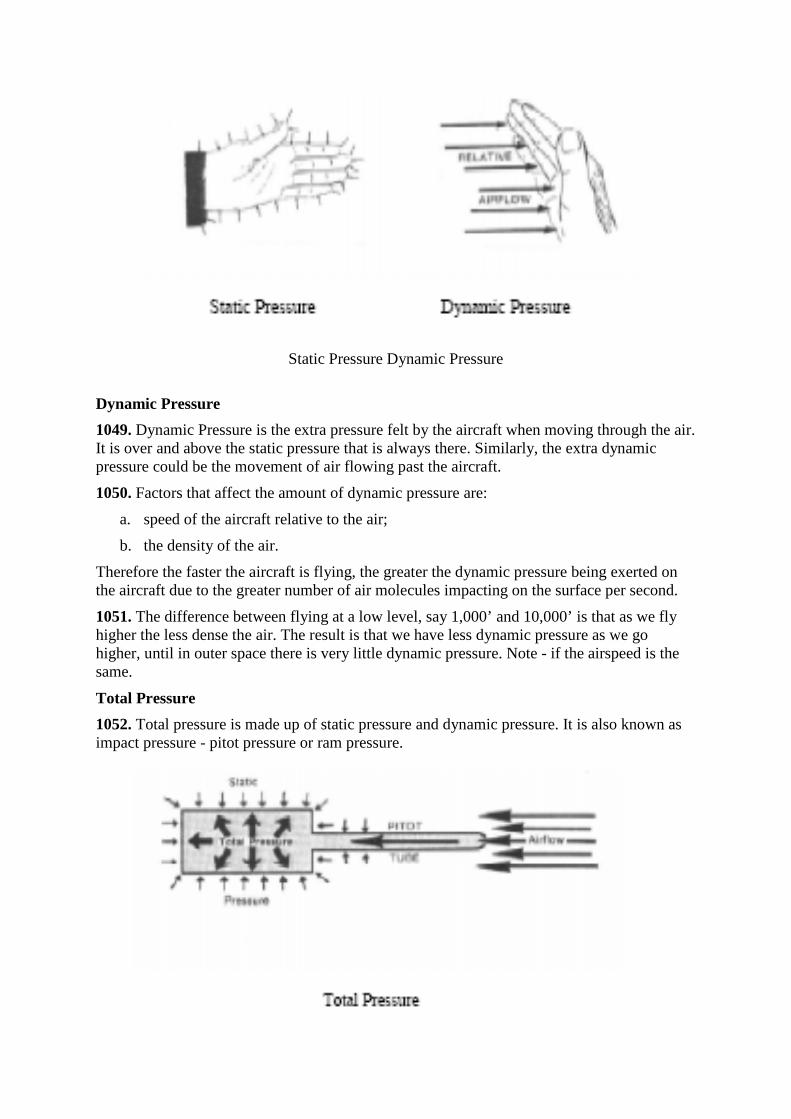
Static Pressure Dynamic Pressure
Dynamic Pressure
1049. Dynamic Pressure is the extra pressure felt by the aircraft when moving through the air. It is over and above the static pressure that is always there. Similarly, the extra dynamic pressure could be the movement of air flowing past the aircraft.
1050. Factors that affect the amount of dynamic pressure are:
a. speed of the aircraft relative to the air;
b. the density of the air.
Therefore the faster the aircraft is flying, the greater the dynamic pressure being exerted on the aircraft due to the greater number of air molecules impacting on the surface per second.
1051. The difference between flying at a low level, say 1,000’ and 10,000’ is that as we fly higher the less dense the air. The result is that we have less dynamic pressure as we go higher, until in outer space there is very little dynamic pressure. Note - if the airspeed is the same.
Total Pressure
1052. Total pressure is made up of static pressure and dynamic pressure. It is also known as impact pressure - pitot pressure or ram pressure.
Pitot Static System
1053. Altimeter converts static pressure to altitude.
1054. Vertical speed indicator relates the rate of change in static pressure to a rate of climb or descent.
1055. Air speed indicator relates the difference between total pressure and static pressure to the speed through the air.
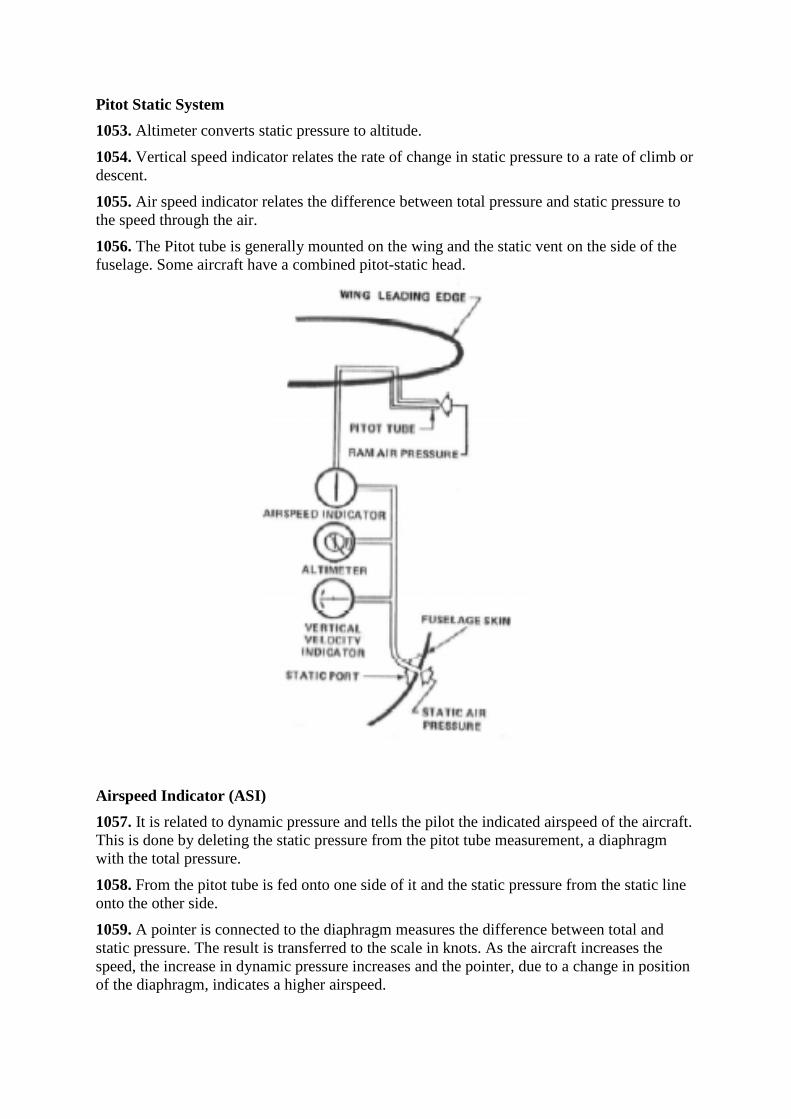
1056. The Pitot tube is generally mounted on the wing and the static vent on the side of the fuselage. Some aircraft have a combined pitot-static head.
Airspeed Indicator (ASI)
1057. It is related to dynamic pressure and tells the pilot the indicated airspeed of the aircraft. This is done by deleting the static pressure from the pitot tube measurement, a diaphragm with the total pressure.
1058. From the pitot tube is fed onto one side of it and the static pressure from the static line onto the other side.
1059. A pointer is connected to the diaphragm measures the difference between total and static pressure. The result is transferred to the scale in knots. As the aircraft increases the speed, the increase in dynamic pressure increases and the pointer, due to a change in position of the diaphragm, indicates a higher airspeed.
Altimeter
1060. Used for three different reasons:
1. Terrain clearance;
2. Aircraft separation;
3. Aircraft performance considerations.
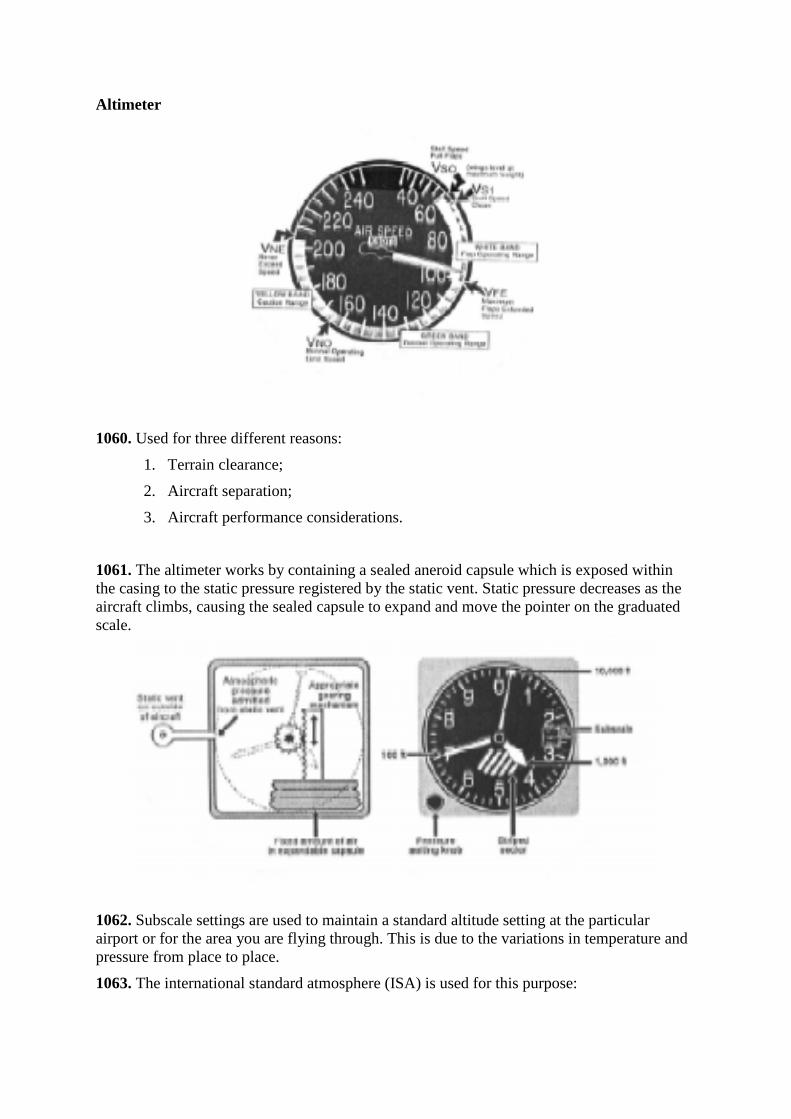
1061. The altimeter works by containing a sealed aneroid capsule which is exposed within the casing to the static pressure registered by the static vent. Static pressure decreases as the aircraft climbs, causing the sealed capsule to expand and move the pointer on the graduated scale.
1062. Subscale settings are used to maintain a standard altitude setting at the particular airport or for the area you are flying through. This is due to the variations in temperature and pressure from place to place.
1063. The international standard atmosphere (ISA) is used for this purpose:
1. at mean sea level pressure of 1013.25 hPa is used and changes as height is increased;
2. mean sea level temperature of +15 oC and this decreases 2oC every 1,000’ in height up to 36,000’.
1064. This setting is known as ’QNH’, which when placed on the subscale of the altimeter will read the actual height above mean sea level.
Vertical Speed Indicator (VSI)
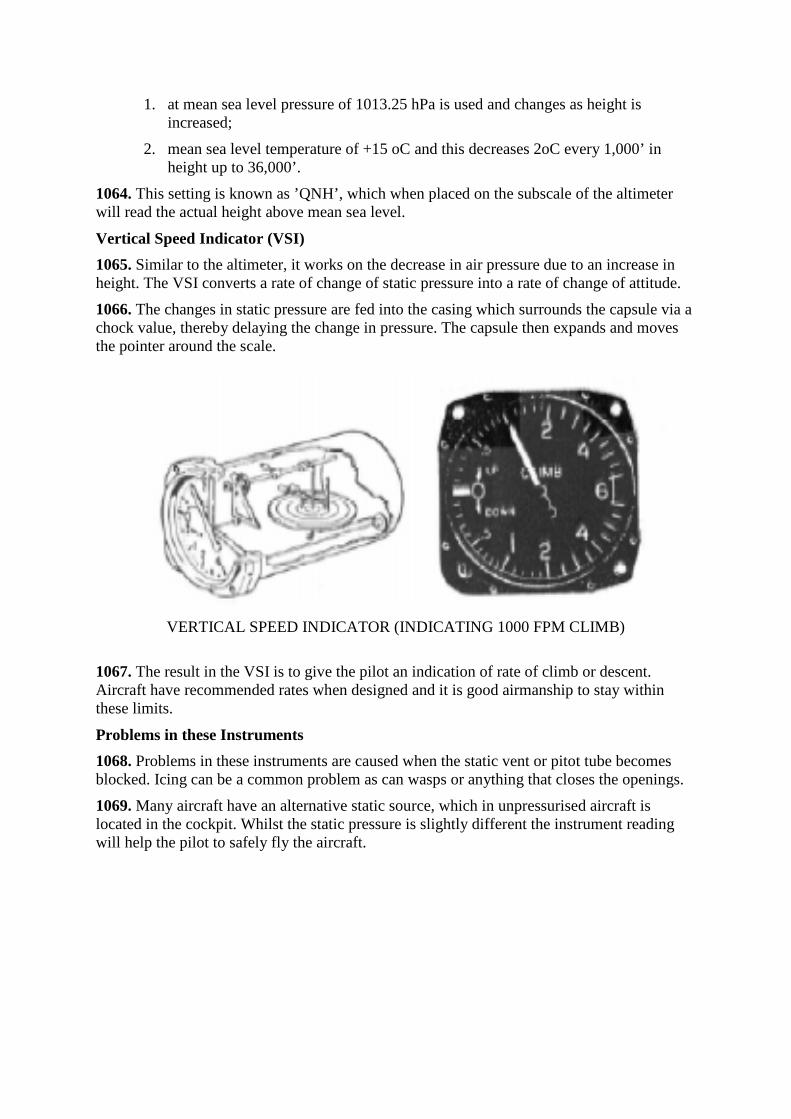
1065. Similar to the altimeter, it works on the decrease in air pressure due to an increase in height. The VSI converts a rate of change of static pressure into a rate of change of attitude.
1066. The changes in static pressure are fed into the casing which surrounds the capsule via a chock value, thereby delaying the change in pressure. The capsule then expands and moves the pointer around the scale.
VERTICAL SPEED INDICATOR (INDICATING 1000 FPM CLIMB)
1067. The result in the VSI is to give the pilot an indication of rate of climb or descent. Aircraft have recommended rates when designed and it is good airmanship to stay within these limits.
Problems in these Instruments
1068. Problems in these instruments are caused when the static vent or pitot tube becomes blocked. Icing can be a common problem as can wasps or anything that closes the openings.
1069. Many aircraft have an alternative static source, which in unpressurised aircraft is located in the cockpit. Whilst the static pressure is slightly different the instrument reading will help the pilot to safely fly the aircraft.

TYPICAL PITOT STATIC SYSTEM INSTALLATION
Gyroscopic Instruments
1070. 1. Turn coordinator and indicator;
2. Attitude indicator;
3. Heading indicator (direction indicator or directional gyro).
1071. These instruments are worked on the principle of a rotating wheel, mounted such that it is free to move on its axis in one or more directions.
1072. They maintain their original alignment despite what is going on around them.
Turn Coordinator and Indicator
Display of the Turn Coordinator

1073. The aircraft rotates to show the aircraft is turning. When the aircraft is banking left or right, the small silhouette will bank in the direction of the turn. When the wing is aligned with the lower index mark, the aircraft is in a standard rate one turn.
1074. Roll rate is also sensed by the gyro, because the gyro is tilted on its fore and aft axis, thereby providing the pilot with an immediate indication of conditions that lead to the turn. The rate of turn, shown in the figure of "2 min turn" indicates that it will take 2 minutes to complete a 360o turn.
1075. The coordination ball indicates the direction of G-forces. The combined effect of the earth’s gravity and the turning force. A free ball, located in a curved cylinder, filled with damping fluid. With the aircraft in straight flight, it remains in the lowest point, however, should the aircraft be slipping or skidding, the ball will move sideways.
Attitude Indicator/Artificial Horizon
1076. The face of the Attitude indicator represents a window in the nose of the aircraft and shows the pilot the relationship between the aircraft’s wing and the nose position relative to the horizon of the earth.
1077. The principle is a brass gyro wheel spinning at approximately 15,000 rev/min when operating. Through a series of pivots and gimbal rings, the gyro remains in its level position while the casing, fastened to the panel moves with the aircraft.
Figures show type of Attitude Indicators
1078. As an aircraft banks, the action is displayed by showing the relation of the aircraft’s wings to the earth’s horizon. When the nose is down, the wings will drop below the horizon, and conversely if in a climb the wings will be higher.
Heading Indicator/Directional Gyro
1079. This is another brass spinning gyro, mounted in an inner gimbal ring that is free to turn about its own horizontal axis. The inner gimbal is mounted inside an outer gimbal that is
pivoted on the top and bottom. These pivots allow the complete gyro to rotate around the vertical axis. The compass card drive gear is attached to this outer gimbal ring.
1080. Power to drive the DG is provided by the vacuum system.
1081. This instrument is most important for flying, as it gives an accurate indication of the aircraft’s heading. Because it does not seek out the magnetic north pole it needs to be constantly aligned with the magnetic compass. Its greatest advantage is that it is not affected during turns, climbs, acceleration or deceleration as the magnetic compass does.
Flight Instruments
1082. 1. Magnetic compass
2. Oil Temperature Gauge
3. Oil Pressure Gauge;
4. Cylinder Temperature Gauge;
5. Ammeter;
6. Fuel Gauges;
7. Tachometer.
Magnetic Compass
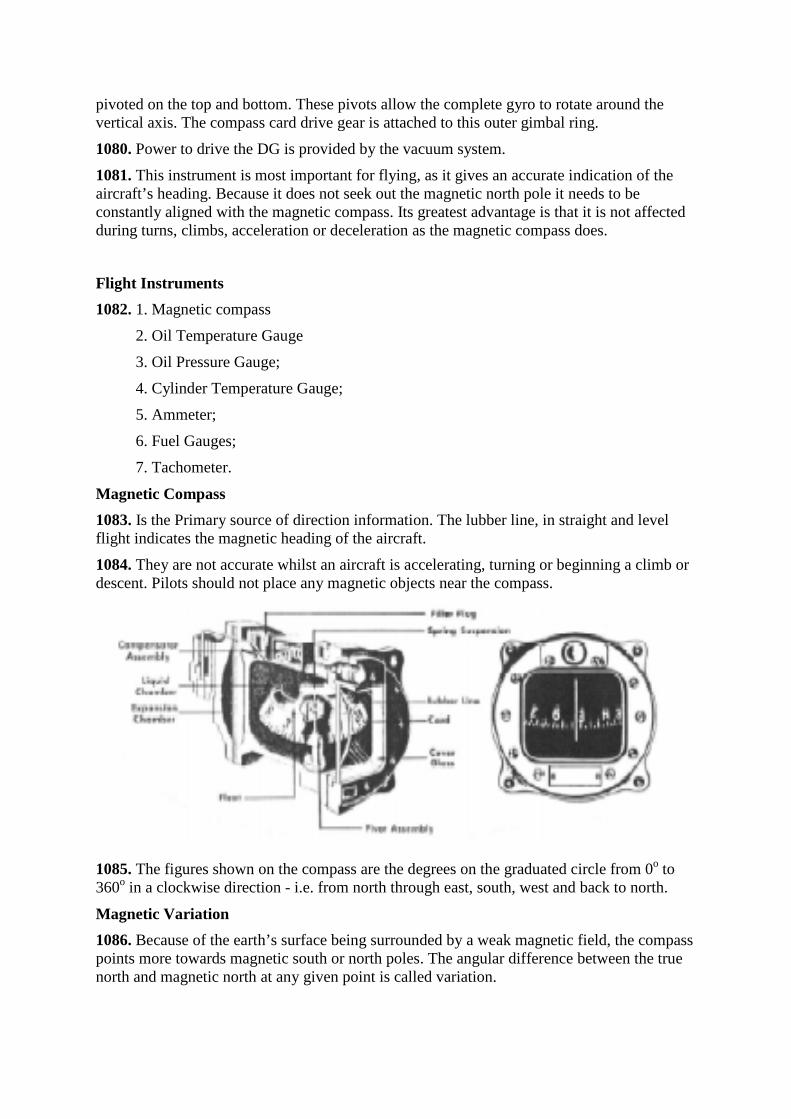
1083. Is the Primary source of direction information. The lubber line, in straight and level flight indicates the magnetic heading of the aircraft.
1084. They are not accurate whilst an aircraft is accelerating, turning or beginning a climb or descent. Pilots should not place any magnetic objects near the compass.
1085. The figures shown on the compass are the degrees on the graduated circle from 0o to 360o in a clockwise direction - i.e. from north through east, south, west and back to north.
Magnetic Variation
1086. Because of the earth’s surface being surrounded by a weak magnetic field, the compass points more towards magnetic south or north poles. The angular difference between the true north and magnetic north at any given point is called variation.
1087. If the compass points east of true north the variation is east, and if it points west then the variation is west.
VARIATION WEST ... MAGNETIC BEST
VARIATION EAST ... MAGNETIC LEAST
1088. If on a map which is ’true north’ then to correctly use the compass the variation has to be allowed for: e.g. 100o true - 10o east variation = 090o magnetic.
Deviation
1089. Each compass will be affected by the magnetic field it is exposed to, such as the metal parts in the aircraft, radios etc., all of which create their own magnetic fields. The total affect of these fields cause the compass to deviate. Each aircraft has its own deviation card which the pilot uses to adjust the heading.
Oil Temperature Gauge
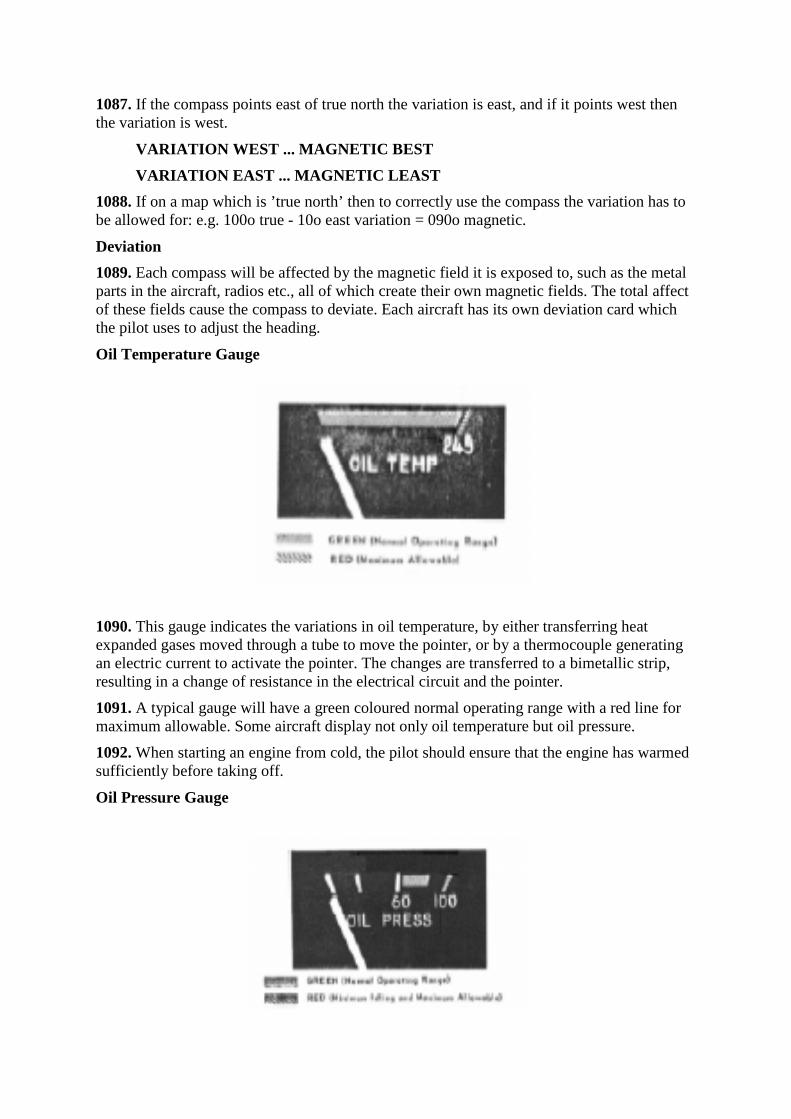
1090. This gauge indicates the variations in oil temperature, by either transferring heat expanded gases moved through a tube to move the pointer, or by a thermocouple generating an electric current to activate the pointer. The changes are transferred to a bimetallic strip, resulting in a change of resistance in the electrical circuit and the pointer.
1091. A typical gauge will have a green coloured normal operating range with a red line for maximum allowable. Some aircraft display not only oil temperature but oil pressure.
1092. When starting an engine from cold, the pilot should ensure that the engine has warmed sufficiently before taking off.
Oil Pressure Gauge
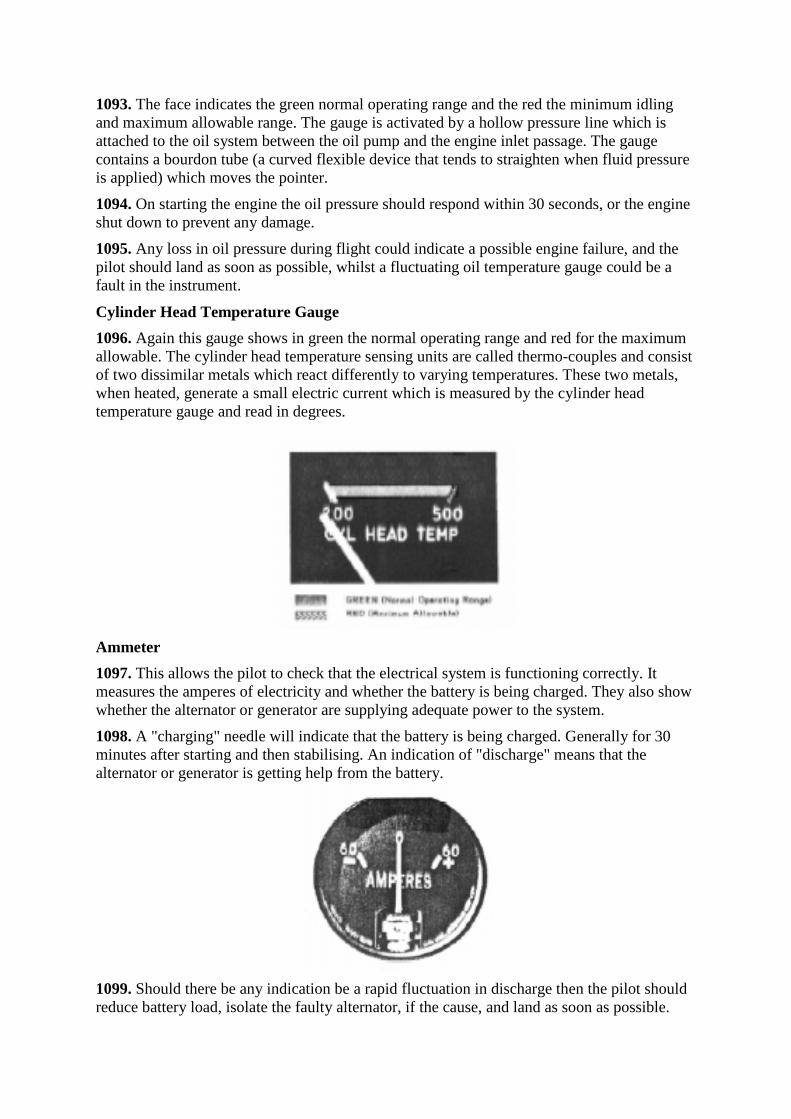
1093. The face indicates the green normal operating range and the red the minimum idling and maximum allowable range. The gauge is activated by a hollow pressure line which is attached to the oil system between the oil pump and the engine inlet passage. The gauge contains a bourdon tube (a curved flexible device that tends to straighten when fluid pressure is applied) which moves the pointer.
1094. On starting the engine the oil pressure should respond within 30 seconds, or the engine shut down to prevent any damage.
1095. Any loss in oil pressure during flight could indicate a possible engine failure, and the pilot should land as soon as possible, whilst a fluctuating oil temperature gauge could be a fault in the instrument.
Cylinder Head Temperature Gauge
1096. Again this gauge shows in green the normal operating range and red for the maximum allowable. The cylinder head temperature sensing units are called thermo-couples and consist of two dissimilar metals which react differently to varying temperatures. These two metals, when heated, generate a small electric current which is measured by the cylinder head temperature gauge and read in degrees.
Ammeter
1097. This allows the pilot to check that the electrical system is functioning correctly. It measures the amperes of electricity and whether the battery is being charged. They also show whether the alternator or generator are supplying adequate power to the system.
1098. A "charging" needle will indicate that the battery is being charged. Generally for 30 minutes after starting and then stabilising. An indication of "discharge" means that the alternator or generator is getting help from the battery.
1099. Should there be any indication be a rapid fluctuation in discharge then the pilot should reduce battery load, isolate the faulty alternator, if the cause, and land as soon as possible.
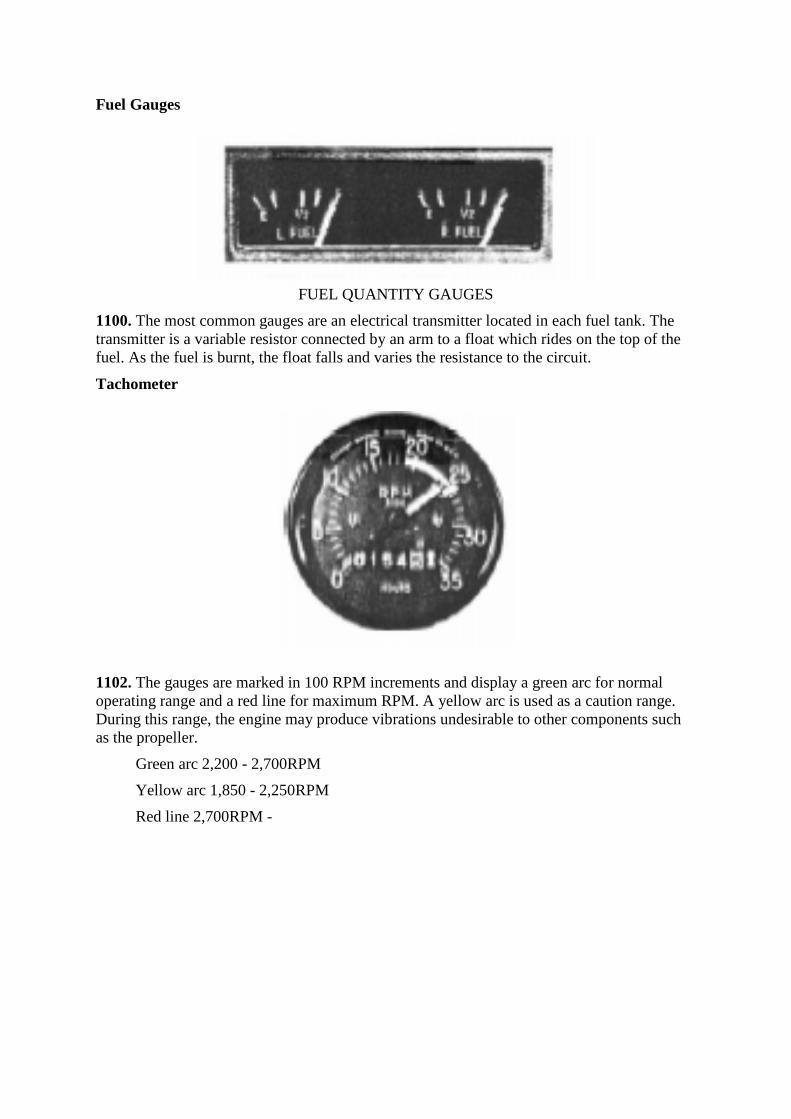
Fuel Gauges
FUEL QUANTITY GAUGES
1100. The most common gauges are an electrical transmitter located in each fuel tank. The transmitter is a variable resistor connected by an arm to a float which rides on the top of the fuel. As the fuel is burnt, the float falls and varies the resistance to the circuit.
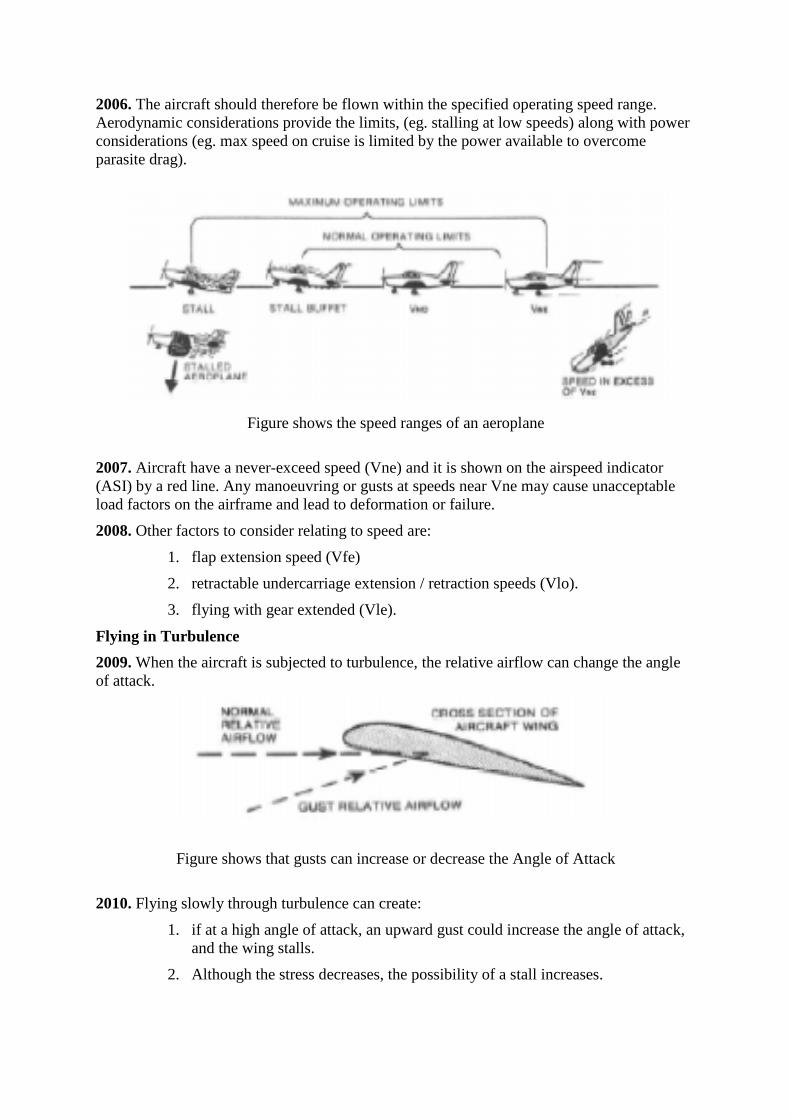
Tachometer
1102. The gauges are marked in 100 RPM increments and display a green arc for normal operating range and a red line for maximum RPM. A yellow arc is used as a caution range. During this range, the engine may produce vibrations undesirable to other components such as the propeller.
Green arc 2,200 - 2,700RPM
Yellow arc 1,850 - 2,250RPM
Red line 2,700RPM -

AVIATION ADVANCED (AVA) AVA 2 - AIRCRAFT OPERATION AND PREFORMANCE
2 PERIODS
Objectives
2001 a. Outline the following airframe limitations:
1. weight
2. speed
3. flying in turbulence
4. velocity - load factor (or Vn) diagram
b. Outline aircraft take-off and landing performances.
c. Outline the concepts of;
1. Aircraft weight & weight terminology (MTOW, MLW GROSS WEIGHT)
2. aircraft balance
3. moment of force
4. balancing a loaded aircraft
Airframe Limitations
Weight
2002. Aircraft are designed and built to perform specific tasks and carry certain loads. Therefore the gross weight is subject to certain limitations.
2003. Some of those limitations are structural and others are due to performance. eg. temperature and pressure, runway conditions, which may limit allowable weights for take-off and landing.
2004. Each aircraft has a maximum takeoff weight (MTOW) and maximum landing weight (MLW). These will be outlined later in this period.
Speed
2005. Aircraft are again limited by structural design, as the airframe may not be designed to withstand the stress of high speed cruise or dive.
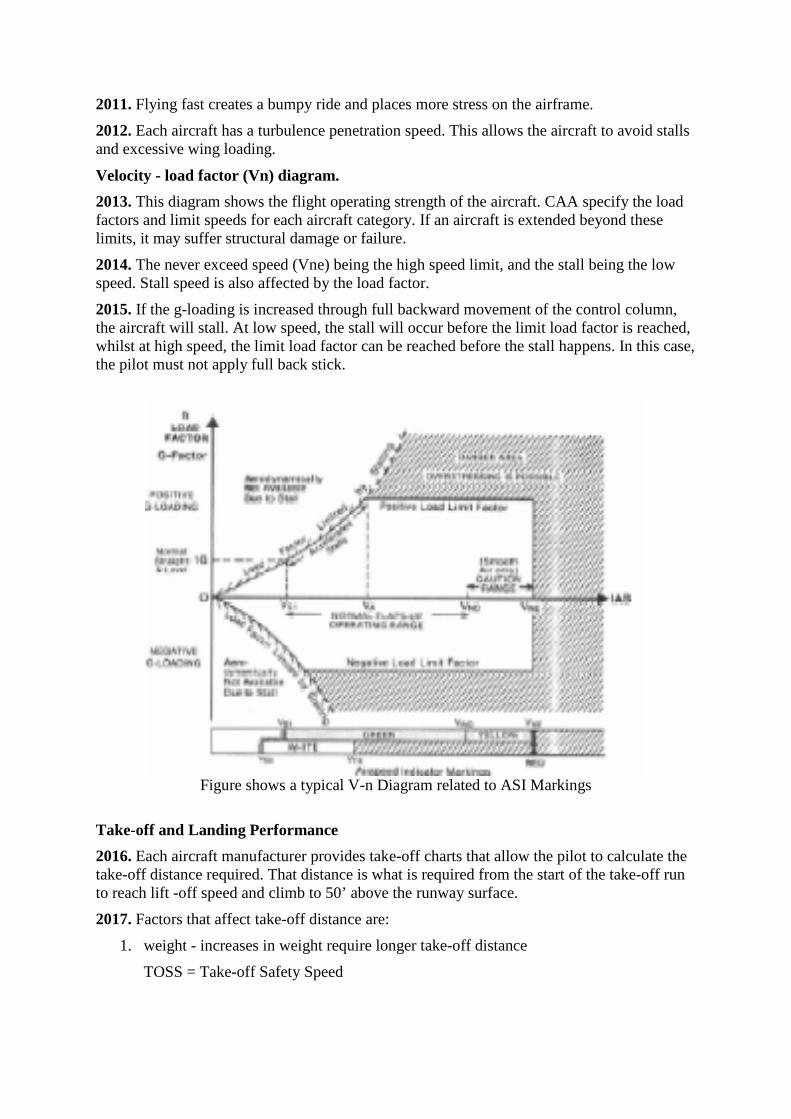
2006. The aircraft should therefore be flown within the specified operating speed range. Aerodynamic considerations provide the limits, (eg. stalling at low speeds) along with power considerations (eg. max speed on cruise is limited by the power available to overcome parasite drag).
Figure shows the speed ranges of an aeroplane
2007. Aircraft have a never-exceed speed (Vne) and it is shown on the airspeed indicator (ASI) by a red line. Any manoeuvring or gusts at speeds near Vne may cause unacceptable load factors on the airframe and lead to deformation or failure.
2008. Other factors to consider relating to speed are:
1. flap extension speed (Vfe)
2. retractable undercarriage extension / retraction speeds (Vlo).
3. flying with gear extended (Vle).
Flying in Turbulence
2009. When the aircraft is subjected to turbulence, the relative airflow can change the angle of attack.
Figure shows that gusts can increase or decrease the Angle of Attack
2010. Flying slowly through turbulence can create:
1. if at a high angle of attack, an upward gust could increase the angle of attack, and the wing stalls.
2. Although the stress decreases, the possibility of a stall increases.
2011. Flying fast creates a bumpy ride and places more stress on the airframe.
2012. Each aircraft has a turbulence penetration speed. This allows the aircraft to avoid stalls and excessive wing loading.
Velocity - load factor (Vn) diagram.
2013. This diagram shows the flight operating strength of the aircraft. CAA specify the load factors and limit speeds for each aircraft category. If an aircraft is extended beyond these limits, it may suffer structural damage or failure.
2014. The never exceed speed (Vne) being the high speed limit, and the stall being the low speed. Stall speed is also affected by the load factor.
2015. If the g-loading is increased through full backward movement of the control column, the aircraft will stall. At low speed, the stall will occur before the limit load factor is reached, whilst at high speed, the limit load factor can be reached before the stall happens. In this case, the pilot must not apply full back stick.
Figure shows a typical V-n Diagram related to ASI Markings
Take-off and Landing Performance
2016. Each aircraft manufacturer provides take-off charts that allow the pilot to calculate the take-off distance required. That distance is what is required from the start of the take-off run to reach lift -off speed and climb to 50’ above the runway surface.
2017. Factors that affect take-off distance are:
1. weight - increases in weight require longer take-off distance
TOSS = Take-off Safety Speed
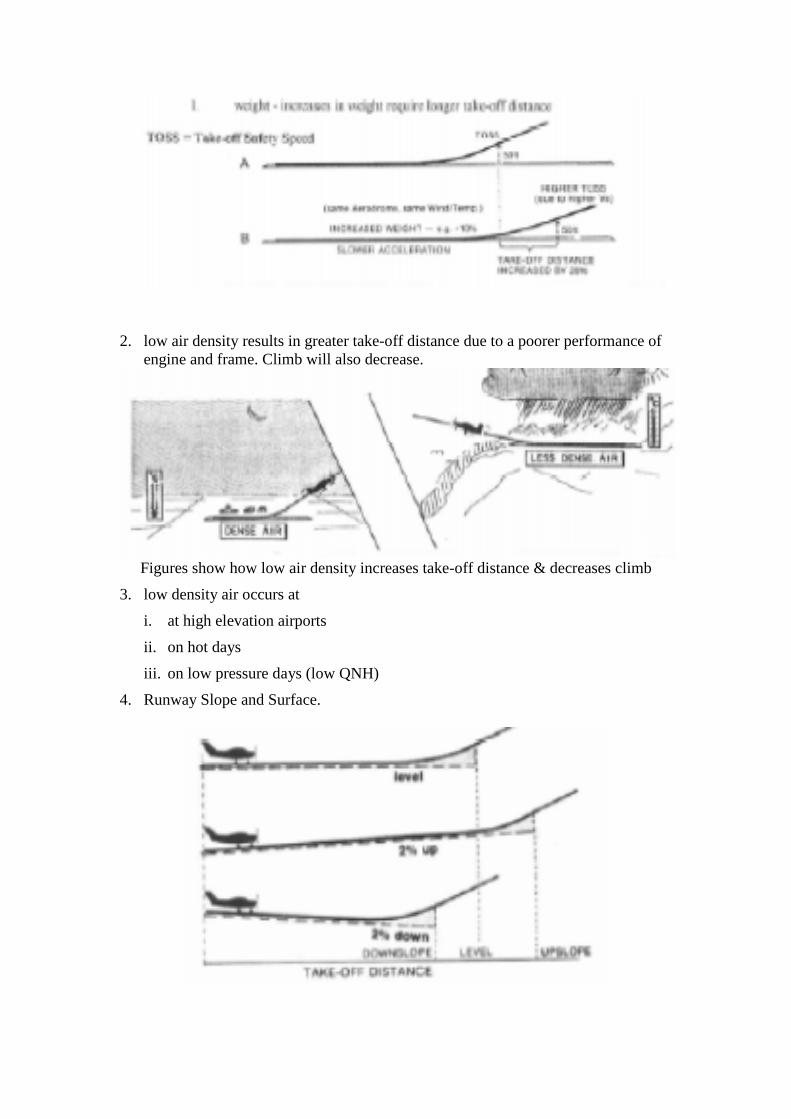
2. low air density results in greater take-off distance due to a poorer performance of engine and frame. Climb will also decrease.
Figures show how low air density increases take-off distance & decreases climb
3. low density air occurs at
i. at high elevation airports
ii. on hot days
iii. on low pressure days (low QNH)
4. Runway Slope and Surface.
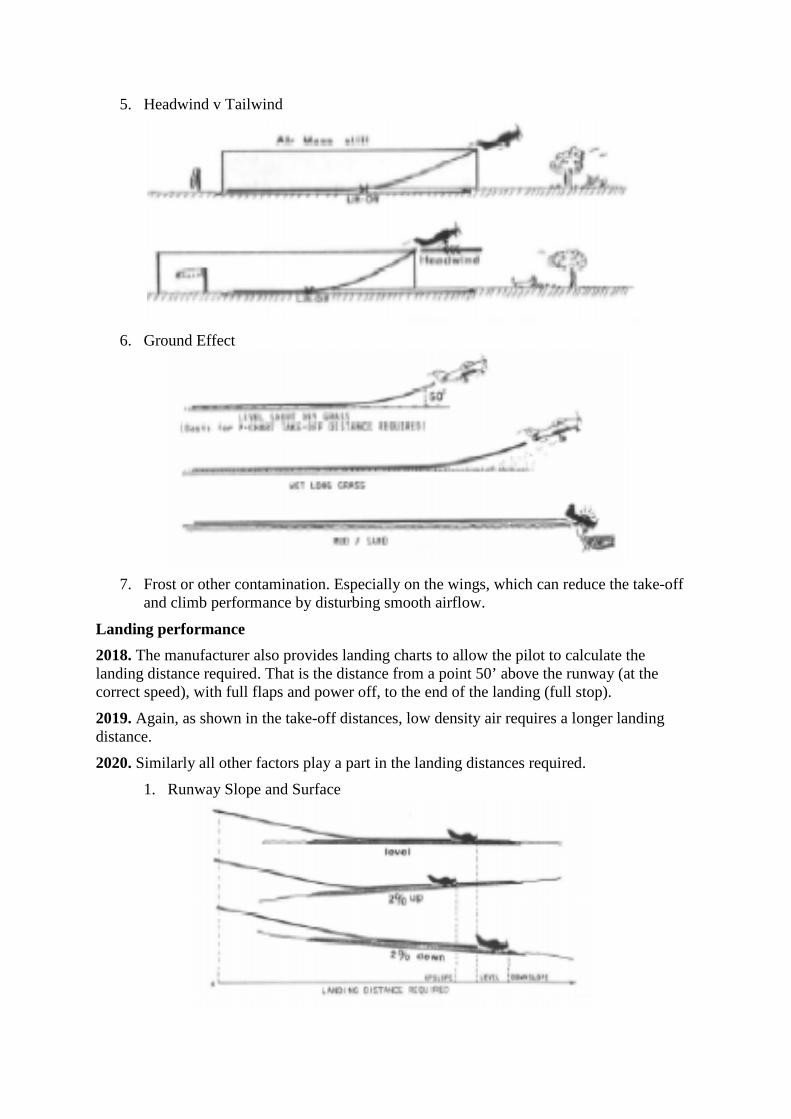
5. Headwind v Tailwind
6. Ground Effect
7. Frost or other contamination. Especially on the wings, which can reduce the take-off and climb performance by disturbing smooth airflow.
Landing performance
2018. The manufacturer also provides landing charts to allow the pilot to calculate the landing distance required. That is the distance from a point 50’ above the runway (at the correct speed), with full flaps and power off, to the end of the landing (full stop).
2019. Again, as shown in the take-off distances, low density air requires a longer landing distance.
2020. Similarly all other factors play a part in the landing distances required.
1. Runway Slope and Surface

2. Increased Weight
3. Headwind v Tailwind
4. Ground Effect
Aircraft Weight and Weight Terminology
2021. Maximum Take-off Weight (MTOW) is a structural limitation and is the maximum gross weight the aircraft is permitted to take-off. This is recorded in the Flight Manual or on the Certificate of Airworthiness.
2022. Maximum Landing Weight (MLW) is also a structural limitation based on gross maximum weight at which the aircraft is permitted to land. Again this is recorded in the Flight Manual or certificate of Airworthiness.
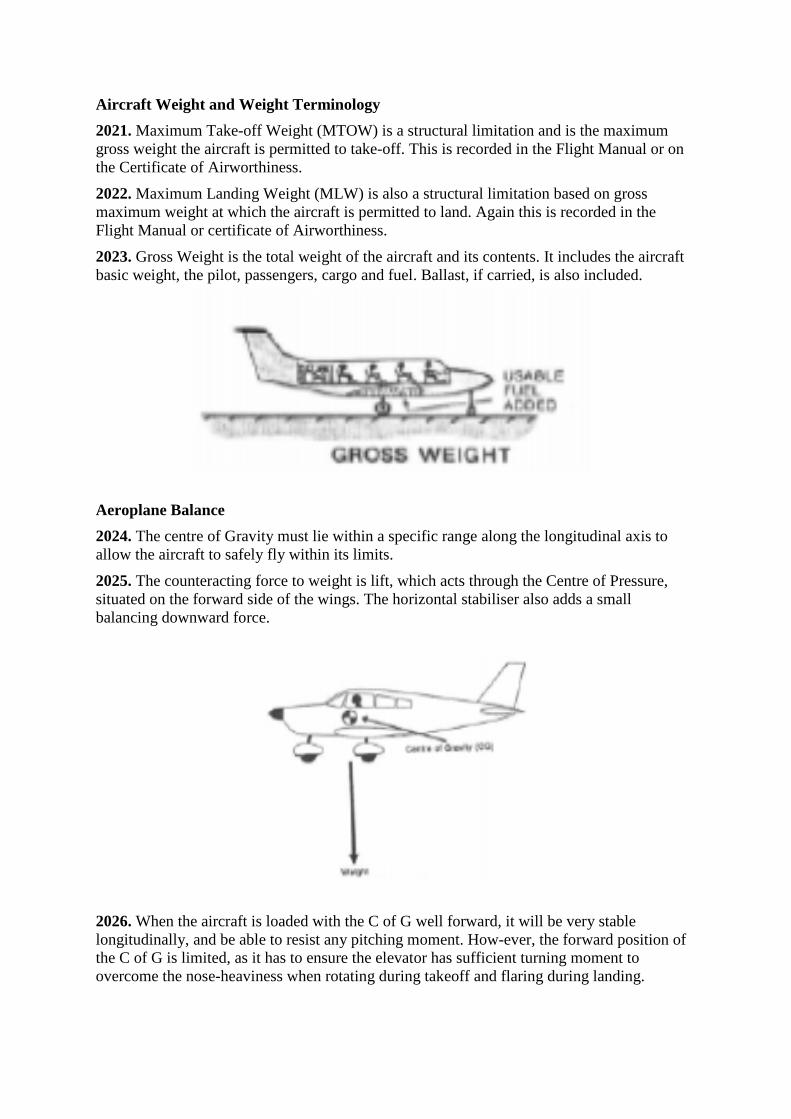
2023. Gross Weight is the total weight of the aircraft and its contents. It includes the aircraft basic weight, the pilot, passengers, cargo and fuel. Ballast, if carried, is also included.
Aeroplane Balance
2024. The centre of Gravity must lie within a specific range along the longitudinal axis to allow the aircraft to safely fly within its limits.
2025. The counteracting force to weight is lift, which acts through the Centre of Pressure, situated on the forward side of the wings. The horizontal stabiliser also adds a small balancing downward force.
2026. When the aircraft is loaded with the C of G well forward, it will be very stable longitudinally, and be able to resist any pitching moment. How-ever, the forward position of the C of G is limited, as it has to ensure the elevator has sufficient turning moment to overcome the nose-heaviness when rotating during takeoff and flaring during landing.
2027. By loading the aircraft with the C of G aft, it has a shorter moment arm to the horizontal stabiliser, and be tail heavy. It will be less stable longitudinally, and require the pilot to continually adjust the controls to maintain steady flight. It will tend to stall and/or spin more easily, and be difficult to recover.
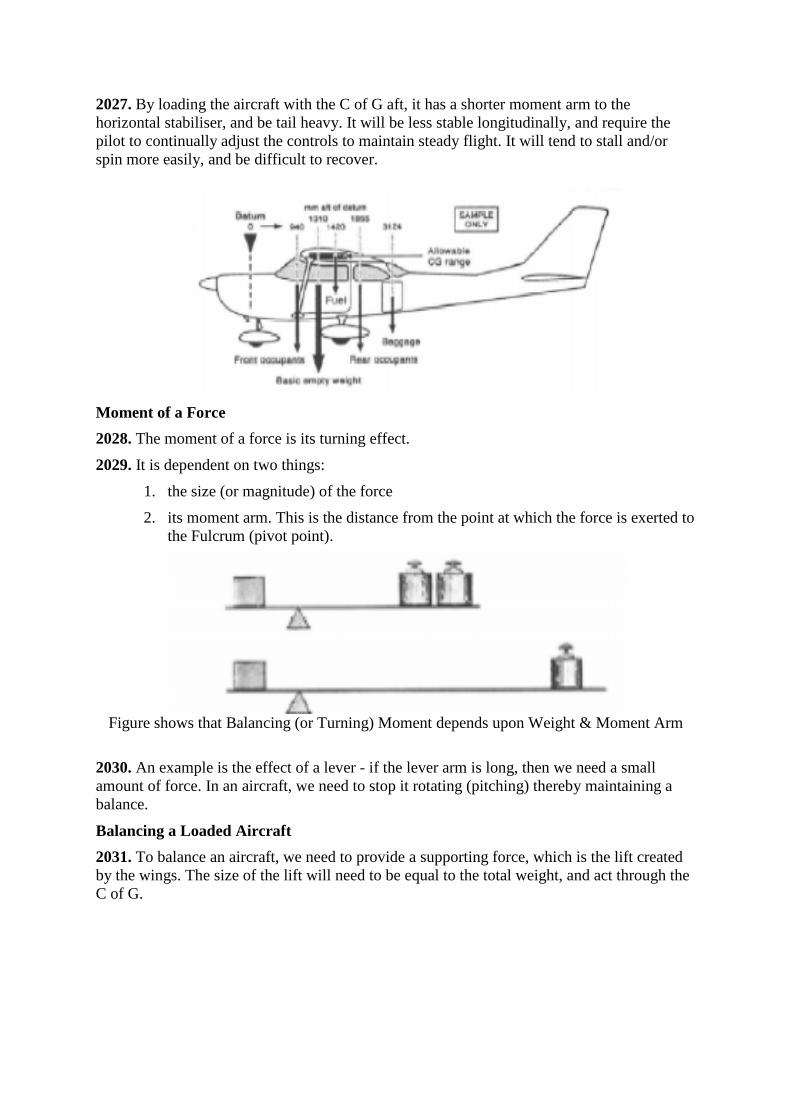
Moment of a Force
2028. The moment of a force is its turning effect.
2029. It is dependent on two things:
1. the size (or magnitude) of the force
2. its moment arm. This is the distance from the point at which the force is exerted to the Fulcrum (pivot point).
Figure shows that Balancing (or Turning) Moment depends upon Weight & Moment Arm
2030. An example is the effect of a lever - if the lever arm is long, then we need a small amount of force. In an aircraft, we need to stop it rotating (pitching) thereby maintaining a balance.
Balancing a Loaded Aircraft
2031. To balance an aircraft, we need to provide a supporting force, which is the lift created by the wings. The size of the lift will need to be equal to the total weight, and act through the C of G.
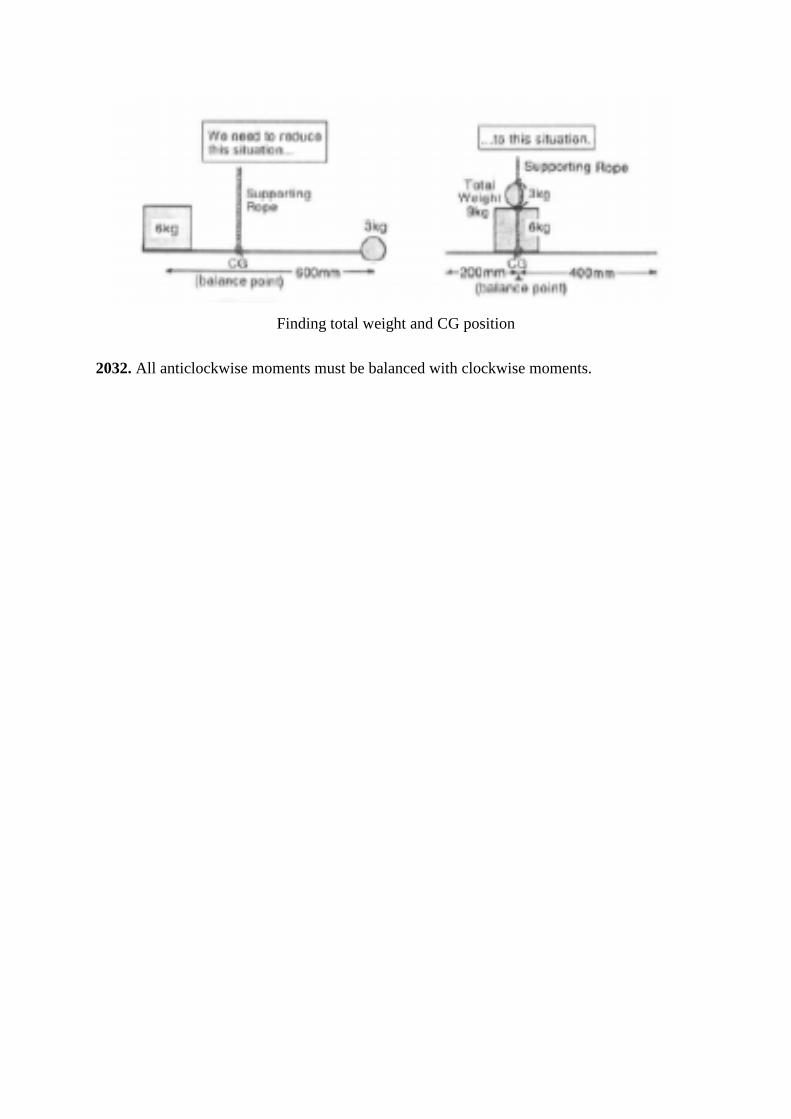
Finding total weight and CG position
2032. All anticlockwise moments must be balanced with clockwise moments.
AVIATION ADVANCED (AVA) AVA 3 - NAVIGATION
2 PERIODS
Objectives
3001. a. State the purpose for each of the following maps, charts and publications used for aerial navigation;
1. WAC/ONC
2. VTC/ERC
3. ERSA/FLIP
b. Explain the symbols and scales used in charts for aerial navigation
c. Demonstrate the use of each chart
d. Explain and demonstrate the use of the information in each section (ERSA/FLIP)
Charts and Maps
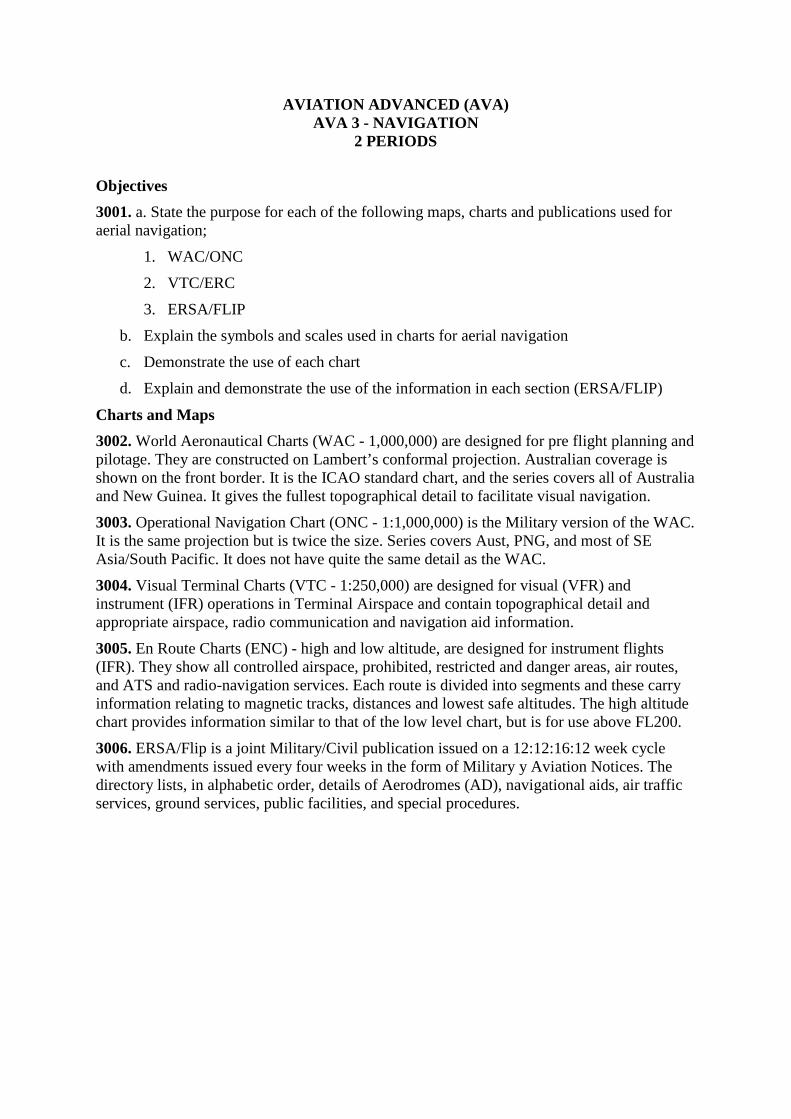
3002. World Aeronautical Charts (WAC - 1,000,000) are designed for pre flight planning and pilotage. They are constructed on Lambert’s conformal projection. Australian coverage is shown on the front border. It is the ICAO standard chart, and the series covers all of Australia and New Guinea. It gives the fullest topographical detail to facilitate visual navigation.
3003. Operational Navigation Chart (ONC - 1:1,000,000) is the Military version of the WAC. It is the same projection but is twice the size. Series covers Aust, PNG, and most of SE Asia/South Pacific. It does not have quite the same detail as the WAC.
3004. Visual Terminal Charts (VTC - 1:250,000) are designed for visual (VFR) and instrument (IFR) operations in Terminal Airspace and contain topographical detail and appropriate airspace, radio communication and navigation aid information.
3005. En Route Charts (ENC) - high and low altitude, are designed for instrument flights (IFR). They show all controlled airspace, prohibited, restricted and danger areas, air routes, and ATS and radio-navigation services. Each route is divided into segments and these carry information relating to magnetic tracks, distances and lowest safe altitudes. The high altitude chart provides information similar to that of the low level chart, but is for use above FL200.
3006. ERSA/Flip is a joint Military/Civil publication issued on a 12:12:16:12 week cycle with amendments issued every four weeks in the form of Military y Aviation Notices. The directory lists, in alphabetic order, details of Aerodromes (AD), navigational aids, air traffic services, ground services, public facilities, and special procedures.
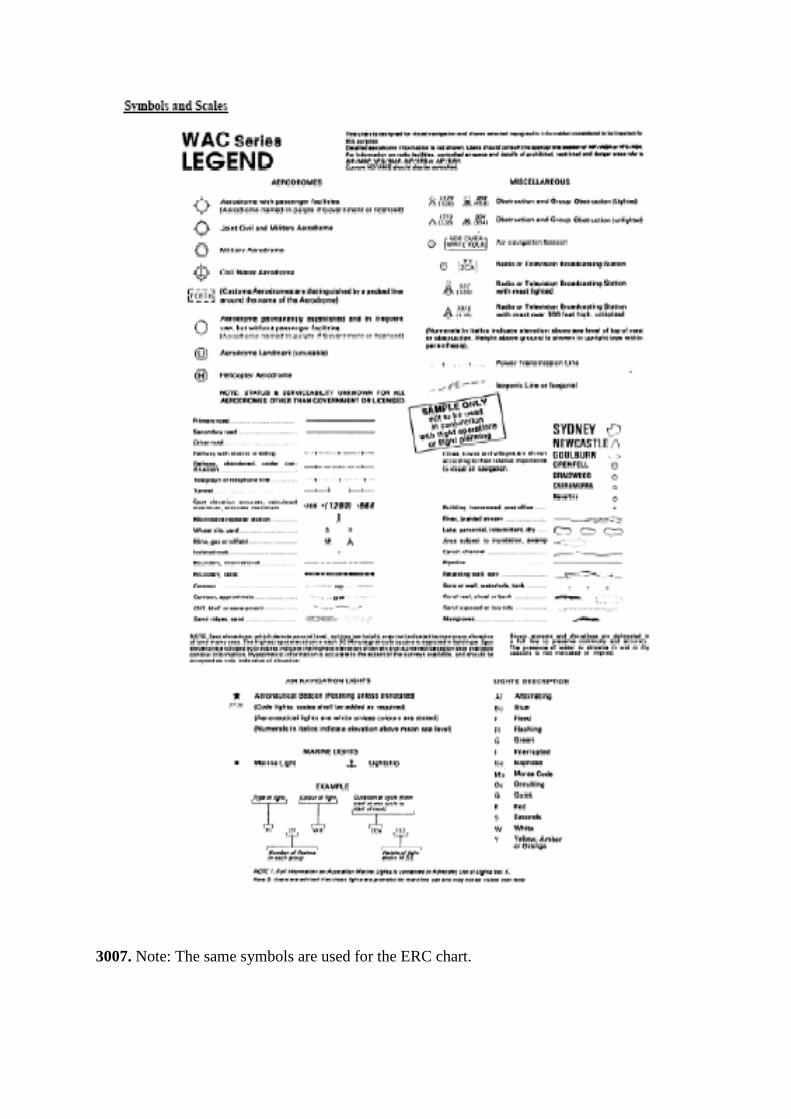
3007. Note: The same symbols are used for the ERC chart.
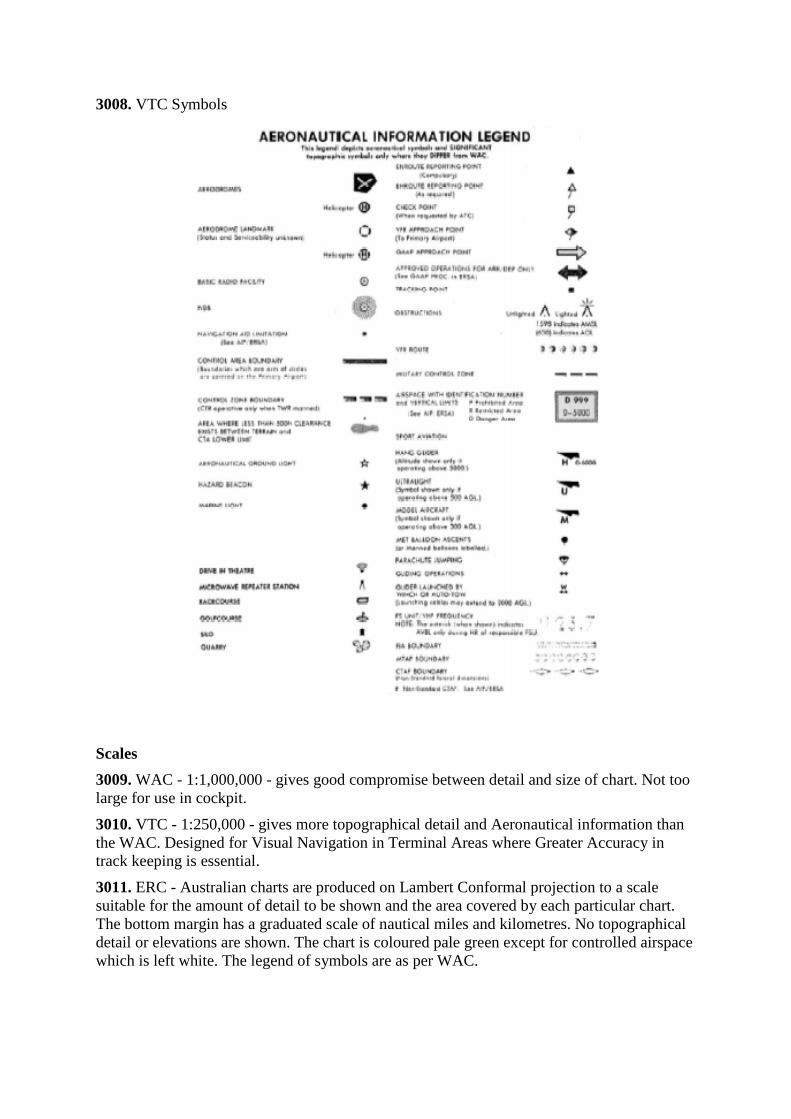
3008. VTC Symbols
Scales
3009. WAC - 1:1,000,000 - gives good compromise between detail and size of chart. Not too large for use in cockpit.
3010. VTC - 1:250,000 - gives more topographical detail and Aeronautical information than the WAC. Designed for Visual Navigation in Terminal Areas where Greater Accuracy in track keeping is essential.
3011. ERC - Australian charts are produced on Lambert Conformal projection to a scale suitable for the amount of detail to be shown and the area covered by each particular chart. The bottom margin has a graduated scale of nautical miles and kilometres. No topographical detail or elevations are shown. The chart is coloured pale green except for controlled airspace which is left white. The legend of symbols are as per WAC.
AVIATION ADVANCED (AVA) AVA 4 - METEOROLOGY
2 PERIODS
Objective
4001. a. Identify & classify cloud types ie.
1. high, medium, low
2. cumuliform, stratiform. Examples of type are Cu, Ci etc
b. State the standard abbreviation for each cloud type, and the method used to report cloud amount
c. Describe the weather associated with each type of cloud
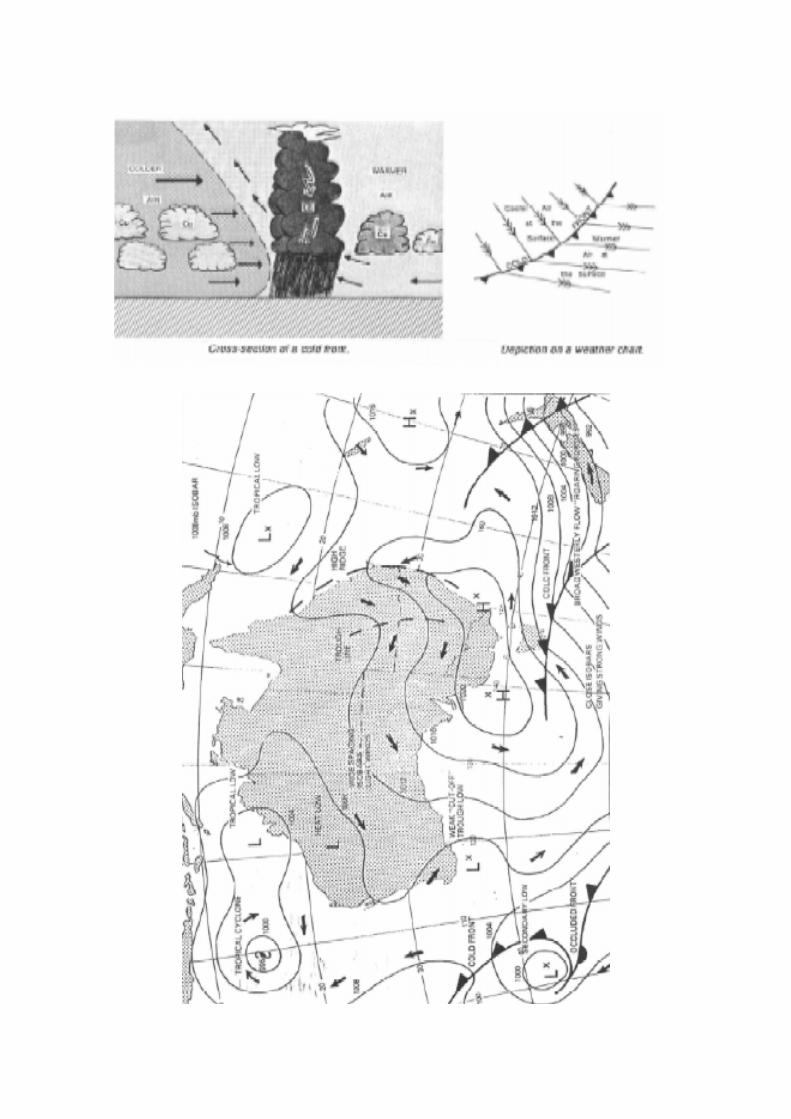
d. From a diagram, identify the following basic features on a weather map:
1. high
2. low
3. trough
4. ridge
5. cold front
6. warm front
7. tropical cyclone
Cloud Formation
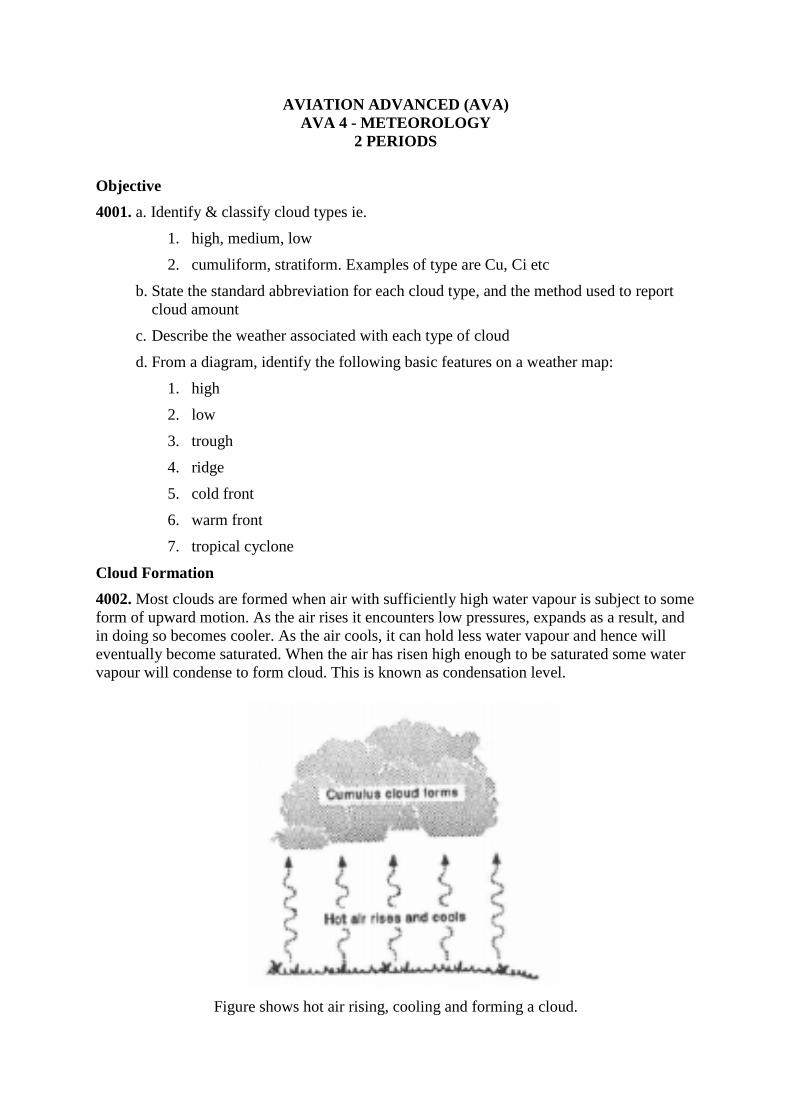
4002. Most clouds are formed when air with sufficiently high water vapour is subject to some form of upward motion. As the air rises it encounters low pressures, expands as a result, and in doing so becomes cooler. As the air cools, it can hold less water vapour and hence will eventually become saturated. When the air has risen high enough to be saturated some water vapour will condense to form cloud. This is known as condensation level.
Figure shows hot air rising, cooling and forming a cloud.

Identify the Types of Cloud
4003. Ch High Cloud
Cirrocumulus: thin white patch, sheet or layer of cloud without shading, composed of very small elements in the form of grains or ripples, joined together or separate and more or less regularly arranged.
Cirrostratus: transparent whitish veil of fibrous or smooth appearance, totally or partly covering the sky and generally producing a halo phenomenon - a luminous white ring around the sun or moon usually with a faint red fringe on the inside.
Cirrus: detached clouds in the form of white delicate filaments or white or mostly white patches or narrow bands. These clouds have a fibrous or silky appearance.
4004. Cm middle clouds:
Altostratus: greyish or bluish cloud sheet of fibrous or uniform appearance totally or partly covering the sky and having parts thin enough to reveal the sun at least vaguely as through ground glass. Precipitation in the form of rain or snow can occur with this cloud.
Nimbostratus: dark grey cloud layer generally covering the whole sky and thick enough throughout to hide the sun or moon. The base appears diffuse due to more or less continuously falling rain or snow. At times it may be confused with As but its darker grey colour and lack of a distinct lower surface provides a distinction form from As.
Altocumulus: a layer of patches of cloud composed of laminae or flattened globular masses, the smallest elements of the layer being fairly small - an apparent width of two fingers at arm’s length - and thin, and either white or grey in colour. The elements are arranged in groups in lines or in waves which may be joined to form a continuous layer or appear in broken patches. Coronac - one or more coloured rings around the sun or moon - are a characteristic of this cloud, while irisation - coloured bands predominantly green and pink often with pastel shades - may appear along the thinner edges. In an unstable atmosphere the vertical development may be sufficient to produce precipitation in the form of virga or slight showers.
4005. C1 Low Clouds:
Cumulonimbus: heavy and dense cloud with considerable vertical extent in the form of a mountain or huge tower. At least part of its upper portion is usually fibrous or striated, often appearing as an anvil or vast plume. The base appears dark and stormy looking. Low ragged clouds are frequently seen below the base, and generally other forms of low cloud. Lightning, thunder and hail are characteristics of this cloud while associated weather may be moderate to heavy showers of rain, snow or hail.
Cumulus: detached clouds, generally dense and with sharp outlines, developing vertically in the form of rising mounds, domes or towers, of which the upper part often resembles a cauliflower. The sunlit parts are a most brilliant white. Their base is relatively dark and nearly horizontal.
Precipitation in the form of showers or rain or snow may occur with large cumulus.
Stratocumulus: grey or whitish patch or sheet of cloud which has dark parts composed of rounded masses or rolls which may be joined or show breaks between thicker areas. The weather associated, if any, is very light rain, drizzle or snow.
Stratus: generally grey cloud layer with a fairly uniform base, which may give precipitation in the form of drizzle. When the sun is visible through the cloud, its outline is clearly discernible.
Cloud Classification
4006. There are ten main types of cloud, categorised as low, middle and high. They are then divided into 27 different sub types.
4007. Cloud height -
High Cirrus Ci
Cirrostratus Cs 20,000’ to 40,000’
Cirrocumulus Cc
Middle Altostratus As 8,500’ to 20,000’
Altocumulus Ac
Low Cumulonimbus Cs 2,000’ to 5,000’
Cumulus Cu sometimes down to 1,000’ and up to 10,000
Stratocumulus Sc 2,000’ to 5,000’ sometimes down to 500’ and up to 8,000’
Stratus St 500’ to 2,000’ sometimes near 0’ up to 4,000’.
Cloud Amount Report Method.
4008. Cloud height is always given as a three figure group in hundreds of feet, with the last two digests omitted, eg. cloud at 700 feet is shown as 007. Cloud details are written as one group for each layer being reported eg. 6/8 of stratus at 500 feet is given as “6T005”. The ‘“6” represents the OKTAS of cloud coverage.
4009. It should be noted that visual pilots are not allowed to fly in cloud which includes fog. The amount of cloud coverage is expressed as OKTAS which relates to eighths. If the sky is completely covered with cloud, then it is said to be 8 OKTAS of cloud. If there is little cloud it could be 2 OKTAS of cloud and so on.
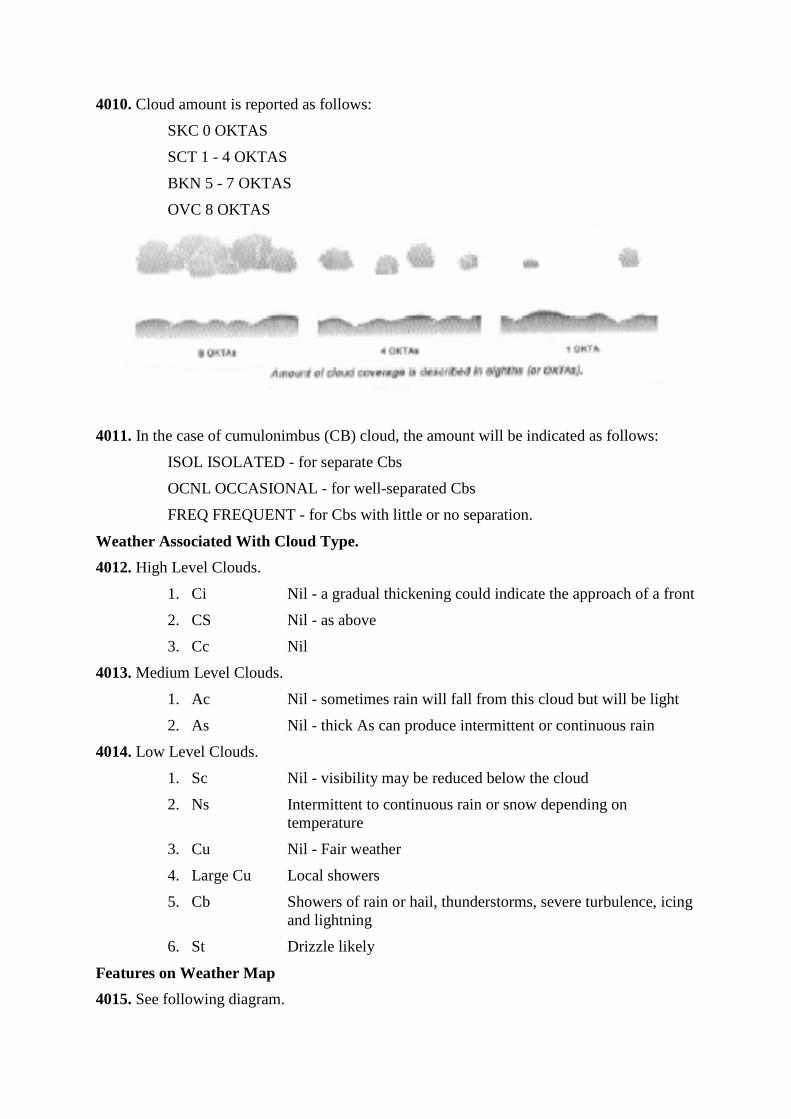
4010. Cloud amount is reported as follows:
SKC 0 OKTAS
SCT 1 - 4 OKTAS
BKN 5 - 7 OKTAS
OVC 8 OKTAS
4011. In the case of cumulonimbus (CB) cloud, the amount will be indicated as follows:
ISOL ISOLATED - for separate Cbs
OCNL OCCASIONAL - for well-separated Cbs
FREQ FREQUENT - for Cbs with little or no separation.
Weather Associated With Cloud Type.
4012. High Level Clouds.
1. Ci Nil - a gradual thickening could indicate the approach of a front
2. CS Nil - as above
3. Cc Nil
4013. Medium Level Clouds.
1. Ac Nil - sometimes rain will fall from this cloud but will be light
2. As Nil - thick As can produce intermittent or continuous rain
4014. Low Level Clouds.
1. Sc Nil - visibility may be reduced below the cloud
2. Ns Intermittent to continuous rain or snow depending on temperature
3. Cu Nil - Fair weather
4. Large Cu Local showers
5. Cb Showers of rain or hail, thunderstorms, severe turbulence, icing and lightning
6. St Drizzle likely
Features on Weather Map
4015. See following diagram.