aviation, transportation & industrials conference · • improved product recognition ......
TRANSCRIPT
New YorkMarch 13, 2018
Michael RousseauExecutive Vice President & Chief Financial Officer
at the
Aviation, Transportation & Industrials Conference
Caution Regarding Forward-Looking InformationThis presentation includes forward-looking statements within the meaning of applicable securities laws. Forward-looking statements relate to analyses and other information that are based on forecasts of future results and estimates of amounts not yet determinable. These statements may involve, but are not limited to, comments relating to preliminary results, guidance, strategies, expectations, planned operations or future actions. Forward-looking statements are identified by the use of terms and phrases such as “preliminary”, “anticipate”, “believe”, “could", “estimate”, “expect”, “intend”, “may”, “plan”, “predict”, “project”, “will”, “would”, and similar terms and phrases, including references to assumptions.
Forward-looking statements, by their nature, are based on assumptions, including those described herein and are subject to important risks and uncertainties. Forward-looking statements cannot be relied upon due to, amongst other things, changing external events and general uncertainties of the business. Actual results may differ materially from results indicated in forward-looking statements due to a number of factors, including without limitation, our ability to successfully achieve or sustain positive net profitability or to realize our initiatives and objectives, industry, market, credit, economic and geopolitical conditions, energy prices, currency exchange, competition, our dependence on technology, cybersecurity risks, our ability to pay our indebtedness and secure financing, our ability to successfully implement appropriate strategic initiatives or reduce operating costs, war, terrorist acts, epidemic diseases, airport user and related fees, high levels of fixed costs, liquidity, our dependence on key suppliers including regional carriers and Aimia Canada Inc., our success in transitioning from the Aeroplan program and launching our new loyalty program, casualty losses, employee and labour relations and costs, our ability to preserve and grow our brand, pension issues, environmental factors (including weather systems and other natural phenomena and factors arising from man-made sources), limitations due to restrictive covenants, insurance issues and costs, our dependence on Star Alliance, interruptions of service, changes in laws, regulatory developments or proceedings, pending and future litigation and actions by third parties and our ability to attract and retain required personnel, as well as the factors identified throughout this presentation and those identified in section 18 “Risk Factors” of Air Canada’s 2017 MD&A dated February 16, 2018. The forward-looking statements contained in this presentation represent Air Canada’s expectations as of the date of this presentation (or as of the date they are otherwise stated to be made), and are subject to change after such date. However, Air Canada disclaims any intention or obligation to update or revise any forward-looking statements whether as a result of new information, future events or otherwise, except as required under applicable securities regulations.
This presentation also includes references to non-GAAP measures, such as EBITDAR margins, Returns on Invested Capital, Free Cash Flow and Leverage Ratio. Please refer to Air Canada’s news release dated February 16, 2018 for additional information on non-GAAP measures, as well as major assumptions relating to Air Canada’s financial targets.
2
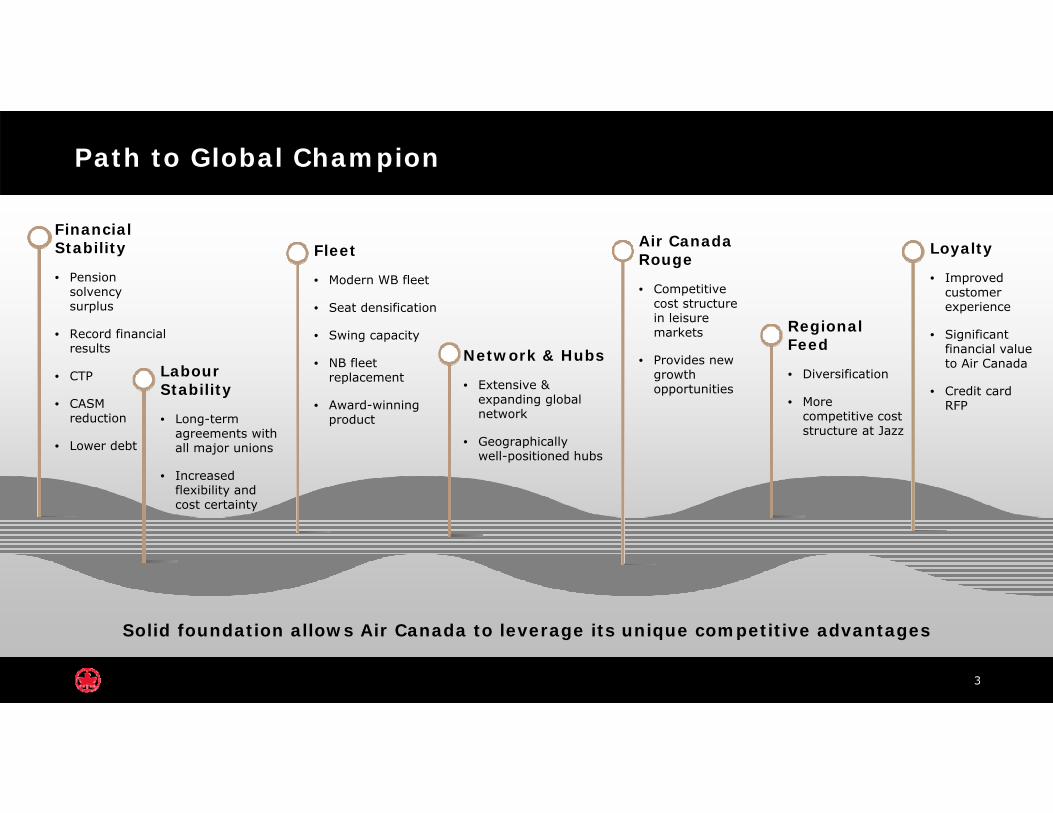
Financial Stability
• Pension solvency surplus
• Record financial results
• CTP
• CASM reduction
• Lower debt
Fleet
• Modern WB fleet
• Seat densification
• Swing capacity
• NB fleet replacement
• Award-winning product
Network & Hubs
• Extensive & expanding global network
• Geographically well-positioned hubs
Air Canada Rouge
• Competitive cost structure in leisure markets
• Provides new growth opportunities
Labour Stability
• Long-term agreements with all major unions
• Increased flexibility and cost certainty
Regional Feed
• Diversification
• More competitive cost structure at Jazz
Loyalty
• Improved customer experience
• Significant financial value to Air Canada
• Credit card RFP
Path to Global Champion
3
Solid foundation allows Air Canada to leverage its unique competitive advantages

Materially Reduced Risk Profile
• Network diversification
• Fleet flexibility
• Pool of unencumbered assets
• Long-term labour contracts
• Fully-funded pension plans
• Fuel and foreign exchange programs
• Lower leverage and cost of debt, and access to several financing sources
• Significantly higher liquidity levels
4
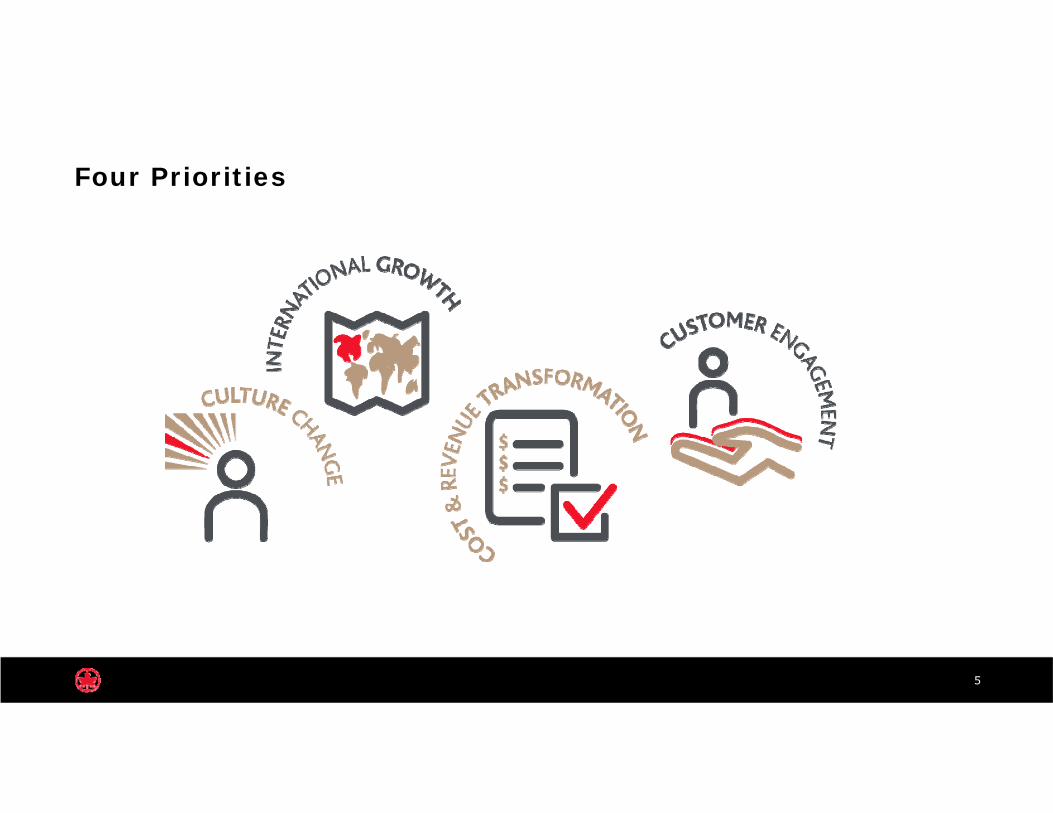
Four Priorities
5
6
1 International growth2 Cost & revenue transformation
3 Customer engagement
4 Culture change
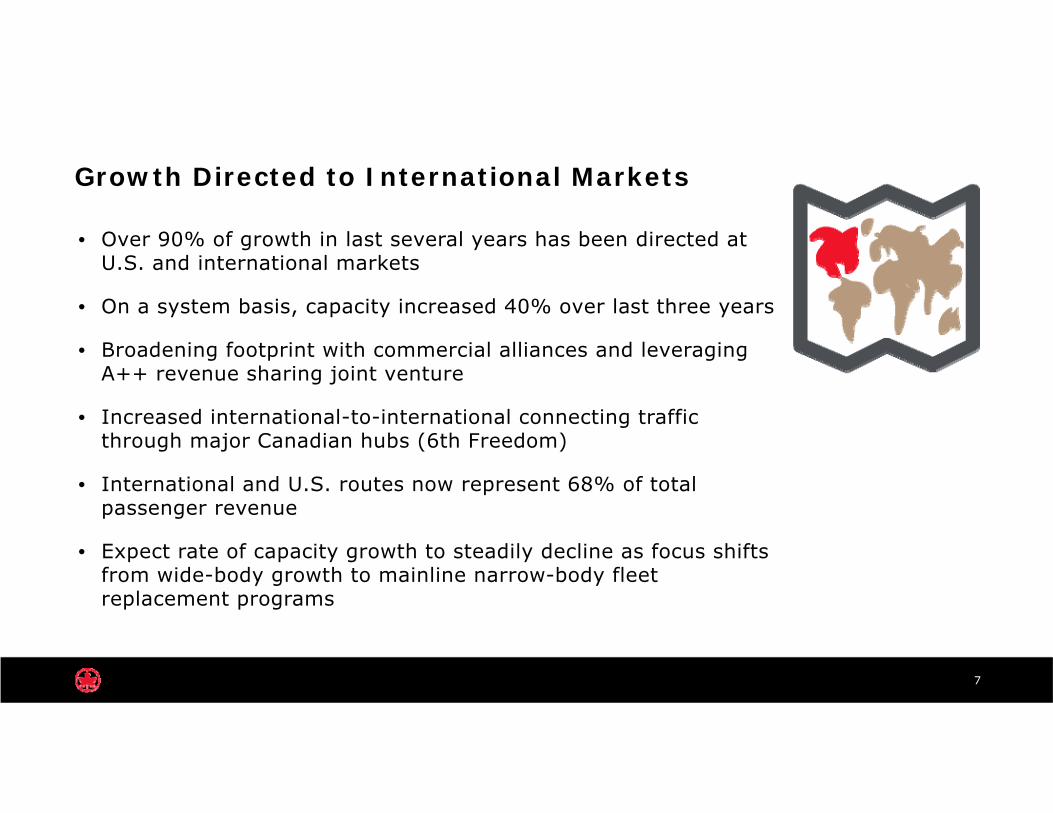
Growth Directed to International Markets
• Over 90% of growth in last several years has been directed at U.S. and international markets
• On a system basis, capacity increased 40% over last three years
• Broadening footprint with commercial alliances and leveraging A++ revenue sharing joint venture
• Increased international-to-international connecting traffic through major Canadian hubs (6th Freedom)
• International and U.S. routes now represent 68% of total passenger revenue
• Expect rate of capacity growth to steadily decline as focus shifts from wide-body growth to mainline narrow-body fleet replacement programs
7
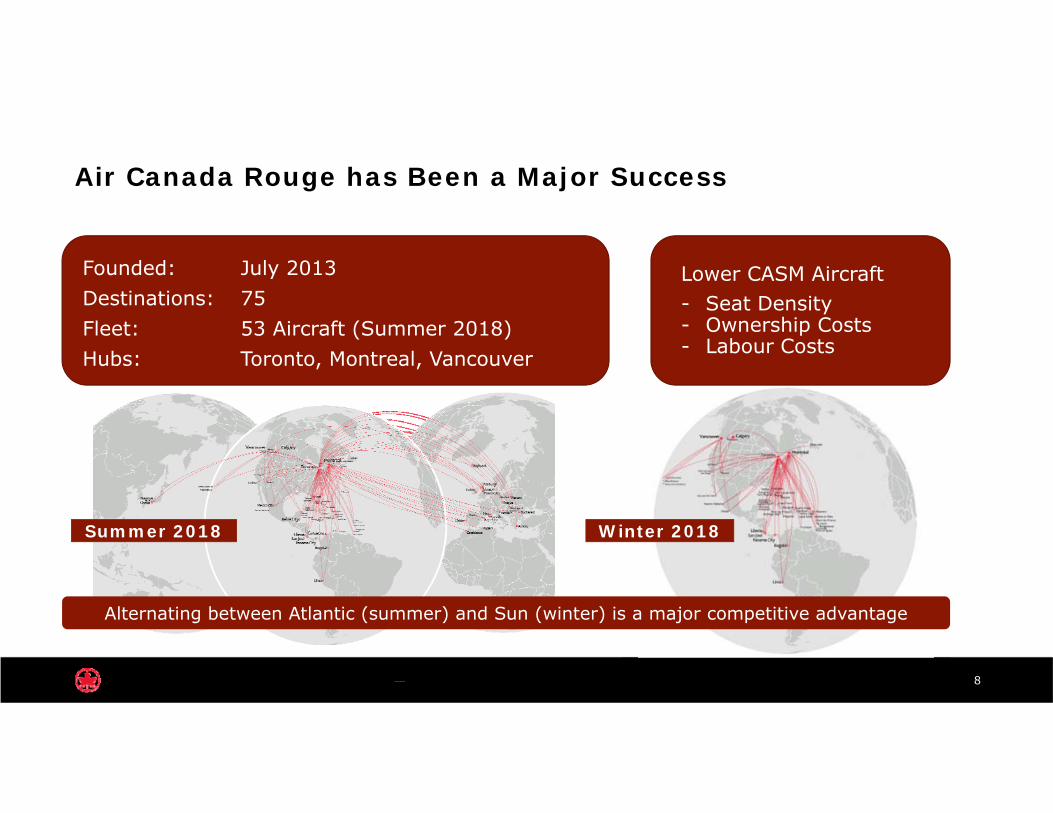
Air Canada Rouge has Been a Major Success
8
Summer 2018 Winter 2018
Alternating between Atlantic (summer) and Sun (winter) is a major competitive advantage
Founded: July 2013Destinations: 75Fleet: 53 Aircraft (Summer 2018)Hubs: Toronto, Montreal, Vancouver
Lower CASM Aircraft - Seat Density- Ownership Costs- Labour Costs
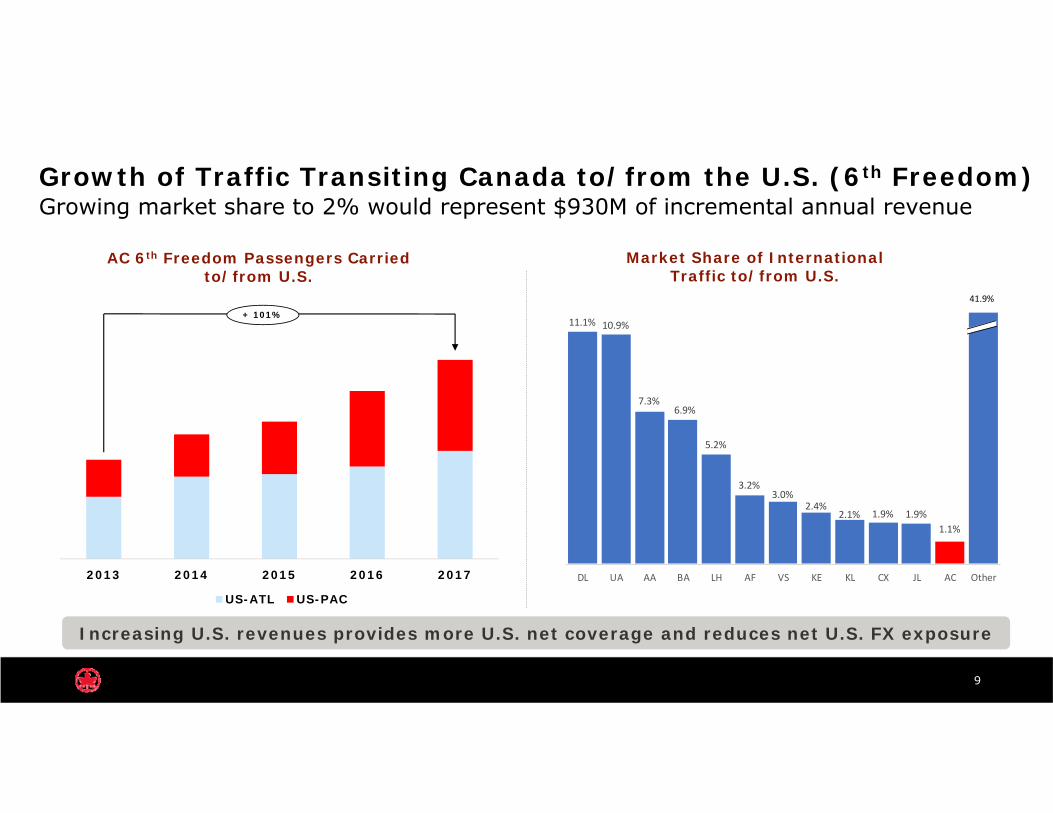
Growth of Traffic Transiting Canada to/from the U.S. (6th Freedom)Growing market share to 2% would represent $930M of incremental annual revenue
9
AC 6th Freedom Passengers Carried to/from U.S.
Market Share of InternationalTraffic to/from U.S.
Increasing U.S. revenues provides more U.S. net coverage and reduces net U.S. FX exposure
11.1% 10.9%
7.3%6.9%
5.2%
3.2%3.0%
2.4%2.1% 1.9% 1.9%
1.1%
DL UA AA BA LH AF VS KE KL CX JL AC Other
+ 101%
41.9%
2013 2014 2015 2016 2017
US-ATL US-PAC
10
1 International growth
2 Cost & revenue transformation3 Customer engagement
4 Culture change

CAGR
(in millions $)+7.0%
2015 2017201620142013
11
• Yields expected to improve
o Maturity of new routeso Stage length growth rate declineso Passenger mix impact diminisheso Focus on higher-yielding corporate customero Effective yield management through O&D
systemo Updated suite of branded fare products
• Building up diversified revenue streams
• New PSS to provide robust full retailing platform
• New loyalty program post-2020
Strong Revenue Growth Continues
14,677
16,252
12,38213,272
13,868
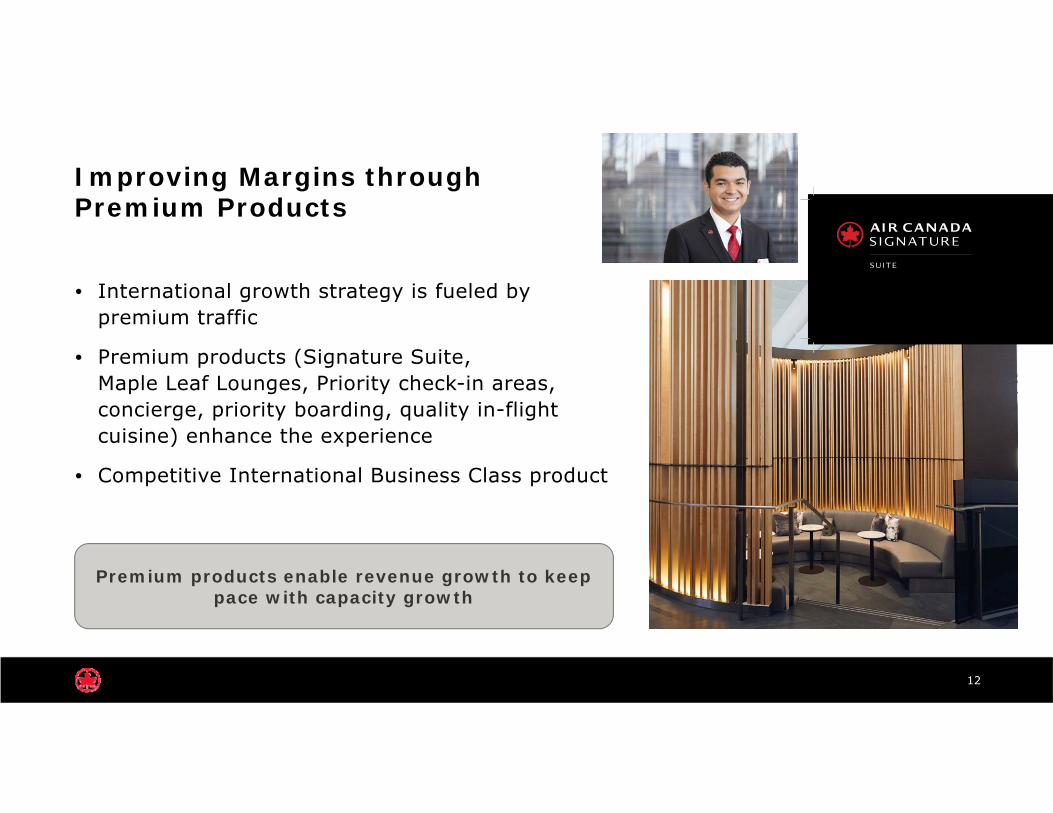
Improving Margins through Premium Products
• International growth strategy is fueled by premium traffic
• Premium products (Signature Suite, Maple Leaf Lounges, Priority check-in areas, concierge, priority boarding, quality in-flight cuisine) enhance the experience
• Competitive International Business Class product
12
Premium products enable revenue growth to keep pace with capacity growth
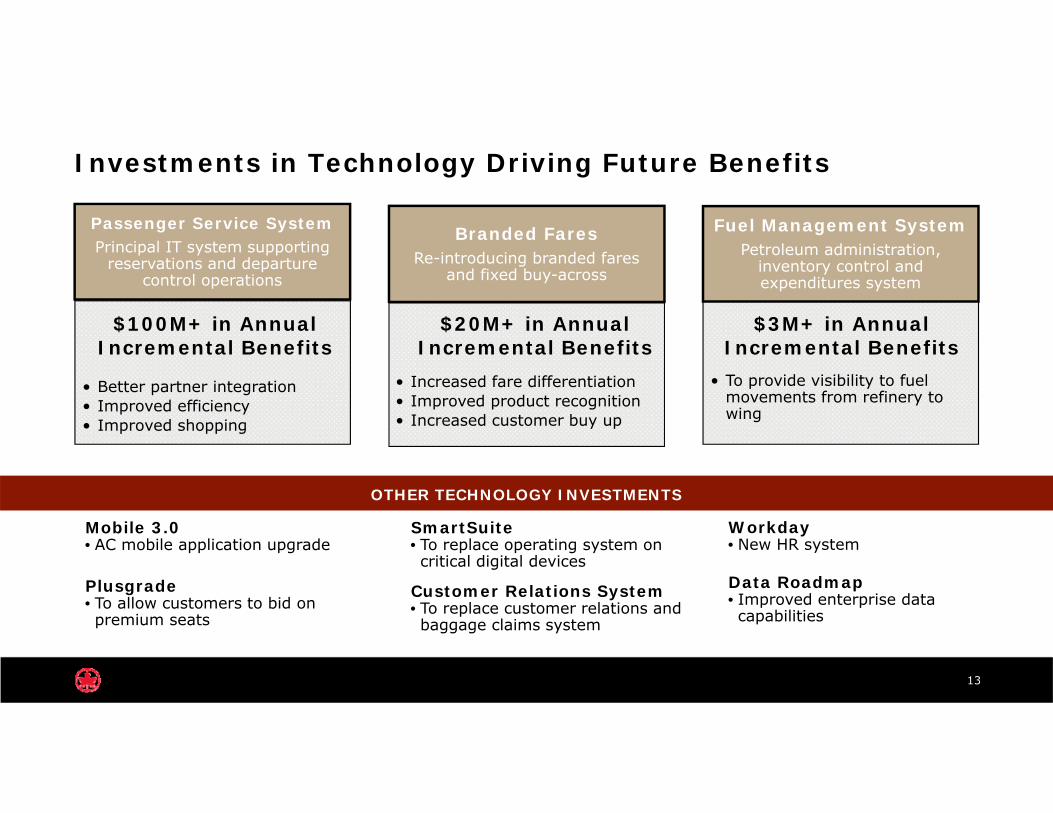
Investments in Technology Driving Future Benefits
Passenger Service SystemPrincipal IT system supporting
reservations and departure control operations
• Better partner integration• Improved efficiency• Improved shopping
Branded FaresRe-introducing branded fares
and fixed buy-across
• Increased fare differentiation • Improved product recognition • Increased customer buy up
• To provide visibility to fuel movements from refinery to wing
Fuel Management SystemPetroleum administration,
inventory control and expenditures system
13
OTHER TECHNOLOGY INVESTMENTS
Mobile 3.0• AC mobile application upgrade
Plusgrade• To allow customers to bid on premium seats
SmartSuite• To replace operating system on critical digital devices
Customer Relations System• To replace customer relations and baggage claims system
Workday• New HR system
Data Roadmap• Improved enterprise data capabilities
$100M+ in Annual Incremental Benefits
$20M+ in Annual Incremental Benefits
$3M+ in Annual Incremental Benefits
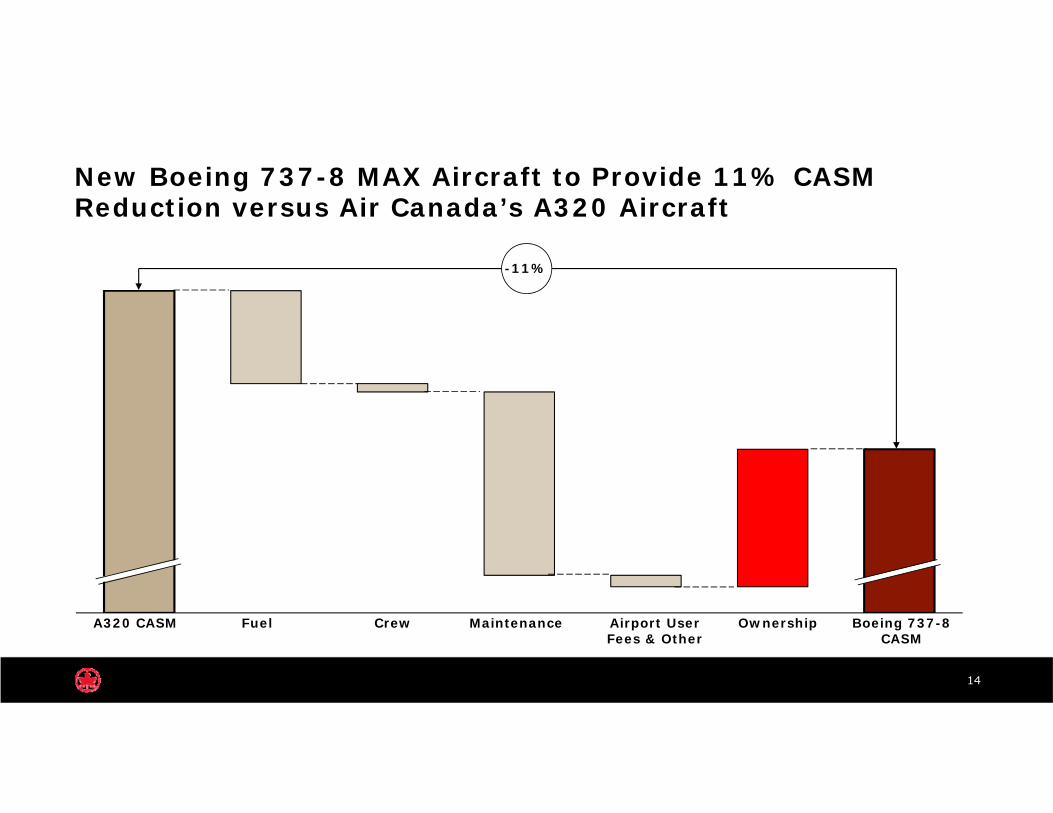
New Boeing 737-8 MAX Aircraft to Provide 11% CASM Reduction versus Air Canada’s A320 Aircraft
14
CrewFuelA320 CASM Maintenance Boeing 737-8 CASM
OwnershipAirport User Fees & Other
-11%
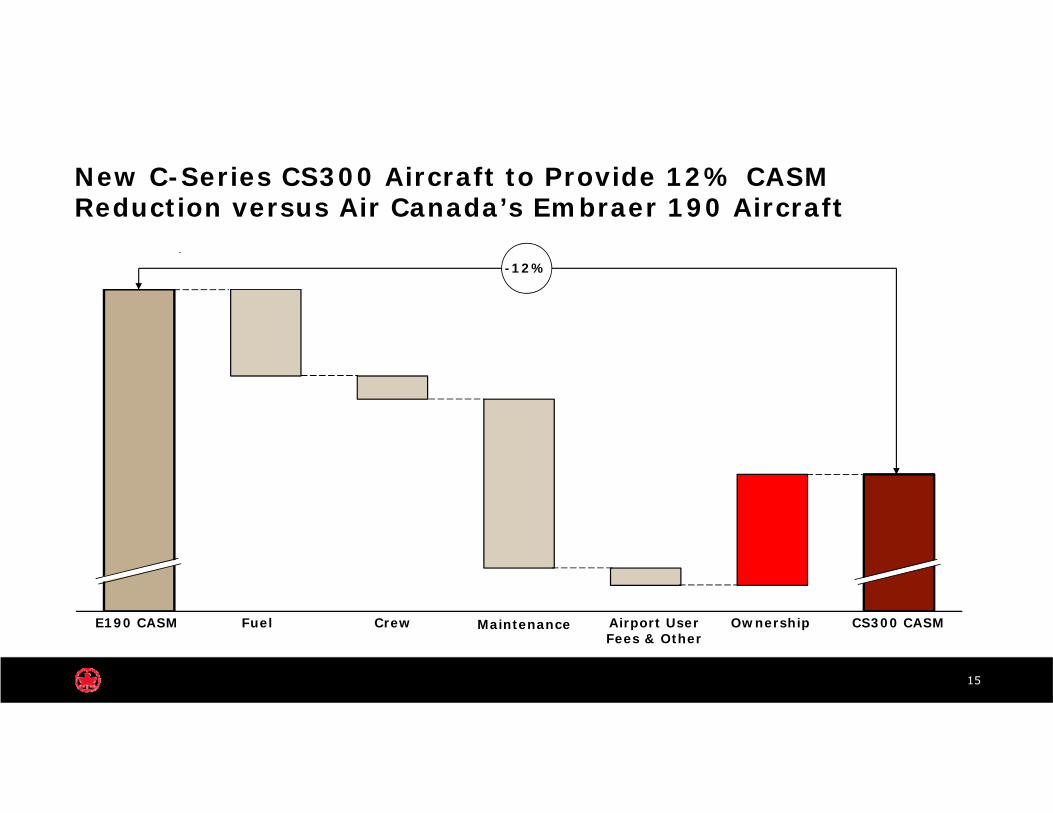
New C-Series CS300 Aircraft to Provide 12% CASM Reduction versus Air Canada’s Embraer 190 Aircraft
15
CrewFuelE190 CASM Maintenance CS300 CASMOwnership
-12%
Airport User Fees & Other
Cost Reduction Program
16
Adjusted CASM declined 6.1% over the last four years
• Company-wide initiatives – savings of $90 million in 2017
• Procurement initiatives – savings of $120 million over life of agreements
• Jazz CPA compensation declines $55 million per year from 2021
• New Cost Transformation Program to secure $250 million in savings by end of 2019

17
1 International growth
2 Cost & revenue transformation
3 Customer engagement4 Culture change
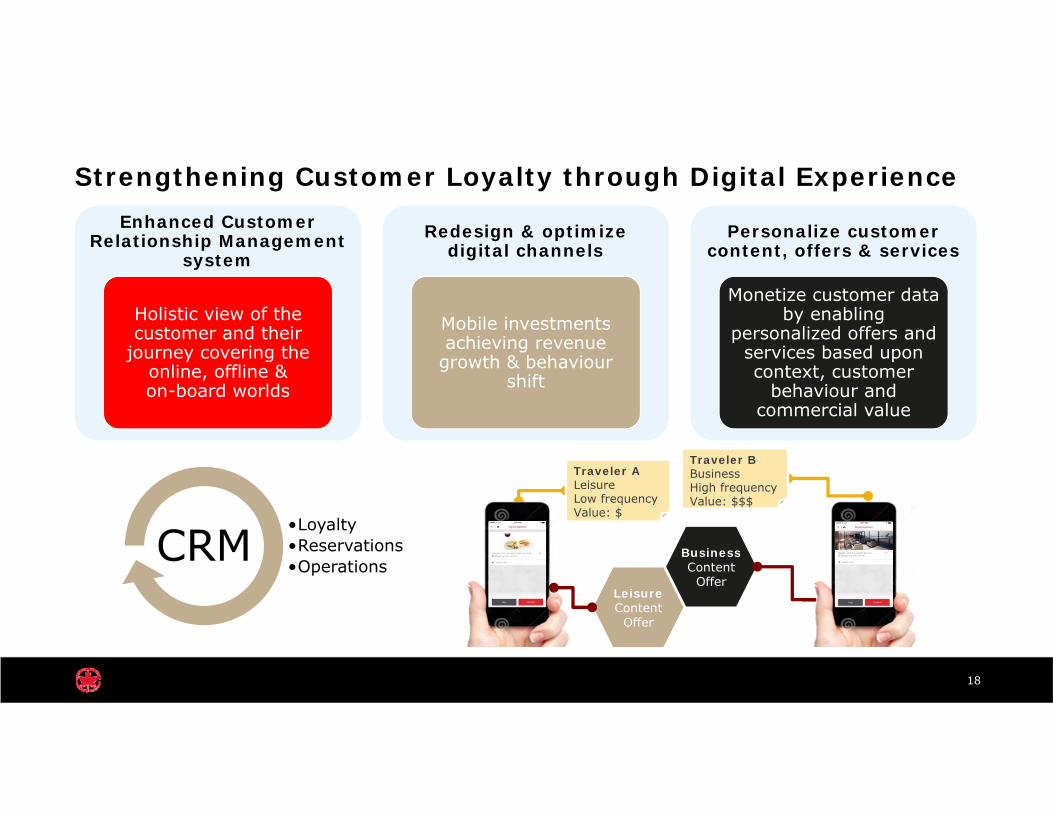
Strengthening Customer Loyalty through Digital Experience
18
Create a single view of all customers (current & prospect)
Redesign & optimize our digital channels
Enhanced Customer Relationship Management
system
Holistic view of the customer and their
journey covering the online, offline & on-board worlds
Redesign & optimize digital channels
Mobile investments achieving revenue
growth & behaviourshift
Personalize customer content, offers & services
Monetize customer data by enabling
personalized offers and services based upon context, customer
behaviour and commercial value
•Loyalty•Reservations•Operations
CRMLeisure Content
Offer
Business Content
Offer
Traveler ALeisureLow frequencyValue: $
Traveler BBusinessHigh frequencyValue: $$$

Launch of Own Loyalty Program
Expect to unlock significant value through the launch of loyalty program
– Net present value of $2.0 billion to $2.5 billion* (on a pre-tax basis) over a 15-year period
– RFP for credit card partner underway
– RFP for technology platform partner underway
– Program design in process after extensive research
* Assumes the current regulatory environment and a discount rate in line with Air Canada’s Weighted Average Cost of Capital (WACC)
19
Delivering Best Airline in North America
Numerous industry awards:
– Best Airline in North America (Skytrax)
– Four-Star ranking from Skytrax
– Best Long-Haul Airline in the Americas (AirlineRatings.com)
– 2018 Eco-Airline of the Year by Air Transport World
20
21
1 International growth
2 Cost & revenue transformation
3 Customer engagement
4 Culture change
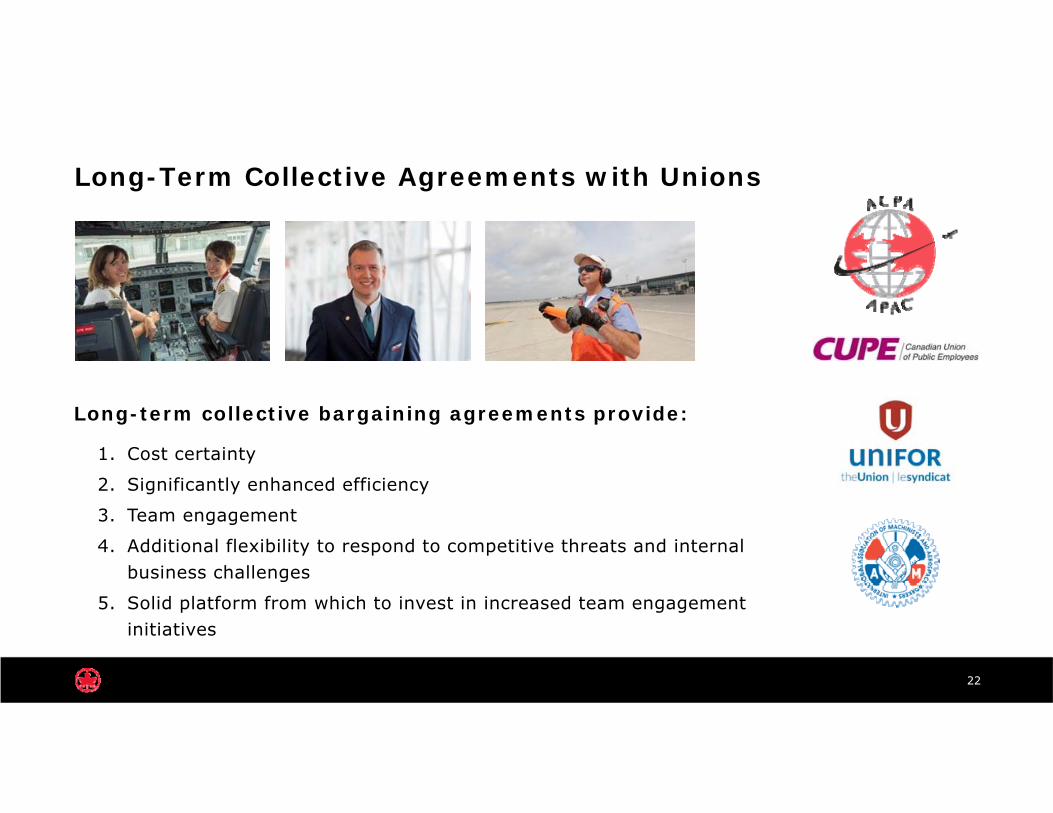
Long-Term Collective Agreements with Unions
22
Long-term collective bargaining agreements provide:
1. Cost certainty
2. Significantly enhanced efficiency
3. Team engagement
4. Additional flexibility to respond to competitive threats and internal business challenges
5. Solid platform from which to invest in increased team engagement initiatives
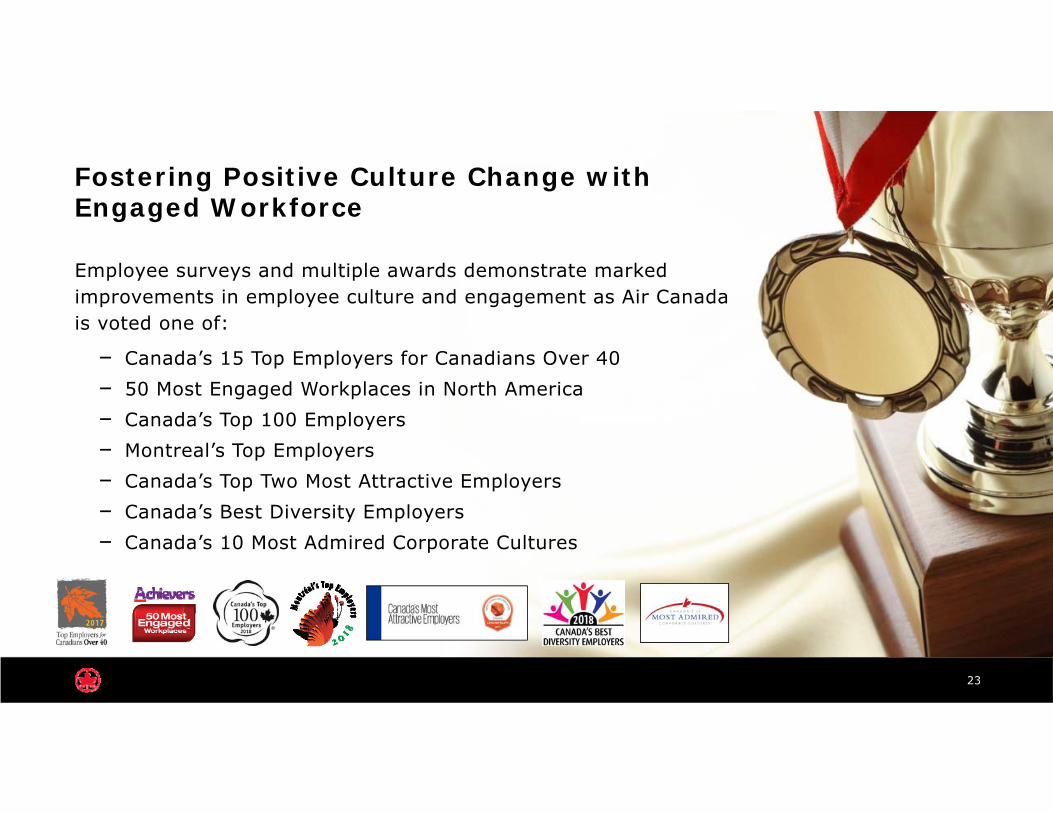
Fostering Positive Culture Change with Engaged Workforce
Employee surveys and multiple awards demonstrate marked improvements in employee culture and engagement as Air Canada is voted one of:
– Canada’s 15 Top Employers for Canadians Over 40– 50 Most Engaged Workplaces in North America– Canada’s Top 100 Employers– Montreal’s Top Employers– Canada’s Top Two Most Attractive Employers– Canada’s Best Diversity Employers– Canada’s 10 Most Admired Corporate Cultures
23
24
Financial Targets
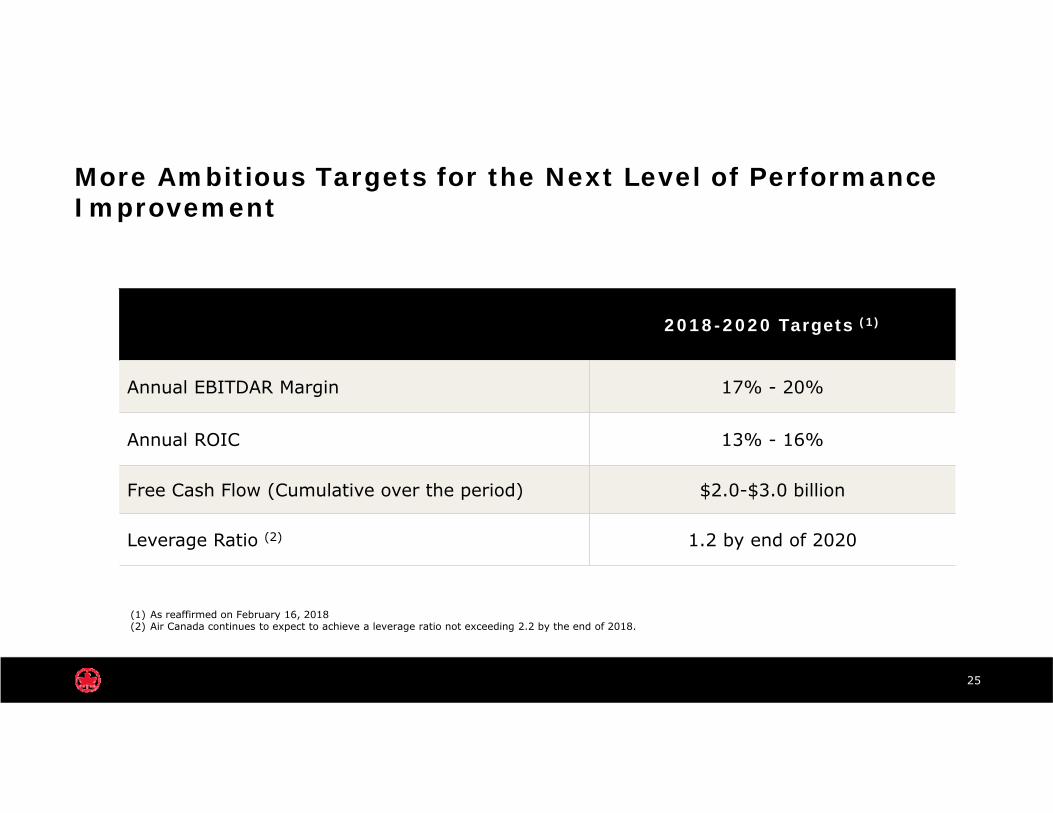
More Ambitious Targets for the Next Level of Performance Improvement
25
2018-2020 Targets (1)
Annual EBITDAR Margin 17% - 20%
Annual ROIC 13% - 16%
Free Cash Flow (Cumulative over the period) $2.0-$3.0 billion
Leverage Ratio (2) 1.2 by end of 2020
(1) As reaffirmed on February 16, 2018(2) Air Canada continues to expect to achieve a leverage ratio not exceeding 2.2 by the end of 2018.
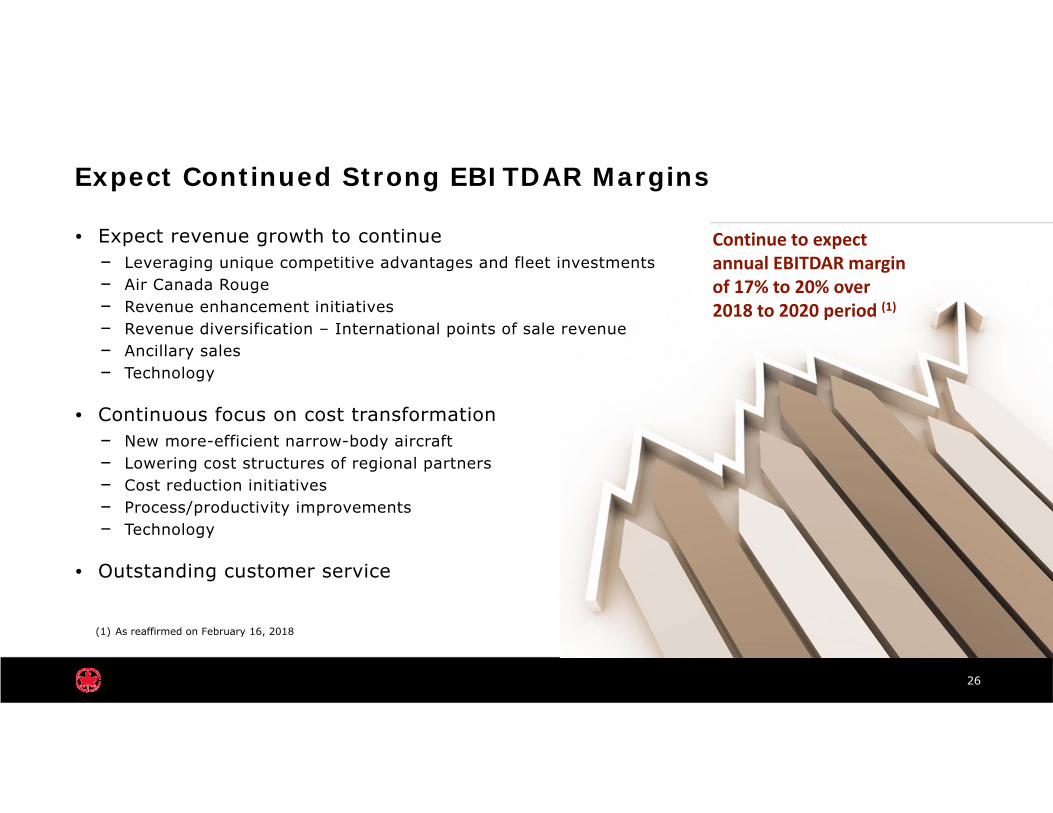
Expect Continued Strong EBITDAR Margins
26
• Expect revenue growth to continue – Leveraging unique competitive advantages and fleet investments – Air Canada Rouge – Revenue enhancement initiatives– Revenue diversification – International points of sale revenue– Ancillary sales – Technology
• Continuous focus on cost transformation– New more-efficient narrow-body aircraft– Lowering cost structures of regional partners– Cost reduction initiatives– Process/productivity improvements– Technology
• Outstanding customer service
Continue to expect annual EBITDAR margin of 17% to 20% over 2018 to 2020 period (1)
(1) As reaffirmed on February 16, 2018
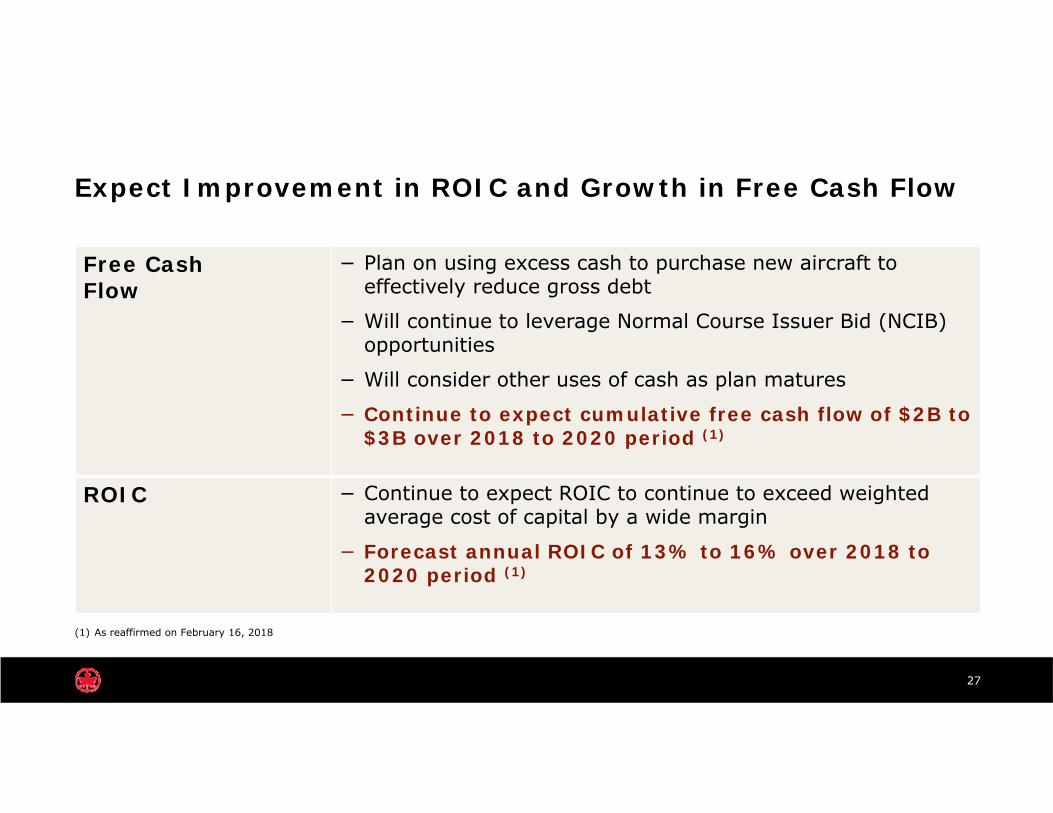
Expect Improvement in ROIC and Growth in Free Cash Flow
27
(1) As reaffirmed on February 16, 2018
Free Cash Flow
− Plan on using excess cash to purchase new aircraft to effectively reduce gross debt
− Will continue to leverage Normal Course Issuer Bid (NCIB) opportunities
− Will consider other uses of cash as plan matures
− Continue to expect cumulative free cash flow of $2B to $3B over 2018 to 2020 period (1)
ROIC − Continue to expect ROIC to continue to exceed weighted average cost of capital by a wide margin
− Forecast annual ROIC of 13% to 16% over 2018 to 2020 period (1)
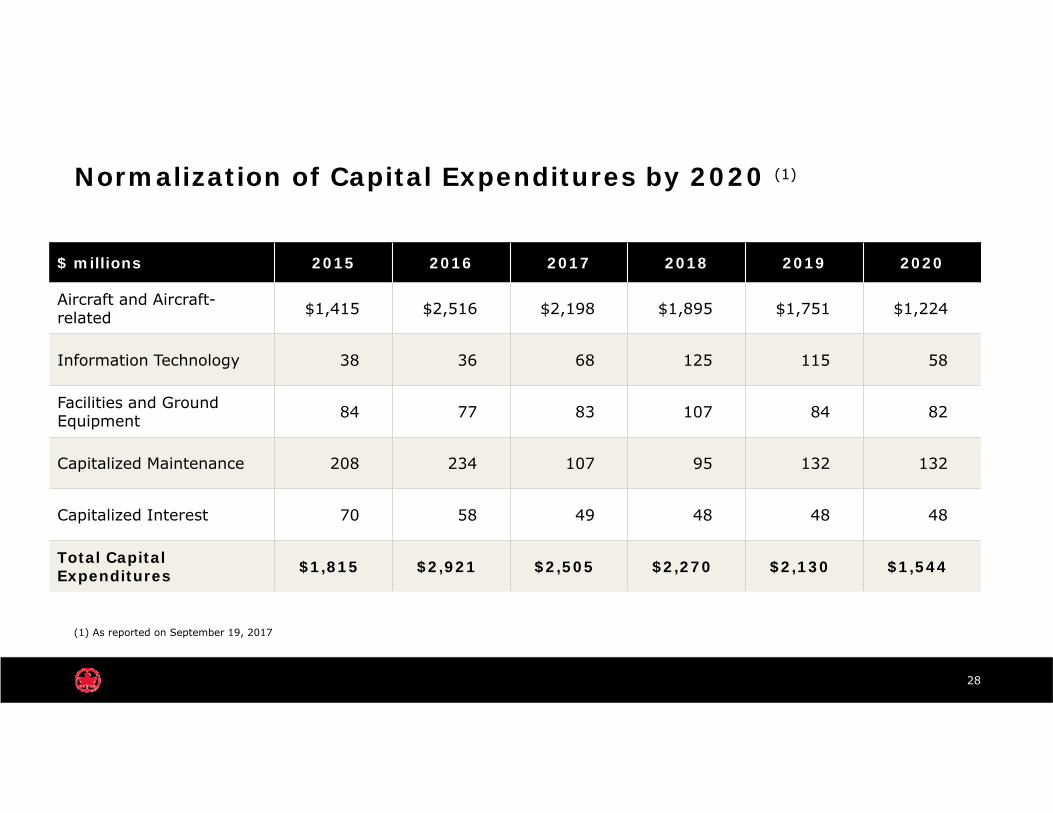
Normalization of Capital Expenditures by 2020 (1)
28
$ millions 2015 2016 2017 2018 2019 2020
Aircraft and Aircraft-related $1,415 $2,516 $2,198 $1,895 $1,751 $1,224
Information Technology 38 36 68 125 115 58
Facilities and Ground Equipment 84 77 83 107 84 82
Capitalized Maintenance 208 234 107 95 132 132
Capitalized Interest 70 58 49 48 48 48
Total Capital Expenditures $1,815 $2,921 $2,505 $2,270 $2,130 $1,544
(1) As reported on September 19, 2017
Lower Leverage Supports Investment Grade Credit Ratings
29
• Creating shareholder value by lowering gross debt and leverage remains top priority followed by shareholder distributions via share buybacks
• Forecast continued improvement in financial leverage as debt is paid off and gross debt is reduced
• Reduced overall risk profile by aggressively managing our financial leverage, leading to credit rating upgrades
– Standard & Poor’s BB- with positive outlook (from CCC+ in 2010)
– Moody’sBa3 with stable outlook (from B3 in 2010)
Continue to expect projected decline in leverage ratio to 1.2 by the end of 2020 (1) to support drive for investment grade credit ratings
(1) As reaffirmed on February 16, 2018
Air Canada – A Global Champion
• Proven strategy
• Sustainable business model
• Improved financial targets
• De-risked the airline
• Many opportunities ahead, including:
– New more efficient narrow-body aircraft
– Launch of loyalty program
– RFP for new credit card partner
– New Passenger Service System
– Digital initiatives
– Lower-cost Rouge growth
30

aircanada.com
Thank you