avoid” to kalyan jewellers india ltd
TRANSCRIPT

“AVOID” to Kalyan Jewellers India Ltd.
Frothy valuations

Salient features of the IPO: • The Kerala-based jewelry maker, Kalyan Jewellers India Ltd. (Kalyan
Jewellers) is planning to raise up to Rs. 11,750mn through an IPO, which opens on 16th Mar. and closes on 18th Mar. 2021. The price band is Rs. 86 - 87 per share.
• The issue is a combination of fresh issue and OFS. The company will not receive any proceeds from the OFS part. Of the net proceeds from the fresh issue, around Rs. 6,000mn will be utilized to fund the working capital requirement of the company. Residual funds will be used for general corporate purposes.
Key competitive strengths: • Established brand built on the core values of trust and transparency • One of India’s largest jewellery companies with a pan-India presence • Hyperlocal strategy enabling it to cater to a wide range of
geographies and customer segments • Extensive grassroots “My Kalyan” network with strong distribution
capabilities enabling deep customer outreach • Visionary promoters with strong leadership and a demonstrated track
record supported by a highly experienced and accomplished senior management team & board of directors
• Wide range of product offerings targeted at a diverse set of customers
• Robust and effective internal control processes to support a growing organization and showroom network with a pan-India presence
Risk and concerns: • Subdued macro economic environment • Unfavorable product-mix • Continued losses in the Middle East operations • Slower expansion in the showroom network • Difficulties in getting metal gold loans • Unfavorable forex movements • Intense competition Peer comparison and valuation: At higher price band of Rs. 87, the company is demanding a TTM P/S valuation of 1.2x, which is at a significant premium to the peer average of 0.4x (excluding Titan Company Ltd.). Below are a few key observations of the issue: (continued in next page) • Based on FY20 revenue, Kalyan Jewellers is one of the largest
jewellery companies in India (Source: RHP). Starting with a single showroom in Thrissur, Kerala in 1993, the company has since than expanded to become a pan-India jeweller with 107 showrooms located across 21 states and union territories in India, and also have an international presence with 30 showrooms located in the Middle East (as of 31st Dec. 2020). All the showrooms are operated and managed by it. The company also sells jewellery through its online platform www.candere.com.
• Over FY18-20, Kalyan Jewellers generated an average 78% of the total revenue from the domestic market, while the rest from the Middle East operations. In FY20 around 50% of the domestic revenue was generated outside the tier-I cities.
14th Mar. 2021
1
Recommendation AVOID Price band Rs. 86 - 87 per share Face value Rs. 10 Shares for fresh issue 91.95 - 93.02mn shares Shares for OFS 43.10 - 43.60mn shares Fresh issue size Rs. 8,000mn OFS issue size Rs. 3,750mn
Total issue size 135.06 - 136.63mn shares (Rs. 11,750mn)
Employee reservation 0.230 - 0.233mn shares (Rs. 20mn)
Net issue size 134.83 - 136.40mn shares (Rs. 11,750mn)
Bidding date 16th Mar. - 18th Mar. 2021 MCAP at higher price band Rs. 89,615mn
Enterprise value at higher price band Rs. 114,439mn
Book running lead manager
Axis Capital Ltd., Citigroup Global Markets India Pvt. Ltd., ICICI Securities Ltd., SBI Capital Markets Ltd. and BOB Capital Markets Ltd.
Registrar Link Intime India Pvt. Ltd. Sector/Industry Other Apparels & Accessories
Promoters Mr. T. S. Kalyanaraman, Mr. T. K. Seetharam and Mr. T. K. Ramesh
Issue breakup
Category Percent of issue (%) Number of shares (mn)
QIB portion 50% 67.41 - 68.20mn shares Non institutional portion 15% 20.22 - 20.46mn shares
Retail portion 35% 47.19 - 47.74mn shares Indicative IPO process time line Finalization of basis of allotment 23rd Mar. 2021
Unblocking of ASBA account 24th Mar. 2021
Credit to demat accounts 25th Mar. 2021 Commencement of trading 26th Mar. 2021 Pre and post - issue shareholding pattern
Pre-issue Post-issue Promoter & promoter group 67.99% 60.53%
Public 32.01% 39.47% Total 100.00% 100.00% Retail application money at higher cut-off price per lot Number of shares per lot 115 Employee discount Rs. 8 per share Application money Rs. 14,964 per Lot Analyst Rajnath Yadav Research Analyst (022 - 6707 9999; Ext: 912) Email: [email protected]

© CHOICE INSTITUTIONAL RESEARCH
Peer comparison and valuation (Contd…):
Company name Face value (Rs.)
CMP (Rs.)
MCAP (Rs. mn)
EV (Rs. mn)
Stock return (%) TTM
operating revenue (Rs. mn)
TTM EBITDA (Rs. mn)
TTM PAT (Rs. mn)
TTM EBITDA
margin (%)
TTM PAT
margin (%) 1 M 3 M 6 M 1 Y
Kalyan Jewellers India Ltd. 10 87 89,615 114,439 76,574 5,462 (324) 7.1% -0.4% Titan Company Ltd. 1 1,483 1,316,143 1,334,270 -0.8% 2.8% 27.0% 37.5% 188,625 15,205 7,553 8.1% 4.0% Tribhovandas Bhimji Zaveri Ltd. 10 77 5,132 10,204 -4.8% 65.6% 102.9% 238.0% 13,184 1,235 367 9.4% 2.8% PC Jeweller Ltd. 10 31 12,346 32,699 1.6% 23.8% 97.2% 164.8% 28,727 3,106 (357) 10.8% -1.2% Average 9.4% 1.8%
Company Name TTM EPS (Rs.)
BVPS (Rs.)
DPS (Rs.)
Debt equity ratio
Total asset turnover
ratio
RoE (%)
RoCE (%)
P / E (x)
P / B (x)
EV / Sales (x)
EV / EBITDA (x)
MCAP / Sales (x)
Earning yield (%)
Kalyan Jewellers India Ltd. (0.3) 32.4 0.0 1.3 0.8 -1.0% 7.6% (276.8) 2.7 1.5 21.0 1.2 -0.4% Titan Company Ltd. 8.5 75.1 5.0 0.3 1.4 11.3% 14.6% 174.3 19.7 7.1 87.8 7.0 0.6% Tribhovandas Bhimji Zaveri Ltd. 5.5 72.0 2.1 1.1 0.9 7.6% 16.4% 14.0 1.1 0.8 8.3 0.4 7.2% PC Jeweller Ltd. (0.9) 101.3 0.0 0.6 0.4 -0.9% 6.8% (34.5) 0.3 1.1 10.5 0.4 -2.9% Average 2.4 0.7 0.9 6.0% 12.6% 51.2 7.0 3.0 35.5 2.6 1.6%
Source: Choice Broking Research
Company name 3Y top-line
growth (CAGR, %)
3Y EBITDA growth
(CAGR, %)
3Y PAT growth
(CAGR, %)
3Y average EBITDA
margin (%)
3Y average PAT margin
(%)
3Y capital employed
growth (CAGR, %)
3Y CFO growth
(CAGR, %)
3Y average working capital cycle
3Y average total asset turnover
(x)
3Y average RoE (%)
3Y average RoIC (%)
Kalyan Jewellers India Ltd. -2.1% 1.9% 0.2% 6.8% 0.9% 20.1% -44.7% 187.1 1.2 3.8% 7.5% Titan Company Ltd. 14.3% 22.5% 15.3% 10.7% 7.1% 22.5% 160.7% 107.4 1.7 22.6% 22.3% Tribhovandas Bhimji Zaveri Ltd. 1.7% 22.2% 0.4% 5.2% 1.1% 7.4% 89.3% 194.4 1.3 4.0% 11.0% PC Jeweller Ltd. -26.4% -32.1% -60.6% 7.5% 2.4% 2.5% -54.0% 238.0 1.0 5.3% 9.2% Average -3.5% 4.2% -15.0% 7.8% 3.5% 10.8% 65.3% 180.0 1.3 10.7% 14.1%
• The company designs, manufactures and sells a wide range of gold, studded and other jewellery products across various price points ranging from jewellery for special occasions, such as weddings, which is its highest-selling product category, to daily-wear jewellery. Over FY18-20, the company generated an average 75.5% of the business from the sale of gold jewellery, while 22.8% was from the sales of studded jewellery. Since studded jewellery have higher gross margin as compared to other jewellery, the company in future intends to focus on this category to expand its profitability and widen the customer base.
• Kalyan Jewellers pride itself on being a trusted jeweller and has strived to establish a strong brand that its customers associate with trust & transparency. According to the Technopak Report, the company is one of the first jewellery companies in India to voluntarily have all of its jewellery BIS hallmarked as well as accompanied by a detailed pricing tag disaggregating the various components of price to aid transparency to consumers.
• One of its key competitive strengths is its ability to operate as a hyperlocal jewellery company. Kalyan Jewellers tries to cater to the customer’s unique preferences (which often vary significantly by geography and micro market), through its local market expertise and region-specific marketing strategy & advertising campaigns. The company engages local artisans to manufacture jewellery that is suited to local tastes in the markets in which it operates.
• My Kalyan is a customer outreach and service center network, which enables the company to be a neighborhood jeweller and is focused on marketing and customer engagement across urban, semi-urban and rural areas in India. My Kalyan network consists of multiple service centers that are located in a wide radius around most of its showrooms. My Kalyan personnel engage in door-to-door and other direct marketing efforts within their local communities to promote the brand, showcase product catalogue, enroll customers in the purchase advance schemes, enrich the customer database and help drive traffic to the nearest showrooms in that area. As of 31st Dec. 2020, the company had 766 My Kalyan locations. The My Kalyan network contributed 17% and 20.8% of its domestic revenue and 30.9% and 36% to the purchase advance schemes in FY20 and 9M FY21.
• During the Covid-19 pandemic led lockdown, the company has temporarily closed its business activities from mid-March to May 2020. In the Middle East it permanently closed seven showrooms. To manage pandemic related exigencies, Kalyan Jewellers availed a moratorium offered by the RBI to defer payments under a few loan agreements and also proactively availed facilities aggregating up to Rs. 1,570mn from various banks. From May 2020, the company resumed operations and by Jun. 2020, most of its showrooms were opened for business activities. With gradual improvement in the customer traffic, its operating showrooms reported a business similar to pre-Covid levels in Jul. 2020. Furthermore, in Q3 FY21, the company’s domestic revenues were higher on Y-o-Y basis.

© CHOICE INSTITUTIONAL RESEARCH
Peer comparison and valuation (Contd…):
• Kalyan Jewellers generated an average 22% of the business from the Middle East operations. However, baring FY18, the
Middle East operations were loss making over FY19-20 and for the 9M FY21. • Its business requires a substantial amount of working capital, primarily to finance the inventory (including the purchase of
raw materials). A large part of this working capital is funded by bank loans or metal gold loans. As on 31st Dec. 2020, the working capital loans outstanding were Rs. 34,389.9mn, which are repayable on demand. The company intends to use Rs. 6,000mn from the IPO net proceeds towards funding its working capital requirements.
• The reported short financial performance of Kalyan Jewellers is not encouraging and is characterized by a de-growth in top-line, but with stable profitability margins. Over FY18-20, the company reported a 2.1% CAGR decline in consolidated top-line to Rs. 101,009.2mn in FY20. The key driver for lower business growth was the domestic operations (contributing around 78% to the total revenue), which declined by 2.5% CAGR. Middle East operations also declined by 0.7% CAGR. Total operating expenditure declined by 2.4% CAGR (relatively higher than the top-line), leading to a 1.9% CAGR rise in consolidated EBITDA to Rs. 7,602.7mn in FY20. EBITDA margin expanded to 7.5% in FY20 as compared to 6.9% in FY18. One of the key reasons for margin expansion was the better business contribution from the high margin studded jewellery. Reported PAT was flat over FY18-20 to Rs. 1,430 in FY20. Kalyan Jewellers reported a positive cash flow from operating activities during FY18-20, with an average operating cash flow of around Rs. 5,838mn. Average RoIC and RoE stood at 8.8% and 4.6%, respectively.
• For the 9M FY21, consolidated revenue declined by 30.7% Y-o-Y (-24% and -55.3% Y-o-Y decline in domestic and Middle East business, respectively), mainly due the pandemic related lockdown. EBITDA declined by 36.9% Y-o-Y with 65bps contraction in margin to 7.1%. Reported PAT was at a net loss of Rs. 804.9mn as compared to a net profit of Rs. 948.9mn in same period last year.
• Based on our conservative quick estimate, we are forecasting a topline growth of -1.5% CAGR over FY20-23E to Rs. 96,435.5mn in FY23E. While EBITDA and PAT margins are expected to contract by 65bps and 42bps, respectively to be at 6.9% and 1%, respectively, as compared to 7.5% and 1.4% in FY20.
At higher price band of Rs. 87, the company is demanding a TTM P/S valuation of 1.2x, which is at a significant premium to the peer average of 0.4x (excluding Titan Company Ltd.). Thus considering the above observations we assign an “AVOID” rating for the issue.
Offer opens on 16-Mar-2021
Offer closes on 18-Mar-2021
Finalization of basis of allotment 23-Mar-2021
Unblocking of ASBA account 24-Mar-2021
Credit to demat accounts 25-Mar-2021
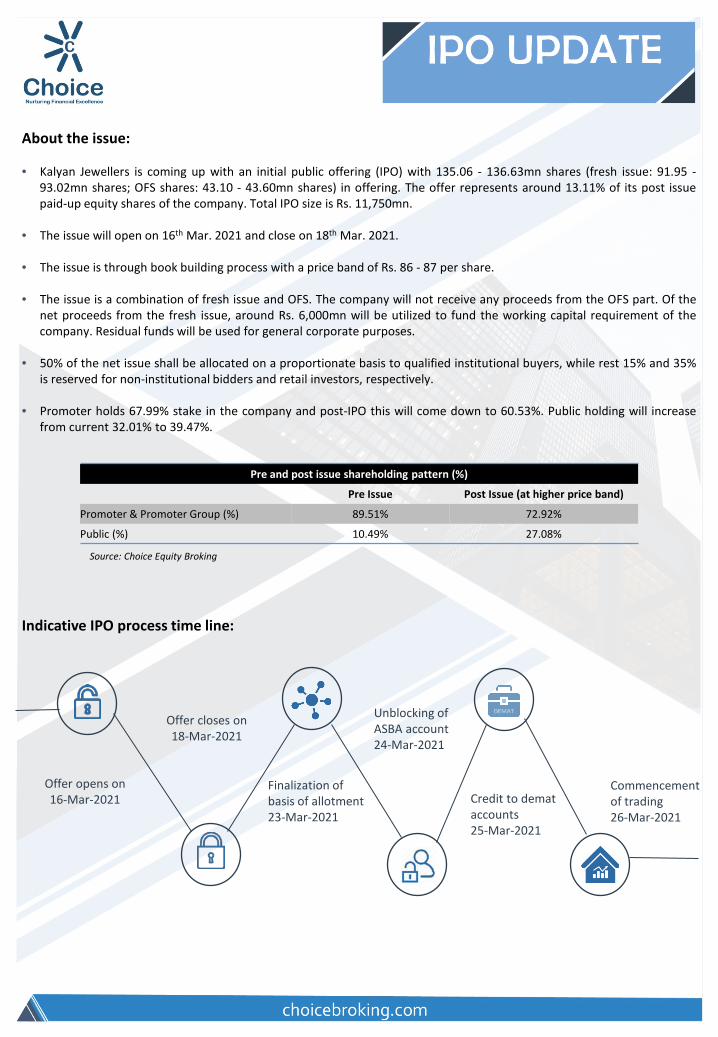
About the issue: • Kalyan Jewellers is coming up with an initial public offering (IPO) with 135.06 - 136.63mn shares (fresh issue: 91.95 -
93.02mn shares; OFS shares: 43.10 - 43.60mn shares) in offering. The offer represents around 13.11% of its post issue paid-up equity shares of the company. Total IPO size is Rs. 11,750mn.
• The issue will open on 16th Mar. 2021 and close on 18th Mar. 2021.
• The issue is through book building process with a price band of Rs. 86 - 87 per share.
• The issue is a combination of fresh issue and OFS. The company will not receive any proceeds from the OFS part. Of the net proceeds from the fresh issue, around Rs. 6,000mn will be utilized to fund the working capital requirement of the company. Residual funds will be used for general corporate purposes.
• 50% of the net issue shall be allocated on a proportionate basis to qualified institutional buyers, while rest 15% and 35% is reserved for non-institutional bidders and retail investors, respectively.
• Promoter holds 67.99% stake in the company and post-IPO this will come down to 60.53%. Public holding will increase
from current 32.01% to 39.47%.
Pre and post issue shareholding pattern (%)
Pre Issue Post Issue (at higher price band)
Promoter & Promoter Group (%) 89.51% 72.92%
Public (%) 10.49% 27.08%
Source: Choice Equity Broking
Indicative IPO process time line:
Commencement of trading 26-Mar-2021

Financial performance: The reported short financial performance of Kalyan Jewellers is not encouraging and is characterized by a de-growth in top-line, but with stable profitability margins. Over FY18-20, the company reported a 2.1% CAGR decline in consolidated top-line to Rs. 101,009.2mn in FY20. The key driver for lower business growth was the domestic operations (contributing around 78% to the total revenue), which declined by 2.5% CAGR. Middle East operations also declined by 0.7% CAGR. For the 9M FY21, consolidated revenue declined by 30.7% Y-o-Y (-24% and -55.3% Y-o-Y decline in domestic and Middle East business, respectively), mainly due the pandemic related lockdown. On TTM basis, top-line stood at Rs. 76,574.2mn (24.2% lower from the FY20 levels). Total operating expenditure declined by 2.4% CAGR (relatively higher than the top-line), leading to a 1.9% CAGR rise in consolidated EBITDA to Rs. 7,602.7mn in FY20. EBITDA margin expanded to 7.5% in FY20 as compared to 6.9% in FY18. One of the key reasons for margin expansion was the better business contribution from the high margin studded jewellery. During 9M FY21, EBITDA declined by 36.9% Y-o-Y with 65bps contraction in margin to 7.1%. On TTM basis, EBITDA stood at Rs. 5,461.8mn with a margin of 7.1%. Depreciation charge increased by 8.8% CAGR, while finance cost increased by 4.4% CAGR during FY18-20. With 57.6% CAGR rise in other income pre-tax profit increased by 1.6% CAGR. Tax expenses were higher by 3.9% CAGR, consequently, reported PAT was flat over FY18-20 to Rs. 1,430 in FY20. During 9M FY21, the company reported a net loss of Rs. 804.9mn as compared to a net profit of Rs. 948.9mn in same period last year. On TTM basis, net loss was at Rs. 323.8mn. Over FY18-20, Kalyan Jewellers reported a positive cash flow from operating activities, with an average operating cash flow of around Rs. 5,838mn. Average RoIC and RoE stood at 8.8% and 4.6%, respectively.
Source: Choice Equity Broking
Consolidated financial snapshot (Rs. mn) FY18 FY19 FY20 9M FY20 9M FY21 TTM CAGR (%) Y-o-Y (%, Annual)
Y-o-Y (%, Nine month)
Total revenue 105,479.5 97,707.6 101,009.2 79,602.0 55,167.0 76,574.2 -2.1% 3.4% -30.7% EBITDA 7,327.5 5,803.4 7,602.7 5,807.1 3,666.2 5,461.8 1.9% 31.0% -36.9% Reported PAT 1,423.7 (36.1) 1,430.0 948.9 (804.9) (323.8) 0.2%
Restated adjusted EPS 1.4 (0.0) 1.4 0.9 (0.8) (0.3) 0.2%
Cash flow from operating activities 10,431.1 3,888.9 3,195.0 1,109.7 (2,281.2) (195.8) -44.7% -17.8% NOPLAT 3,436.3 82.7 3,816.1 2,969.2 (456.1) (22,596.4) 5.4% 4516.1% FCF 1,453.8 4,300.5 (816.2) 195.8%
RoIC (%) 12.7% 0.3% 13.3% 10.6% -1.6% -81.7% 64 bps 1,303 bps (1,221) bps
Revenue growth rate (%) -7.4% 3.4% -30.7% EBITDA growth rate (%) -20.8% 31.0% -36.9% EBITDA margin (%) 6.9% 5.9% 7.5% 7.3% 6.6% 7.1% 58 bps 159 bps (65) bps EBIT growth rate (%) -32.8% 46.1% -51.1% EBIT margin (%) 5.0% 3.7% 5.2% 5.0% 3.6% 4.1% 13 bps 151 bps (148) bps Restated PAT growth rate (%) Restated PAT margin (%) 1.3% 0.0% 1.4% 1.2% -1.5% -0.4% 7 bps 145 bps (265) bps
Inventory days 208.3 212.0 200.5 182.6 308.8 302.2 -1.9% -5.4% 69.1% Debtor days 6.3 6.1 6.5 8.2 6.4 6.2 1.7% 6.1% -22.3% Payable days (31.0) (26.0) (21.2) (19.9) (31.6) (30.9) -17.3% -18.3% 58.4% Cash conversion cycle 183.5 192.1 185.8 170.9 283.6 277.5 0.6% -3.3% 65.9% Fixed asset turnover ratio (x) 5.6 4.5 4.6 3.7 2.8 3.9 -9.0% 2.5% -22.6% Total asset turnover ratio (x) 1.2 1.2 1.2 1.0 0.7 0.9 -0.2% 1.4% -32.3%
Current ratio (x) 1.1 1.1 1.1 1.1 1.2 1.2 -0.7% 1.0% 2.6% Debt to equity (x) 2.5 2.3 2.0 2.1 2.1 2.1 -8.8% -11.0% 2.6% Net debt to EBITDA (x) 5.2 6.5 4.8 6.3 10.4 7.0 -3.8% -25.9% 65.9%
RoE (%) 7.2% -0.2% 6.6% 4.5% -3.9% -1.6% (61) bps 680 bps (843) bps RoA (%) 1.7% 0.0% 1.7% 1.2% -1.0% -0.4% 7 bps 178 bps (219) bps RoCE (%) 18.4% 12.1% 17.4% 13.6% 6.7% 10.8% (93) bps 532 bps (685) bps

© CHOICE INSTITUTIONAL RESEARCH
Competitive strengths: • Established brand built on the core values of trust and transparency • One of India’s largest jewellery companies with a pan-India presence • Hyperlocal strategy enabling it to cater to a wide range of geographies and
customer segments • Extensive grassroots “My Kalyan” network with strong distribution
capabilities enabling deep customer outreach • Visionary promoters with strong leadership and a demonstrated track
record supported by a highly experienced and accomplished senior management team & board of directors
• Wide range of product offerings targeted at a diverse set of customers • Robust and effective internal control processes to support a growing
organization and showroom network with a pan-India presence
Business strategy:
• Leverage scalable business model to expand showroom network and diversify channels of distribution
• Widen product offerings to further increase the consumer reach • Leverage “My Kalyan” network to deepen customer outreach and
strengthen the distribution network in core markets • Invest in CRM, marketing and analytics to more effectively target
consumers and drive sales
Risk and concerns:
• Subdued macro economic environment • Unfavorable product-mix • Continued losses in the Middle East operations • Slower expansion in the showroom network • Difficulties in getting metal gold loans • Unfavorable forex movements • Intense competition

© CHOICE INSTITUTIONAL RESEARCH
Financial statements:
Source: Choice Equity Broking
Consolidated profit and loss statement (Rs. mn)
FY18 FY19 FY20 9M FY20 9M FY20 TTM CAGR over FY18 - 20 (%)
Annual growth over FY19 (%)
Nine month growth (%)
Total revenue 105,479.5 97,707.6 101,009.2 79,602.0 55,167.0 76,574.2 -2.1% 3.4% -30.7% Cost of sales (88,017.0) (81,983.4) (83,917.7) (66,679.8) (45,184.3) (62,422.1) -2.4% 2.4% -32.2% Excise duty on sale of goods (219.3) 0.0 -100.0% Employee benefits expense (3,687.4) (3,814.0) (3,572.3) (2,680.6) (2,345.9) (3,237.5) -1.6% -6.3% -12.5% Other expenses (6,228.3) (6,106.8) (5,916.6) (4,434.5) (3,970.8) (5,452.8) -2.5% -3.1% -10.5% EBITDA 7,327.5 5,803.4 7,602.7 5,807.1 3,666.2 5,461.8 1.9% 31.0% -36.9% Depreciation & amortization expenses (2,020.3) (2,236.2) (2,391.7) (1,790.9) (1,700.5) (2,301.2) 8.8% 7.0% -5.1%
EBIT 5,307.2 3,567.2 5,211.0 4,016.1 1,965.7 3,160.6 -0.9% 46.1% -51.1% Finance costs (3,491.8) (3,790.6) (3,803.2) (2,875.3) (2,887.8) (3,815.7) 4.4% 0.3% 0.4% Other income 322.5 432.7 801.0 397.7 330.9 734.2 57.6% 85.1% -16.8% PBT 2,137.9 209.3 2,208.9 1,538.6 (591.2) 79.1 1.6% 955.5% Tax expenses (727.9) (257.9) (786.1) (595.3) (208.3) (399.1) 3.9% 204.8% -65.0% Profit before minority interest 1,410.0 (48.6) 1,422.8 943.2 (799.5) (320.0) 0.5% Minority interest 13.8 12.6 7.2 5.63 (5.42) (3.84) -27.6% -42.7% Reported PAT 1,423.7 (36.1) 1,430.0 948.9 (804.9) (323.8) 0.2%
Consolidated balance sheet statement (Rs. mn)
FY18 FY19 FY20 9M FY20 9M FY20 TTM CAGR over FY18 - 20 (%)
Annual growth over
FY19 (%)
Nine month growth (%)
Equity share capital 8,392.4 8,392.4 8,392.4 8,392.4 8,392.4 8,392.4 0.0% 0.0% 0.0% Compulsorily convertible preference share capital 1,190.5 1,190.5 1,190.5 1,190.5 1,190.5 1,190.5 0.0% 0.0% 0.0%
Other equity 10,120.9 10,459.3 12,028.2 11,427.7 10,991.5 10,991.5 9.0% 15.0% -3.8% Non-controlling interest (23.2) (35.8) (30.3) (28.7) 4.5 4.5 14.4% -15.2%
Non current borrowings 2,809.0 1,916.2 1,349.6 1,565.0 2,281.8 2,281.8 -30.7% -29.6% 45.8% Non current lease liabilities 6,229.6 7,304.9 6,674.1 6,736.7 5,993.8 5,993.8 3.5% -8.6% -11.0% Non current provisions 199.9 239.7 306.8 292.2 343.0 343.0 23.9% 28.0% 17.4% Current borrowings 18,435.7 20,999.5 23,382.1 23,660.1 26,354.6 26,354.6 12.6% 11.3% 11.4% Current metal gold loan 19,529.3 14,964.3 11,671.4 10,535.7 8,035.3 8,035.3 -22.7% -22.0% -23.7% Current lease liabilities 714.7 680.6 903.4 880.4 834.4 834.4 12.4% 32.7% -5.2% Current financial liabilities 638.4 133.3 155.2 162.1 231.2 231.2 -50.7% 16.4% 42.7% Trade payables 7,486.4 4,194.1 5,575.6 4,922.0 5,283.8 5,283.8 -13.7% 32.9% 7.3% Current provisions 67.8 70.6 78.2 74.2 90.4 90.4 7.4% 10.8% 21.8% Other current liabilities 9,272.7 10,084.3 10,119.0 9,169.6 10,453.8 10,453.8 4.5% 0.3% 14.0% Current net tax liabilities 448.3 5.2 390.7 330.5 749.0 749.0 -6.6% 7427.4% 126.6% Total liabilities 85,512.3 80,599.1 82,186.8 79,310.3 81,229.9 81,229.9 -2.0% 2.0% 2.4%
Property, plant and equipment 10,082.9 10,897.3 10,791.9 10,594.3 9,862.4 9,862.4 3.5% -1.0% -6.9% Intangible assets 125.4 100.2 96.6 110.2 80.0 80.0 -12.3% -3.6% -27.3% Capital work-in-progress 179.9 167.1 242.3 277.9 384.5 384.5 16.0% 45.0% 38.4% Intangible assets under development 50.2 2.2 2.5 1.1 1.1 -95.6% -55.5% Right of use asset 7,904.7 9,849.4 10,110.5 9,991.6 8,405.4 8,405.4 13.1% 2.7% -15.9% Investment property 622.3 622.3 622.3 622.3 611.4 611.4 0.0% 0.0% -1.8% Goodwill on consolidation 50.6 50.6 50.6 50.6 50.6 50.6 0.0% 0.0% 0.0% Non current investments 10.6 25.6 0.0 Other non current financial assets 371.5 744.2 588.4 705.5 624.4 624.4 25.8% -20.9% -11.5% Non current net deferred tax assets 426.5 302.3 81.0 80.6 331.4 331.4 -56.4% -73.2% 311.1% Other non current assets 1,028.1 665.6 617.3 672.9 567.1 567.1 -22.5% -7.3% -15.7% Inventories 50,220.7 45,007.0 47,203.4 45,106.6 51,682.0 51,682.0 -3.1% 4.9% 14.6% Trade receivables 1,818.2 1,466.9 2,136.5 2,423.8 1,305.0 1,305.0 8.4% 45.6% -46.2% Cash and cash balances 10,179.1 8,254.5 7,501.4 7,042.3 5,510.9 5,510.9 -14.2% -9.1% -21.7% Other current financial assets 431.5 460.5 812.2 452.4 379.1 379.1 37.2% 76.4% -16.2% Other current assets 2,060.3 1,935.6 1,330.4 1,176.9 1,434.7 1,434.7 -19.6% -31.3% 21.9% Total assets 85,512.3 80,599.1 82,186.8 79,310.3 81,229.9 81,229.9 -2.0% 2.0% 2.4%

© CHOICE INSTITUTIONAL RESEARCH
Financial statements:
Note: Ratios calculated on pre-issue data; Source: Choice Equity Broking
Consolidated cash flow statement (Rs. mn)
Particulars (Rs. mn) FY18 FY19 FY20 9M FY20 9M FY20 TTM CAGR over FY18 - 20
(%)
Annual growth
over FY19 (%)
Nine month growth (%)
Cash flow before working capital changes 6,611.9 5,694.7 7,506.3 5,820.9 4,804.8 6,490.2 6.5% 31.8% -17.5% Change in working capital 3,958.5 (1,411.5) (4,242.6) (4,704.6) (6,913.8) (6,451.8) 200.6% 47.0% Cash flow from operating activities 10,431.1 3,888.9 3,195.0 1,109.7 (2,281.2) (195.8) -44.7% -17.8% Purchase of property , plant & equipment (2,837.5) (2,989.1) (1,191.5) (753.8) (248.7) (686.5) -35.2% -60.1% -67.0% Cash flow from investing activities (6,151.0) (1,236.7) 343.3 991.4 1,452.0 803.9 46.5% Cash flow from financing activities (4,503.3) (2,933.0) (3,430.6) (2,003.5) 500.7 (926.5) -12.7% 17.0%
Net cash flow (223.2) (280.7) 107.7 97.6 (328.5) (318.4) Opening balance of cash and bank balances 2,004.9 1,781.7 1,501.0 1,501.0 1,608.7 1,598.6 -13.5% -15.8% 7.2% Closing balance of cash and bank balances 1,781.7 1,501.0 1,608.7 1,598.6 1,280.2 1,280.2 -5.0% 7.2% -19.9%
Consolidated financial ratios Particulars (Rs. mn) FY18 FY19 FY20 9M FY20 9M FY20 TTM Revenue growth rate (%) -7.4% 3.4% -30.7% EBITDA growth rate (%) -20.8% 31.0% -36.9% EBITDA margin (%) 6.9% 5.9% 7.5% 7.3% 6.6% 7.1% EBIT growth rate (%) -32.8% 46.1% -51.1% EBIT margin (%) 5.0% 3.7% 5.2% 5.0% 3.6% 4.1% PAT growth rate (%) PAT margin (%) 1.3% 0.0% 1.4% 1.2% -1.5% -0.4%
Turnover ratios Inventories turnover ratio (x) 2.1 2.1 2.2 1.8 1.1 1.5 Trade receivable turnover ratio (x) 58.0 59.5 56.1 32.8 42.3 58.7 Accounts payable turnover ratio (x) 14.1 16.7 20.7 16.2 10.4 14.5 Fixed asset turnover ratio (x) 5.6 4.5 4.6 3.7 2.8 3.9 Total asset turnover ratio (x) 1.2 1.2 1.2 1.0 0.7 0.9
Return ratios RoE (%) 7.2% -0.2% 6.6% 4.5% -3.9% -1.6% RoA (%) 1.7% 0.0% 1.7% 1.2% -1.0% -0.4% RoCE (%) 18.4% 12.1% 17.4% 13.6% 6.7% 10.8%
Per share data Restated reported EPS (Rs.) 1.4 (0.0) 1.4 0.9 (0.8) (0.3) Restated DPS (Rs.) 0.0 0.0 0.0 0.0 0.0 0.0 Restated BVPS (Rs.) 19.1 19.5 21.0 20.4 20.0 20.0 Restated operating cash flow per share (Rs.) 10.1 3.8 3.1 1.1 (2.2) (0.2) Restated free cash flow per share (Rs.) 1.4 4.2 (0.8) Dividend payout ratio 0.0% 0.0% 0.0% 0.0% 0.0% 0.0%

Disclaimer This is solely for information of clients of Choice Broking and does not construe to be an investment advice. It is also not intended as an offer or solicitation for the purchase and sale of any financial instruments. Any action taken by you on the basis of the information contained herein is your responsibility alone and Choice Broking its subsidiaries or its employees or associates will not be liable in any manner for the consequences of such action taken by you. We have exercised due diligence in checking the correctness and authenticity of the information contained in this recommendation, but Choice Broking or any of its subsidiaries or associates or employees shall not be in any way responsible for any loss or damage that may arise to any person from any inadvertent error in the information contained in this recommendation or any action taken on basis of this information. This report is based on the fundamental analysis with a view to forecast future price. The Research analysts for this report certifies that all of the views expressed in this report accurately reflect his or her personal views about the subject company or companies and its or their securities, and no part of his or her compensation was, is or will be, directly or indirectly related to specific recommendations or views expressed in this report. Choice Broking has based this document on information obtained from sources it believes to be reliable but which it has not independently verified; Choice Broking makes no guarantee, representation or warranty and accepts no responsibility or liability as to its accuracy or completeness. The opinions contained within the report are based upon publicly available information at the time of publication and are subject to change without notice. The information and any disclosures provided herein are in summary form and have been prepared for informational purposes. The recommendations and suggested price levels are intended purely for stock market investment purposes. The recommendations are valid for the day of the report and will remain valid till the target period. The information and any disclosures provided herein may be considered confidential. Any use, distribution, modification, copying, forwarding or disclosure by any person is strictly prohibited. The information and any disclosures provided herein do not constitute a solicitation or offer to purchase or sell any security or other financial product or instrument. The current performance may be unaudited. Past performance does not guarantee future returns. There can be no assurance that investments will achieve any targeted rates of return, and there is no guarantee against the loss of your entire investment.
POTENTIAL CONFLICT OF INTEREST DISCLOSURE (as on date of report) Disclosure of interest statement – • Analyst interest of the stock /Instrument(s): - No. • Firm interest of the stock / Instrument (s): - No.
+91-022-6707 9999 +91-022-6707 9959 www.choicebroking.in
Choice Equity Broking Pvt. Ltd. Choice House, Shree Shakambhari Corporate Park, Plot No: -156-158,
J.B. Nagar, Andheri (East), Mumbai - 400 099.