avoidable mortality of the two main linguistic communities
TRANSCRIPT

LANGUAGE AS A DETERMINANT OF HEALTH STATUS AND SERVICE QUALITY
INSTITUT NATIONAL DE SANTÉ PUBLIQUE DU QUÉBEC
Avoidable Mortality of the Two Main Linguistic Communities in Québec


Report
Avoidable Mortality of the Two Main Linguistic Communities in Québec
Vice-présidence aux affaires scientifiques
July 2013

AUTHORS Normand Trempe, Project Manager Vice-présidence aux affaires scientifiques, Institut national de santé publique du Québec
Amadou Diogo Barry, Planning, Programming, and Research Agent Vice-présidence aux affaires scientifiques, Institut national de santé publique du Québec
Marie-Hélène Lussier, Planning, Programming, and Research Agent Vice-présidence aux affaires scientifiques, Institut national de santé publique du Québec
Ernest Lo, Planning, Programming, and Research Agent Vice-présidence aux affaires scientifiques, Institut national de santé publique du Québec
LAYOUT Hélène Fillion, Administrative Assistant Vice-présidence aux affaires scientifiques, Institut national de santé publique du Québec
ACKNOWLEDGEMENTS The authors would like to thank Dr. Linda Perron of Institut national de santé publique du Québec for carefully reading preliminary versions of the text and for her generous and very pertinent comments. However, the authors are entirely responsible for the form and content of this document. Their conclusions and recommendations do not necessary reflect those of outside readers or other persons consulted during this study.
This analysis was performed as part of the Official Language Minority Community Health Projects, an initiative funded at Institut national de santé publique du Québec by the Community Health and Social Services Network (CHSSN) under Health Canada’s Official Languages Health Contribution Program.
This document is available in its entirety in electronic format (PDF) on the Institut national de santé publique du Québec Web site at: http://www.inspq.qc.ca. Reproductions for private study or research purposes are authorized by virtue of Article 29 of the Copyright Act. Any other use must be authorized by the Government of Québec, which holds the exclusive intellectual property rights for this document. Authorization may be obtained by submitting a request to the central clearing house of the Service de la gestion des droits d’auteur of Les Publications du Québec, using the online form at http://www.droitauteur.gouv.qc.ca/en/autorisation.php or by sending an e-mail to [email protected]. Information contained in the document may be cited provided that the source is mentioned. LEGAL DEPOSIT – 3rd QUARTER 2013 BIBLIOTHÈQUE ET ARCHIVES NATIONALES DU QUÉBEC LIBRARY AND ARCHIVES CANADA ISBN: 978-2-550-62942-9 (FRENCH PDF [set]) ISBN: 978-2-550-68833-4 (FRENCH PDF) ISBN: 978-2-550-62944-3 (PDF [set]) ISBN: 978-2-550-68834-1 (PDF)
© Gouvernement du Québec (2013)

Avoidable Mortality of the Two Main Linguistic Communities in Québec
Institut national de santé publique du Québec I
ABSTRACT
This report examines the avoidable mortality rates of Québec’s two main linguistic groups, francophones and anglophones, over four periods: 1990−1994, 1995−1999, 2000−2004, and 2005−2007. The analysis was performed for Québec as a whole and for three specific areas: the Montréal census metropolitan area (CMA), all of Québec’s other census metropolitan areas (Gatineau, Québec City, Sherbrooke, Trois-Rivières, and Saguenay), and the rest of Québec, i.e., non-metropolitan areas, or non-CMAs.
Avoidable mortality refers to deaths occurring before age 75 due to causes that are known to be preventable. It is considered as an indicator of the quality of health services and public health interventions. Given advances in knowledge about the causes of disease and the means of treatment, we should ideally see a decrease in avoidable deaths, regardless of where people live or to what linguistic group they belong. We used the classification method developed by Tobias and Jackson (2001), which identifies the potential of primary, secondary, or tertiary care to reduce mortality for 62 different causes of death.
Avoidable death rates for Québec anglophones and francophones generally decreased between 1990−1994 and 2005−2007, with a few exceptions.
The avoidable mortality rate for lung cancer in anglophone women in Québec as a whole and in the Montréal CMA remained unchanged for 18 years. In the other CMAs and non-metropolitan areas, the rate seems to have increased, but it is impossible to confirm this statistically. However, the avoidable mortality rate for lung cancer in francophone women increased significantly throughout Québec.
The avoidable mortality rate for colorectal cancer decreased significantly for francophone men and women in 18 years. This decline however has not been observed among anglophones while the trend of rates is stagnated.
Other major causes of avoidable mortality, such as ischemic heart disease and breast cancer (in women), decreased considerably in both groups across Québec during the period studied, although the decreases were not always significant for the anglophone population.
Anglophones often had lower avoidable mortality rates than francophones in 1990−1994. The more rapid decrease for the latter group brought mortality rates for the two linguistic groups closer together and sometimes eliminated differences that were significant at the beginning of the period studied.
Anglophone men and women in Québec still had significantly lower rates of lung cancer, suicide, intentional injuries, traffic accidents, and chronic obstructive pulmonary disease in 2005−2007.
Reduced mortality in francophone men eliminated the difference in favor of anglophone men that had existed in 1990−1994 with respect to ischemic heart disease, colorectal cancer, and cerebrovascular disease.
Avoidable Mortality of the Two Main Linguistic Communities in Québec
II Institut national de santé publique du Québec
There were no significant differences between women in the two linguistic groups for colorectal cancer, cerebrovascular disease, and breast cancer rates throughout the entire period studied. The difference in favour of anglophones that existed for the ischemic heart disease has disappeared.

Avoidable Mortality of the Two Main Linguistic Communities in Québec
Institut national de santé publique du Québec III
TABLE OF CONTENTS
LIST OF TABLES ................................................................................................................. VLIST OF FIGURES .............................................................................................................. VIIINTRODUCTION .................................................................................................................... 11 METHODOLOGY ............................................................................................................ 3
1.1 Data sources ......................................................................................................... 31.2 Language used and correction of language data ................................................... 31.3 Geography ............................................................................................................ 41.4 Time periods ......................................................................................................... 51.5 Selected causes of death ...................................................................................... 51.6 Ages of deceased ................................................................................................. 61.7 Census data used for calculating and correcting this data ..................................... 61.8 Healthy migrant effect ........................................................................................... 71.9 Calculating avoidable mortality .............................................................................. 7
2 AVOIDABLE MORTALITY IN ANGLOPHONE AND FRANCOPHONE MEN IN QUÉBEC FOR THE PERIOD 1990 TO 2007 .................................................................. 92.1 Situation for Québec as a whole ............................................................................ 9
2.1.1 Avoidable mortality in general and by prevention type .............................. 92.1.2 Major causes of avoidable deaths .......................................................... 11
2.2 Situation in the various areas .............................................................................. 15
3 AVOIDABLE MORTALITY AMONG ANGLOPHONE AND FRANCOPHONE WOMEN IN QUÉBEC FOR THE PERIOD 1990 TO 2007 ............................................. 193.1 Situation for Québec as a whole .......................................................................... 19
3.1.1 Avoidable mortality in general and by prevention type ............................ 193.1.2 Major causes of avoidable mortality ........................................................ 20
3.2 Situation in the various areas .............................................................................. 25
4 THE MAIN FINDINGS ABOUT THE HEALTH STATUS OF QUÉBEC’S ANGLOPHONE MINORITY .......................................................................................... 29
CONCLUSION ..................................................................................................................... 31APPENDIX 1 CLASSIFICATION OF PREVENTABLE CAUSES OF DEATH BY
HUNTER NEW ENGLAND NSW HEALTH ............................................... 33APPENDIX 2 MORTALITY RATES FOR DETAILED CAUSES OF
PREVENTABLE MORTALITY BY LANGUAGE AND GENDER IN QUÉBEC AS A WHOLE AND IN INDIVIDUAL AREAS, 1990–2007 ........ 39

Avoidable Mortality of the Two Main Linguistic Communities in Québec
Institut national de santé publique du Québec V
LIST OF TABLES
Table 1 Number of avoidable deaths by linguistic group and period, Québec ............... 5
Table 2 Standardized rates of avoidable mortality (general and by prevention type) in men by mother tongue and period in Québec as a whole (adjusted rates per 100,000 inhabitants) .......................................................... 9
Table 3 The eight major causes of avoidable deaths in Québec men from 2005 to 2007 .......................................................................................................... 11
Table 4 Standardized rates of avoidable mortality due to certain specific causes in men by mother tongue and period in Québec as a whole (adjusted rates per 100,000 inhabitants) ....................................................................... 12
Table 5 Standardized rates of avoidable mortality (general and by prevention type) in MEN by area, mother tongue and period (adjusted rates per 100,000 inhabitants) ...................................................................................... 16
Table 6 Standardized rates of avoidable mortality due to certain specific causes in men by area, mother tongue, and period (adjusted rates per 100,000 inhabitants) ...................................................................................... 18
Table 7 Standardized rates of avoidable mortality (general and by prevention type) in women by mother tongue and period for Québec as a whole (adjusted rates per 100,000 inhabitants) ........................................................ 19
Table 8 The nine major causes of avoidable deaths among Québec women from 2005 to 2007 .................................................................................................. 21
Table 9 Standardized rates of avoidable mortality due to certain specific causes among women, by mother tongue and period for Québec as a whole (adjusted rates per 100,000 inhabitants) ........................................................ 22
Table 10 Standardized rates of avoidable mortality (general and by prevention type) among women, by mother tongue and period (adjusted rates per 100,000 inhabitants) ...................................................................................... 27
Table 11 Standardized rates of avoidable mortality due to certain specific causes in women by area, mother tongue, and period (adjusted rates per 100,000 inhabitants) ...................................................................................... 28
Table 12 Mortality rates for detailed causes of preventable mortality by language in men in Québec as a whole and in individual areas, 1990–2007 ................. 41
Table 13 Mortality rates for detailed causes of preventable mortality by language in women in Québec as a whole and in individual areas, 1990–2007 ............ 45


Avoidable Mortality of the Two Main Linguistic Communities in Québec
Institut national de santé publique du Québec VII
LIST OF FIGURES
Figure 1 Map of areas studied ....................................................................................... 4
Figure 2 General, primary, secondary, and tertiary avoidable mortality rates in francophone and anglophone men in Québec (adjusted rates per 100,000 inhabitants) ...................................................................................... 10
Figure 3 Avoidable mortality rates due to lung cancer and ischemic heart disease in francophone and anglophone men in Québec (adjusted rates per 100,000 inhabitants) ...................................................................................... 13
Figure 4 Avoidable mortality rates due to suicide, intentional injuries, and traffic accidents in francophone and anglophone men in Québec (adjusted rates per 100,000 inhabitants) ....................................................................... 14
Figure 5 Avoidable mortality rates due to chronic obstructive pulmonary disease in francophone and anglophone men in Québec (adjusted rates per 100,000 inhabitants) ...................................................................................... 14
Figure 6 Avoidable mortality rates due to colorectal cancer in francophone and anglophone men in Québec (adjusted rates per 100,000 inhabitants) ........... 15


Avoidable Mortality of the Two Main Linguistic Communities in Québec
Institut national de santé publique du Québec 1
INTRODUCTION
This analysis is part of a major initiative to improve our knowledge of the health status of Québec’s anglophone linguistic minority community.
The concept of avoidable mortality was first introduced in 1970 by the Working Group on Preventable and Manageable Diseases directed by David Rustein of the Harvard Medical School in the United States. They introduced the notion of premature death and proposed a list of causes of death that can be prevented by timely and appropriate treatment.1 This work served as a starting point for examining avoidable mortality, and many researchers used it as a basis for their own work. The first studies focused mainly on evaluating health services, and the causes of death were chosen accordingly. The primary interest was in deaths that could be prevented by medical and hospital care, otherwise known as amenable mortality.2
As knowledge advanced, more recent work focused on distinguishing more clearly between causes of death that are amenable to intervention of a more medical nature, called secondary or tertiary prevention, and those sensitive to population-based interventions that are often beyond the direct control of health services, known as primary prevention.
This approach was adopted in 1998 by Simonato et al.,3
Tobias and Jackson
who divided avoidable causes into three categories: primary avoidable mortality, secondary avoidable mortality, and tertiary avoidable mortality.
4 refined this approach in 2001. They increased the number of causes of avoidable death from 24 to 56 and considered deaths before age 75 rather than age 64.5
After an extensive literature review, they attributed a relative weight to each cause, based on the three prevention categories. They then submitted the weightings to an expert committee of clinicians and epidemiologists before drawing up a final list. Researchers at the Hunter New England Area Health Service in Australia modified this list slightly in 2003 after comparing version 9 and version 10 of the International Classification of Diseases (ICD) coding system. We used their list, which is presented in Appendix 1 with the weights for each cause based on the three prevention categories.
1 McKee, M. “For debate--Does health care save lives?” Croat Med. J. 1999, 40:123−128. 2 “Amenable mortality is a subset of the broader construct of avoidable mortality, which includes deaths from
causes that can be prevented (incidence reduction) as well as those that can be treated (case fatality reduction). Avoidable mortality therefore reflects influences from well beyond the boundaries of the health care system as conventionally defined. By contrast, amenable mortality provides a more specific and focused indicator of health care performance.”
3 Simonato, L., Ballard, T., Bellini, P., and Winkelmann, R. “Avoidable mortality in Europe 1955−1994: a plea for prevention.” J. Epidemiol Community Health 1998, 52: 624−630.
4 Tobias, M., Jackson G. “Avoidable mortality in New Zealand.” 1981−97. Aust N Z J Public Health 2001, 25: 12−20
5 All deaths due to other causes or occurring after age 75 are not considered to be avoidable.
Avoidable Mortality of the Two Main Linguistic Communities in Québec
2 Institut national de santé publique du Québec
Our analysis puts all deaths that could have been prevented by changes in personal behavior (changes in lifestyle habits) or actions at the population level (public health policies) under the “primary avoidable mortality” heading. The objective of primary prevention is to stop the disease from appearing in the first place.
Deaths that could have been prevented through early screening and intervention associated with primary health care are classified under the heading “secondary avoidable mortality.” The objective of secondary prevention is to detect the disease early and slow its progression.
Lastly, deaths that could have been reduced through medical and surgical treatments are grouped under the heading “tertiary avoidable mortality.” This mainly refers to the ability of the medical and hospital system to make accurate diagnoses, act quickly and effectively (prehospital emergency care), and provide good medical and surgical care. The objective of tertiary prevention is to reduce the disease fatality rate.
The following three examples illustrate how avoidable deaths are categorized as primary, secondary, or tertiary. According to the committee of experts set up by Tobias and Jackson, 95% of deaths due to lung cancer could have been avoided by primary prevention and 5% by surgery, chemotherapy, or radiotherapy. Consequently, 95% of the total number of deaths due to lung cancer were classified under “primary avoidable mortality” and 5% under “tertiary avoidable mortality.”
Fifty percent of deaths due to ischemic heart disease could have been prevented by primary prevention, 25% by secondary prevention, and 25% by tertiary prevention. Therefore 50%, 25%, and 25% of the total number of deaths were attributed to each of the three categories.
Lastly, 50% of deaths due to breast cancer could have been prevented by tertiary prevention, 35% by secondary prevention, and only 15% by primary prevention. Deaths due to breast cancer are therefore distributed between the three categories in the same proportions.
The Canadian Institute for Health Information presents three detailed case studies on ischemic heart disease, lung cancer, and breast cancer that help explain the complexity of the interaction between primary, secondary, and tertiary level interventions in reducing mortality due to a specific disease. We invite the reader to have a look at these examples.6
6 Canadian Institute for Health Information, Health Indicators 2 https://secure.cihi.ca/free_products/health_
indicators_2012_en.pdf.
Avoidable Mortality of the Two Main Linguistic Communities in Québec
Institut national de santé publique du Québec 3
1 METHODOLOGY
1.1 DATA SOURCES
The mortality data used in the numerator (1990 to 2007) are from Ministère de la Santé et des Services sociaux death records.
The data from the four surveys used for the denominator were specially ordered from Statistics Canada.
1.2 LANGUAGE USED AND CORRECTION OF LANGUAGE DATA
The only indicator of linguistic affiliation on Québec death records is the language spoken at home by the deceased, which is entered on the death certificate normally filled out by a health care worker. We analyzed the reliability of the “language spoken at home” variable from death records in a previous document published in this collection.7
A number of answer combinations are possible, and we selected only the francophone and anglophone groups. Deaths for which the recorded language spoken at home was French only or French and a language other than English were categorized as “francophone.” Deaths where the recorded language spoken was English only or English and a language other than French were classified as “anglophone”.
The language spoken at home is also available from the Canadian census, which is the other required data source for calculating mortality rates.
8
Many death certificates do not include information on language (average of 11.3% from 1990 to 2007). We applied multiple imputation
Deaths where both languages were recorded (bilingual) or where a language other than French or English (allophone) was given were not used in our analysis.
9 10 to all the data (all causes combined) to allocate a language of use to deaths of unknown language affiliation.11 The imputation was based on age, gender, birthplace (Québec, another Canadian province, foreign country), and social deprivation quintile12 distributions, and the known proportion of anglophone deaths per dissemination area. Given the qualitative nature of the language variable, we used discriminant function analysis,13
7 Trempe, et al. La validité de la variable “Langue d’usage à la maison” du Fichier des décès du Québec. Institut
national de santé publique du Québec, 2012.
a statistical technique that generated five probable values for
8 Statistics Canada uses this classification system for the census. 9 Raghunathan, T.E. “What do we do with missing data? Some options for analysis of incomplete data.” Annu
Rev Public Health 2004, 25: 99−117. 10 Sterne, J.A.C., White, I.R., Carlin, J.B., Spratt, M., Royston, P., Kenward, M.G., Wood, A.M, and Carpenter
J.R. “Multiple imputation for missing data in epidemiological and clinical research: potential and pitfalls.” BMJ 338.
11 Imputation of language was performed for all deaths, not only for those of people under 75 years of age. 12 Pampalon, R., Hamel. D., Gamache. P., and Raymond. G. A deprivation index for health planning in Canada.
2009. 13 SAS Institute Inc. The MI procedure. Cary, NC: SAS; 2004
Avoidable Mortality of the Two Main Linguistic Communities in Québec
4 Institut national de santé publique du Québec
each missing value. The process gave rise to five complete death records, and each record was analyzed separately before estimating the average of their results.
After the imputations, the total number of deaths increased in each linguistic group, but their proportional distribution remained identical. The average of the five imputations attributed 124,473 deaths to the “French” language use group and 14,321 to the “English” language use group for the period studied. All our analyses used the results of these imputations.
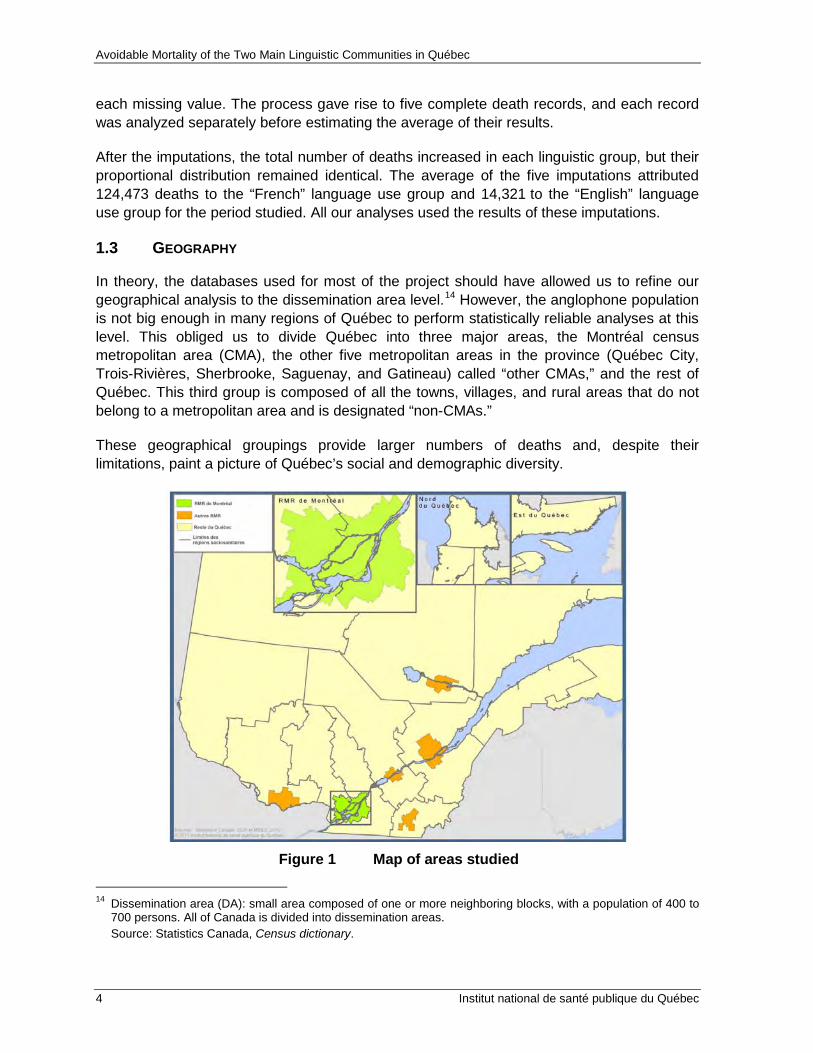
1.3 GEOGRAPHY
In theory, the databases used for most of the project should have allowed us to refine our geographical analysis to the dissemination area level.14
These geographical groupings provide larger numbers of deaths and, despite their limitations, paint a picture of Québec’s social and demographic diversity.
However, the anglophone population is not big enough in many regions of Québec to perform statistically reliable analyses at this level. This obliged us to divide Québec into three major areas, the Montréal census metropolitan area (CMA), the other five metropolitan areas in the province (Québec City, Trois-Rivières, Sherbrooke, Saguenay, and Gatineau) called “other CMAs,” and the rest of Québec. This third group is composed of all the towns, villages, and rural areas that do not belong to a metropolitan area and is designated “non-CMAs.”
Figure 1 Map of areas studied
14 Dissemination area (DA): small area composed of one or more neighboring blocks, with a population of 400 to
700 persons. All of Canada is divided into dissemination areas. Source: Statistics Canada, Census dictionary.

Avoidable Mortality of the Two Main Linguistic Communities in Québec
Institut national de santé publique du Québec 5
Census metropolitan areas (CMAs) are the geographical units used by Statistics Canada and correspond to an area composed of one or more neighboring municipalities situated around an urban core. A CMA must have a population of at least 100,000 inhabitants, of which at least 50,000 live in the urban core.15
Table 1 presents 2006 population numbers and the numbers of deaths for the entire study period.
1.4 TIME PERIODS
We based our work on Portrait de santé du Québec et de ses régions (2011) produced by INSPQ, using the same periods to group deaths: 1990-1994, 1995-1999, 2000−2004, and 2005−2007.
The number of avoidable deaths recorded in Québec between 1990 and 2007, after correction for missing language data, was 294,237: 257,102 (87.4%) of these deaths had French as the declared language of use, 25,597, (8.7%), English as the declared language of use, 1,853 had both languages (0.6%), and 9,686 another language (3.3%), (See table 1).
Table 1 Number of avoidable deaths by linguistic group and period, Québec
French English Bilingual Allophone Total
1990−1994 72,142 7,695 561 2,921 83,319
1995−1999 69,215 7,147 459 2,865 79,687
2000−2004 73,333 6,933 508 2,573 83,346
2005−2007 42,411 3,822 325 1,327 47,885
Total 257,102 25,597 1,853 9,686 294,237
The last period is shorter than the others because data for 2008 and 2009 was unavailable when the analyses were conducted.
1.5 SELECTED CAUSES OF DEATH
The work of Tobias and Jackson covered the years prior to 2000 and only used version 9 of the international classification of diseases coding system (ICD-9). Since the 10th version (ICD-10) was used for Québec death records starting in 2000, we needed to compare ICD-9 with ICD-10 to select the initial causes of death recorded as of 2000.
15 For more information go to the Statistics Canada website: http://www12.statcan.gc.ca/census-
recensement/2011/ref/dict/index-eng.cfm.
Avoidable Mortality of the Two Main Linguistic Communities in Québec
6 Institut national de santé publique du Québec
We found this comparison on the website of Hunter New England Area Health Services, New South Wales, Australia.16
The move from ICD-9 to ICD-10 in 2000 created a break in the temporal analysis of a number of causes of death. Two key factors explain this phenomenon. Certain diseases were moved to other categories or divided into subcategories, and certain rules and instructions for selecting the initial cause of death were changed. Most causes of death were little affected, by the change, and comparing data before and after 2000 is not a problem in these cases. However, the effect on certain causes of death was more significant and in some cases explains the differences in temporal trends. A number of studies were performed worldwide to verify the scope of the changes.
They worked closely with Tobias and Jackson and they use the same weighting method for causes of avoidable deaths based on the contribution of each of the prevention types (primary, secondary, and tertiary). They drew up a list of 62 causes of death. This list, which we used, is slightly different than that of Tobias and Jackson (2001), who had selected 56 causes.
17 18 19 20 21
Since the break affects anglophones as much as francophones, it is unlikely that it distorts the comparative analysis between the two linguistic groups.
The two Québec studies cited provide a much more exhaustive review of these than ours does.
1.6 AGES OF DECEASED
Age is also a criteria used in analyzing avoidable mortality. Tobias and Jackson used an age range of 0 to 75 years, and excluded deaths after age 75.22
1.7 CENSUS DATA USED FOR CALCULATING AND CORRECTING THIS DATA
We used the same age range, except for leukemia, where the maximum age was under 44, a change that was also suggested by NSW Health. Some researchers use different age breakdowns, but we preferred to keep the one Tobias and Jackson used in their original work.
We used Statistics Canada population data from the 1991, 1996, 2001, and 2006 censuses as denominators for the mortality rates. These denominators concern the total population under 75, broken down by age, gender, language spoken at home, and geographical area.
16 http://www2.hnehealth.nsw.gov.au/hneph/HHNE/toc/app_icd_diag.htm. 17 Brock et al. “The effect of the introduction of ICD-10 on cancer mortality trends in England and Wales.” Health
Stat Q. 2004 Autumn;(23): 7−17. London, England. 18 Brock et al. “The impact of introducing ICD-10 on analysis of respiratory mortality trends in England and
Wales.” Health Stat Q. 2006 Spring (29): 9−17. London, England. 19 Griffiths et al. “The impact of introducing ICD-10 on trends in mortality from circulatory diseases in England and
Wales.” Health Stat Q. 2004 Summer;(22): 14−20. London, England. 20 Paquette et al. Proposition pour l'analyse des séries temporelles des données de mortalité selon la cause au
Québec à la suite de l'adoption de la 10 E révision de la classification internationale des maladies, Institut national de santé publique du Québec, 2006.
21 Anderson et al. “Comparability of cause of death between ICD-9 and ICD-10: preliminary estimates.” Natl Vital Stat Rep. 2001 May 18; 49(2): 1−32. CDC, Atlanta.
22 Note that deaths before age 75 are not all avoidable, but some of them could be avoided if certain effective measures were put in place.

Avoidable Mortality of the Two Main Linguistic Communities in Québec
Institut national de santé publique du Québec 7
This data was corrected to add residents of collective households who are not included in census data on language spoken at home (census long form).23
This correction is based on estimates and projections by Institut de la statistique du Québec using Canadian census data.
We also corrected the data to counter the undercoverage inherent to the census itself (individuals not included in the census) as well as to obtain the population on July 1 (in the middle of the year) as the census data are collected in May.
An adjustment was then applied to obtain the population in the middle of each of the four periods we studied (1992, 1997, 2002, and 2006).
1.8 HEALTHY MIGRANT EFFECT
Québec has a large percentage of immigrants whose language is other than French or English. About 80% of them live in the greater Montréal area and many speak English or French at home; in theory, this is the language that should appear on the death certificates.
It is recognized in the literature that immigrants generally have lower mortality rates than the local population. This is known as the healthy migrant effect.24,25
However, Canadian studies show that the healthy immigrant effect wears off quite quickly and that after 20 years, immigrant mortality rates are similar to those of the nonimmigrant population.
The impact of this effect is greater for Québec anglophones because of their smaller population and because many immigrants adopted English as their language of use in the past. The healthy migrant effect could be an important methodological limit that gives the impression that anglophone mortality rates are lower than they really are.
26
1.9 CALCULATING AVOIDABLE MORTALITY
Therefore we can assume that the greater proportion of immigrants in the anglophone population does not skew our mortality analyses.
Our analysis is essentially based on the relationship between the number of deaths in a given linguistic group and the proportion of the total population who speak that language. In the first case, the data comes from death certificates filled out by a third party and in the second case the data comes from the census.
23 The census long form does not include people in institutions such as long-term care hospitals (CHSLD); these
establishments are particularly important in mortality analyses. 24 Hyman, I. “ Setting the Stage: Reviewing Current Knowledge on the Health of Canadian Immigrants. Canadian
Journal of Public Health. May-June 2004, Volume 95, No 3. 25 Singh, G.K., and Miller, B.A. “Health, Life Expectancy, and Mortality Patterns Among Immigrant Populations in
the United States.” Canadian Journal of Public Health. May-June 2004, Vol. 95, no 3. 26 Ng, E. and the LHAD research team. Le point sur l’effet de l’immigrant en santé: mortalité selon la période
d’immigration et le lieu de naissance. Statistics Canada, September 2011.

Avoidable Mortality of the Two Main Linguistic Communities in Québec
8 Institut national de santé publique du Québec
Our study uses estimates of adjusted avoidable mortality rates by language, gender, geographical area, and the four study periods. To take age structure into account, we calculated the adjusted rates using the direct standardization method.
The crude age-specific rates for age groups 0-4, 5-14, 15-24, 25-44, 45-64, and 65-74 were calculated first. Using the same age groups, we then applied these crude age-specific rates to our reference population (Québec’s total population in 2006) (both genders combined) in order to estimate anticipated deaths. Adjusted rates were subsequently obtained by dividing the total number of anticipated deaths by the reference population.27,28
We calculated the total adjusted avoidable mortality rates—i.e., for all causes combined, and for each of the three intervention categories (primary, secondary, and tertiary)—according to the weight attributed to each intervention category for each cause of death.
29
To estimate the statistical precision of the adjusted rates, a coefficient of variation (CV)
The rates were calculated for each linguistic group, gender, geographic area, and period. We used the same method to calculate the adjusted rates for the 62 causes taken individually.
30
To test whether differences in avoidable mortality between francophones and anglophones were significant, we performed Z-tests on the log-transformed rates.
was calculated. In keeping with the methodology set out in the Portrait de santé du Québec et de ses régions (2011), estimates with CVs lower or equal to 16.66% can be used without restriction. Estimates with CVs between 16.66% and 33.33% should be interpreted with caution.
31,32,33
The analyses were performed with Microsoft Excel and SAS 9.1 software from the SAS Institute Inc., Cary, NC.
If the P values were greater than 0.05, we considered there to be no significant difference between the two linguistic groups.
27 Ministère de la Santé et des Services sociaux. Pour guider l’action - Portrait de santé du Québec et ses
régions, 2011. 28 Infocentre de santé publique du Québec. Cadre méthodologique des indicateurs du Plan commun de
surveillance, June 2011. 29 For example, 50% of deaths due to ischemic heart disease were associated with primary prevention, 25% with
secondary prevention, and 25% with tertiary prevention. 30 Even thought the data was combined in multi-year groups, the small number of deaths, especially for the
anglophone minority, means that estimates can be highly variable. Calculating coefficients of variation makes it possible to measure the level of precision and reject estimates that are too imprecise.
31 Op. cit., Pour guider l’action, Portrait de santé du Québec et de ses régions 2011. 32 Op. cit., Cadre méthodologique des indicateurs du plan de surveillance. 33 Carriere K.C. and Roos, L.L. “Comparing Standardized Rates of Events.” Am J Epidemiol 1994, 140: 472−82.

Avoidable Mortality of the Two Main Linguistic Communities in Québec
Institut national de santé publique du Québec 9
2 AVOIDABLE MORTALITY IN ANGLOPHONE AND FRANCOPHONE MEN IN QUÉBEC FOR THE PERIOD 1990 TO 2007
2.1 SITUATION FOR QUÉBEC AS A WHOLE
2.1.1 Avoidable mortality in general and by prevention type
Table 2 shows that for Québec as a whole, general avoidable mortality rates34
The two linguistic groups followed the worldwide trend of decreasing general mortality, but the reduction occurred more quickly in francophones.
and avoidable mortality rates for the three prevention types decreased from 1990 to 2007 in both anglophone and francophone men, but did so more rapidly in the latter group. General avoidable mortality rates decreased 38.2% for francophones and 28.9% for anglophones. Despite the more rapid decrease among francophones, the rate for anglophone men was still significantly lower at 234 per 100,000 in 2005−2007 than that of francophones, at 302 per 100,000.
Table 2 Standardized rates of avoidable mortality (general and by prevention type) in men by mother tongue† and period†† in Québec as a whole (adjusted rates per 100,000 inhabitants)
Linguistic
Group T1
1990−94 T2
1995−99 T3
2000−04 T4
2005−07
Decrease over time
T4 vs. T1 P value
General avoidable mortality
Francophone 489 424 344 302 –38.2% S
Anglophone 329 302 264 234 –28.9% S
Through primary prevention
Francophone 298 258 209 185 –37.8% S
Anglophone 192 177 151 135 –29.7% S
Through secondary prevention
Francophone 98 86 70 60 –38.6% S
Anglophone 70 65 58 51 –27.3% S
Through tertiary prevention
Francophone 94 80 64 57 –38.9% S
Anglophone 66 60 54 48 –27.8% S † A Z-test on the log-transformed rates was performed to compare francophone and anglophone rates for each period. In this
table, all differences between francophones and anglophones are statistically significant. †† A Z-test on the log-transformed rates was performed separately for francophones and anglophones to compare the rates in
the first period (T1) to those in the last period (T4). In this table, all decreases over time are statistically significant.
34 General avoidable mortality refers to all avoidable deaths regardless of prevention type.

Avoidable Mortality of the Two Main Linguistic Communities in Québec
10 Institut national de santé publique du Québec
The following figures enable the reader to visualize part of the data in the above table more easily. The lines in the figures are linear trendlines; they appear in all the figures in this document.35
To simplify the figures, T1 indicates 1990–1994, T2 indicates 1995–1999, and so on.
Genera l Avoidab le Morta lity Prim ary P reven tion Avoid ab le Morta lity
Decrease T4 vs. T1:
Francophones –38.3% (S) Anglophones –28.9% (S)
Decrease T4 vs. T1: Francophones –37.8% (S) Anglophones –29.7% (S)
Secondary Prevention Avoidable Mortality Tertiary Prevention Avoidable Mortality
Decrease T4 vs. T1:
Francophones –38.6% (S) Anglophones –27.3% (S)
Decrease T4 vs. T1: Francophones –38.9% (S) Anglophones –27.8% (S)
Figure 2 General, primary, secondary, and tertiary avoidable mortality rates in francophone and anglophone men in Québec (adjusted rates per 100,000 inhabitants)
35 A linear trendline is a best-fit straight line that is used with simple linear data sets. Data is linear if the pattern in
its data points resembles a line. A linear trendline usually shows that something is increasing or decreasing at a steady rate. Source: Microsoft Office.
489 424
344 303 329 302
264 234
0
100
200
300
400
500
600
T1 T2 T3 T4
Francophones Anglophones
298 258
209 185 192 177 151 135
0
100
200
300
400
500
600
T1 T2 T3 T4
Francophones Anglophones
98 86 70
60 70
65 58 51
0
50
100
150
T1 T2 T3 T4
Francophones Anglophones
94 80
64 57 66 60 54
48
0
50
100
150
T1 T2 T3 T4
Francophones Anglophones

Avoidable Mortality of the Two Main Linguistic Communities in Québec
Institut national de santé publique du Québec 11
Whether we consider the decrease in general avoidable mortality or the decreases closely associated with one of the three prevention types, the picture is the same: a clear decrease in francophone men but rates that remain significantly higher than in anglophones.
2.1.2 Major causes of avoidable deaths
To guide the analysis of specific causes, Table 3 presents causes accounting for more than 1,000 avoidable deaths from 2005 to 2007.
Table 3 The eight major causes of avoidable deaths in Québec men from 2005 to 2007
MEN
Total number of avoidable
deaths % Primary
prevention % Secondary prevention % Tertiary
prevention %
Ischemic heart disease 6,075 20.6 3,038 16.9 1,519 25.7 1,519 26.9
Lung cancer 6,044 20.5 5,742 32.0 0 0.0 302 5.3
Suicide and intentional injuries 2,769 9.4 1,661 9.3 831 14.0 277 4.9
Colorectal cancer 1,959 6.6 784 4.4 980 16.6 196 3.5
Traffic accidents 1,289 4.4 773 4.3 0 0.0 516 9.1 Cerebrovascular disease 1,155 3.9 347 1.9 578 9.8 231 4.1
Chronic obstructive pulmonary disease 1,119 3.8 895 5.0 112 1.9 112 2.0
Diabetes 1,108 3.8 332 1.9 665 11.2 111 2.0
Other causes 8,011 27.1 4,386 24.4 1,233 20.8 2,389 42.3 Total for all avoidable causes 29,529 100 17,958 100 5,918 100 5,653 100
The main causes of avoidable deaths in Québec men for this period were ischemic heart disease (6,075 deaths) and lung cancer (6,044 deaths), with suicides (2,769 deaths) and colorectal cancer (1,959 deaths) following far behind. These four causes account for nearly 60% of avoidable deaths.
If we were to organize these causes according to the potential of primary, secondary, or tertiary interventions to prevent them, the order would change somewhat, but the dominant cause would still be ischemic heart disease. The other main causes are more closely associated with primary prevention (lung cancer and suicide) and secondary prevention (suicide and colorectal cancer). In the case of tertiary prevention
The following table shows how these causes of death are distributed between anglophones and francophones.
, ischemic heart disease dominates, but there other many other causes of associated avoidable deaths.

Avoidable Mortality of the Two Main Linguistic Communities in Québec
12 Institut national de santé publique du Québec
Table 4 Standardized rates of avoidable mortality due to certain specific causes in men by mother tongue† and period†† in Québec as a whole (adjusted rates per 100,000 inhabitants)
Avoidable mortality Linguistic group
T1 1990−94
T2 1995−99
T3 2000−04
T4 2005−07
T4 vs. T1 % P value
Ischemic diseases Francophone 146.3 116.3 79.9 61.9 –58 S
Anglophone 108.9 92.1 72.1 54.2 –50 S
Lung cancer Francophone 96.6 84.5 72.0 64.1 –34 S
Anglophone 54.4 48.8 42.6 37.3 –31 S
Suicides and intentional injuries
Francophone 32.9 37.3 32.6 28.9 –12 S
Anglophone 13.2 15.6 13.3 13.5 +2 NS
Colorectal cancer Francophone 24.0 23.0 21.0 19.8 –18 S
Anglophone 17.0 16.2 15.7 19.4 +14 NS
Traffic accidents Francophone 19.7 15.3 12.8 13.6 –30 S
Anglophone 9.1* 6.4* 5.1 * 5.3* –42 NS
Cerebrovascular disease
Francophone 23.7 19.8 14.2 11.7 –51 S
Anglophone 15.8 17.8 13.6 10.7* –33 NS
COPD Francophone 26.3 21.2 15.5 12.3 –53 S
Anglophone 12.1 11.9 8.5* 6.4* –47 S
Diabetes Francophone 13.4 14.0 13.5 11.1 –17 S Anglophone 12.2 12.0 14.1 9.9* –19 NS
† A Z-test on the log-transformed rates was performed to compare francophone and anglophone rates for each period. Boxes where the differences between francophones and anglophones are not statistically significant are colored green.
†† A Z-test on the log-transformed rates was performed separately for francophones and anglophones to compare the rates in the first period (T1) to those in the last period (T4). (“S” indicates a statistically significant decrease and “NS”a non-significant decrease).
* Indicates a coefficient of variation higher than 16.66% and lower or equal to 33.33%. In these cases, the rate should be interpreted with caution.
The two leading causes in terms of number of deaths, and for which the decrease is largely due to primary prevention (lung cancer and ischemic heart disease), evolved similarly in both groups. There was a significant decrease in rates for both causes between 1990−1994 and 2005−2007, a decrease that was slightly more pronounced among francophones. Due to the converging rates, the difference between anglophone and francophone men with respect to mortality rates due to ischemic heart disease disappeared during the 2005−2007 period. The difference persisted for lung cancer, however.
Figure 3 clearly illustrates these variations.

Avoidable Mortality of the Two Main Linguistic Communities in Québec
Institut national de santé publique du Québec 13
Lung Cancer Ischemic Heart Diseases
Decrease T4 vs. T1 Francophones –33.7% (S) Anglophones –31.4% (S)
Decrease T4 vs. T1 Francophones –57.7% (S) Anglophones –50.2% (S)
Figure 3 Avoidable mortality rates due to lung cancer and ischemic heart disease in francophone and anglophone men in Québec (adjusted rates per 100,000 inhabitants)
The situation is similar for suicide, which is sensitive mainly to primary (60%) and secondary prevention (30%). There was a significant reduction in avoidable mortality due to suicide in francophones, while the rate for anglophones changed very little over the years. Nonetheless, the mortality rate in francophone men is still at least double that of anglophones. Québec has always had high suicide rates, and as we see here, the difference is particularly notably among francophones.
The situation is very similar for deaths due to traffic accidents, which decreased considerably for francophone men and decreased in a statistically nonsignificant way for in anglophones. The rates for francophone men are still more than double that of anglophones. Mortality due to traffic accidents could be reduced mainly through primary (60%) and tertiary (40%) prevention.
Figure 4 illustrates these variations.
146.3
116.3
79.9
61.9
108.9 92.1
72.1 54.2
0 20 40 60 80
100 120 140 160
T1 T2 T3 T4 Francophones Anglophones
96.6 84.5 72.0
64.1 54.4 48.8 42.6 37.3
0 20 40 60 80
100 120 140 160
T1 T2 T3 T4 Francophones Anglophones

Avoidable Mortality of the Two Main Linguistic Communities in Québec
14 Institut national de santé publique du Québec
Suicide and Intentional Injuries Traffic Accidents
Decrease T4 vs. T1: Francophones –12.0% (S) Anglophones +2.0% (NS)
Decrease T4 vs. T1: Francophones –30.0% (S) Anglophones –42.0% (NS)
Figure 4 Avoidable mortality rates due to suicide, intentional injuries, and traffic accidents in francophone and anglophone men in Québec (adjusted rates per 100,000 inhabitants)
Deaths due to chronic obstructive pulmonary disease, which is mainly associated with primary prevention, are also of interest, particularly because of their association with smoking. There was a significant and relatively similar decrease in mortality rates for both linguistic groups between 1990 and 2007: –53.4% in francophones and –47.2% in anglophones. However, the rate for francophones was double that of anglophones, throughout the four study periods (Figure 5).
Chronic Obstructive Pulmonary Diseases
Decrease T4 vs. T1
Francophones –53.4% (S) Anglophones –47.2% (S)
Figure 5 Avoidable mortality rates due to chronic obstructive pulmonary disease in francophone and anglophone men in Québec (adjusted rates per 100,000 inhabitants)
32.9 37.3 32.6
28.9
13.2 15.6 13.3 13.5
0 5
10 15 20 25 30 35 40
T1 T2 T3 T4 Francophones Anglophones
19.7 15.3 12.8 13.6
9.1 6.4 5.1 5.3
0 5
10 15 20 25 30 35 40
T1 T2 T3 T4 Francophones Anglophones
26.3
21.2
15.5
12.3 12.1 11.9 8.5
6.4
0
5
10
15
20
25
30
T1 T2 T3 T4 Francophones Anglophones
Avoidable Mortality of the Two Main Linguistic Communities in Québec
Institut national de santé publique du Québec 15
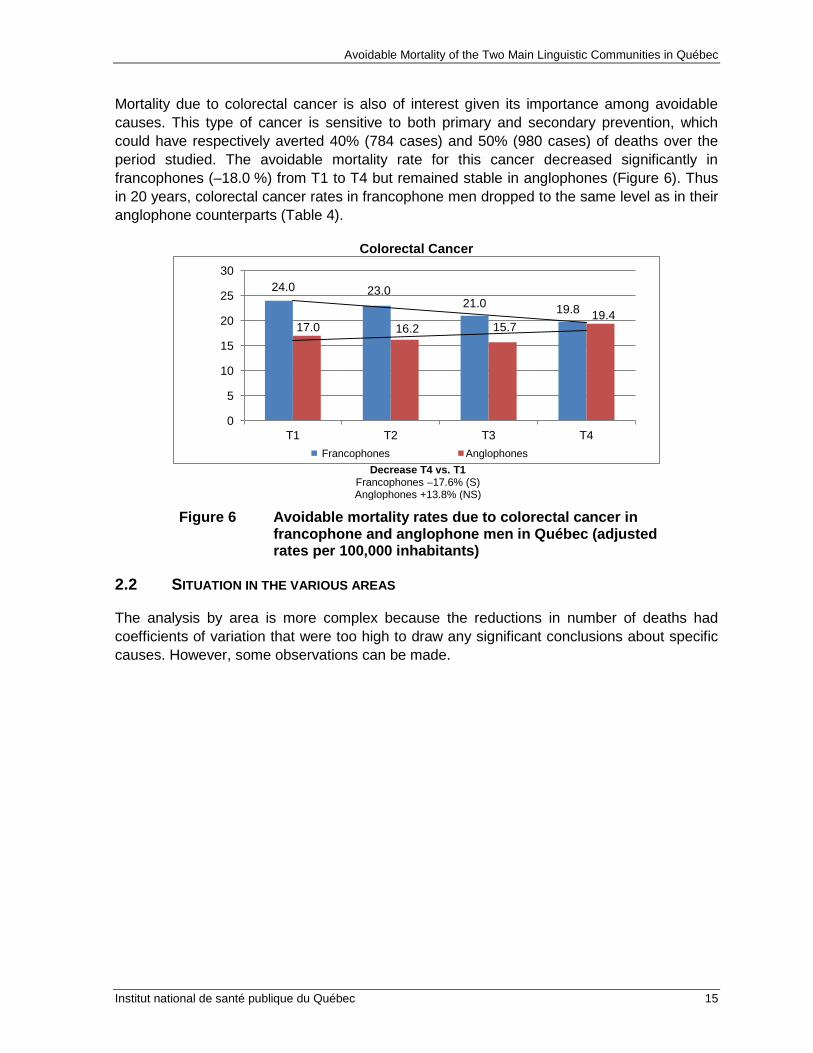
Mortality due to colorectal cancer is also of interest given its importance among avoidable causes. This type of cancer is sensitive to both primary and secondary prevention, which could have respectively averted 40% (784 cases) and 50% (980 cases) of deaths over the period studied. The avoidable mortality rate for this cancer decreased significantly in francophones (–18.0 %) from T1 to T4 but remained stable in anglophones (Figure 6). Thus in 20 years, colorectal cancer rates in francophone men dropped to the same level as in their anglophone counterparts (Table 4).
Colorectal Cancer
Decrease T4 vs. T1
Francophones –17.6% (S) Anglophones +13.8% (NS)
Figure 6 Avoidable mortality rates due to colorectal cancer in francophone and anglophone men in Québec (adjusted rates per 100,000 inhabitants)
2.2 SITUATION IN THE VARIOUS AREAS
The analysis by area is more complex because the reductions in number of deaths had coefficients of variation that were too high to draw any significant conclusions about specific causes. However, some observations can be made.
24.0 23.0 21.0 19.8
17.0 16.2 15.7 19.4
0
5
10
15
20
25
30
T1 T2 T3 T4 Francophones Anglophones

Avoidable Mortality of the Two Main Linguistic Communities in Québec
16 Institut national de santé publique du Québec
Table 5 Standardized rates of avoidable mortality (general and by prevention type) in MEN by area, mother tongue† and period†† (adjusted rates per 100,000 inhabitants)
† A Z-test on the log-transformed rates was performed to compare francophone and anglophone rates for each period. Boxes where the differences between francophones and anglophones are not statistically significant are colored green.
†† A Z-test on the log-transformed rates was performed separately for francophones and anglophones to compare the rates in the first period (T1) to those in the last period (T4). (“S” indicates a statistically significant decrease and “NS”a non-significant decrease).
* Indicates a coefficient of variation higher than 16.66% and lower or equal to 33.33%. In these cases, the rate should be interpreted with caution.
The trends observed for Québec as a whole were also found in the Montréal CMA. General avoidable mortality and mortality sensitive to primary, secondary, and tertiary prevention decreased in both areas. The differences between T1 and T4 were all significant, but were also more pronounced in francophone men than in anglophones. However, avoidable mortality rates remain significantly lower in anglophones than in francophones.
Area Language T1 1990−94
T2 1995−99
T3 2000−04
T4 2005−07
T4 vs T1 %
P value
General MTL CMA French 519.6 441.7 350.8 310.3 –0.3 S English 326.6 300.2 266.1 238.6 –6.9 S Other
CMAs French 469.7 407.6 327.9 281.5 –0.1 S
English 284.6 267.9 207.7 139.0 –1.2 S Non-CMAs French 461.2 415.7 347.1 309.3 –32.9 S English 347.4 326.9 289.0 283.2 –18.5 NS Through primary prevention
MTL CMA French 317.9 269.0 212.6 189.2 –40.5 S
English 189.8 174.7 152.3 136.5 –28.1 S Other
CMAs French 285.2 249.2 199.7 171.8 –39.8 S
English 173.7 167.1 125.0 85.2 –51.0 S Non-CMAs French 279.1 252.3 211.6 190.1 –31.9 S English 207.0 193.1 163.9 167.3 –19.2 NS Through secondary prevention
Québec French 105.0 91.3 73.2 62.1 –40.8 S
English 70.6 65.8 59.0 53.6 –24.1 S Other
CMAs French 95.7 82.9 67.9 57.7 –39.7 S
English 56.8* 52.1* 41.9* 26.6* –53.1 S Non-CMAs French 90.6 83.0 69.2 59.8 –33.9 S English 70.9 67.6 65.3 55.2 –22.1 NS Through tertiary prevention
MTL CMA French 96.8 81.4 65.0 59.0 –39.0 S
English 66.1 59.7 54.9 48.5 –26.6 S Other
CMAs French 88.7 75.6 60.3 52.0 –41.4 S
English 54.0 48.8 40.8 27.2 –49.7 S Non-CMAs French 91.5 80.4 66.3 59.4 –35.1 S English 69.4 66.2 59.8 60.7 –12.6 NS

Avoidable Mortality of the Two Main Linguistic Communities in Québec
Institut national de santé publique du Québec 17
Similar decreases were observed in the other CMAs, but more so in anglophone men, so that the difference between the two linguistic groups was in fact accentuated. Mortality rates in francophones are still significantly higher than those of anglophones.
In non-CMAs, the decrease in general avoidable mortality and avoidable mortality attributable to the three prevention types is significant in francophone men. However, the small sample size for anglophones made it impossible to reach the required statistical threshold, even though the rates also seem to have decreased. It is interesting to note that the rates for francophones were all significantly higher than those for anglophones for the first two periods (T1 and T2), regardless of prevention type, but this difference disappeared for all prevention types in the last period (T4). The reduced rates in both francophone and anglophone men were not as pronounced in non-CMAs as in the two other areas.
The analysis by area also allows us to draw conclusions about several specific causes of avoidable mortality. Ischemic heart disease, the biggest cause of avoidable mortality, followed the same trends in the Montréal CMA and the other CMAs as it did in Québec as a whole, namely a significant decrease over time and higher rates for francophones than anglophones. However, no significant difference between anglophone and francophone men in non-CMAs was observed over the four study periods, and mortality rates were similar in the last two periods. Decreases in avoidable death rates from T1 to T4 were considerable and statistically significant for both francophone and anglophone men (–55.4% and –43.8% respectively).
The number of deaths due to lung cancer, the second greatest cause of avoidable mortality, was not high enough to draw conclusions, except in the Montréal CMA, where the decrease over time was significant for both linguistic groups, albeit a little less pronounced in francophone men. However, once again, the avoidable mortality rate for the latter group remained higher than in anglophone men. The situation was similar for chronic obstructive pulmonary diseases in that all rates dropped throughout Québec, but the decreases were significant only for francophones.

Avoidable Mortality of the Two Main Linguistic Communities in Québec
18 Institut national de santé publique du Québec
Table 6 Standardized rates of avoidable mortality due to certain specific causes in men by area, mother tongue†, and period†† (adjusted rates per 100,000 inhabitants)
Avoidable mortality Area Linguistic
group T1
1990−94 T2
1995−99 T3
2000−04 T4
2005−07 T1 vs
T4 P
value Ischemic heart
Montréal CMA Francophone 146.3† 116.3 79.9 61.9 –58.0 S††
Anglophone 108.9 92.1 72.1 54.2 –50.0 S
Other CMAs Francophone 142.7 110.6 74.3 56.4 –60.5 S
Anglophone 102.6 73.5 62.4 36.5 –64.4 S
Non-CMAs Francophone 135.5 109.7 75.7 60.5 –55.4 S
Anglophone 111.3 92.2 80.1 62.5* –43.8 S
Lung cancer Montréal CMA Francophone 100.0 86.9 71.9 65.0 –35.0 S
Anglophone 52.6 47.7 43.7 37.7 –28.2 S
Other CMAs Francophone 93.6 82.2 69.5 58.3 –37.7 S
Anglophone 52.0* 53.1* 37.8* 29.3** –43.6 NS
Non-CMAs Francophone 93.1 83.5 73.3 66.3 –28.8 S
Anglophone 62.0* 50.8* 39.2* 40.1* –35.2 NS
COPD Montréal CMA Francophone 25.4 20.7 15.0 12.3 –51.6 S
Anglophone 10.9* 11.3* 7.7* 6.2* –43.5 NS
Other CMAs Francophone 28.4 21.2 15.8 12.4 –56.2 S
Anglophone 15.3** 11.7** 8.2** 6.4** –58.5 NS
Non-CMAs Francophone 25.6 21.6 15.7 12.2 –52.5 S
Anglophone 15.8** 14.6** 12.7** 8.4** –46.7 NS Colorectal cancer
Montréal CMA Francophone 26.1 24.7 22.5 19.9 –23.7 S
Anglophone 16.9 16.7 16.8 20.7 +22.2 NS Other
CMAs Francophone 25.1 21.9 20.4 20.3 –19.2 NS
Anglophone 9.8** 16.6** 8.7** 9.9** +2.0 NS Non-
CMAs Francophone 21.6 21.8 20.0 19.5 –9.7 NS
Anglophone 19.5* 13.8** 15.2** 17.5* –9.9 NS † A Z-test on the log-transformed rates was performed to compare francophone and anglophone rates for each period. Boxes
where the differences between francophones and anglophones are not statistically significant are colored green. †† A Z-test on the log-transformed rates was performed separately for francophones and anglophones to compare the rates in
the first period (T1) to those in the last period (T4). (“S” indicates a statistically significant decrease and “NS”a non-significant decrease).
* Indicates a coefficient of variation higher than 16.66% and lower or equal to 33.33%. In these cases, the rate should be interpreted with caution.
Avoidable Mortality of the Two Main Linguistic Communities in Québec
Institut national de santé publique du Québec 19
3 AVOIDABLE MORTALITY AMONG ANGLOPHONE AND FRANCOPHONE WOMEN IN QUÉBEC FOR THE PERIOD 1990 TO 2007
3.1 SITUATION FOR QUÉBEC AS A WHOLE
3.1.1 Avoidable mortality in general and by prevention type
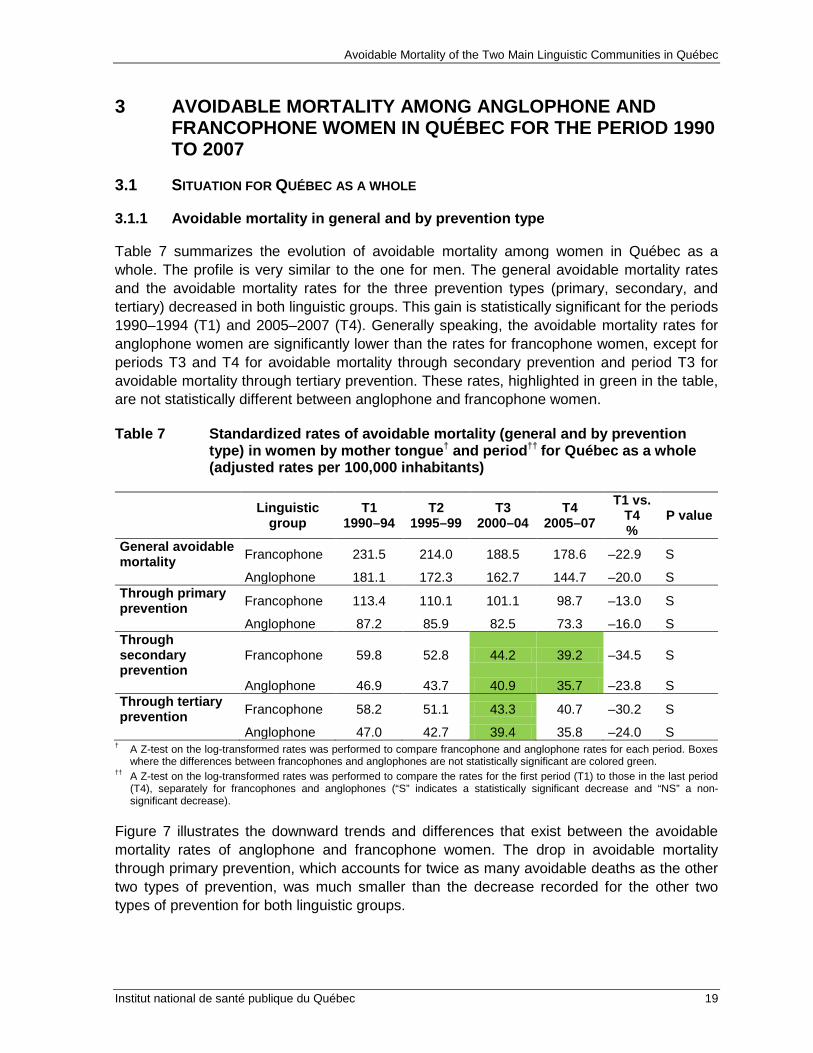
Table 7 summarizes the evolution of avoidable mortality among women in Québec as a whole. The profile is very similar to the one for men. The general avoidable mortality rates and the avoidable mortality rates for the three prevention types (primary, secondary, and tertiary) decreased in both linguistic groups. This gain is statistically significant for the periods 1990–1994 (T1) and 2005–2007 (T4). Generally speaking, the avoidable mortality rates for anglophone women are significantly lower than the rates for francophone women, except for periods T3 and T4 for avoidable mortality through secondary prevention and period T3 for avoidable mortality through tertiary prevention. These rates, highlighted in green in the table, are not statistically different between anglophone and francophone women.
Table 7 Standardized rates of avoidable mortality (general and by prevention type) in women by mother tongue† and period†† for Québec as a whole (adjusted rates per 100,000 inhabitants)
Linguistic group
T1 1990–94
T2 1995–99
T3 2000–04
T4 2005–07
T1 vs. T4 %
P value
General avoidable mortality Francophone 231.5 214.0 188.5 178.6 –22.9 S
Anglophone 181.1 172.3 162.7 144.7 –20.0 S Through primary prevention Francophone 113.4 110.1 101.1 98.7 –13.0 S
Anglophone 87.2 85.9 82.5 73.3 –16.0 S Through secondary prevention
Francophone 59.8 52.8 44.2 39.2 –34.5 S
Anglophone 46.9 43.7 40.9 35.7 –23.8 S Through tertiary prevention Francophone 58.2 51.1 43.3 40.7 –30.2 S
Anglophone 47.0 42.7 39.4 35.8 –24.0 S † A Z-test on the log-transformed rates was performed to compare francophone and anglophone rates for each period. Boxes
where the differences between francophones and anglophones are not statistically significant are colored green. †† A Z-test on the log-transformed rates was performed to compare the rates for the first period (T1) to those in the last period
(T4), separately for francophones and anglophones (“S” indicates a statistically significant decrease and “NS” a non-significant decrease).
Figure 7 illustrates the downward trends and differences that exist between the avoidable mortality rates of anglophone and francophone women. The drop in avoidable mortality through primary prevention, which accounts for twice as many avoidable deaths as the other two types of prevention, was much smaller than the decrease recorded for the other two types of prevention for both linguistic groups.

Avoidable Mortality of the Two Main Linguistic Communities in Québec
20 Institut national de santé publique du Québec
No reduction was observed in the gap between anglophone and francophone women for rates of avoidable mortality through primary prevention. However, the gap seems to be narrower for rates of avoidable mortality through secondary and tertiary prevention.
General Avoidable Mortality Primary Prevention Avoidable Mortality
Decrease T4 vs. T1:
Francophones –22.9% (S) Anglophones –20.0% (S
Decrease T4 vs. T1: Francophones –13.0% (S) Anglophones –16.0% (S)
Secondary Prevention Avoidable Mortality Tertiary Prevention Avoidable Mortality
Decrease T4 vs. T1:
Francophones –34.5% (S) Anglophones –23.8% (S)
Decrease T4 vs. T1: Francophones –30.2% (S) Anglophones –24.0% (S)
Figure 7 Avoidable mortality rates (general and through primary, secondary, and tertiary prevention) among francophone and anglophone women in Québec (adjusted rates per 100,000 inhabitants) Note: The scales in the figures are not all identical.
3.1.2 Major causes of avoidable mortality
To guide the analysis of specific causes, Table 3 presents causes accounting for more than 500 avoidable deaths from 2005 to 2007. We are using a threshold of 500 deaths among women instead of the threshold of 1,000 deaths among men because the number of avoidable deaths is much lower among women.
232 214
189 179 181 172 163 145
0
50
100
150
200
250
T1 1990-94
T2 1995-99
T3 2000-04
T4 2005-07
Francophone Anglophone
113 110 101 99
87 86 83 73
0
20
40
60
80
100
120
T1 1990-94
T2 1995-99
T3 2000-04
T5 2005-07
Francophone Anglophone
60 53 44 39
47 44 41 36
0
20
40
60
80
100
120
T1 1990-94
T2 1995-99
T3 2000-04
T5 2005-07
Francophone Anglophone
58 51 43 41 47
43 39 36
0
20
40
60
80
100
120
T1 1990-94
T2 1995-99
T3 2000-04
T5 2005-07
Francophone Anglophone

Avoidable Mortality of the Two Main Linguistic Communities in Québec
Institut national de santé publique du Québec 21
Table 8 The nine major causes of avoidable deaths among Québec women from 2005 to 2007
WOMEN
Total number
of avoidable
deaths
% Primary prevention % Secondary
prevention % Tertiary prevention %
Lung cancer 4,451 24.3 4,228 42.1 0 0.0 223 5.3
Breast cancer 2,309 12.6 346 3.5 808 19.8 1,155 27.4
Ischemic heart disease 2,115 11.5 1,058 10.5 529 12.9 529 12.5
Colorectal cancer 1,212 6.6 485 4.8 606 14.8 121 2.9 Chronic obstructive pulmonary disease 1,004 5.5 803 8.0 100 2.5 100 2.4
Cerebrovascular disease 878 4.8 263 2.6 439 10.7 176 4.2
Suicide and intentional injuries 823 4.5 494 4.9 247 6.0 82 2.0
Diabetes 590 3.2 177 1.8 354 8.7 59 1.4
Traffic accidents 499 2.7 299 3.0 0 0.0 200 4.7
Other causes 4,457 24.3 1,881 18.8 1,003 24.6 1,572 37.3 Total for all avoidable causes 18,338 100 10,034 100 4,086 100 4,217 100
The main causes of avoidable deaths among Québec women for this period were lung cancer (4,451 deaths), breast cancer (2,309 deaths), ischemic heart disease (2,115 deaths), and colorectal cancer (1,212 deaths), followed closely by chronic obstructive pulmonary disease (1,004 deaths). These five causes account for nearly 61% of avoidable deaths among women.
Lung cancer is the main cause that can be prevented through primary prevention, while breast cancer mortality rates are influenced more by secondary and tertiary prevention. As for deaths caused by ischemic heart disease, 50% could theoretically be prevented through primary prevention interventions, 25% through secondary prevention, and 25% through tertiary prevention.

Avoidable Mortality of the Two Main Linguistic Communities in Québec
22 Institut national de santé publique du Québec
Table 9 Standardized rates of avoidable mortality due to certain specific causes among women, by mother tongue† and period†† for Québec as a whole (adjusted rates per 100,000 inhabitants)
Avoidable mortality Linguistic group
T1 1990–94
T2 1995–99
T3 2000–04
T4 2005–07
T1 vs. T4 %
P value
Lung cancer Francophone 33.9 38.3 42.1 44.6 +31.5 S Anglophone 27.5 30.5 29.9 28.0 +2.1 NS
Breast cancer Francophone 31.5 27.0 24.4 22.1 –29.6 S
Anglophone 26.7 23.5 22.1 20.3 –24.0 NS
Ischemic diseases Francophone 50.3 39.7 25.7 20.1 –60.1 S Anglophone 36.8 29.9 24.7 19.5 –47.1 S
Colorectal cancer Francophone 15.8 14.5 12.5 11.4 –27.4 S Anglophone 12.1 11.7 11.6 12.0 –0.9 NS
COPD Francophone 10.1 10.9 10.4 10.1 –0.5 NS
Anglophone 6.3* 7.5* 8.1* 6.0* –4.6 NS Cerebrovascular disease Francophone 15.5 13.6 10.4 8.5 –45.0 S
Anglophone 11.5 11.7 8.9* 6.0* –47.4 S
Suicide Francophone 8.3 10.4 9.4 8.6 +15.5 NS Anglophone 3.6* 4.4* 5.0* 4.2* +3.4 NS
Diabetes Francophone 8.6 7.7 7.1 5.6 –35.3 S
Anglophone 6.9* 7.0* 8.1* 5.8* –16.1 NS
Traffic accidents Francophone 8.4 6.9 5.3 5.3 –36.4 S
Anglophone 3.9* 2.7* 2.4** 2.0** –51.4 NS † A Z-test on the log-transformed rates was performed to compare francophone and anglophone rates for each period. Boxes
where the differences between francophones and anglophones are not statistically significant are colored green. †† A Z-test on the log-transformed rates was performed to compare the rates in the first period (T1) to those in the last period
(T4), separately for francophones and anglophones (“S” indicates a statistically significant decrease and “NS” a non-significant decrease).
* Indicates a coefficient of variation higher than 16.66% and lower than or equal to 33.33%. In these cases, the rate value should be interpreted with caution.
The rate of avoidable mortality due to lung cancer showed a statistically significant increase among francophone women while remaining stable among anglophone women. This widened the gap between francophones and anglophones during the 18 year period studied. Starting with comparable rates during the first period of the study (1990–1994), we have since observed significantly higher rates among francophone women. The increase in smoking among women during the past 30 or 40 years is the most likely explanation.

Avoidable Mortality of the Two Main Linguistic Communities in Québec
Institut national de santé publique du Québec 23
It is difficult to find data on smoking in Québec for the 1960s, but according to various more recent population surveys, the rate among women varied between 32% and 38% from 1985 to 199436. Data for France indicates an increase in smoking among women, from 9% in 1952 to 21% in 199537. The 1995 “Survey on Smoking in Canada” reveals that 35% of francophone women smoked compared to 24% of anglophone women.38
Smoking is also a risk factor for developing ischemic heart disease.
39
It would therefore seem that secondary interventions (control of cholesterol and hypertension, medication) and tertiary interventions (angioplasty, bypass), which can prevent 50% of avoidable deaths due to ischemic disease, counteracted the adverse effects of smoking.
The rate of avoidable mortality attributable to this disease followed a similar pattern in both linguistic groups, i.e., significant decreases of 60% among francophone women and 47% among anglophone women. The sharper drop among francophone women closed the gap with anglophones during the last period (T4).
It should also be kept in mind that our study only considered deaths before the age of 75. The fact that lung cancer develops at an earlier age than ischemic heart disease is also a likely factor contributing to this trend difference.40
36 Aubin, J. and Caouette, L. “L’usage de la cigarette au Québec de 1985 à 1994 : une comparaison avec le
Canada.” Canadian Journal of Public Health 89, 1 (Jan.–Feb. 1998): 22–27. 37 Bulletin épidémiologique hebdomadaire. Institut de veille sanitaire, France. No. 21–22/2005. 38 “Survey on Smoking in Canada. Cycles 1 to 4, 1994–1995.” Health Canada Publications. 39 http://www.phac-aspc.gc.ca/cd-mc/cvd-mcv/risk-risques-eng.php. 40 Québec mortality rates for both sexes per 100,000 inhabitants for lung, tracheal, and bronchial cancer and for
ischemic heart disease from 2005 to 2008 were respectively 79 vs. 57 (age 45–64), 293 vs. 234 (age 65–74), and 424 vs. 1,077 (age 75 and over). Source: Pour guider l’action - Portrait de santé du Québec et de ses régions, INSPQ, 2011.
Avoidable Mortality of the Two Main Linguistic Communities in Québec
24 Institut national de santé publique du Québec
Lung Cancer Ischemic Heart Disease
Decrease T4 vs. T1:
Francophones +31.5% (S) Anglophones +2.1% (NS)
Decrease T4 vs. T1: Francophones –29.6% (S) Anglophones –24.0% (NS)
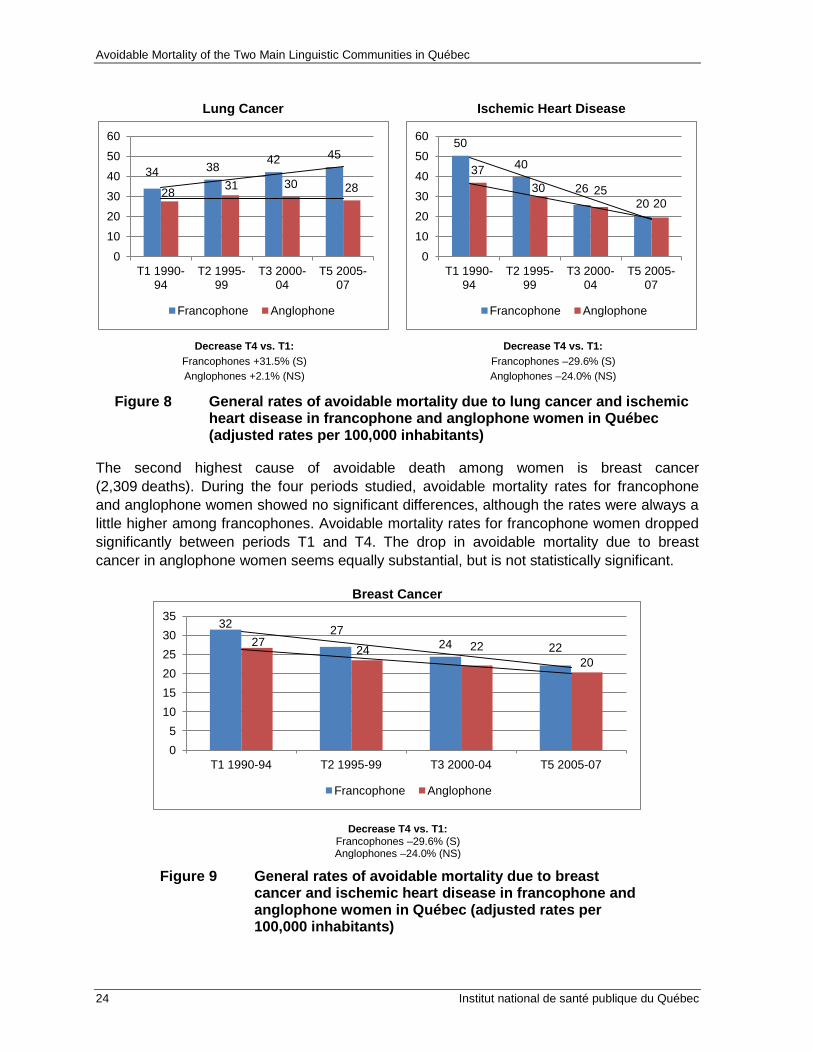
Figure 8 General rates of avoidable mortality due to lung cancer and ischemic heart disease in francophone and anglophone women in Québec (adjusted rates per 100,000 inhabitants)
The second highest cause of avoidable death among women is breast cancer (2,309 deaths). During the four periods studied, avoidable mortality rates for francophone and anglophone women showed no significant differences, although the rates were always a little higher among francophones. Avoidable mortality rates for francophone women dropped significantly between periods T1 and T4. The drop in avoidable mortality due to breast cancer in anglophone women seems equally substantial, but is not statistically significant.
Breast Cancer
Decrease T4 vs. T1:
Francophones –29.6% (S) Anglophones –24.0% (NS)
Figure 9 General rates of avoidable mortality due to breast cancer and ischemic heart disease in francophone and anglophone women in Québec (adjusted rates per 100,000 inhabitants)
34 38 42 45
28 31 30 28
0
10
20
30
40
50
60
T1 1990-94
T2 1995-99
T3 2000-04
T5 2005-07
Francophone Anglophone
50
40
26 20
37 30 25
20
0
10
20
30
40
50
60
T1 1990-94
T2 1995-99
T3 2000-04
T5 2005-07
Francophone Anglophone
32 27 24 22 27
24 22 20
0 5
10 15 20 25 30 35
T1 1990-94 T2 1995-99 T3 2000-04 T5 2005-07
Francophone Anglophone
Avoidable Mortality of the Two Main Linguistic Communities in Québec
Institut national de santé publique du Québec 25
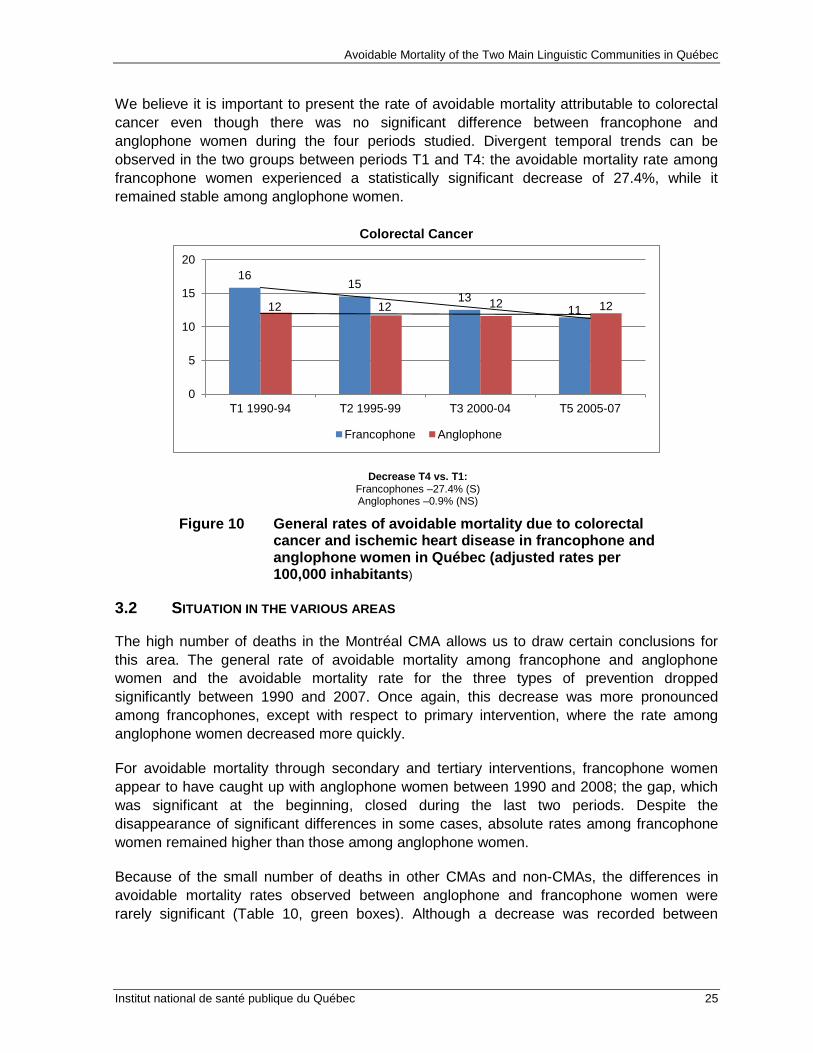
We believe it is important to present the rate of avoidable mortality attributable to colorectal cancer even though there was no significant difference between francophone and anglophone women during the four periods studied. Divergent temporal trends can be observed in the two groups between periods T1 and T4: the avoidable mortality rate among francophone women experienced a statistically significant decrease of 27.4%, while it remained stable among anglophone women.
Colorectal Cancer
Decrease T4 vs. T1: Francophones –27.4% (S) Anglophones –0.9% (NS)
Figure 10 General rates of avoidable mortality due to colorectal cancer and ischemic heart disease in francophone and anglophone women in Québec (adjusted rates per 100,000 inhabitants)
3.2 SITUATION IN THE VARIOUS AREAS
The high number of deaths in the Montréal CMA allows us to draw certain conclusions for this area. The general rate of avoidable mortality among francophone and anglophone women and the avoidable mortality rate for the three types of prevention dropped significantly between 1990 and 2007. Once again, this decrease was more pronounced among francophones, except with respect to primary intervention, where the rate among anglophone women decreased more quickly.
For avoidable mortality through secondary and tertiary interventions, francophone women appear to have caught up with anglophone women between 1990 and 2008; the gap, which was significant at the beginning, closed during the last two periods. Despite the disappearance of significant differences in some cases, absolute rates among francophone women remained higher than those among anglophone women.
Because of the small number of deaths in other CMAs and non-CMAs, the differences in avoidable mortality rates observed between anglophone and francophone women were rarely significant (Table 10, green boxes). Although a decrease was recorded between
16 15
13 11 12 12 12 12
0
5
10
15
20
T1 1990-94 T2 1995-99 T3 2000-04 T5 2005-07
Francophone Anglophone

Avoidable Mortality of the Two Main Linguistic Communities in Québec
26 Institut national de santé publique du Québec
periods T1 and T4 among both groups, it was only statistically significant for francophone women.
One thing is worth pointing out regarding the drop in avoidable mortality through primary intervention in non-CMAs. The decrease among francophones and the increase among anglophones were not significant, suggesting no real change between 1990 and 2007. When discussing primary prevention, smoking obviously comes to mind. We will come back to this in our conclusions.
In the other CMAs, however, avoidable mortality seems to have decreased more quickly among anglophone than francophone women. The differences between anglophones and francophones in T4 were nevertheless not significant, except for mortality that could be reduced through primary intervention. In such cases, the avoidable mortality rate was significantly higher among francophone women.

Avoidable Mortality of the Two Main Linguistic Communities in Québec
Institut national de santé publique du Québec 27
Table 10 Standardized rates of avoidable mortality (general and by prevention type) among women, by mother tongue† and period†† (adjusted rates per 100,000 inhabitants)
Area Language T1
1990–94 T2
1995–99 T3
2000–04 T4
2005–07 T1 vs.
T4 %
P value
General MTL CMA French 247.5 230.2 200.0 187.3 –24.3 S English 182.6 173.6 166.4 144.7 –20.7 S Other CMAs French 217.5 202.5 175.9 170.2 –21.8 S English 149.6* 128.2* 124.1* 108.9* –27.2 NS Non-CMAs French 216.6 203.2 184.7 175.5 –19.0 S English 178.9 188.1 168.8 166.6 –6.9 NS Through primary prevention
MTL CMA French 124.1 120.2 107.5 104.1 –16.1 S
English 88.6 84.3 83.6 71.3 –19.6 S Other CMAs French 104.3 103.7 94.1 93.4 –10.5 S English 69.6* 70.3* 68.6* 58.7* –15.7 NS Non-CMAs French 104.5 103.1 98.8 97.0 –7.3 NS English 83.4 102.4 86.5 93.1 +11.6 NS Through secondary prevention
MTL CMA French 63.1 56.4 47.1 41.3 –34.5 S
English 46.7 45.1 42.2 36.8 –21.2 S Other CMAs French 57.5 50.8 41.4 38.1 –33.7 S English 41.2* 31.5* 27.8* 25.3* –38.6 NS Non-CMAs French 56.2 50.1 42.9 37.8 –32.8 S English 48.5 41.9 42.2 36.1 –25.6 NS Through tertiary prevention
MTL CMA French 60.3 53.6 45.4 41.9 –30.5 S
English 47.4 44.2 40.6 36.7 –22.5 S Other CMAs French 55.7 48.0 40.4 38.7 –30.5 S English 38.8* 26.4* 27.8* 24.9* –35.8 NS Non-CMAs French 55.8 50.0 43.0 40.7 –27.1 S English 46.9 43.8 40.2 37.4 –20.3 NS
† A Z-test on the log-transformed rates was performed to compare francophone and anglophone rates for each period. Boxes where the differences between francophones and anglophones are not statistically significant are colored green.
†† A Z-test on the log-transformed rates was performed to compare the rates for the first period (T1) to those for the last period (T4), separately for francophones and anglophones (“S” indicates a significant statistical decrease and “NS” a non-significant decrease).
* Indicates a coefficient of variation higher than 16.66% and lower than or equal to 33.33%. In these cases, the rate value should be interpreted with caution.
Similarly, few significant differences were observed in terms of specific causes of avoidable mortality, aside from higher rates among francophone women in the Montréal CMA for lung cancer and, during periods T1 and T2 only, for ischemic heart disease.
Variations between 1990 and 2007 (T1 vs. T4) were not significant among anglophone women, with one exception (ischemic heart disease in the Montréal CMA). It is important to point out the significant increase in avoidable mortality rates for lung cancer among francophone women all across Québec. There also seems to be an increase among

Avoidable Mortality of the Two Main Linguistic Communities in Québec
28 Institut national de santé publique du Québec
anglophone women in other CMAs and in non-CMAs for the same cause, but these increases are not statistically significant.
Table 11 Standardized rates of avoidable mortality due to certain specific causes in women by area, mother tongue†, and period†† (adjusted rates per 100,000 inhabitants)
Avoidable mortality Area Linguistic
group T1
1990–94 T2
1995–99 T3
2000–04 T4
2005–07 T1 vs. T4 P value
Lung cancer Montréal CMA Francophone 39.2 44.8 45.7 48.7 +24 S Anglophone 28 29.8 30.8 25.9 –7.4 NS Other CMAs Francophone 31.6 34.9 40.1* 41.5** +31.6 S Anglophone 21.4** 22.9** 28.1** 25.7** +20.5 NS Non-CMAs Francophone 29 33.6 39.7 42.4 +46.2 S Anglophone 24.8* 37.3* 26.4* 39.8* +60.5 NS Breast cancer Montréal CMA Francophone 33.7 29.5 26.8 22.8 –32.3 S Anglophone 27.5 25.5 24.3 22.4 –18.3 NS Other CMAs Francophone 31.6 25.7 23.1 22.1 –30 S Anglophone 19.2** 7.4** 10.6** 10.0** –47.8 NS Non-CMAs Francophone 28.6 25.2 22.6 21.5 –24.9 S Anglophone 24.4* 21.5* 16.8** 14.8** –39.2 NS Ischemic disease Montréal CMA Francophone 56.1 46 29.6 22 –60.7 S
Anglophone 37.9 30.6 25.1 20.2 –46.7 S Other CMAs Francophone 45.2 35.1 21.2 18.4 –59.3 S Anglophone 28.4** 26.2** 23.5** 13.1** –53.8 NS Non-CMAs Francophone 45.9 35.6 24.5 19.1 –58.5 S Anglophone 33.4* 27.9* 24.2* 19.4* –41.9 NS Colorectal disease Montréal CMA Francophone 16 14.6 12.6 11.7 –26.7 S
Anglophone 12.1* 11.9* 11.8* 12.1* –0.3 NS Other CMAs Francophone 15.1 13.9 12.6 11.9 –21 NS Anglophone 12.9** 9.5** 8.7** 12.4** –4.4 NS Non-CMAs Francophone 15.6 14.7 12.5 10.9 –30.4 S Anglophone 10.5** 11.6** 11.8** 11.6** +10.7 NS
† A Z-test on the log-transformed rates was performed to compare francophone and anglophone rates for each period. Boxes where the differences between francophones and anglophones are not statistically significant are colored green.
†† A Z-test on the log-transformed rates was performed to compare the rates for the first period (T1) to those for the last period (T4), separately for francophones and anglophones (“S” indicates a significant statistical decrease and “NS” a non-significant decrease).
* Indicates a coefficient of variation higher than 16.66% and lower than or equal to 33.33%. In these cases, the rate value should be interpreted with caution.

Avoidable Mortality of the Two Main Linguistic Communities in Québec
Institut national de santé publique du Québec 29
4 THE MAIN FINDINGS ABOUT THE HEALTH STATUS OF QUÉBEC’S ANGLOPHONE MINORITY
The results obtained for avoidable mortality indicate that considerable progress has been made in recent years. There was a marked decrease in avoidable mortality among both anglophones and francophones. General avoidable mortality decreased by 38% among francophone men and 28% among anglophone men, and by 23% among francophone women and 20% among anglophone women. It appears that efforts in health promotion and disease and injury prevention, combined with progress in screening, diagnostic, and care methods, have been largely successful in the past 20 years.
A gap in avoidable mortality between the two linguistic communities is still perceptible. Although this gap remains favorable to anglophones, it has significantly narrowed since the early 1990s, primarily due to the sharper drop in mortality among francophones. This trend is not indicative of a step backward for anglophones, but rather of a step forward for francophones, who had significantly higher adjusted mortality rates than anglophones in the early 1990s. Among men, the rates of general avoidable mortality dropped from 489 to 303 per 100,000 among francophones and from 329 to 234 per 100,000 among anglophones. Among women, these rates fell from 231 to 179 per 100,000 among francophones and from 181 to 145 per 100,000 among anglophones.
The sometimes smaller death counts in the anglophone group did not always allow us to draw conclusions for specific causes. However, for anglophone men, we noticed a significant drop in avoidable mortality due to ischemic heart disease in Québec as a whole and in the three areas analyzed. The gains varied according to area, but were always significant (decreases between 44% and 64%). The situation was the same for lung cancer, with a significant decrease in Québec as a whole and in the Montréal CMA (a 28% decrease in the Montréal CMA and an insignificant downward trend in the other two areas). The profile for chronic obstructive pulmonary disease (COPD) was identical to that for lung cancer, with a significant decrease (48%) for Québec and the Montréal CMA.
In all these cases, the gains among anglophones were almost as great as those among francophones, and we can conclude that primary, secondary, and tertiary prevention measures implemented in the past 20 years have had a similar, significant impact among men in both linguistic groups.
We took a closer look at colorectal cancer because it was a leading avoidable cause of death. The mortality rate for this cause dropped significantly among francophones across Québec and in the Montréal CMA, while there was no significant change among anglophone men. For all anglophone men in Québec, the rate for T4 was higher than for T1 (19.4 vs. 17 per 100,000, which is not a significant difference), in contrast to francophones, among whom the decrease was more marked (–18%). Despite the lack of statistical significance among anglophones, we believe this differing trend warrants further examination.
For anglophone women, lung cancer was the most alarming cause of avoidable mortality. The rate of avoidable mortality attributable to this type of cancer appears to have remained stable for Québec as a whole, whereas it should have decreased, as it did in men, had the

Avoidable Mortality of the Two Main Linguistic Communities in Québec
30 Institut national de santé publique du Québec
public health measures implemented to reduce smoking enjoyed the same success. This relative stability is nevertheless positive if we compare it to the significant increase observed among francophone women across Québec (+32%) and the general trend in Canada, which shows an increase in the rate of death due to lung cancer among women, from 28 deaths per 100,000 in 1990 to 40 per 100,000 in 200741
There is little detailed data on smoking based on language, but the 2009–2010 “Canadian Community Health Survey” (CCHS) indicates that 14.8% of women in Montréal who spoke English at home were smokers versus 24.6% of women who spoke French.
. Despite the lack of significant differences between T1 and T4 among anglophone women in Québec (27.5 per 100,000 in T1 and 28 in T4), we nevertheless believe we have detected a difference in the trend for those living in the Montréal CMA and those living elsewhere in Québec.
The rates of avoidable mortality due to ischemic heart disease decreased significantly among anglophone women (–47%) and francophone women (–60%) in Québec as a whole and in the Montréal CMA (there was also a large but not significant drop elsewhere in Québec).
The rates for breast cancer also dropped in both linguistic groups, but not significantly among anglophone women (–30% and –25% respectively).
Lastly, as for observations made for men, avoidable mortality rates for colorectal cancer evolved differently among anglophone women compared to francophone women. The rate among francophones decreased significantly just about everywhere across Québec (between –21% and –30%), but did not change significantly among anglophones.
41 Canadian Cancer Society and National Cancer Institute of Canada. Canadian Cancer Statistics, 2007. Toronto,
Canada, April 2007, ISSN 0835-2976 AND National Cancer Institute of Canada, Canadian Cancer Statistics, 1990, Toronto, Canada, April 1990, ISSN 0835-2984. Note: All deaths are included here, rather than only those before age 75.

Avoidable Mortality of the Two Main Linguistic Communities in Québec
Institut national de santé publique du Québec 31
CONCLUSION
With all the parameters that were analyzed, it is impossible to draw a simple conclusion that would apply to the entire anglophone population of Québec. A more refined geographic analysis would have undoubtedly yielded a more detailed understanding of the problems specific to the anglophone minority, but low numbers make such an undertaking difficult.
The socioeconomic status of anglophones and francophones should be included among the parameters of any future analysis. Other work conducted as part of our project42
Some divergent findings between men and women raise a few questions. This is the case for example of the lung cancer for which mortality rates decreased markedly among men, but remained fairly stable among women. This difference certainly reflects different historical patterns between men and women smoking. But it concerns also the efforts of prevention in public health and in particular smoking cessation programs that might have paid dividends according to the kind.
suggests that part of the anglophone population is growing poorer, and points to a widening gap between rich and poor anglophones in Québec – a gap wider than the one among francophones. New analysis could further qualify some of our results.
Our analyses also revealed a marked decrease mortality from colorectal cancer among francophones (men and women) but non-Anglophones for whom rates remained fairly stable. It is important to point out that in 1990-1994 (period T1) the mortality rate of francophones were significantly higher than those of anglophones, while this gap is completely closed during the most recent period 2005-2007 (Q4). This undoubtedly reflects a catch-up of francophone for this cause of death. The question that lingers is whether the anglophone community could register a decrease in rates, although lighter, in this same period of time rather than the observed stagnation? That said, the rate of English-speaking women and men represent a difficult to cross, threshold already reached in their cases from the period T1?
Aside from these few characteristics, we can conclude that primary, secondary, and tertiary measures are producing the expected results among both anglophones and francophones and that the health status among both linguistic groups is improving. Québec’s francophone population has caught up considerably in 20 years with regard to avoidable mortality. The task now is to ensure that both linguistic communities continue to evolve in step with each other.
42 Lussier, M-H. La situation socioéconomique des anglophones du Québec. Institut national de santé publique
du Québec, December 2011.


APPENDIX 1
CLASSIFICATION OF PREVENTABLE CAUSES OF DEATH BY HUNTER NEW ENGLAND NSW HEALTH

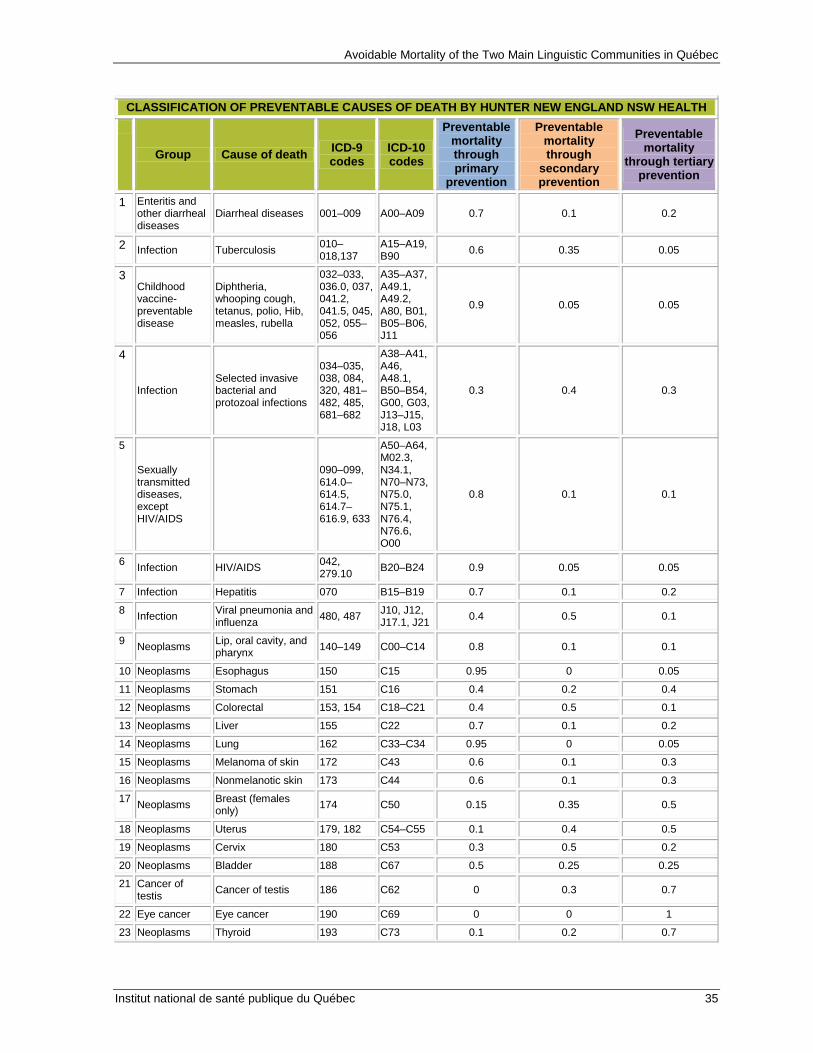
Avoidable Mortality of the Two Main Linguistic Communities in Québec
Institut national de santé publique du Québec 35
CLASSIFICATION OF PREVENTABLE CAUSES OF DEATH BY HUNTER NEW ENGLAND NSW HEALTH
Group Cause of death ICD-9 codes
ICD-10 codes
Preventable mortality through primary
prevention
Preventable mortality through
secondary prevention
Preventable mortality
through tertiary prevention
1 Enteritis and other diarrheal diseases
Diarrheal diseases 001–009 A00–A09 0.7 0.1 0.2
2 Infection Tuberculosis 010–018,137
A15–A19, B90 0.6 0.35 0.05
3 Childhood vaccine-preventable disease
Diphtheria, whooping cough, tetanus, polio, Hib, measles, rubella
032–033, 036.0, 037, 041.2, 041.5, 045, 052, 055–056
A35–A37, A49.1, A49.2, A80, B01, B05–B06, J11
0.9 0.05 0.05
4
Infection Selected invasive bacterial and protozoal infections
034–035, 038, 084, 320, 481–482, 485, 681–682
A38–A41, A46, A48.1, B50–B54, G00, G03, J13–J15, J18, L03
0.3 0.4 0.3
5
Sexually transmitted diseases, except HIV/AIDS
090–099, 614.0–614.5, 614.7–616.9, 633
A50–A64, M02.3, N34.1, N70–N73, N75.0, N75.1, N76.4, N76.6, O00
0.8 0.1 0.1
6 Infection HIV/AIDS 042, 279.10 B20–B24 0.9 0.05 0.05
7 Infection Hepatitis 070 B15–B19 0.7 0.1 0.2
8 Infection Viral pneumonia and influenza 480, 487 J10, J12,
J17.1, J21 0.4 0.5 0.1
9 Neoplasms Lip, oral cavity, and pharynx 140–149 C00–C14 0.8 0.1 0.1
10 Neoplasms Esophagus 150 C15 0.95 0 0.05
11 Neoplasms Stomach 151 C16 0.4 0.2 0.4
12 Neoplasms Colorectal 153, 154 C18–C21 0.4 0.5 0.1
13 Neoplasms Liver 155 C22 0.7 0.1 0.2
14 Neoplasms Lung 162 C33–C34 0.95 0 0.05
15 Neoplasms Melanoma of skin 172 C43 0.6 0.1 0.3
16 Neoplasms Nonmelanotic skin 173 C44 0.6 0.1 0.3
17 Neoplasms Breast (females only) 174 C50 0.15 0.35 0.5
18 Neoplasms Uterus 179, 182 C54–C55 0.1 0.4 0.5
19 Neoplasms Cervix 180 C53 0.3 0.5 0.2
20 Neoplasms Bladder 188 C67 0.5 0.25 0.25
21 Cancer of testis Cancer of testis 186 C62 0 0.3 0.7
22 Eye cancer Eye cancer 190 C69 0 0 1
23 Neoplasms Thyroid 193 C73 0.1 0.2 0.7

Avoidable Mortality of the Two Main Linguistic Communities in Québec
36 Institut national de santé publique du Québec
CLASSIFICATION OF PREVENTABLE CAUSES OF DEATH BY HUNTER NEW ENGLAND NSW HEALTH
Group Cause of death ICD-9 codes
ICD-10 codes
Preventable mortality through primary
prevention
Preventable mortality through
secondary prevention
Preventable mortality
through tertiary prevention
24 Neoplasms Hodgkin’s disease 201 C81 0 0.1 0.9
25 Neoplasms Leukemia (age < 44 only) 204–208 C91.0,
C91.1 0.05 0.05 0.9
26 Neoplasms Benign 210–229 D10–D36 0 0 1
27 Nutritional deficiency anemia
280–281 D50–D53 1 0 0
28 Nutritional, endocrine, and metabolic
Thyroid disorders 240–246 E00–E07 0.1 0.7 0.2
29 Nutritional, endocrine, and metabolic
Diabetes 250 E10–E14 0.3 0.6 0.1
30 Adrenal disorders * 255.0,
255.4 E24, E27
31 Newborn screening conditions
Congenital hypothyroidism, CAH, PKU, galatosemia
255.2, 270.1, 271.1
E25, E70.0, E74.2
0 0.8 0.2
32
Drug use disorders
Alcohol-related disease
291, 303, 305.0, 425.5, 535.3, 571.0–571.3
F10, I42.6, K29.2, K70
0.9 0 0.1
33 Drug use disorders
Illicit drug use disorders
292, 304, 305.2–305.9
F11–F16, F18–F19 0.9 0 0.1
34 Neurological disorders Epilepsy 345 G40–G41 0 0.9 0.1
35 Cardiovascular diseases
Rheumatic and other valvular heart disease
390–398 I01–I09 0.3 0.6 0.1
36 Cardiovascular diseases
Hypertensive heart disease 402 I11 0.3 0.65 0.05
37 Cardiovascular diseases
Ischemic heart disease 410–414 I20–I25 0.5 0.25 0.25
38 Cardiovascular diseases
Cerebrovascular diseases 430–438 I60–I69 0.3 0.5 0.2
39 Cardiovascular diseases Aortic aneurysm 441 I71 0.3 0.3 0.3
40 Genitourinary disorders
Nephritis and nephrosis
403, 580–589, 591
I12–I13, N00–N09, N17–N19
0.1 0.2 0.7
41 Genitourinary disorders
Obstructive uropathy and prostatic hyperplasia
592, 593.7, 594, 598, 599.6, 600
N13, N20–N21, N35, N40, N99.1
0.3 0.3 0.3
42 Respiratory diseases
DVT with pulmonary embolism
415.1, 451.1 I26, I80.2 0.3 0.3 0.3
43 Respiratory diseases COPD 490–492,
496 J40–J44 0.8 0.1 0.1

Avoidable Mortality of the Two Main Linguistic Communities in Québec
Institut national de santé publique du Québec 37
CLASSIFICATION OF PREVENTABLE CAUSES OF DEATH BY HUNTER NEW ENGLAND NSW HEALTH
Group Cause of death ICD-9 codes
ICD-10 codes
Preventable mortality through primary
prevention
Preventable mortality through
secondary prevention
Preventable mortality
through tertiary prevention
44 Respiratory diseases Asthma 493 J45–J46 0.1 0.7 0.2
45 Upper respiratory tract infection
382–383, 460–465
J00–J06, H66, H70 0.4 0.5 0.1
46 Digestive disorders Peptic ulcer disease 531–534 K25–K28 0.05 0.75 0.2
47
Digestive disorders
Acute abdomen, appendicitis, intestinal obstruction, cholecystitis/lithiasis, pancreatitis, hernia
540–543, 550–553, 574–577
K35–K38, K40–K46, K80–K83, K85–K86, K91.5
0 0 1
48 Digestive disorders
Chronic liver disease (excluding alcohol-related disease)
571.4–571.9 K73, K74 0.7 0.1 0.2
49 Osteomyelitis and other osteopathies of bone
Skin, bone, and joint infections 730 M86,
M89–M90 0.2 0.5 0.3
50 Maternal and infant Birth defect 237.70,
740–760
H31.1, P00, P04, Q00–Q99
0.1 0.2 0.7
51 Complication of pregnancy, labor, or the puerperium
Complications of pregnancy
630–632, 634–676 O01–O99 0.2 0.5 0.3
52 Maternal and infant
Complications of perinatal period 764–779 P03, P05–
P95 0.3 0.2 0.5
53 Sudden infant death syndrome
SIDS 798.0 R95 1 0 0
54 Unintentional injuries
Road traffic injuries, other transport injuries
E810–E819
V01–V04, V06, V09–V80, V87, V89, V99
0.6 0 0.4
55 Unintentional injuries
Accidental poisonings
E850–E869 X40–X49 0.6 0 0.4
56 Unintentional injuries Falls
E880–E886, E888
W00–W19 0.6 0 0.4
57 Unintentional injuries Fires, burns E890–
E899 X00–X09 0.8 0 0.2
58 Unintentional injuries
Drownings (swimming) E910 W65–W74 0.8 0 0.2
59 Intentional injuries
Suicide and self-inflicted injuries
E950–E959, E980–E989
X60–X84, Y87.0, Y10–Y34
0.6 0.3 0.1
60 Intentional injuries Violence E960–
E969 X85–Y09, Y87.1 1 0 0

Avoidable Mortality of the Two Main Linguistic Communities in Québec
38 Institut national de santé publique du Québec
CLASSIFICATION OF PREVENTABLE CAUSES OF DEATH BY HUNTER NEW ENGLAND NSW HEALTH
Group Cause of death ICD-9 codes
ICD-10 codes
Preventable mortality through primary
prevention
Preventable mortality through
secondary prevention
Preventable mortality
through tertiary prevention
61 War E990–E999 Y36 1 0 0
62 Iatrogenic conditions
Complications of treatment
E870 – E879 Y60–Y84 0 0.2 0.8
Hunter New England Population Health: Health in Hunter New England, ICD Codes – Potentially Avoidable Mortality. Hunter New England Area Health Service, 2007. Available at http://www2.hnehealth.nsw.gov.au/hneph/HHNE/toc/app_icd_avm.htm. Accessed July 22, 2013. “Adrenal disorders” (cause 30) was not included in our analyses given the small number of deaths.

APPENDIX 2
MORTALITY RATES FOR DETAILED CAUSES OF PREVENTABLE MORTALITY BY LANGUAGE AND GENDER IN QUÉBEC AS A WHOLE AND IN INDIVIDUAL AREAS, 1990–2007

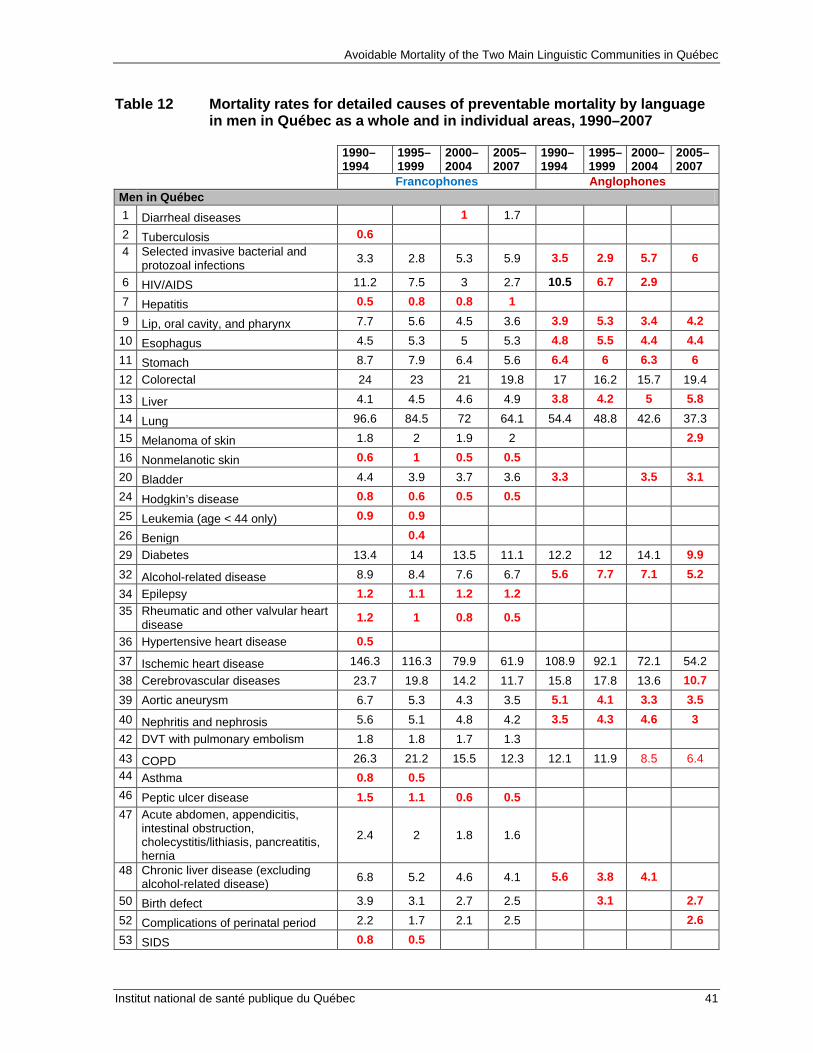
Avoidable Mortality of the Two Main Linguistic Communities in Québec
Institut national de santé publique du Québec 41
Table 12 Mortality rates for detailed causes of preventable mortality by language in men in Québec as a whole and in individual areas, 1990–2007
1990–1994
1995–1999
2000–2004
2005–2007
1990–1994
1995–1999
2000–2004
2005–2007
Francophones Anglophones Men in Québec 1 Diarrheal diseases 1 1.7 2 Tuberculosis 0.6 4 Selected invasive bacterial and
protozoal infections 3.3 2.8 5.3 5.9 3.5 2.9 5.7 6
6 HIV/AIDS 11.2 7.5 3 2.7 10.5 6.7 2.9 7 Hepatitis 0.5 0.8 0.8 1 9 Lip, oral cavity, and pharynx 7.7 5.6 4.5 3.6 3.9 5.3 3.4 4.2
10 Esophagus 4.5 5.3 5 5.3 4.8 5.5 4.4 4.4 11 Stomach 8.7 7.9 6.4 5.6 6.4 6 6.3 6 12 Colorectal 24 23 21 19.8 17 16.2 15.7 19.4 13 Liver 4.1 4.5 4.6 4.9 3.8 4.2 5 5.8 14 Lung 96.6 84.5 72 64.1 54.4 48.8 42.6 37.3 15 Melanoma of skin 1.8 2 1.9 2 2.9 16 Nonmelanotic skin 0.6 1 0.5 0.5 20 Bladder 4.4 3.9 3.7 3.6 3.3 3.5 3.1 24 Hodgkin’s disease 0.8 0.6 0.5 0.5 25 Leukemia (age < 44 only) 0.9 0.9 26 Benign 0.4 29 Diabetes 13.4 14 13.5 11.1 12.2 12 14.1 9.9 32 Alcohol-related disease 8.9 8.4 7.6 6.7 5.6 7.7 7.1 5.2 34 Epilepsy 1.2 1.1 1.2 1.2 35 Rheumatic and other valvular heart
disease 1.2 1 0.8 0.5
36 Hypertensive heart disease 0.5 37 Ischemic heart disease 146.3 116.3 79.9 61.9 108.9 92.1 72.1 54.2 38 Cerebrovascular diseases 23.7 19.8 14.2 11.7 15.8 17.8 13.6 10.7 39 Aortic aneurysm 6.7 5.3 4.3 3.5 5.1 4.1 3.3 3.5 40 Nephritis and nephrosis 5.6 5.1 4.8 4.2 3.5 4.3 4.6 3 42 DVT with pulmonary embolism 1.8 1.8 1.7 1.3 43 COPD 26.3 21.2 15.5 12.3 12.1 11.9 8.5 6.4 44 Asthma 0.8 0.5 46 Peptic ulcer disease 1.5 1.1 0.6 0.5 47 Acute abdomen, appendicitis,
intestinal obstruction, cholecystitis/lithiasis, pancreatitis, hernia
2.4 2 1.8 1.6
48 Chronic liver disease (excluding alcohol-related disease) 6.8 5.2 4.6 4.1 5.6 3.8 4.1
50 Birth defect 3.9 3.1 2.7 2.5 3.1 2.7 52 Complications of perinatal period 2.2 1.7 2.1 2.5 2.6 53 SIDS 0.8 0.5
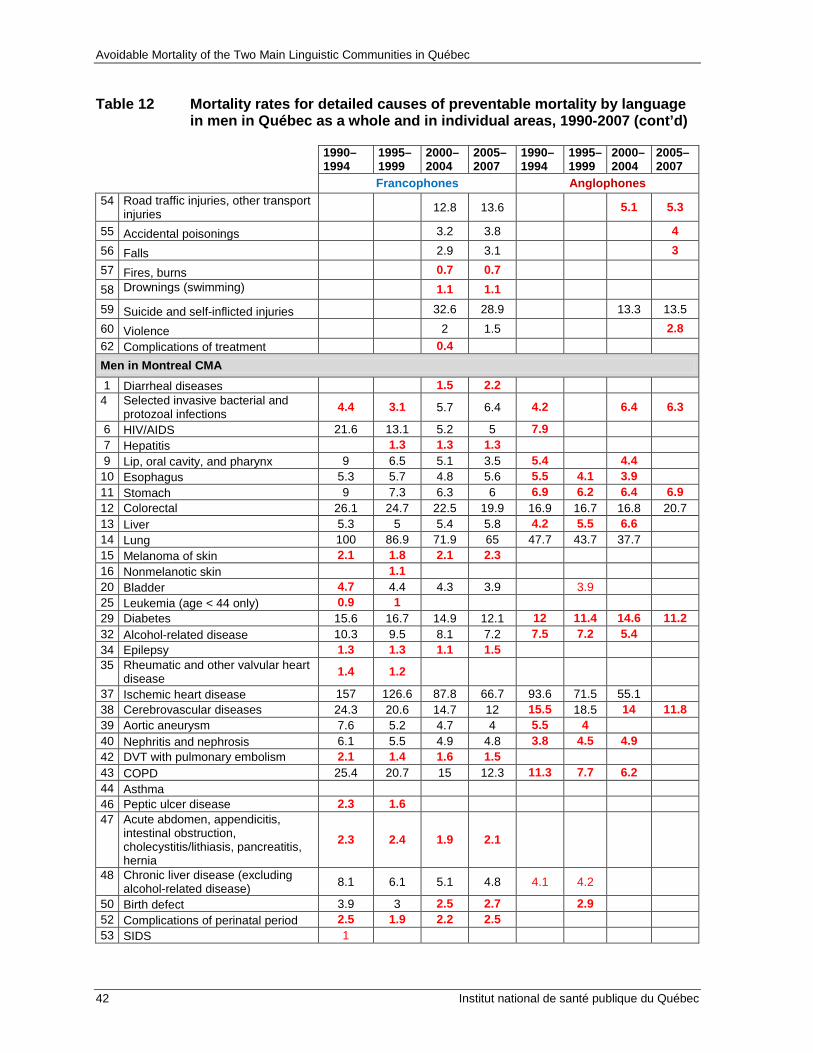
Avoidable Mortality of the Two Main Linguistic Communities in Québec
42 Institut national de santé publique du Québec
Table 12 Mortality rates for detailed causes of preventable mortality by language in men in Québec as a whole and in individual areas, 1990-2007 (cont’d)
1990–1994
1995–1999
2000–2004
2005–2007
1990–1994
1995–1999
2000–2004
2005–2007
Francophones Anglophones 54 Road traffic injuries, other transport
injuries 12.8 13.6 5.1 5.3
55 Accidental poisonings 3.2 3.8 4 56 Falls 2.9 3.1 3 57 Fires, burns 0.7 0.7 58 Drownings (swimming) 1.1 1.1 59 Suicide and self-inflicted injuries 32.6 28.9 13.3 13.5 60 Violence 2 1.5 2.8 62 Complications of treatment 0.4 Men in Montreal CMA 1 Diarrheal diseases 1.5 2.2
4 Selected invasive bacterial and protozoal infections 4.4 3.1 5.7 6.4 4.2 6.4 6.3
6 HIV/AIDS 21.6 13.1 5.2 5 7.9 7 Hepatitis 1.3 1.3 1.3 9 Lip, oral cavity, and pharynx 9 6.5 5.1 3.5 5.4 4.4 10 Esophagus 5.3 5.7 4.8 5.6 5.5 4.1 3.9 11 Stomach 9 7.3 6.3 6 6.9 6.2 6.4 6.9 12 Colorectal 26.1 24.7 22.5 19.9 16.9 16.7 16.8 20.7 13 Liver 5.3 5 5.4 5.8 4.2 5.5 6.6 14 Lung 100 86.9 71.9 65 47.7 43.7 37.7 15 Melanoma of skin 2.1 1.8 2.1 2.3 16 Nonmelanotic skin 1.1 20 Bladder 4.7 4.4 4.3 3.9 3.9 25 Leukemia (age < 44 only) 0.9 1 29 Diabetes 15.6 16.7 14.9 12.1 12 11.4 14.6 11.2 32 Alcohol-related disease 10.3 9.5 8.1 7.2 7.5 7.2 5.4 34 Epilepsy 1.3 1.3 1.1 1.5 35 Rheumatic and other valvular heart
disease 1.4 1.2
37 Ischemic heart disease 157 126.6 87.8 66.7 93.6 71.5 55.1 38 Cerebrovascular diseases 24.3 20.6 14.7 12 15.5 18.5 14 11.8 39 Aortic aneurysm 7.6 5.2 4.7 4 5.5 4 40 Nephritis and nephrosis 6.1 5.5 4.9 4.8 3.8 4.5 4.9 42 DVT with pulmonary embolism 2.1 1.4 1.6 1.5 43 COPD 25.4 20.7 15 12.3 11.3 7.7 6.2 44 Asthma 46 Peptic ulcer disease 2.3 1.6 47 Acute abdomen, appendicitis,
intestinal obstruction, cholecystitis/lithiasis, pancreatitis, hernia
2.3 2.4 1.9 2.1
48 Chronic liver disease (excluding alcohol-related disease) 8.1 6.1 5.1 4.8 4.1 4.2
50 Birth defect 3.9 3 2.5 2.7 2.9 52 Complications of perinatal period 2.5 1.9 2.2 2.5 53 SIDS 1

Avoidable Mortality of the Two Main Linguistic Communities in Québec
Institut national de santé publique du Québec 43
Table 12 Mortality rates for detailed causes of preventable mortality by language in men in Québec as a whole and in individual areas, 1990-2007 (cont’d)
1990–1994
1995–1999
2000–2004
2005–2007
1990–1994
1995–1999
2000–2004
2005–2007
Francophones Anglophones 54 Road traffic injuries, other transport
injuries 7.5 8.9 4 3.7
55 Accidental poisonings 3.7 4.3 4.2 56 Falls 2.9 3.2 58 Drownings (swimming) 0.9 59 Suicide and self-inflicted injuries 26.7 23.7 11.8 12.4 60 Violence 2.6 2.1 61 War Men in other CMAs 4 Selected invasive bacterial and
protozoal infections 2.5 2.9 4.7 5.3
6 HIV/AIDS 6.5 5.5 2.3 1.9 9 Lip, oral cavity, and pharynx 8.6 5.8 4.8 3 10 Esophagus 5 5.6 5.1 5.5 11 Stomach 7.9 6.9 5.4 4.9 12 Colorectal 25.1 21.9 20.4 20.3 13 Liver 3.9 5 4.6 5.5 14 Lung 93.6 82.2 69.5 58.3 53.1 37.8 15 Melanoma of skin 2.4 1.7 1.8 20 Bladder 4.9 4.1 3.2 3.1 29 Diabetes 13.5 13.8 13.3 10.8 32 Alcohol-related disease 8.7 9.5 8.1 7 37 Ischemic heart disease 142.7 110.6 74.3 56.4 73.5 62.4 36.5 38 Cerebrovascular diseases 23.1 19 13.6 11.3 39 Aortic aneurysm 6.9 5.6 4.8 3.2 40 Nephritis and nephrosis 5.8 4.6 5.6 3.8 42 DVT with pulmonary embolism 2.1 43 COPD 28.4 21.2 15.8 12.4 48 Chronic liver disease (excluding
alcohol-related disease) 7.1 5.4 4.9 3.7
50 Birth defect 3.7 2.5 2.7 2.1 52 Complications of perinatal period 2.3 2 2 2.6 53 SIDS 54 Road traffic injuries, other transport
injuries 9.6 9.7
55 Accidental poisonings 3.3 3.7 56 Falls 2.8 2.5 59 Suicide and self-inflicted injuries 32.7 29.5 Men in non-CMAs 1 Diarrheal diseases 1.4
4 Selected invasive bacterial and protozoal infections 2.8 2.4 5.2 5.8
6 HIV/AIDS 3.2 2.8 1.2 9 Lip, oral cavity, and pharynx 5.9 4.7 3.8 4 10 Esophagus 3.5 4.6 5.1 4.9 11 Stomach 8.7 8.9 7.2 5.7 12 Colorectal 21.6 21.8 20 19.5 19.5 17.5 13 Liver 3.1 3.8 3.8 3.7 14 Lung 93.1 83.5 73.3 66.3 50.8 39.2 40.1

Avoidable Mortality of the Two Main Linguistic Communities in Québec
44 Institut national de santé publique du Québec
Table 12 Mortality rates for detailed causes of preventable mortality by language in men in Québec as a whole and in individual areas, 1990-2007 (cont’d)
1990–1994
1995–1999
2000–2004
2005–2007
1990–1994
1995–1999
2000–2004
2005–2007
Francophones Anglophones 15 Melanoma of skin 1.5 2 1.7 1.8 20 Bladder 3.8 3.3 3.5 3.5 25 Leukemia (age < 44 only) 1 29 Diabetes 11.2 11.8 12.4 10.4 32 Alcohol-related disease 7.6 6.9 6.9 6.2 34 Epilepsy 1.1 1.2 1.2 1 35 Rheumatic and other valvular heart
disease 1.1 1
37 Ischemic heart disease 135.5 109.7 75.7 60.5 92.2 80.1 62.5 38 Cerebrovascular diseases 23 19.4 14.1 11.6 39 Aortic aneurysm 5.8 5.4 3.8 3.3 40 Nephritis and nephrosis 5.1 5 4.5 3.9 42 DVT with pulmonary embolism 1.5 2 1.8 1.2 43 COPD 25.6 21.6 15.7 12.2 46 Peptic ulcer disease 1.1 47 Acute abdomen, appendicitis,
intestinal obstruction, cholecystitis/lithiasis, pancreatitis, hernia
2.5 1.9 2 1.4
48 Chronic liver disease (excluding alcohol-related disease) 5.4 4.3 4 3.6
50 Birth defect 3.9 3.5 2.9 2.6 52 Complications of perinatal period 1.9 1.4 2.2 2.3 53 SIDS 0.6 54 Road traffic injuries, other transport
injuries 20.1 21.2
55 Accidental poisonings 2.6 3.5 56 Falls 3 3.3 57 Fires, burns 1 1 58 Drownings (swimming) 1.4 1.6 59 Suicide and self-inflicted injuries 38.7 34.5 25.1 27.2 60 Violence 1.8 1.5
Values with a coefficient of variation higher than 16.66% and lower than or equal to 33.33% are in red and should be interpreted with caution. Values with a coefficient of variation higher than 33.33% are not presented. Readers can refer to Appendix 1 for the list of ICD-9 and ICD-10 codes corresponding to the causes on the list. Source : Special compilations, INSPQ.
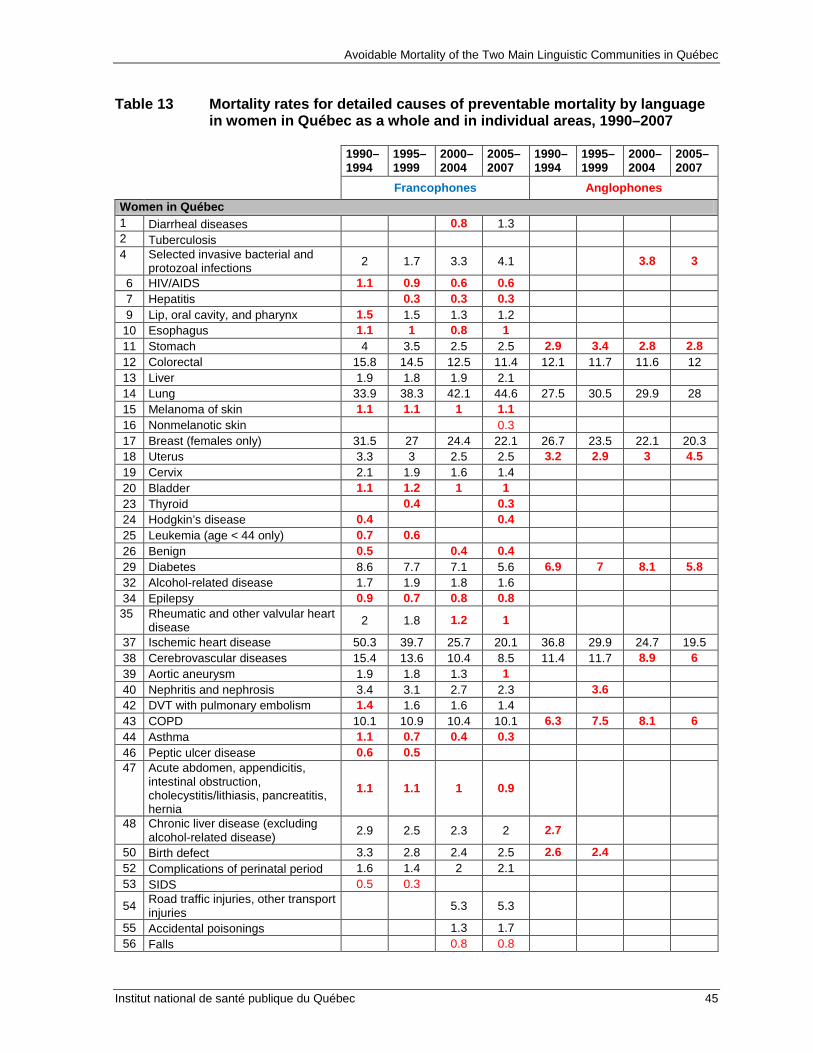
Avoidable Mortality of the Two Main Linguistic Communities in Québec
Institut national de santé publique du Québec 45
Table 13 Mortality rates for detailed causes of preventable mortality by language in women in Québec as a whole and in individual areas, 1990–2007
1990–1994
1995–1999
2000–2004
2005–2007
1990–1994
1995–1999
2000–2004
2005–2007
Francophones Anglophones Women in Québec 1 Diarrheal diseases 0.8 1.3 2 Tuberculosis 4 Selected invasive bacterial and
protozoal infections 2 1.7 3.3 4.1 3.8 3
6 HIV/AIDS 1.1 0.9 0.6 0.6 7 Hepatitis 0.3 0.3 0.3 9 Lip, oral cavity, and pharynx 1.5 1.5 1.3 1.2
10 Esophagus 1.1 1 0.8 1 11 Stomach 4 3.5 2.5 2.5 2.9 3.4 2.8 2.8 12 Colorectal 15.8 14.5 12.5 11.4 12.1 11.7 11.6 12 13 Liver 1.9 1.8 1.9 2.1 14 Lung 33.9 38.3 42.1 44.6 27.5 30.5 29.9 28 15 Melanoma of skin 1.1 1.1 1 1.1 16 Nonmelanotic skin 0.3 17 Breast (females only) 31.5 27 24.4 22.1 26.7 23.5 22.1 20.3 18 Uterus 3.3 3 2.5 2.5 3.2 2.9 3 4.5 19 Cervix 2.1 1.9 1.6 1.4 20 Bladder 1.1 1.2 1 1 23 Thyroid 0.4 0.3 24 Hodgkin’s disease 0.4 0.4 25 Leukemia (age < 44 only) 0.7 0.6 26 Benign 0.5 0.4 0.4 29 Diabetes 8.6 7.7 7.1 5.6 6.9 7 8.1 5.8 32 Alcohol-related disease 1.7 1.9 1.8 1.6 34 Epilepsy 0.9 0.7 0.8 0.8 35 Rheumatic and other valvular heart
disease 2 1.8 1.2 1
37 Ischemic heart disease 50.3 39.7 25.7 20.1 36.8 29.9 24.7 19.5 38 Cerebrovascular diseases 15.4 13.6 10.4 8.5 11.4 11.7 8.9 6 39 Aortic aneurysm 1.9 1.8 1.3 1 40 Nephritis and nephrosis 3.4 3.1 2.7 2.3 3.6 42 DVT with pulmonary embolism 1.4 1.6 1.6 1.4 43 COPD 10.1 10.9 10.4 10.1 6.3 7.5 8.1 6 44 Asthma 1.1 0.7 0.4 0.3 46 Peptic ulcer disease 0.6 0.5 47 Acute abdomen, appendicitis,
intestinal obstruction, cholecystitis/lithiasis, pancreatitis, hernia
1.1 1.1 1 0.9
48 Chronic liver disease (excluding alcohol-related disease) 2.9 2.5 2.3 2 2.7
50 Birth defect 3.3 2.8 2.4 2.5 2.6 2.4 52 Complications of perinatal period 1.6 1.4 2 2.1 53 SIDS 0.5 0.3
54 Road traffic injuries, other transport injuries 5.3 5.3
55 Accidental poisonings 1.3 1.7 56 Falls 0.8 0.8

Avoidable Mortality of the Two Main Linguistic Communities in Québec
46 Institut national de santé publique du Québec
Table 13 Mortality rates for detailed causes of preventable mortality by language in women in Québec as a whole and in individual areas, 1990–2007 cont’d)
1990–1994
1995–1999
2000–2004
2005–2007
1990–1994
1995–1999
2000–2004
2005–2007
Francophones Anglophones 57 Fires, burns 0.4 0.4 58 Drownings (swimming) 0.3 59 Suicide and self-inflicted injuries 9.4 8.6 5 4.1 60 Violence 0.9 0.7 62 Complications of treatment 0.4 Women in Montreal CMA 1 Diarrheal diseases 1.3 1.7
4 Selected invasive bacterial and protozoal infections 2.5 2 3.3 5 3.9
6 HIV/AIDS 2.1 1.6 1.1 0.8 7 Hepatitis 9 Lip, oral cavity, and pharynx 1.9 1.7 1.4 1.1
10 Esophagus 1.4 1.3 0.8 1.1 11 Stomach 3.4 3.1 2.4 2.3 3.6 12 Colorectal 16 14.6 12.6 11.7 12.1 11.9 11.8 12.1 13 Liver 2.3 1.9 2.3 2.1 14 Lung 39.2 44.8 45.7 48.7 28 29.8 30.8 25.9 15 Melanoma of skin 1.3 1.2 1 1.3 16 Nonmelanotic skin 17 Breast (females only) 33.7 29.5 26.8 22.8 27.5 25.5 24.3 22.4 18 Uterus 3.4 3.4 2.5 2.6 19 Cervix 2.5 1.7 1.7 1.1 20 Bladder 1.1 1.3 1.1 1 29 Diabetes 8.6 8.5 8.1 6.3 6.4 7.1 7.9 5.2 32 Alcohol-related disease 2.1 2 2.1 1.7 34 Epilepsy 0.9 0.8 0.9 35 Rheumatic and other valvular heart
disease 2.1 2 1.5 1.3
37 Ischemic heart disease 56.1 46 29.6 22 37.9 30.6 25.1 20.2 38 Cerebrovascular diseases 15.3 14.1 10.3 9.1 10.3 11.4 9.3 6.4 39 Aortic aneurysm 2 1.6 1.4 1.2 40 Nephritis and nephrosis 3.2 3.3 2.8 2.6 3.8 42 DVT with pulmonary embolism 1.5 1.6 1.7 1.7 43 COPD 10.5 12.1 10.7 10.7 6.7 6.7 7.6 5.2 44 Asthma 0.9 47 Acute abdomen, appendicitis,
intestinal obstruction, cholecystitis/lithiasis, pancreatitis, hernia
1.1 1.3 1.2 0.9
48 Chronic liver disease (excluding alcohol-related disease) 3.5 2.7 2.4 2
50 Birth defect 3.1 2.4 2.2 2.3 52 Complications of perinatal period 1.9 1.5 1.9 2.1 53 SIDS 54 Road traffic injuries, other transport
injuries 3 3.4
55 Accidental poisonings 1.5 1.8 56 Falls 0.9 0.8

Avoidable Mortality of the Two Main Linguistic Communities in Québec
Institut national de santé publique du Québec 47
Table 13 Mortality rates for detailed causes of preventable mortality by language in women in Québec as a whole and in individual areas, 1990–2007 cont’d)
1990–1994
1995–1999
2000–2004
2005–2007
1990–1994
1995–1999
2000–2004
2005–2007
Francophones Anglophones 58 Drownings (swimming) 59 Suicide and self-inflicted injuries 8.8 7.6 5 4 60 Violence 8.8 61 War 1 Women in other CMAs 4 Selected invasive bacterial and
protozoal infections 1.8 3.4 3.4
6 HIV/AIDS 9 Lip, oral cavity, and pharynx 1.4 10 Esophagus 11 Stomach 3.8 3.8 2.2 2.4 12 Colorectal 15.1 13.9 12.6 11.9 13 Liver 2 2.3 14 Lung 31.6 34.9 40.1 41.5 15 Melanoma of skin 17 Breast (females only) 31.6 25.7 23.1 22.1 18 Uterus 3.6 2.6 2.5 2.2 19 Cervix 2 1.8 1.6 1.7 20 Bladder 29 Diabetes 8.8 7.9 6.3 5.5 32 Alcohol-related disease 2.1 2 1.7 35 Rheumatic and other valvular heart
disease 1.8 2
37 Ischemic heart disease 45.2 35.1 21.2 18.4 38 Cerebrovascular diseases 15.8 13 9.5 7.5 39 Aortic aneurysm 1.7 1.9 40 Nephritis and nephrosis 3.7 3.3 2.5 2.4 42 DVT with pulmonary embolism 1.8 43 COPD 9.5 11.7 9.9 9.7 48 Chronic liver disease (excluding
alcohol-related disease) 2.9 2.4 2.3 2.3
50 Birth defect 3.6 2.7 2.4 2.6 52 Complications of perinatal period 1.5 1.3 2.5 2.2 53 SIDS 4.1 54 Road traffic injuries, other transport
injuries 3.5
55 Accidental poisonings 1.5 56 Falls 59 Suicide and self-inflicted injuries 9.6 9.2 Women in non-CMAs 1 Diarrheal diseases 1 4 Selected invasive bacterial and
protozoal infections 1.5 1.6 3.3 3.7
6 HIV/AIDS 9 Lip, oral cavity, and pharynx 1.3 1.3 1.2 1.1 10 Esophagus 0.8 11 Stomach 4.6 3.8 2.9 2.9 12 Colorectal 15.6 14.7 12.5 10.9
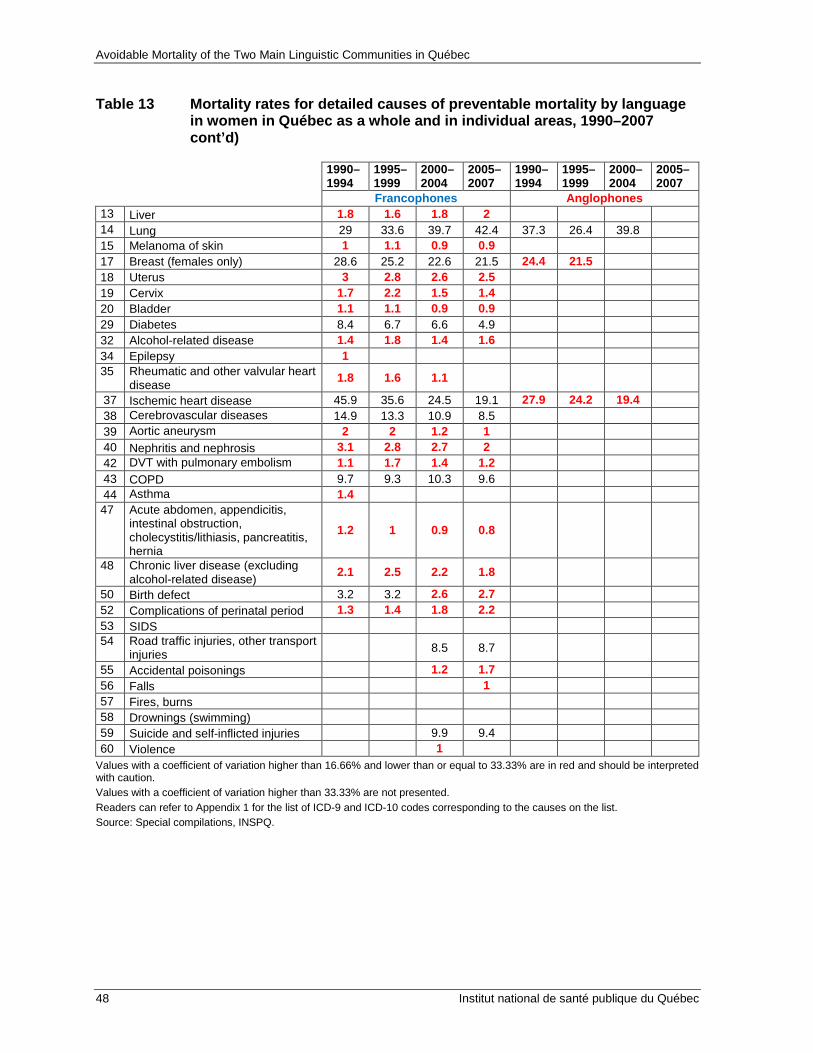
Avoidable Mortality of the Two Main Linguistic Communities in Québec
48 Institut national de santé publique du Québec
Table 13 Mortality rates for detailed causes of preventable mortality by language in women in Québec as a whole and in individual areas, 1990–2007 cont’d)
1990–1994
1995–1999
2000–2004
2005–2007
1990–1994
1995–1999
2000–2004
2005–2007
Francophones Anglophones 13 Liver 1.8 1.6 1.8 2 14 Lung 29 33.6 39.7 42.4 37.3 26.4 39.8 15 Melanoma of skin 1 1.1 0.9 0.9 17 Breast (females only) 28.6 25.2 22.6 21.5 24.4 21.5 18 Uterus 3 2.8 2.6 2.5 19 Cervix 1.7 2.2 1.5 1.4 20 Bladder 1.1 1.1 0.9 0.9 29 Diabetes 8.4 6.7 6.6 4.9 32 Alcohol-related disease 1.4 1.8 1.4 1.6 34 Epilepsy 1 35 Rheumatic and other valvular heart
disease 1.8 1.6 1.1
37 Ischemic heart disease 45.9 35.6 24.5 19.1 27.9 24.2 19.4 38 Cerebrovascular diseases 14.9 13.3 10.9 8.5 39 Aortic aneurysm 2 2 1.2 1 40 Nephritis and nephrosis 3.1 2.8 2.7 2 42 DVT with pulmonary embolism 1.1 1.7 1.4 1.2 43 COPD 9.7 9.3 10.3 9.6 44 Asthma 1.4 47 Acute abdomen, appendicitis,
intestinal obstruction, cholecystitis/lithiasis, pancreatitis, hernia
1.2 1 0.9 0.8
48 Chronic liver disease (excluding alcohol-related disease) 2.1 2.5 2.2 1.8
50 Birth defect 3.2 3.2 2.6 2.7 52 Complications of perinatal period 1.3 1.4 1.8 2.2 53 SIDS 54 Road traffic injuries, other transport
injuries 8.5 8.7
55 Accidental poisonings 1.2 1.7 56 Falls 1 57 Fires, burns 58 Drownings (swimming) 59 Suicide and self-inflicted injuries 9.9 9.4 60 Violence 1
Values with a coefficient of variation higher than 16.66% and lower than or equal to 33.33% are in red and should be interpreted with caution. Values with a coefficient of variation higher than 33.33% are not presented. Readers can refer to Appendix 1 for the list of ICD-9 and ICD-10 codes corresponding to the causes on the list. Source: Special compilations, INSPQ.


Publication N°: 1708

www.inspq.qc.ca
rEChErChEÉvALUATION
ET INNOvATION
INfOrmATION
COLLABOrATIONINTErNATIONALE
ExPErTISECONSEIL
LABOrATOIrESET DÉPISTAgE
fOrmATION